
Regional Scale Impact of the COVID-19 Lockdown on Air Quality: Gaseous Pollutants in the Po Valley, Northern Italy


Abstract
1. Introduction
2. Material and Methods
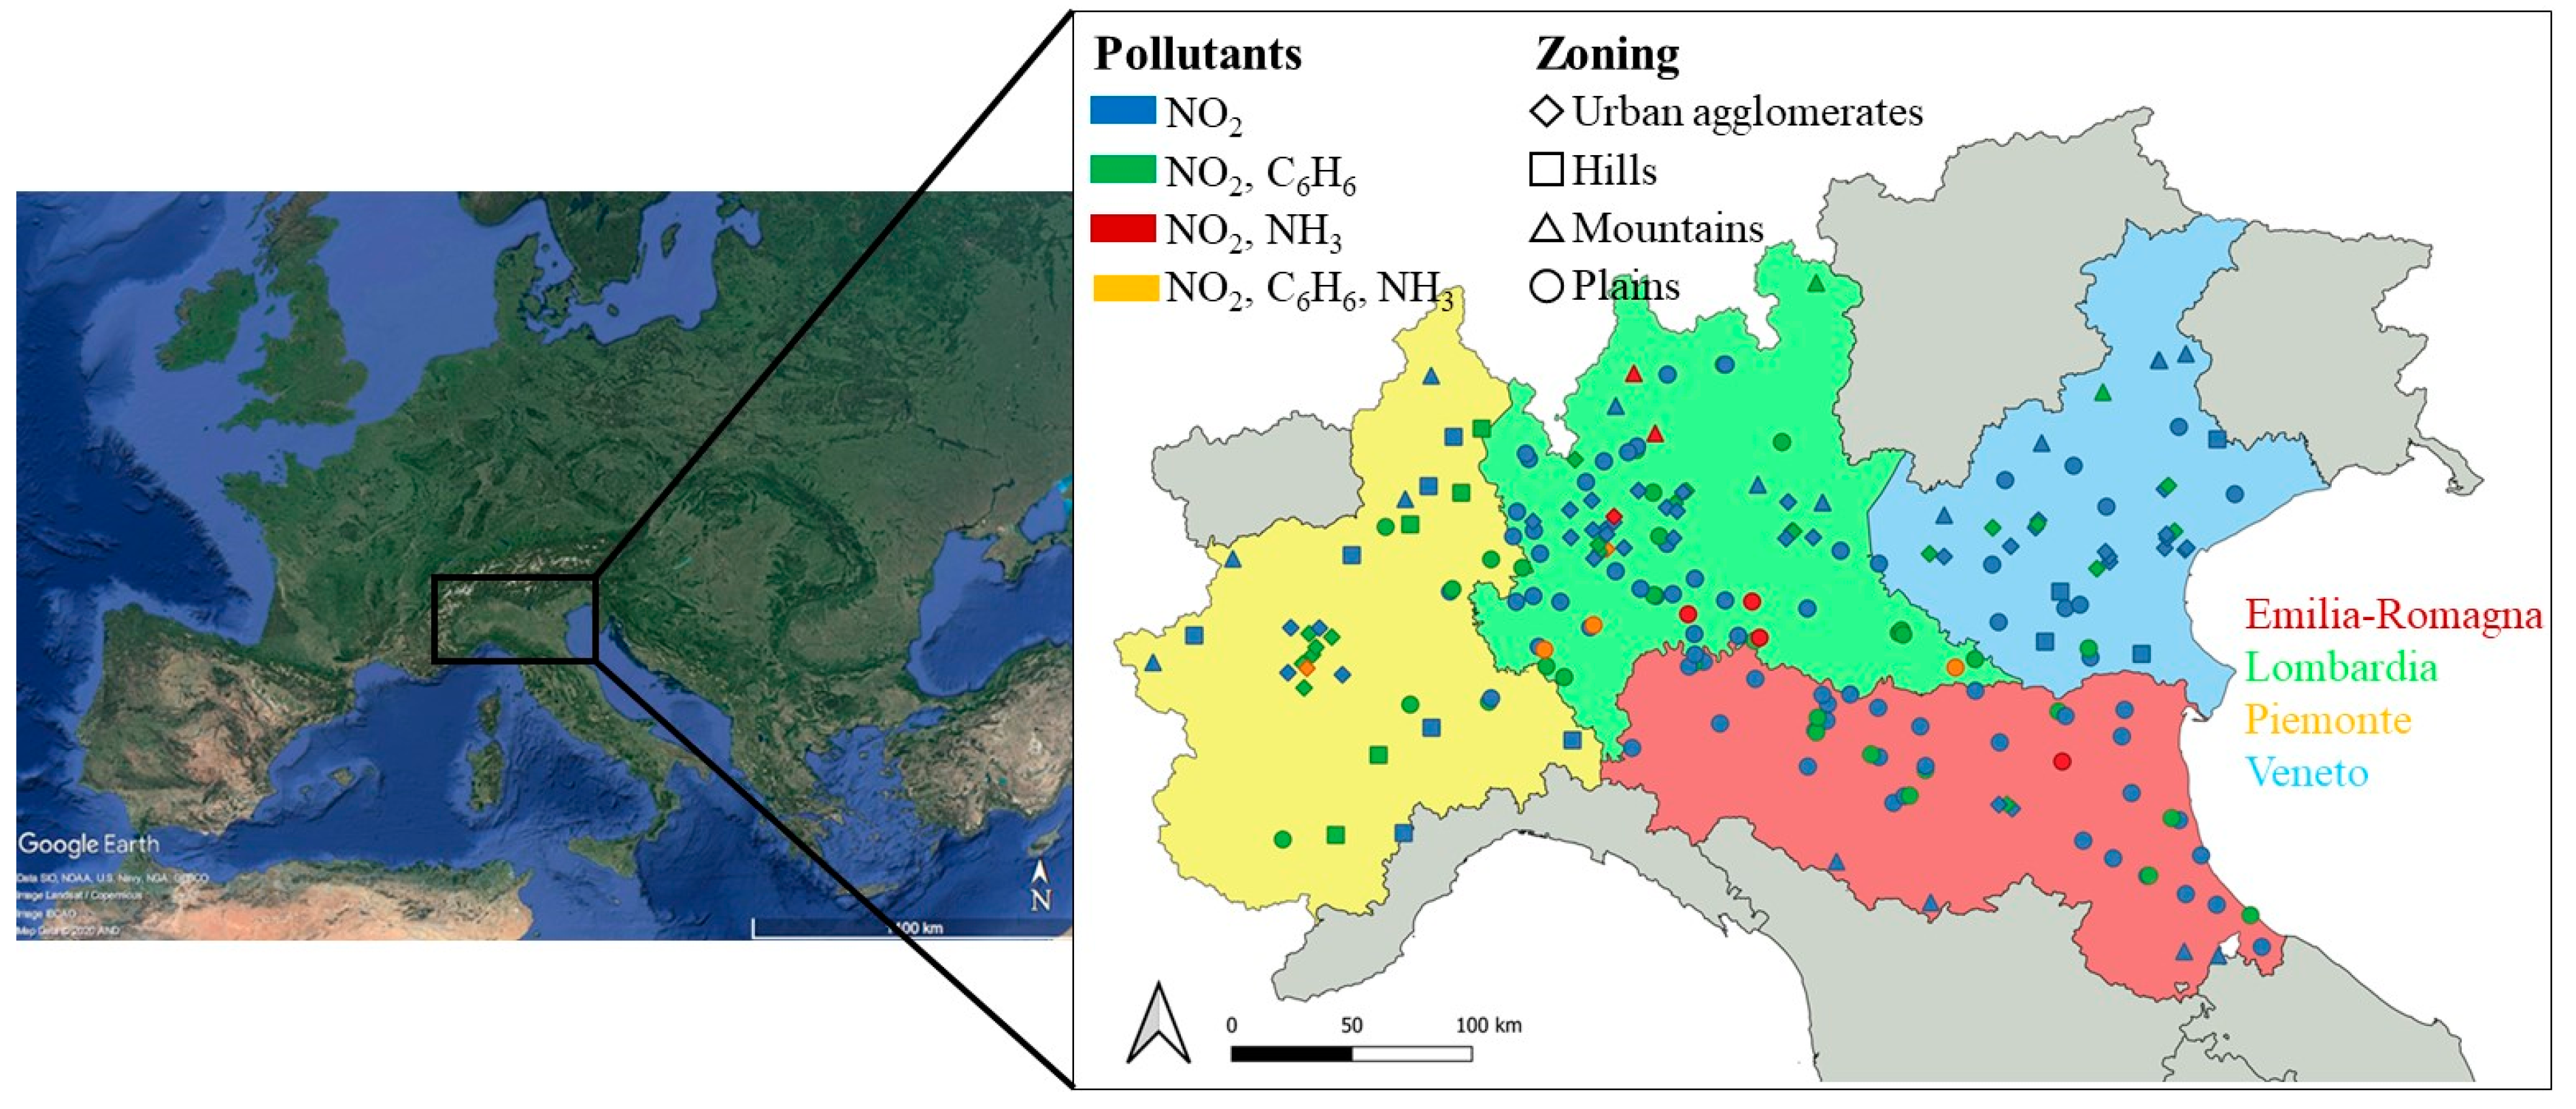
2.1. Air Quality Monitoring Networks
2.2. Air Quality Data Processing
3. Results and Discussion
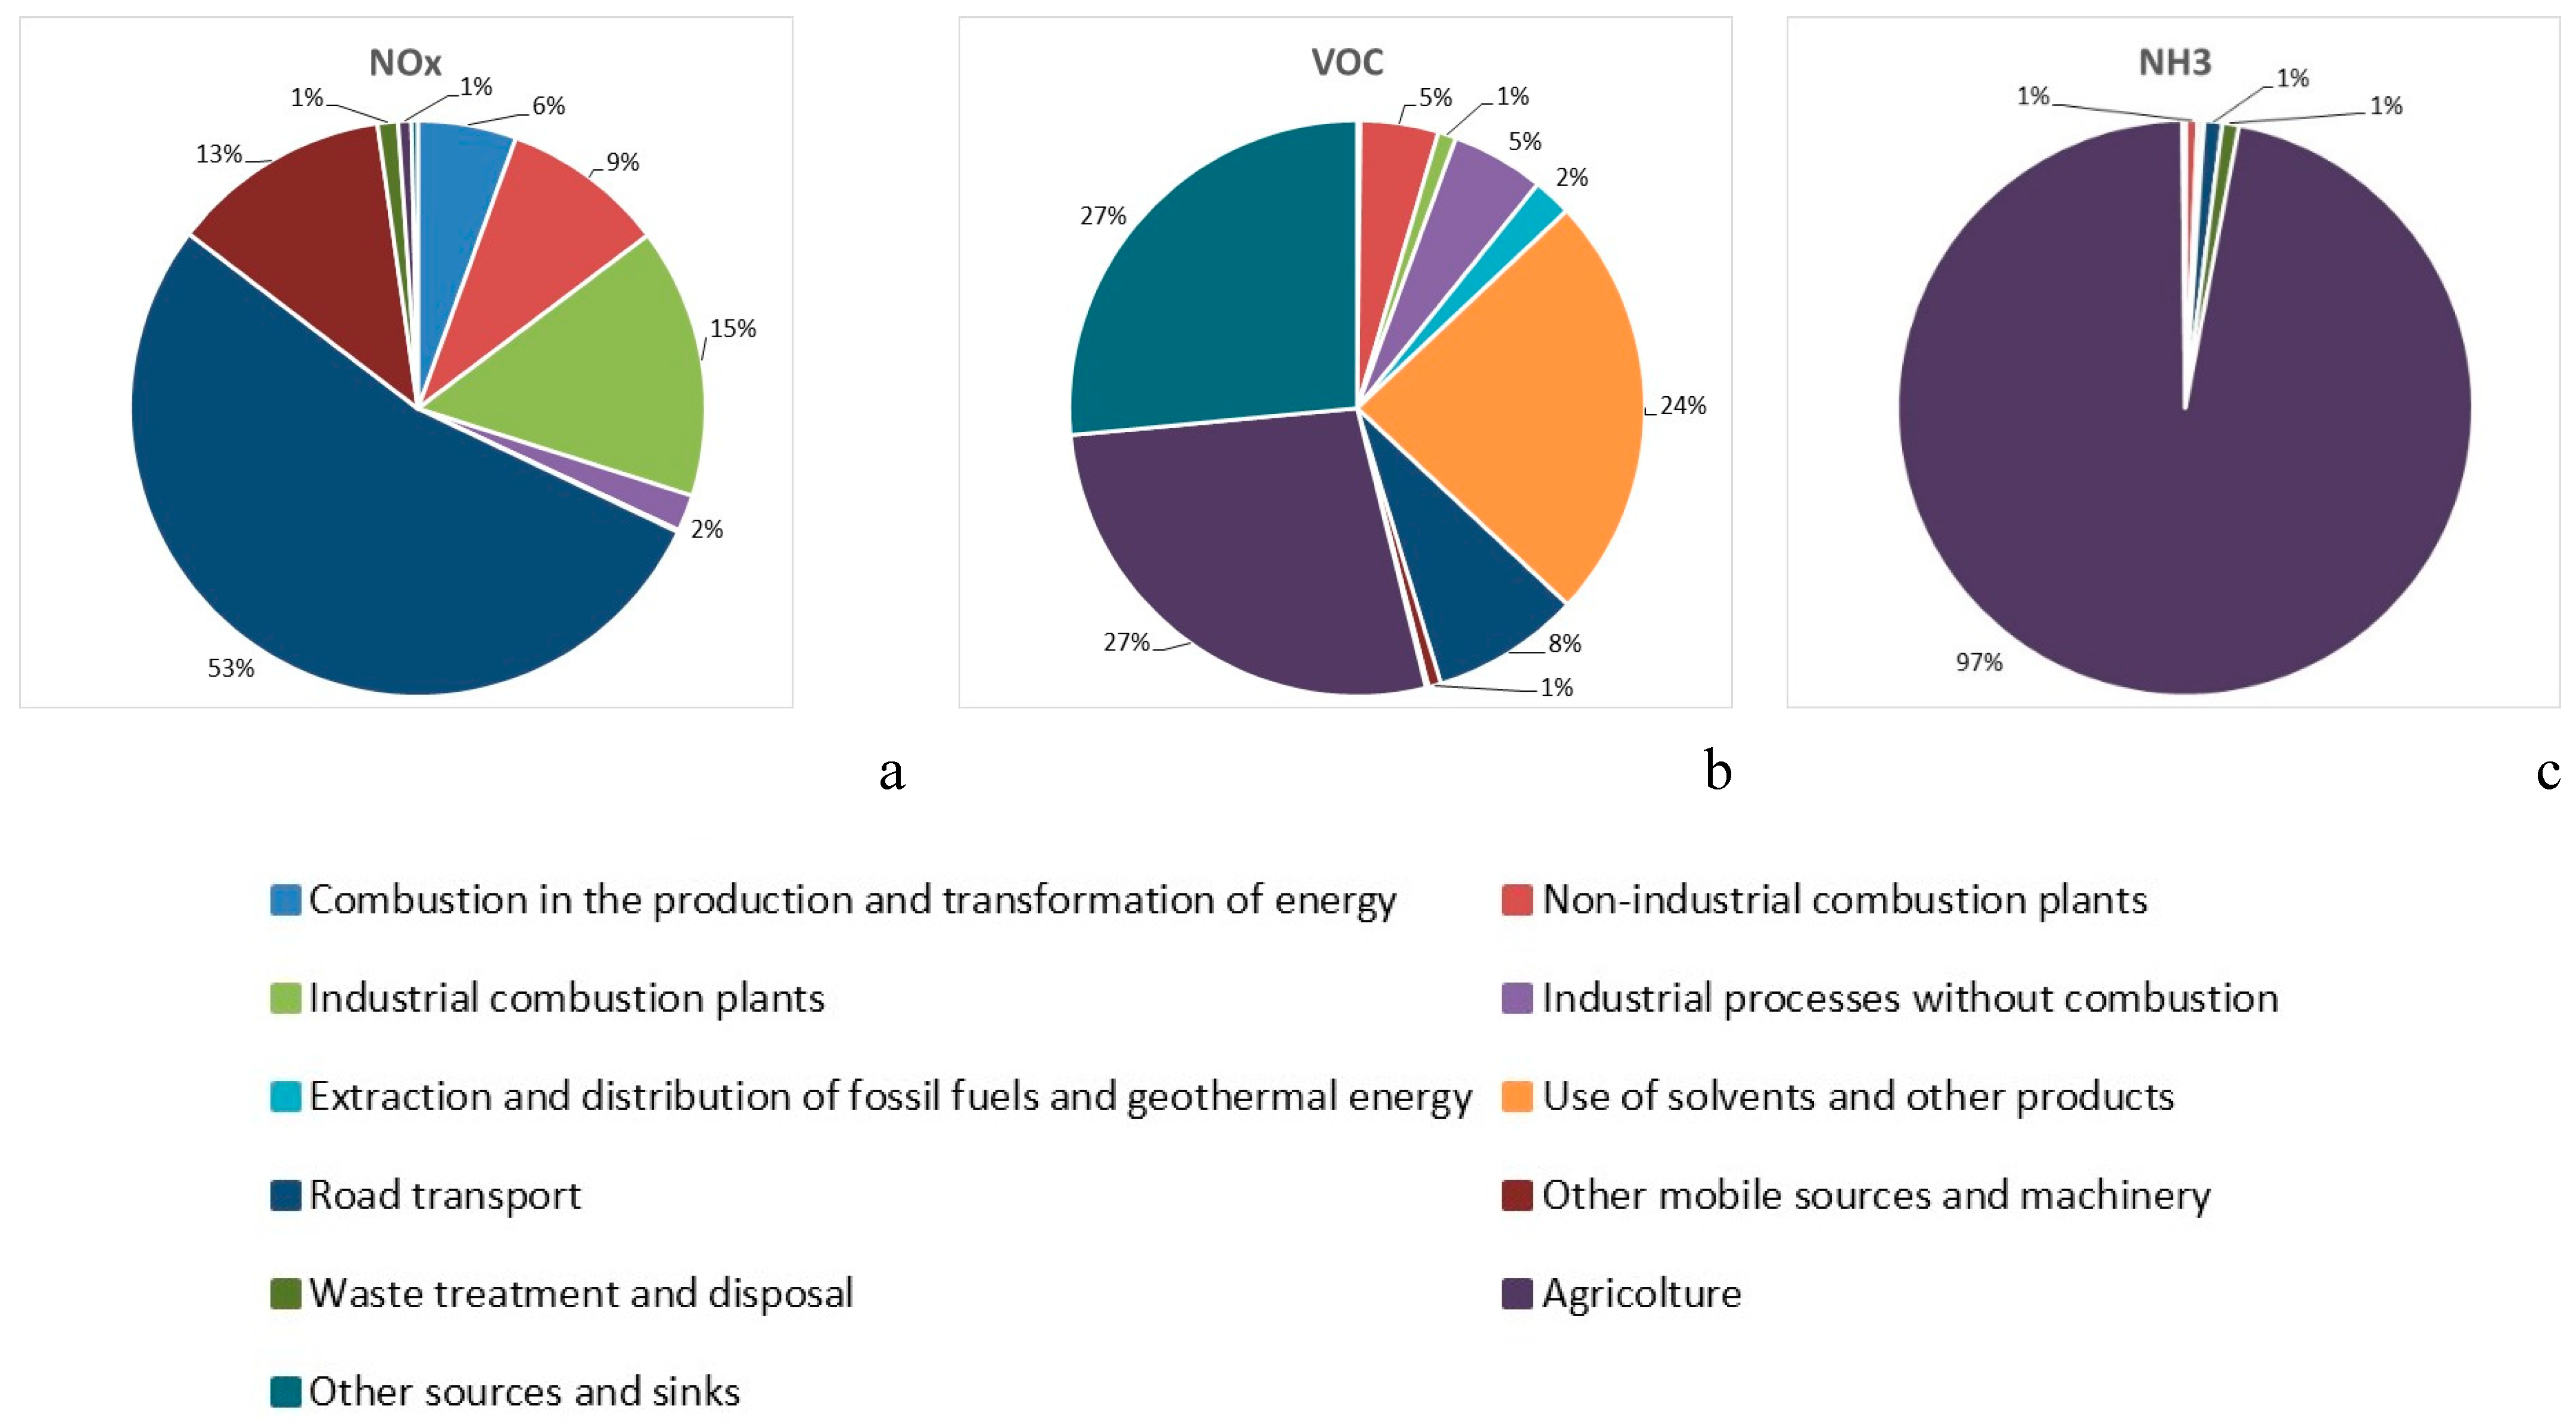
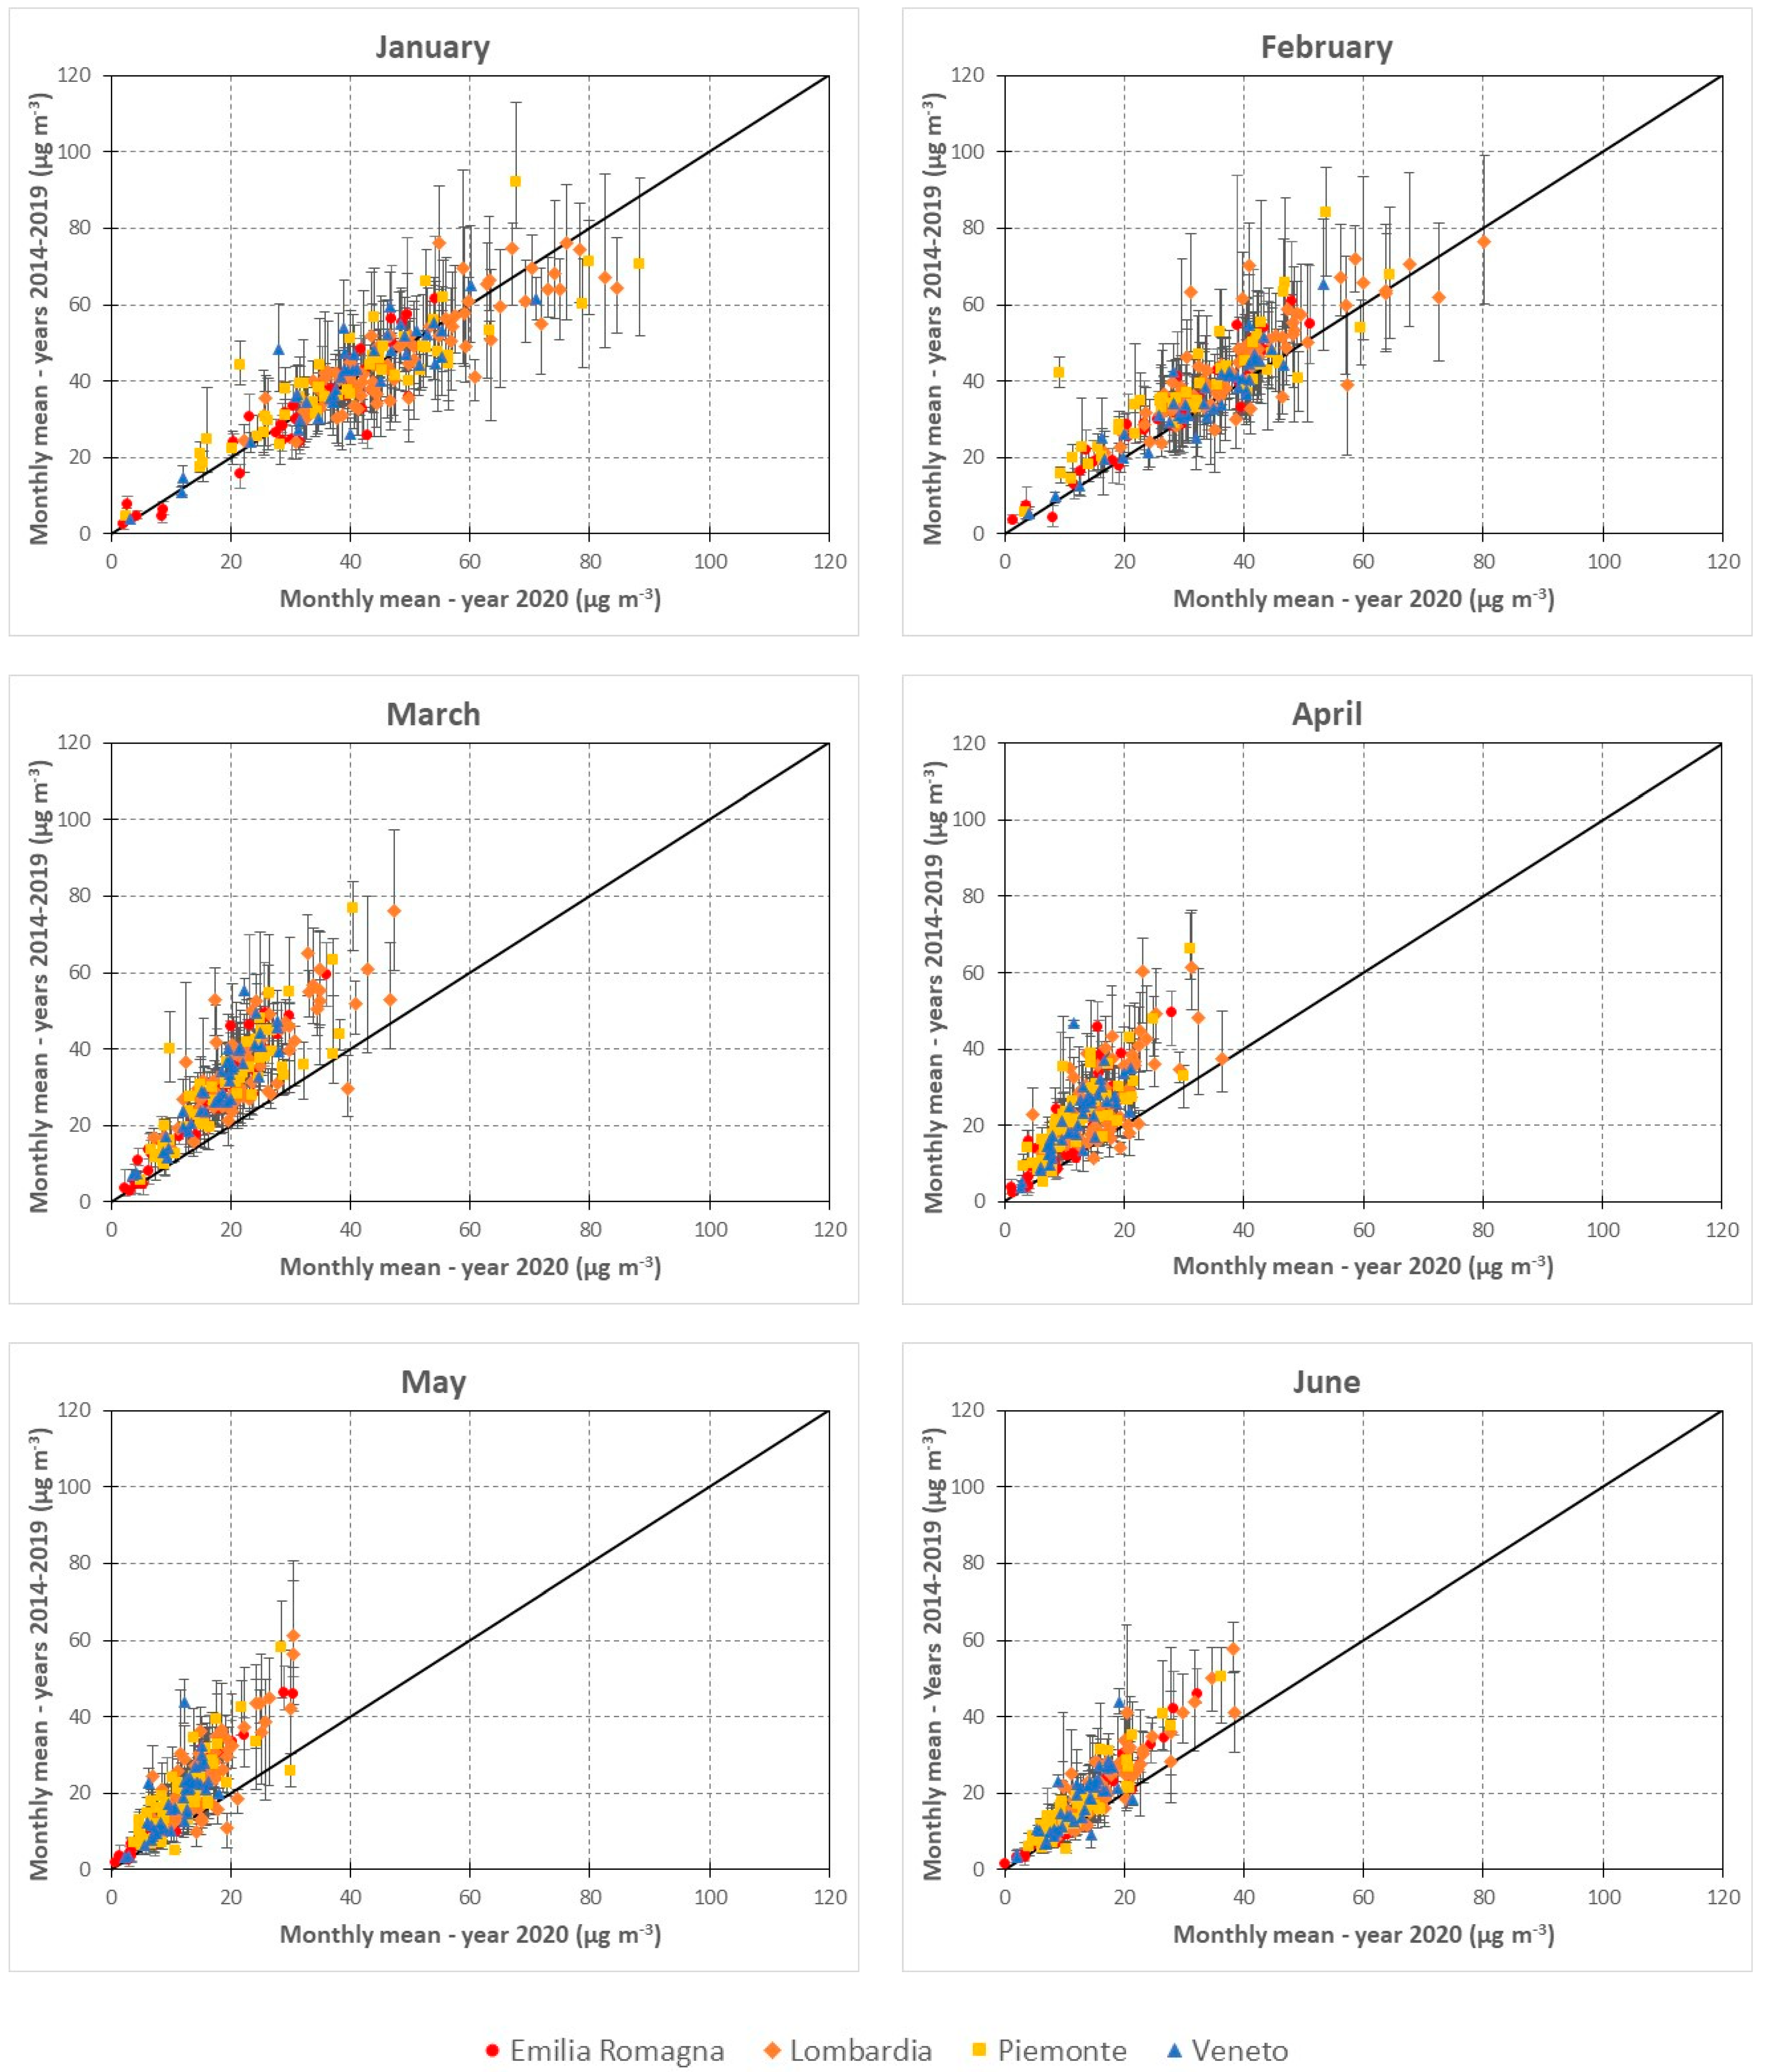
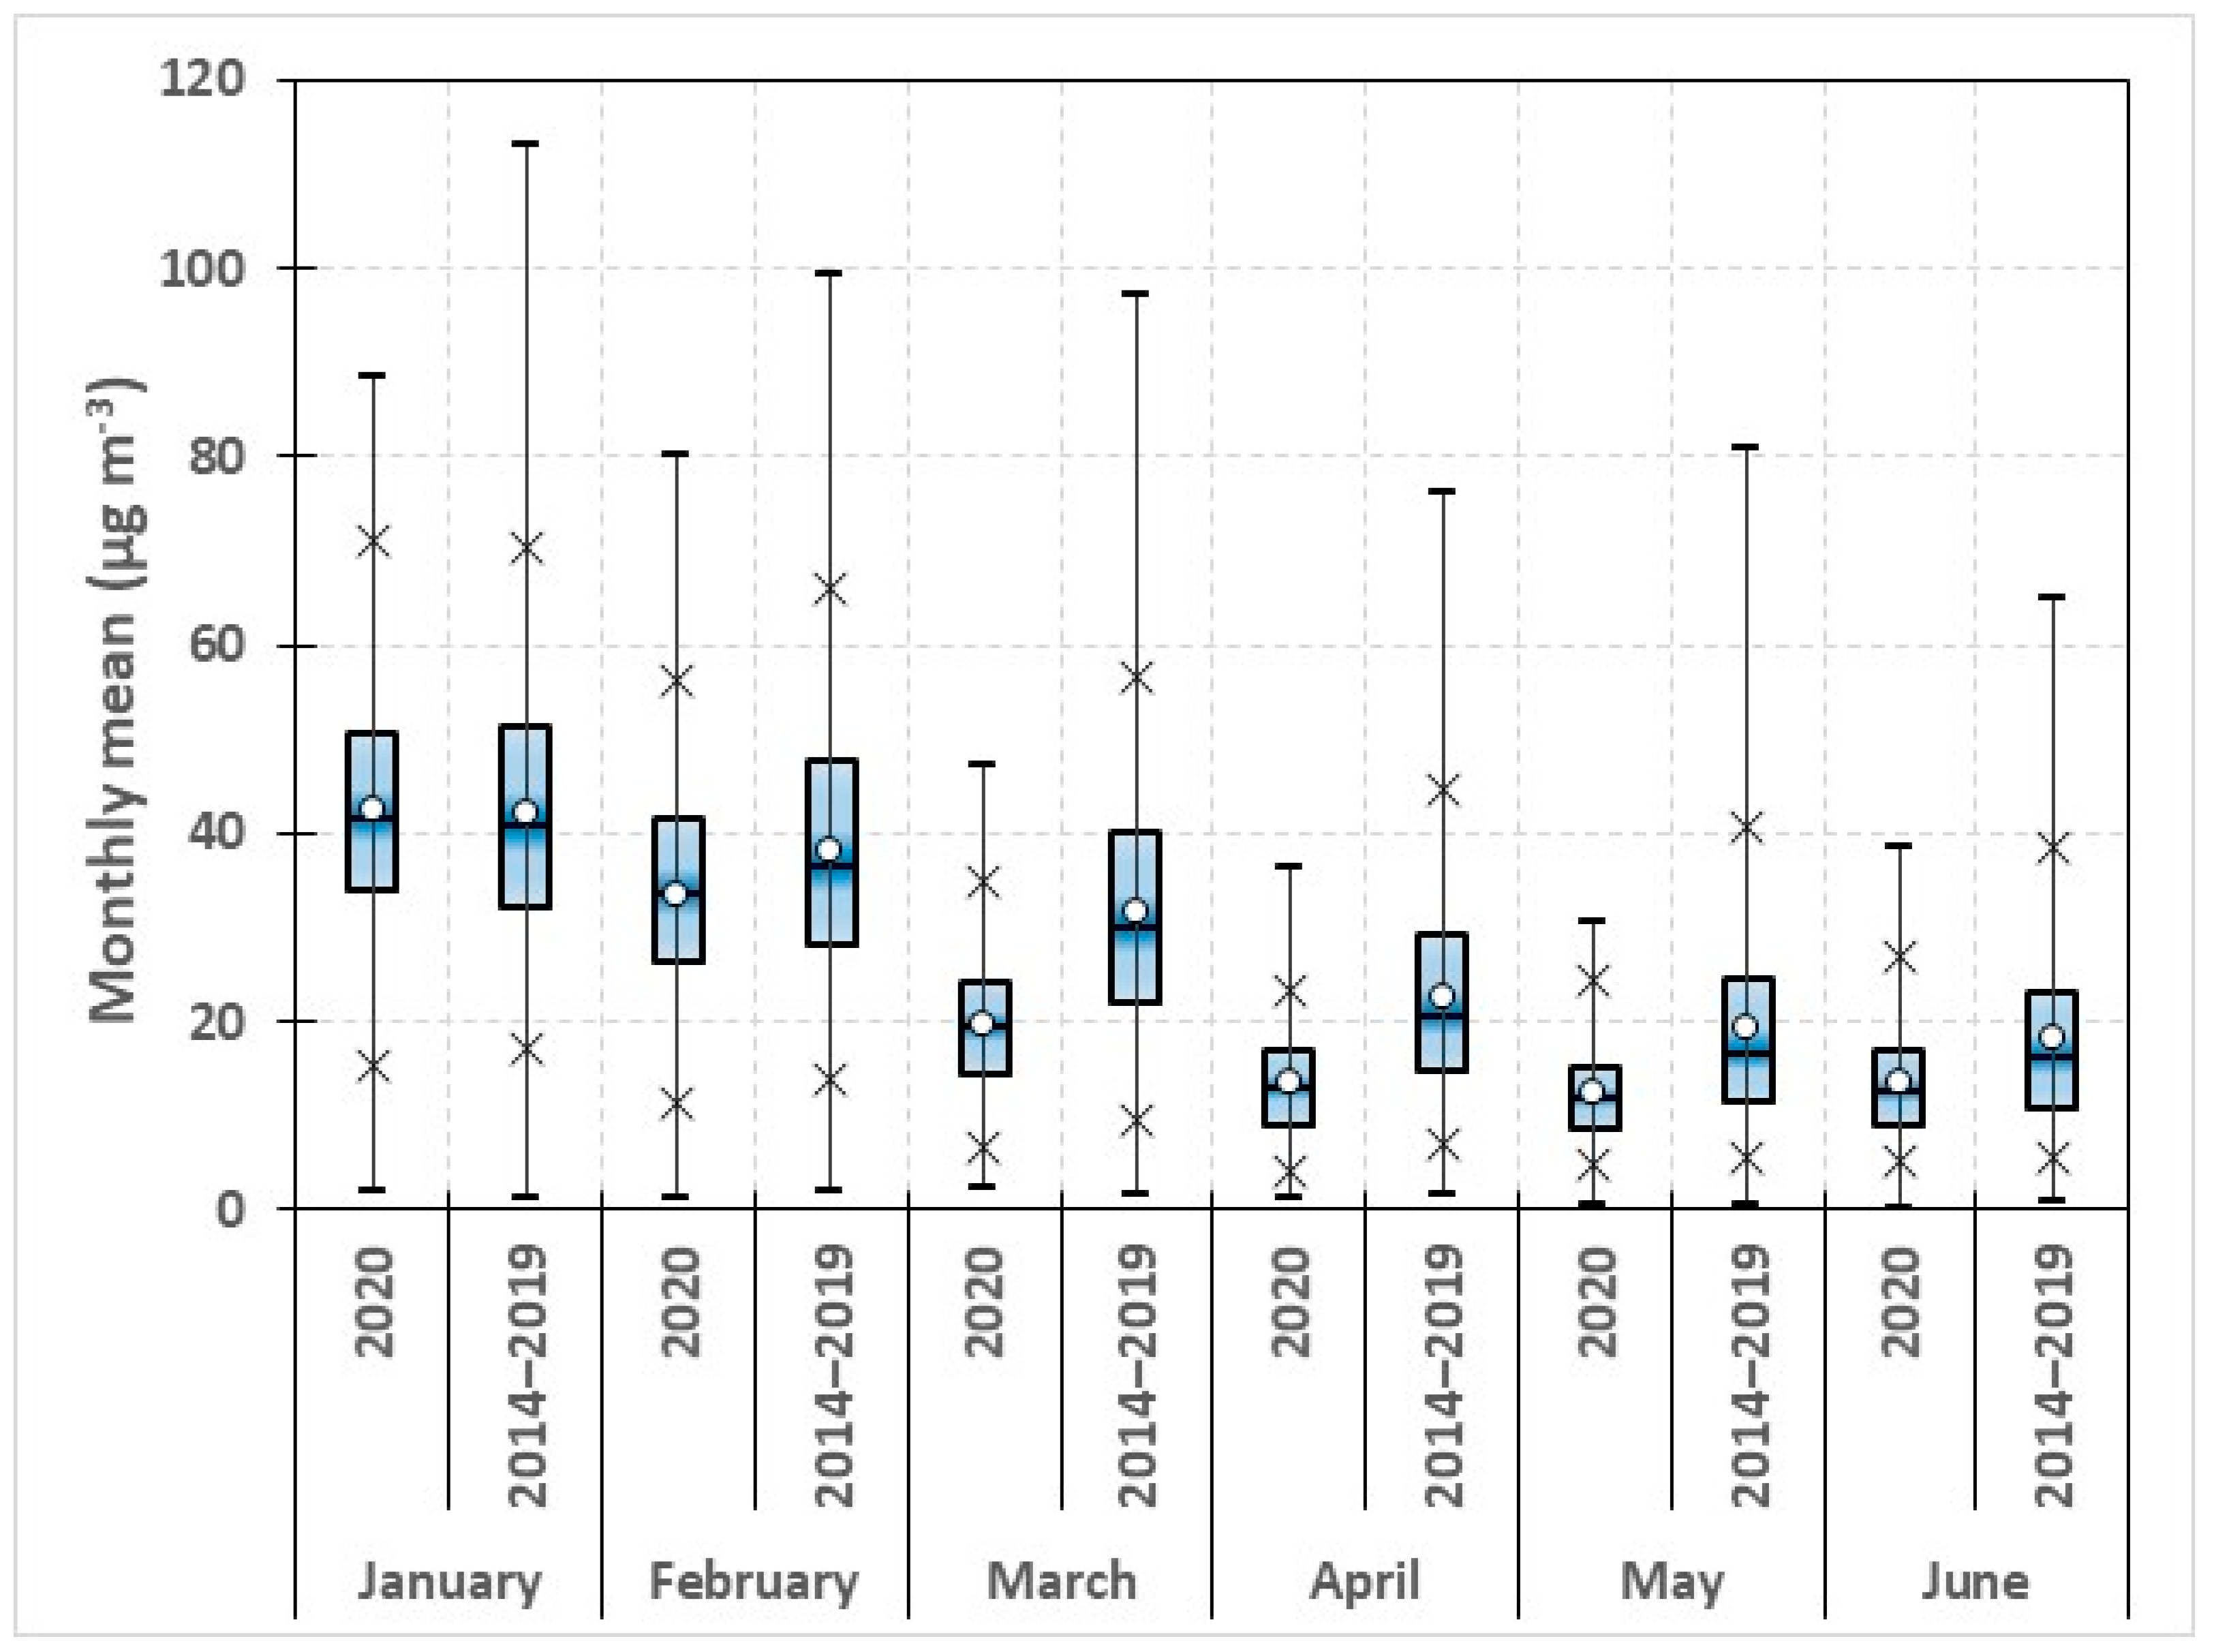
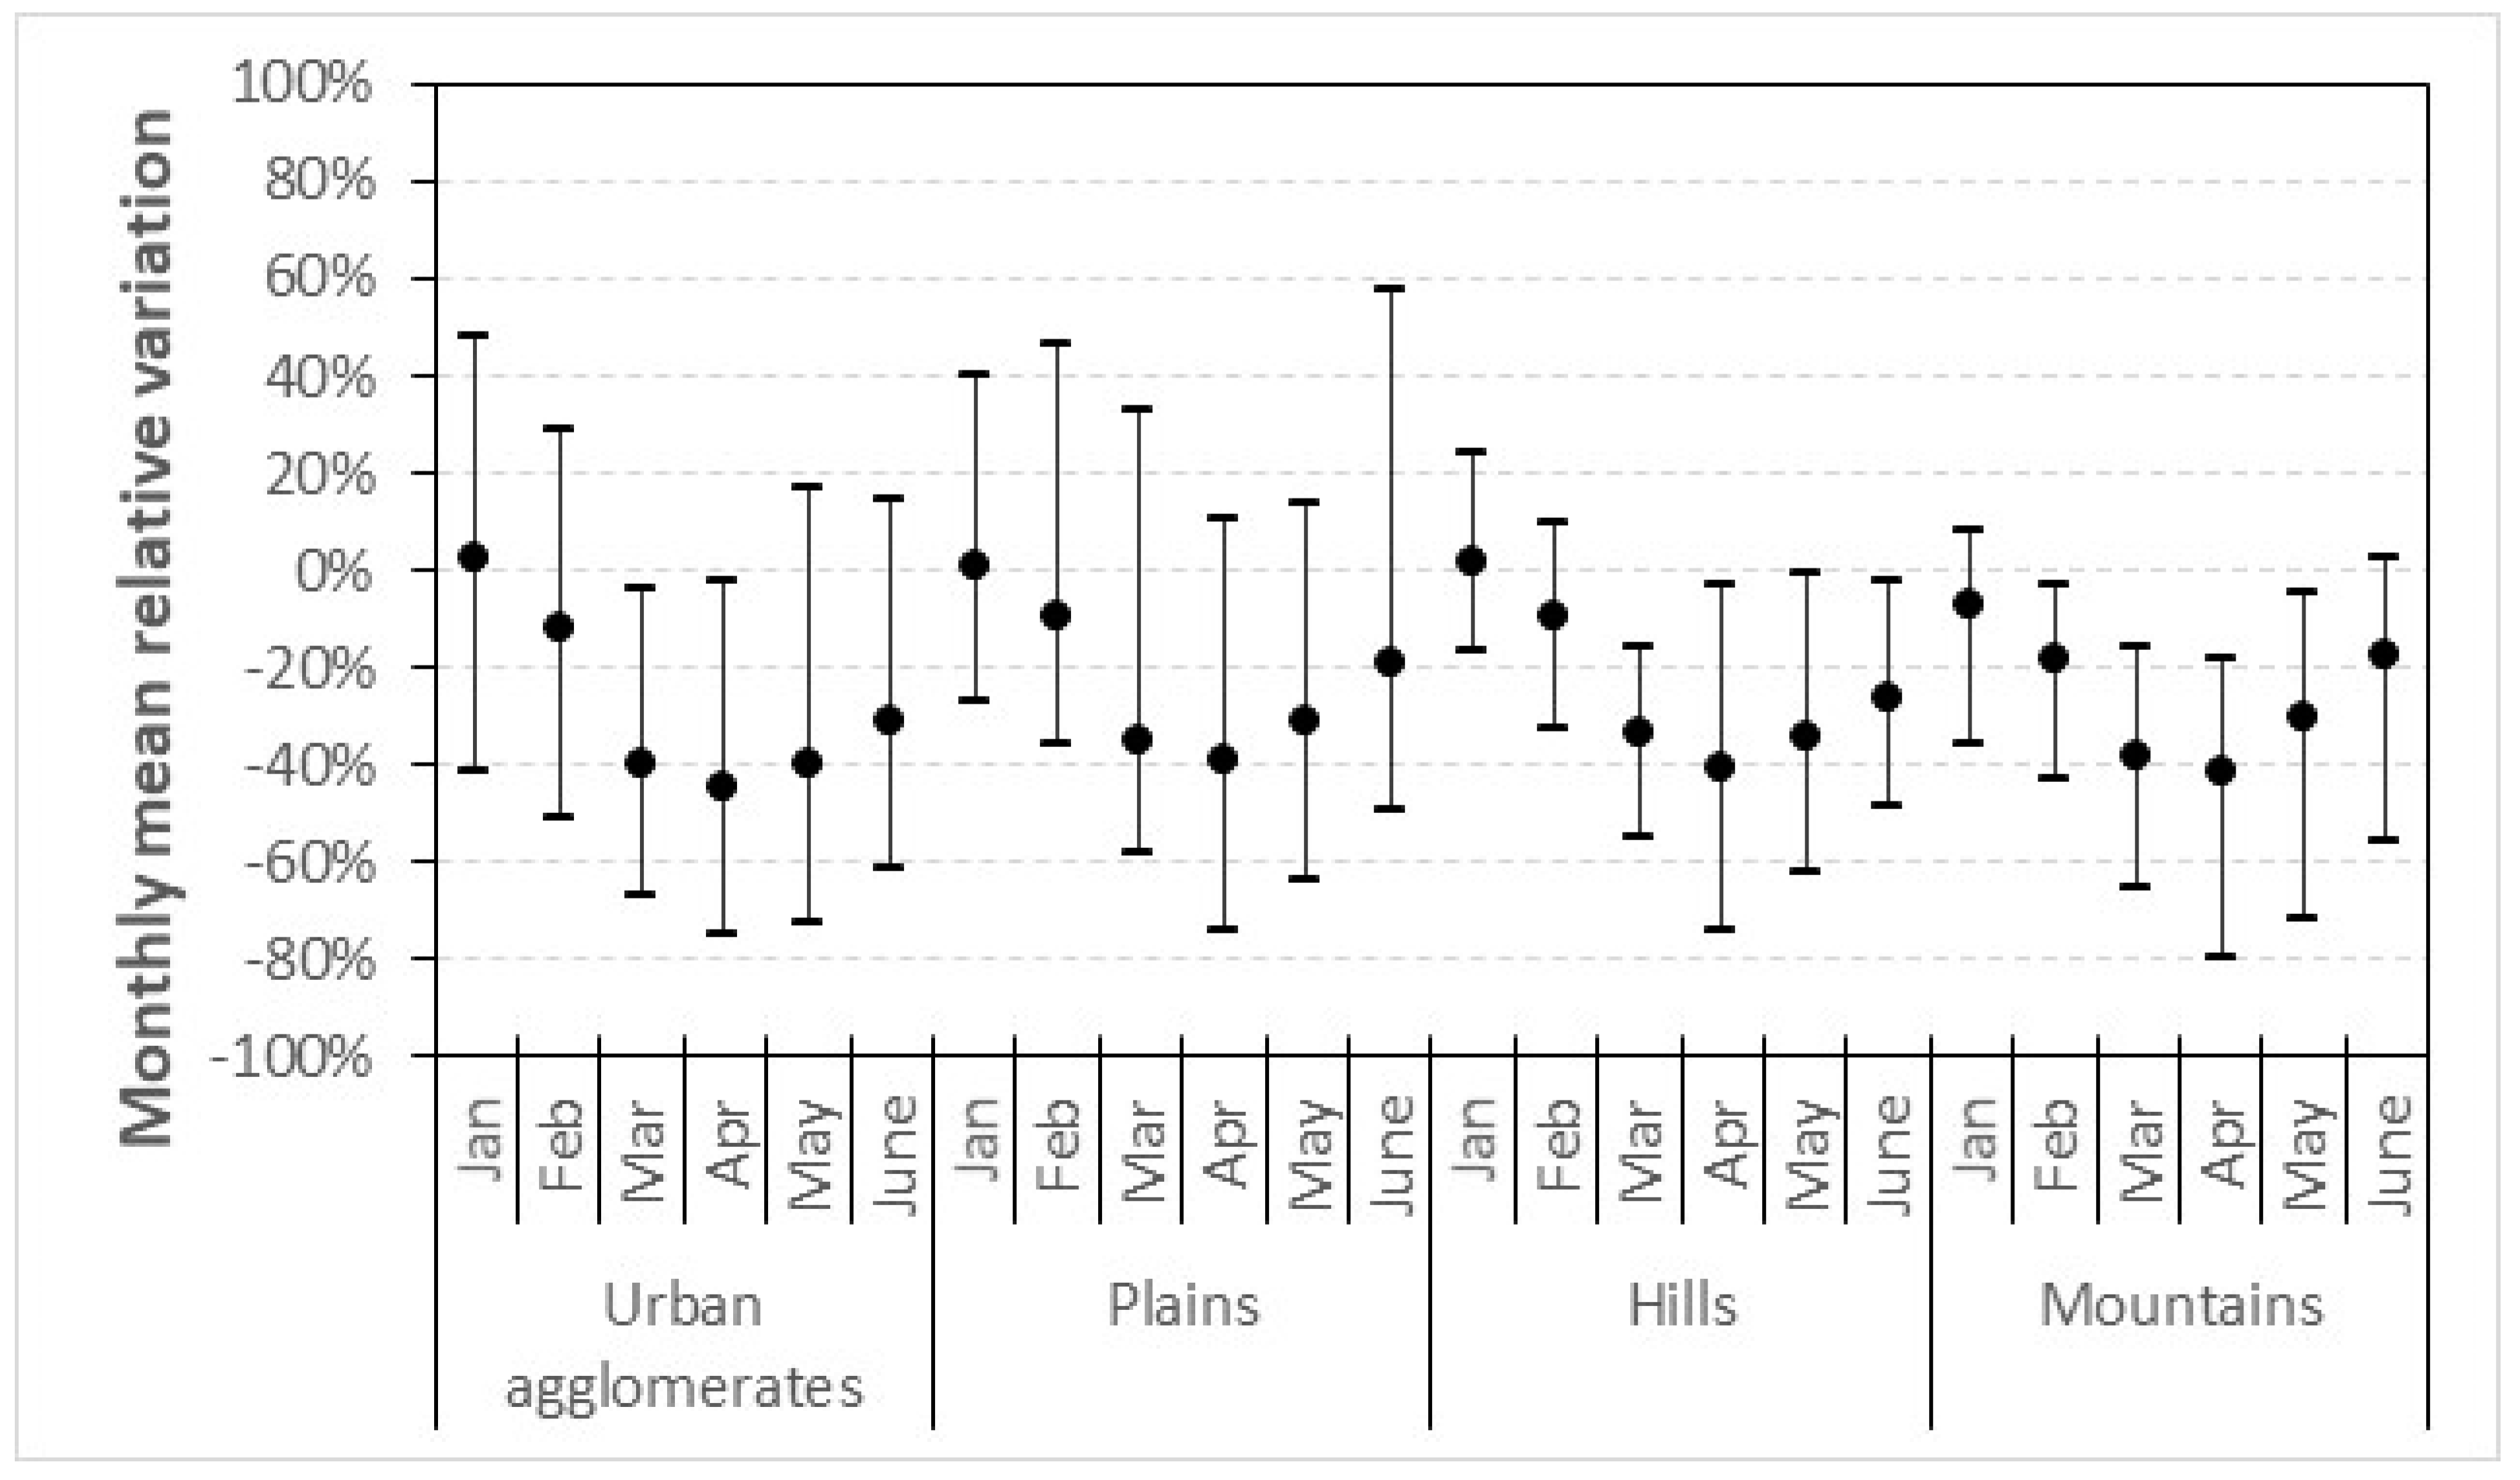
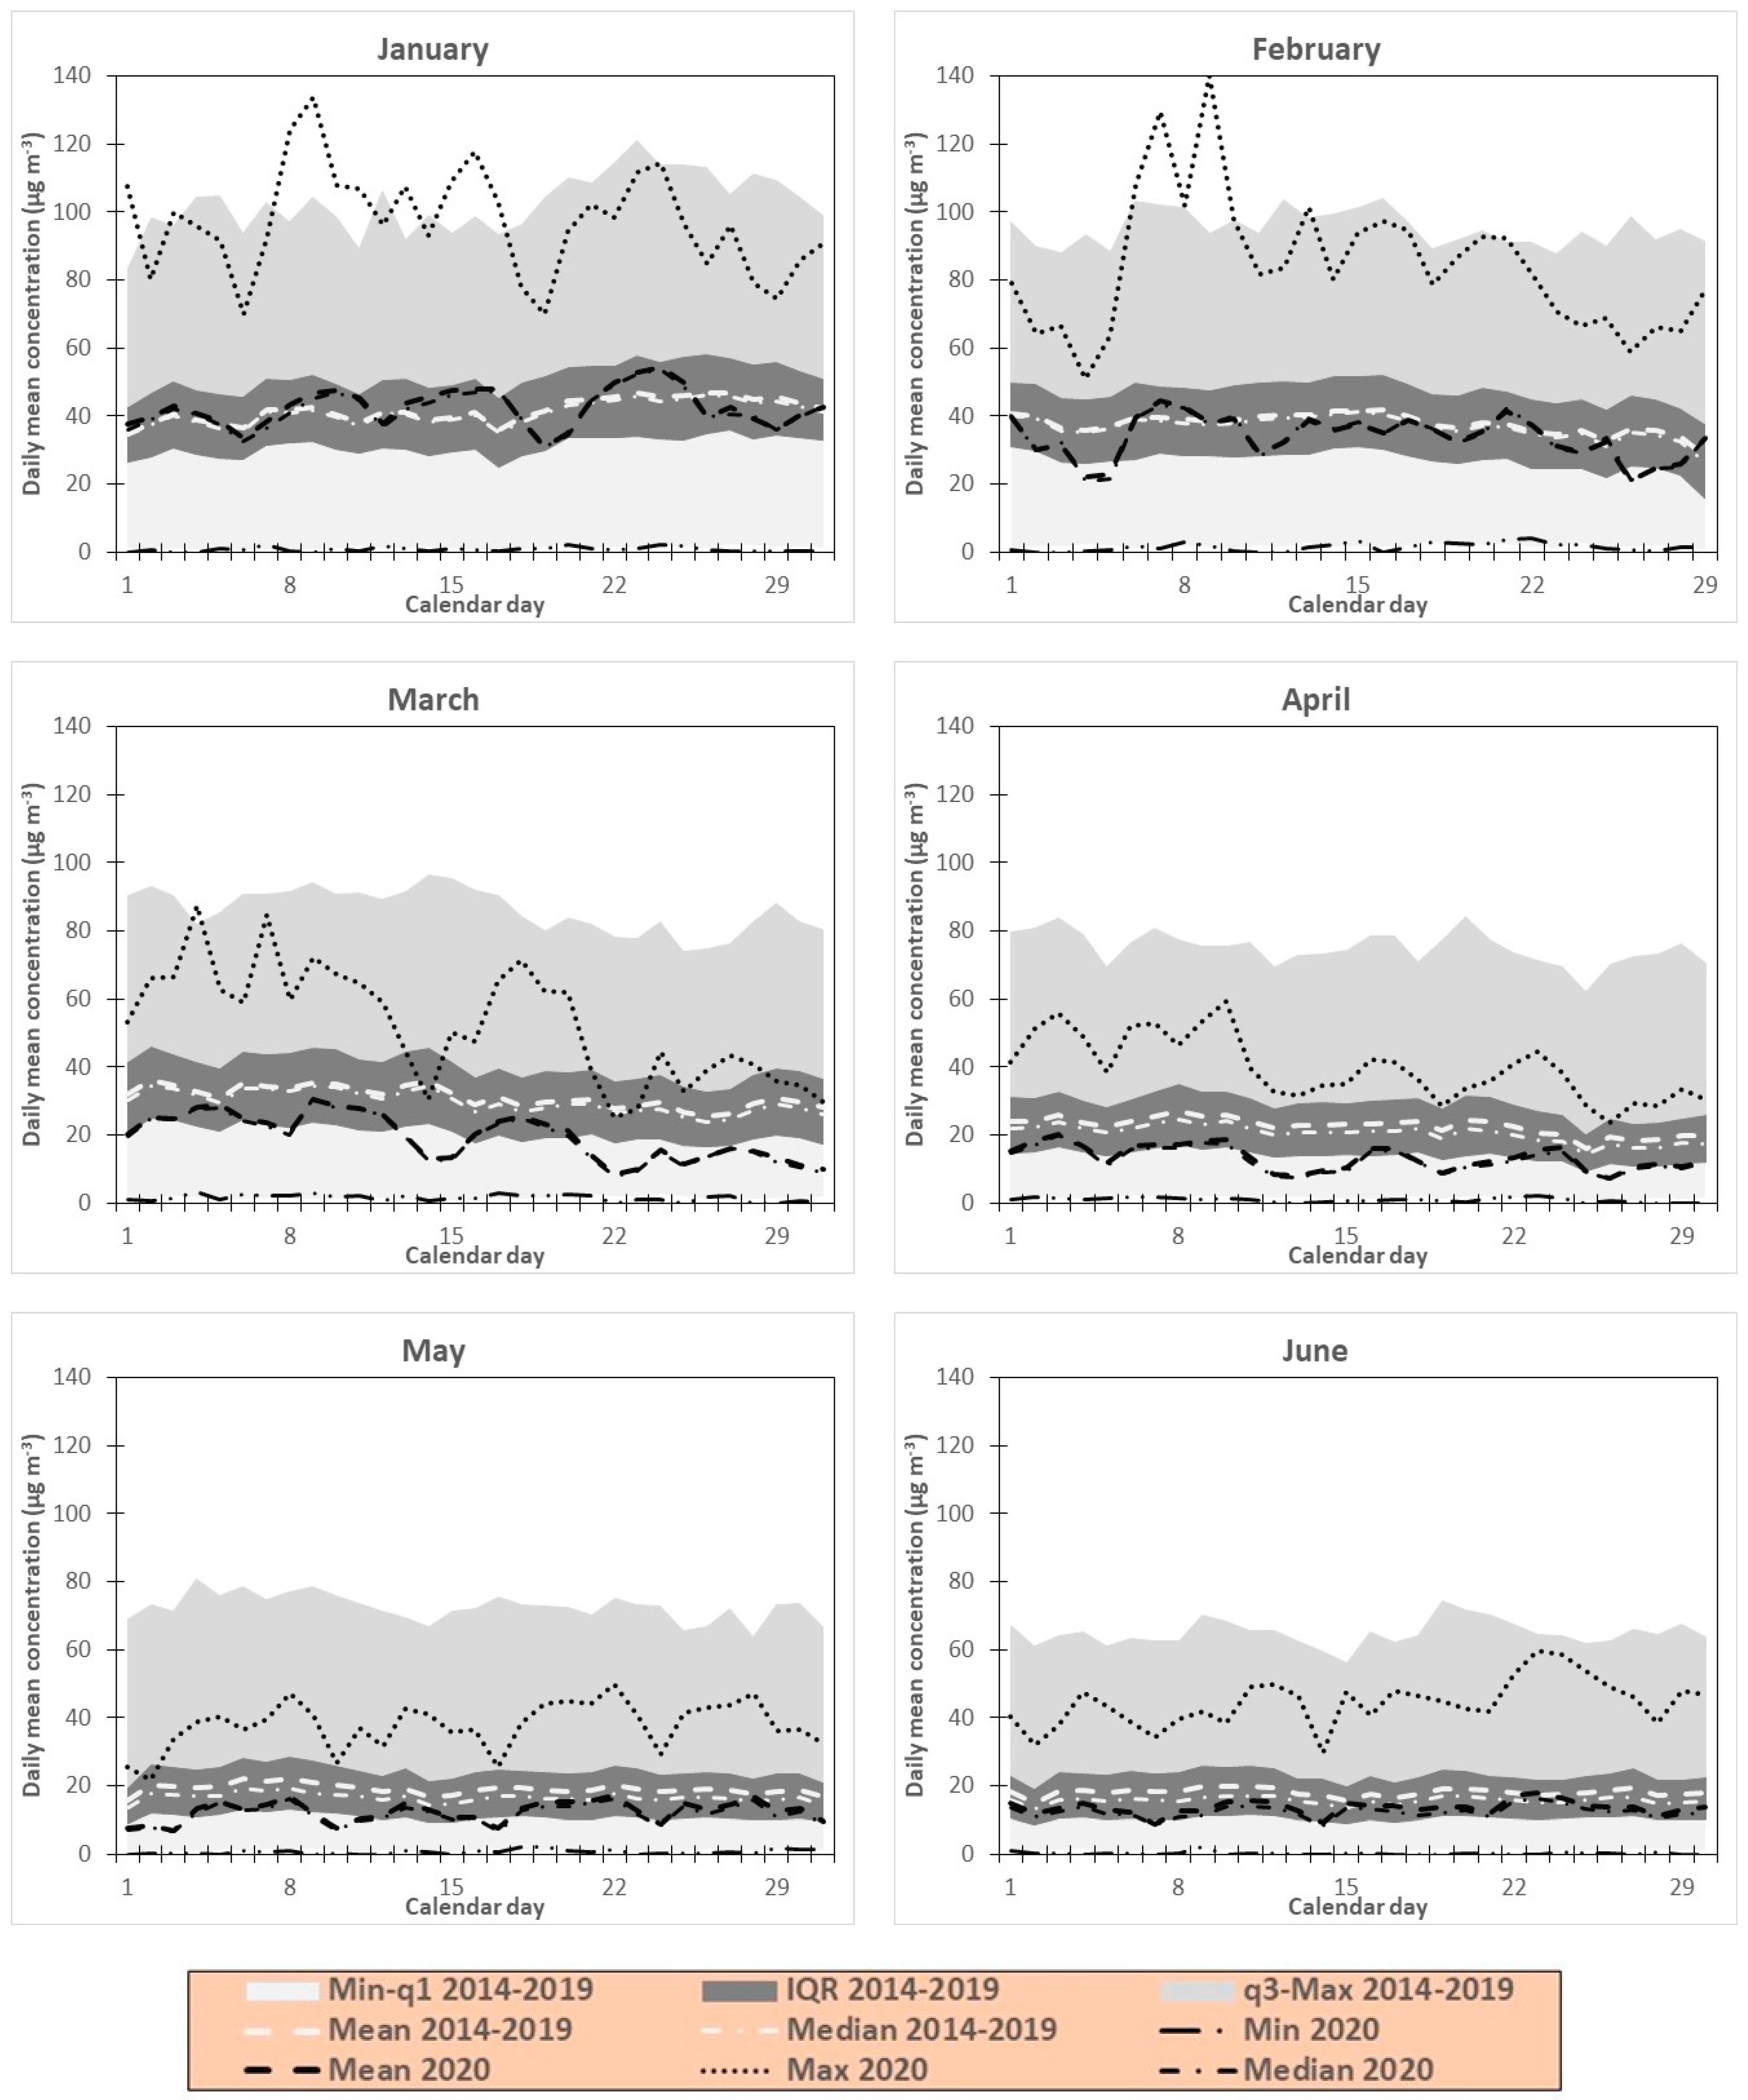
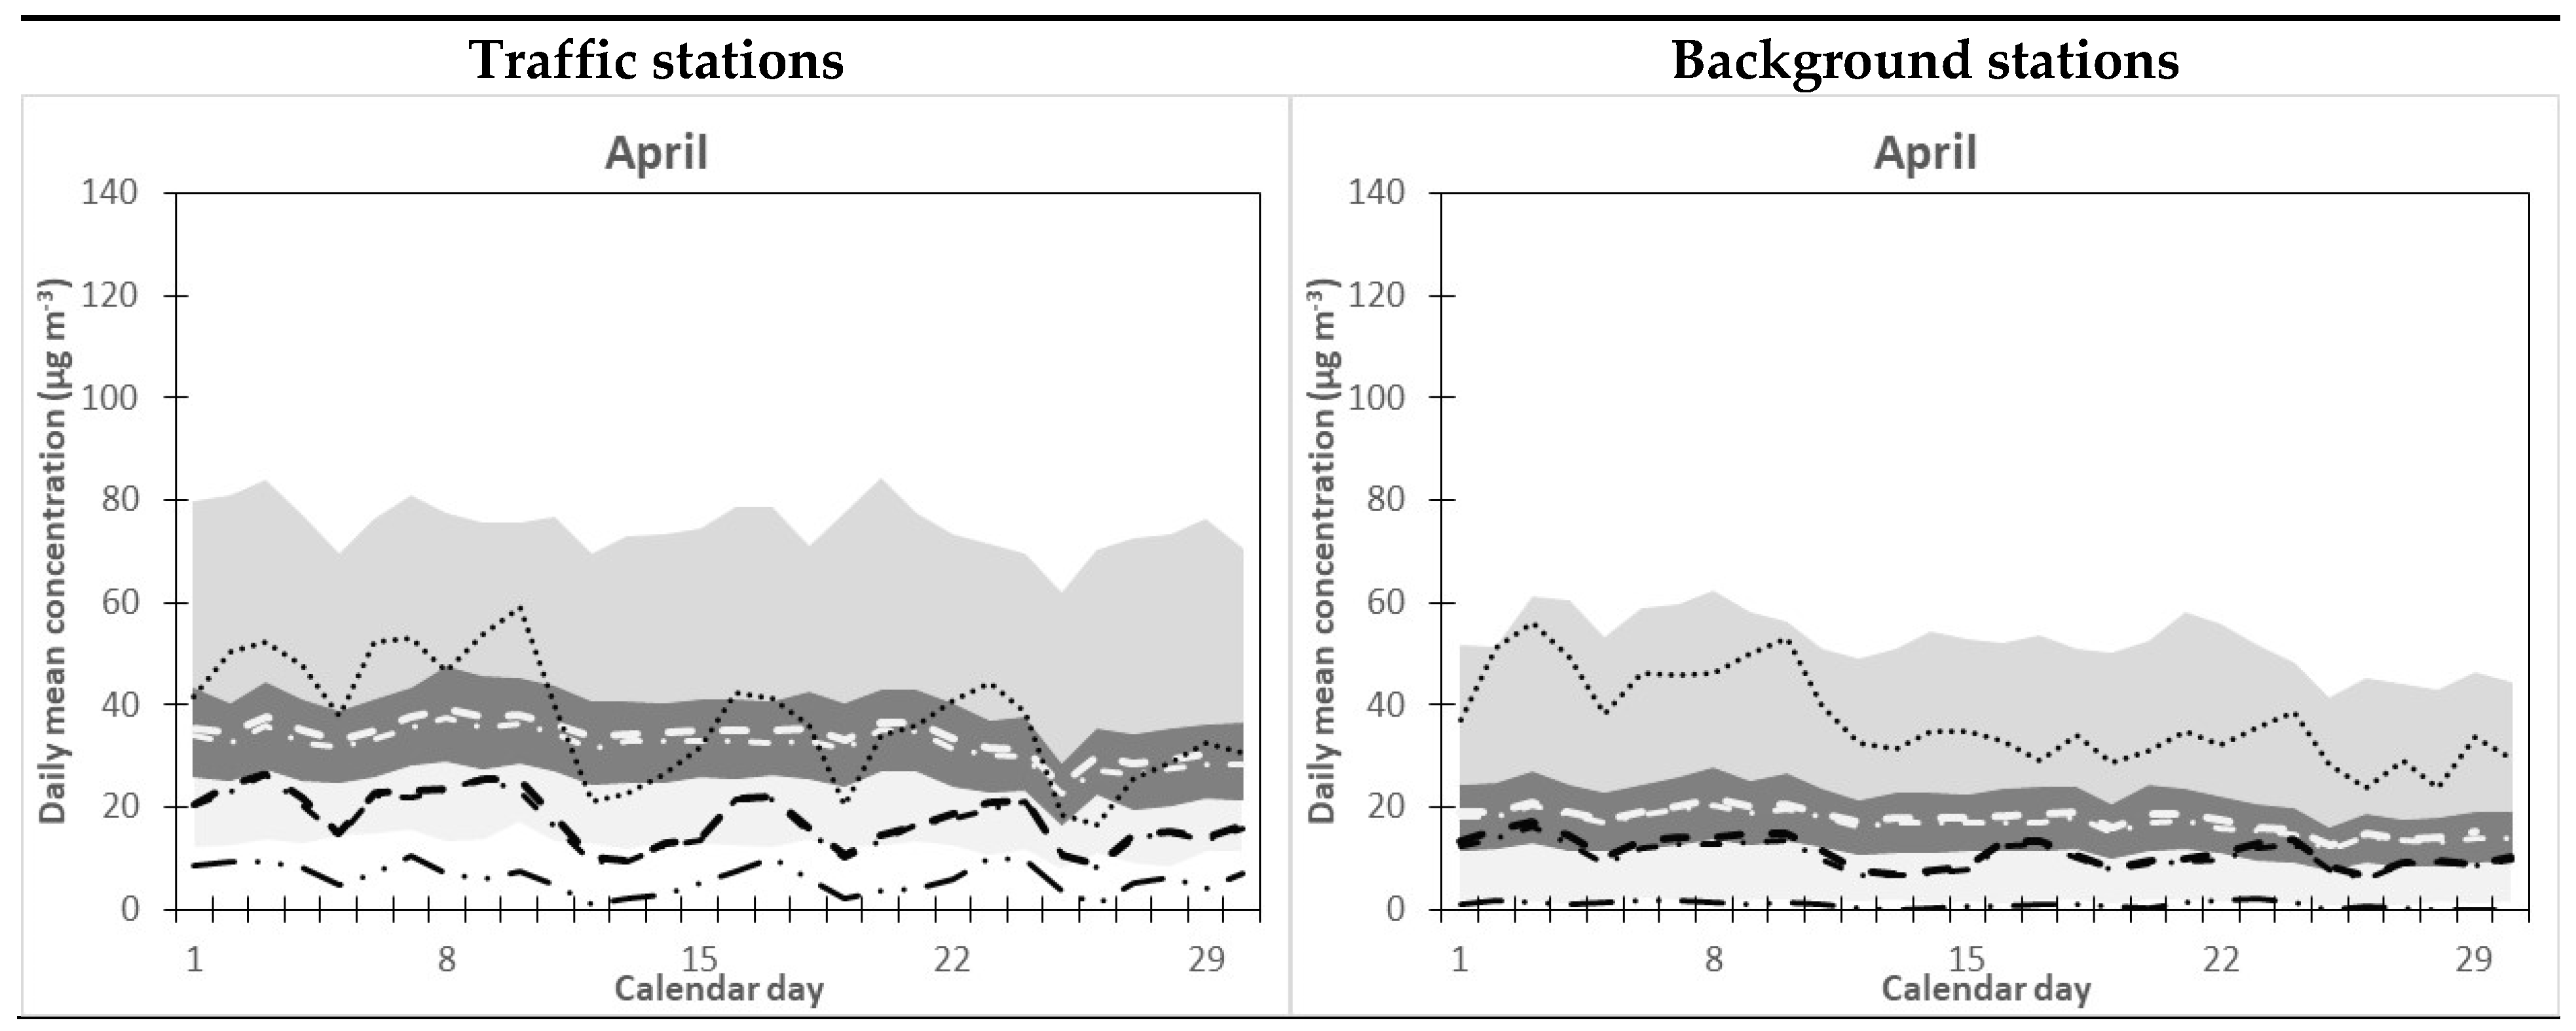
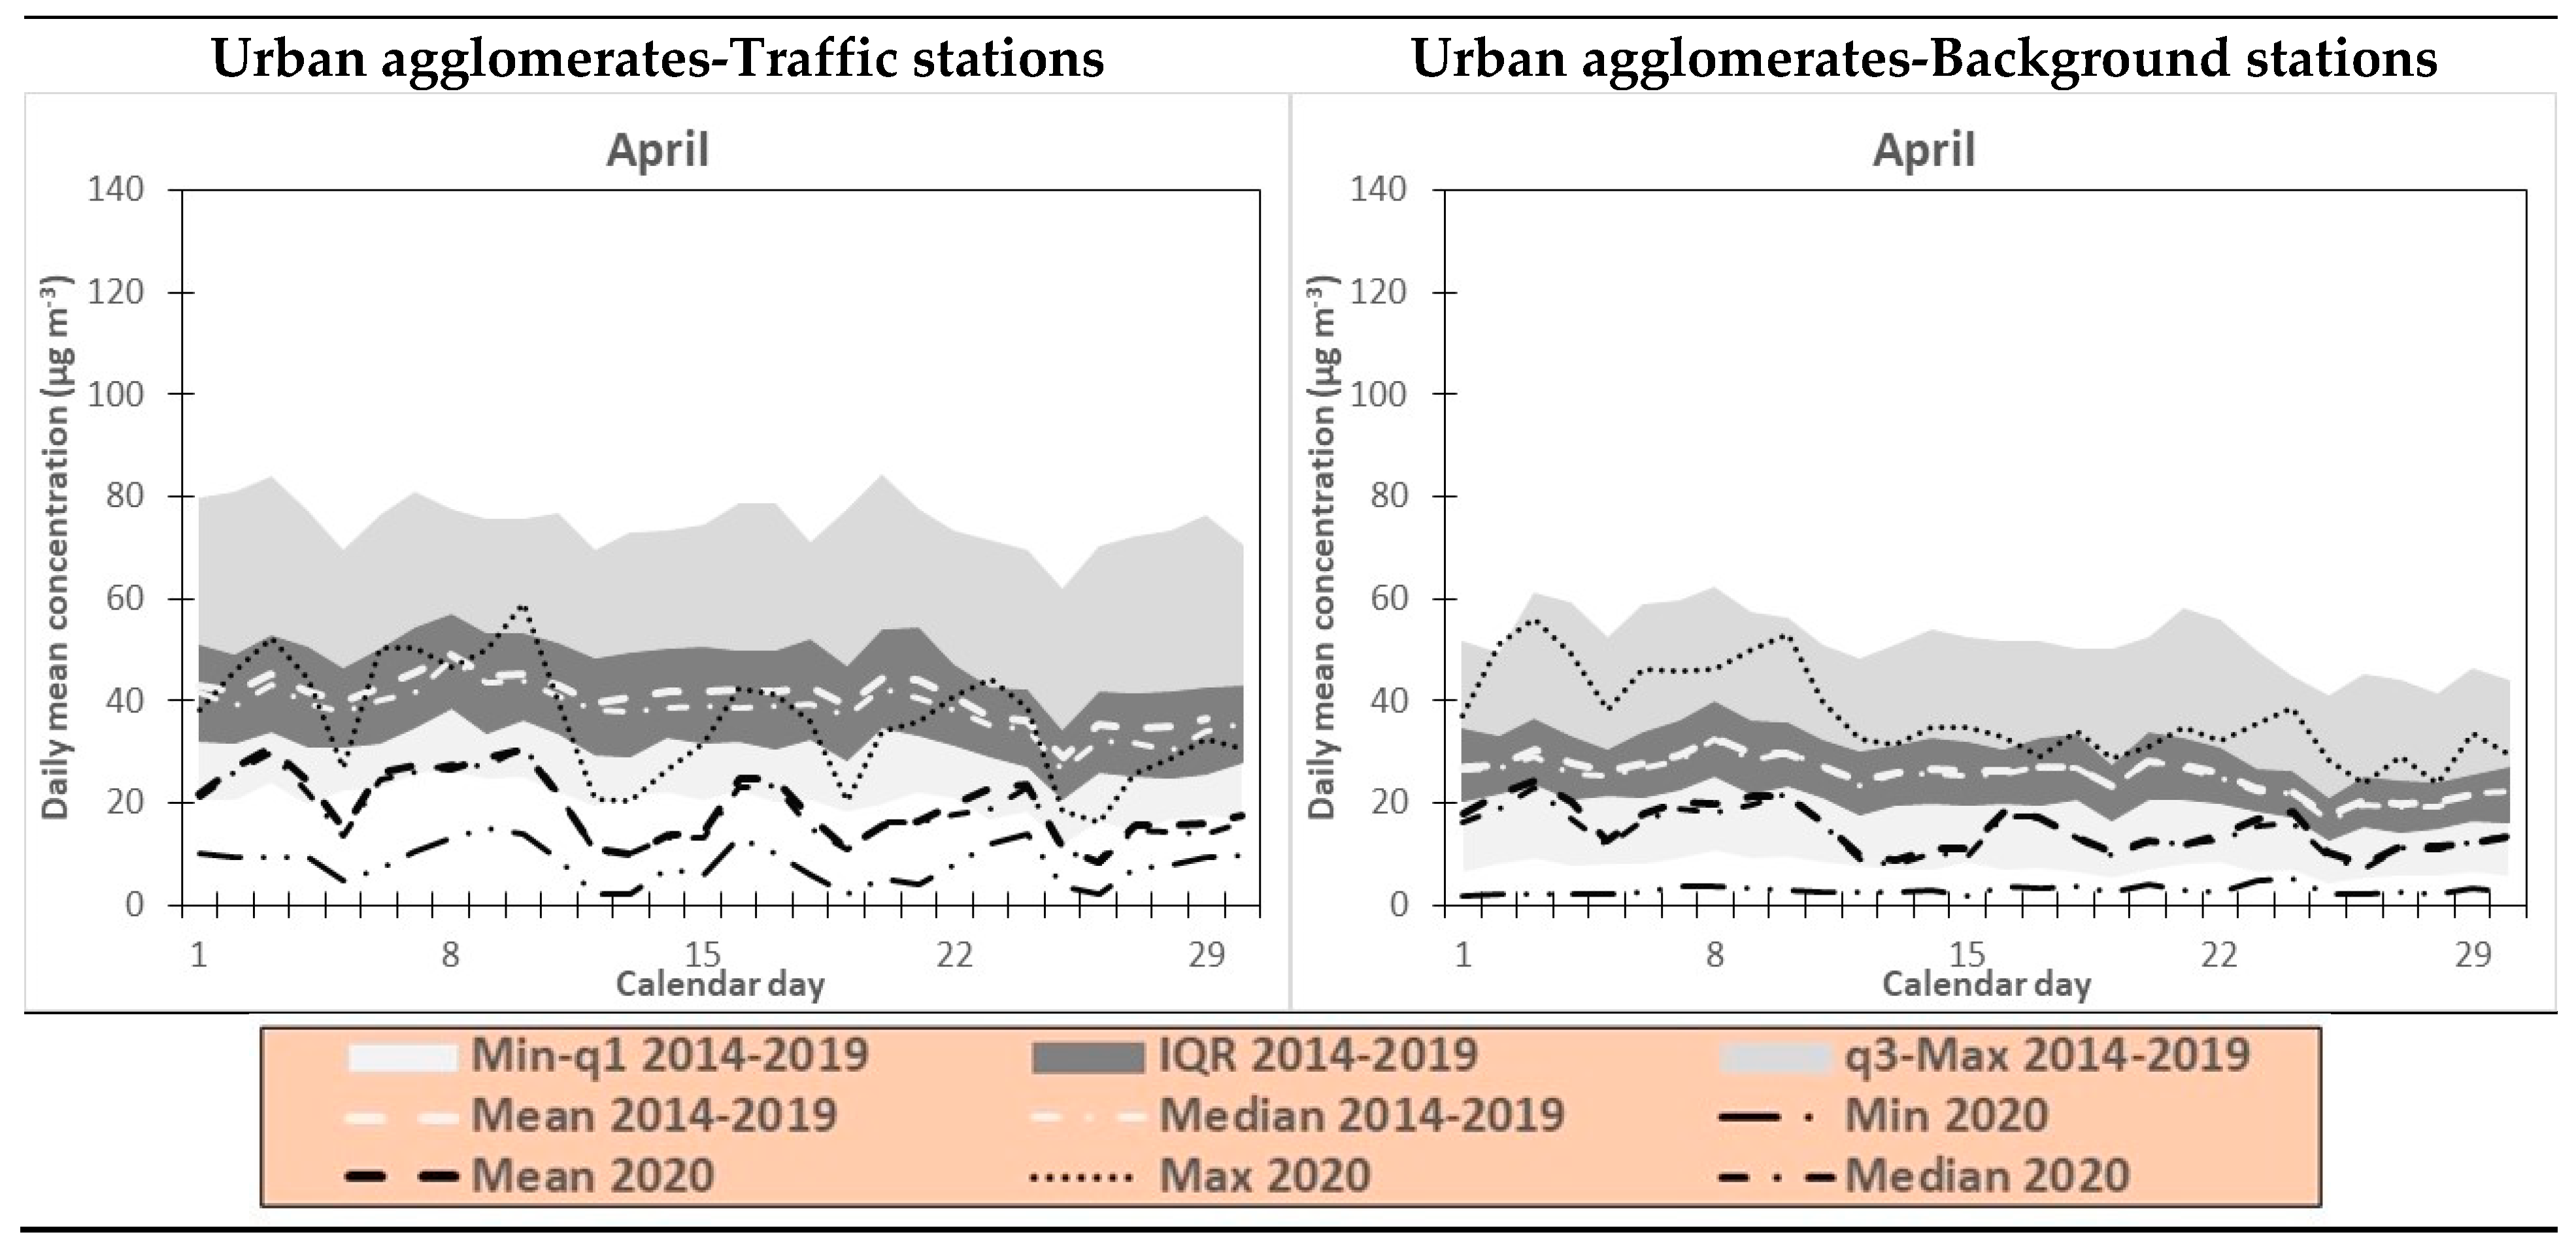
3.1. NO2
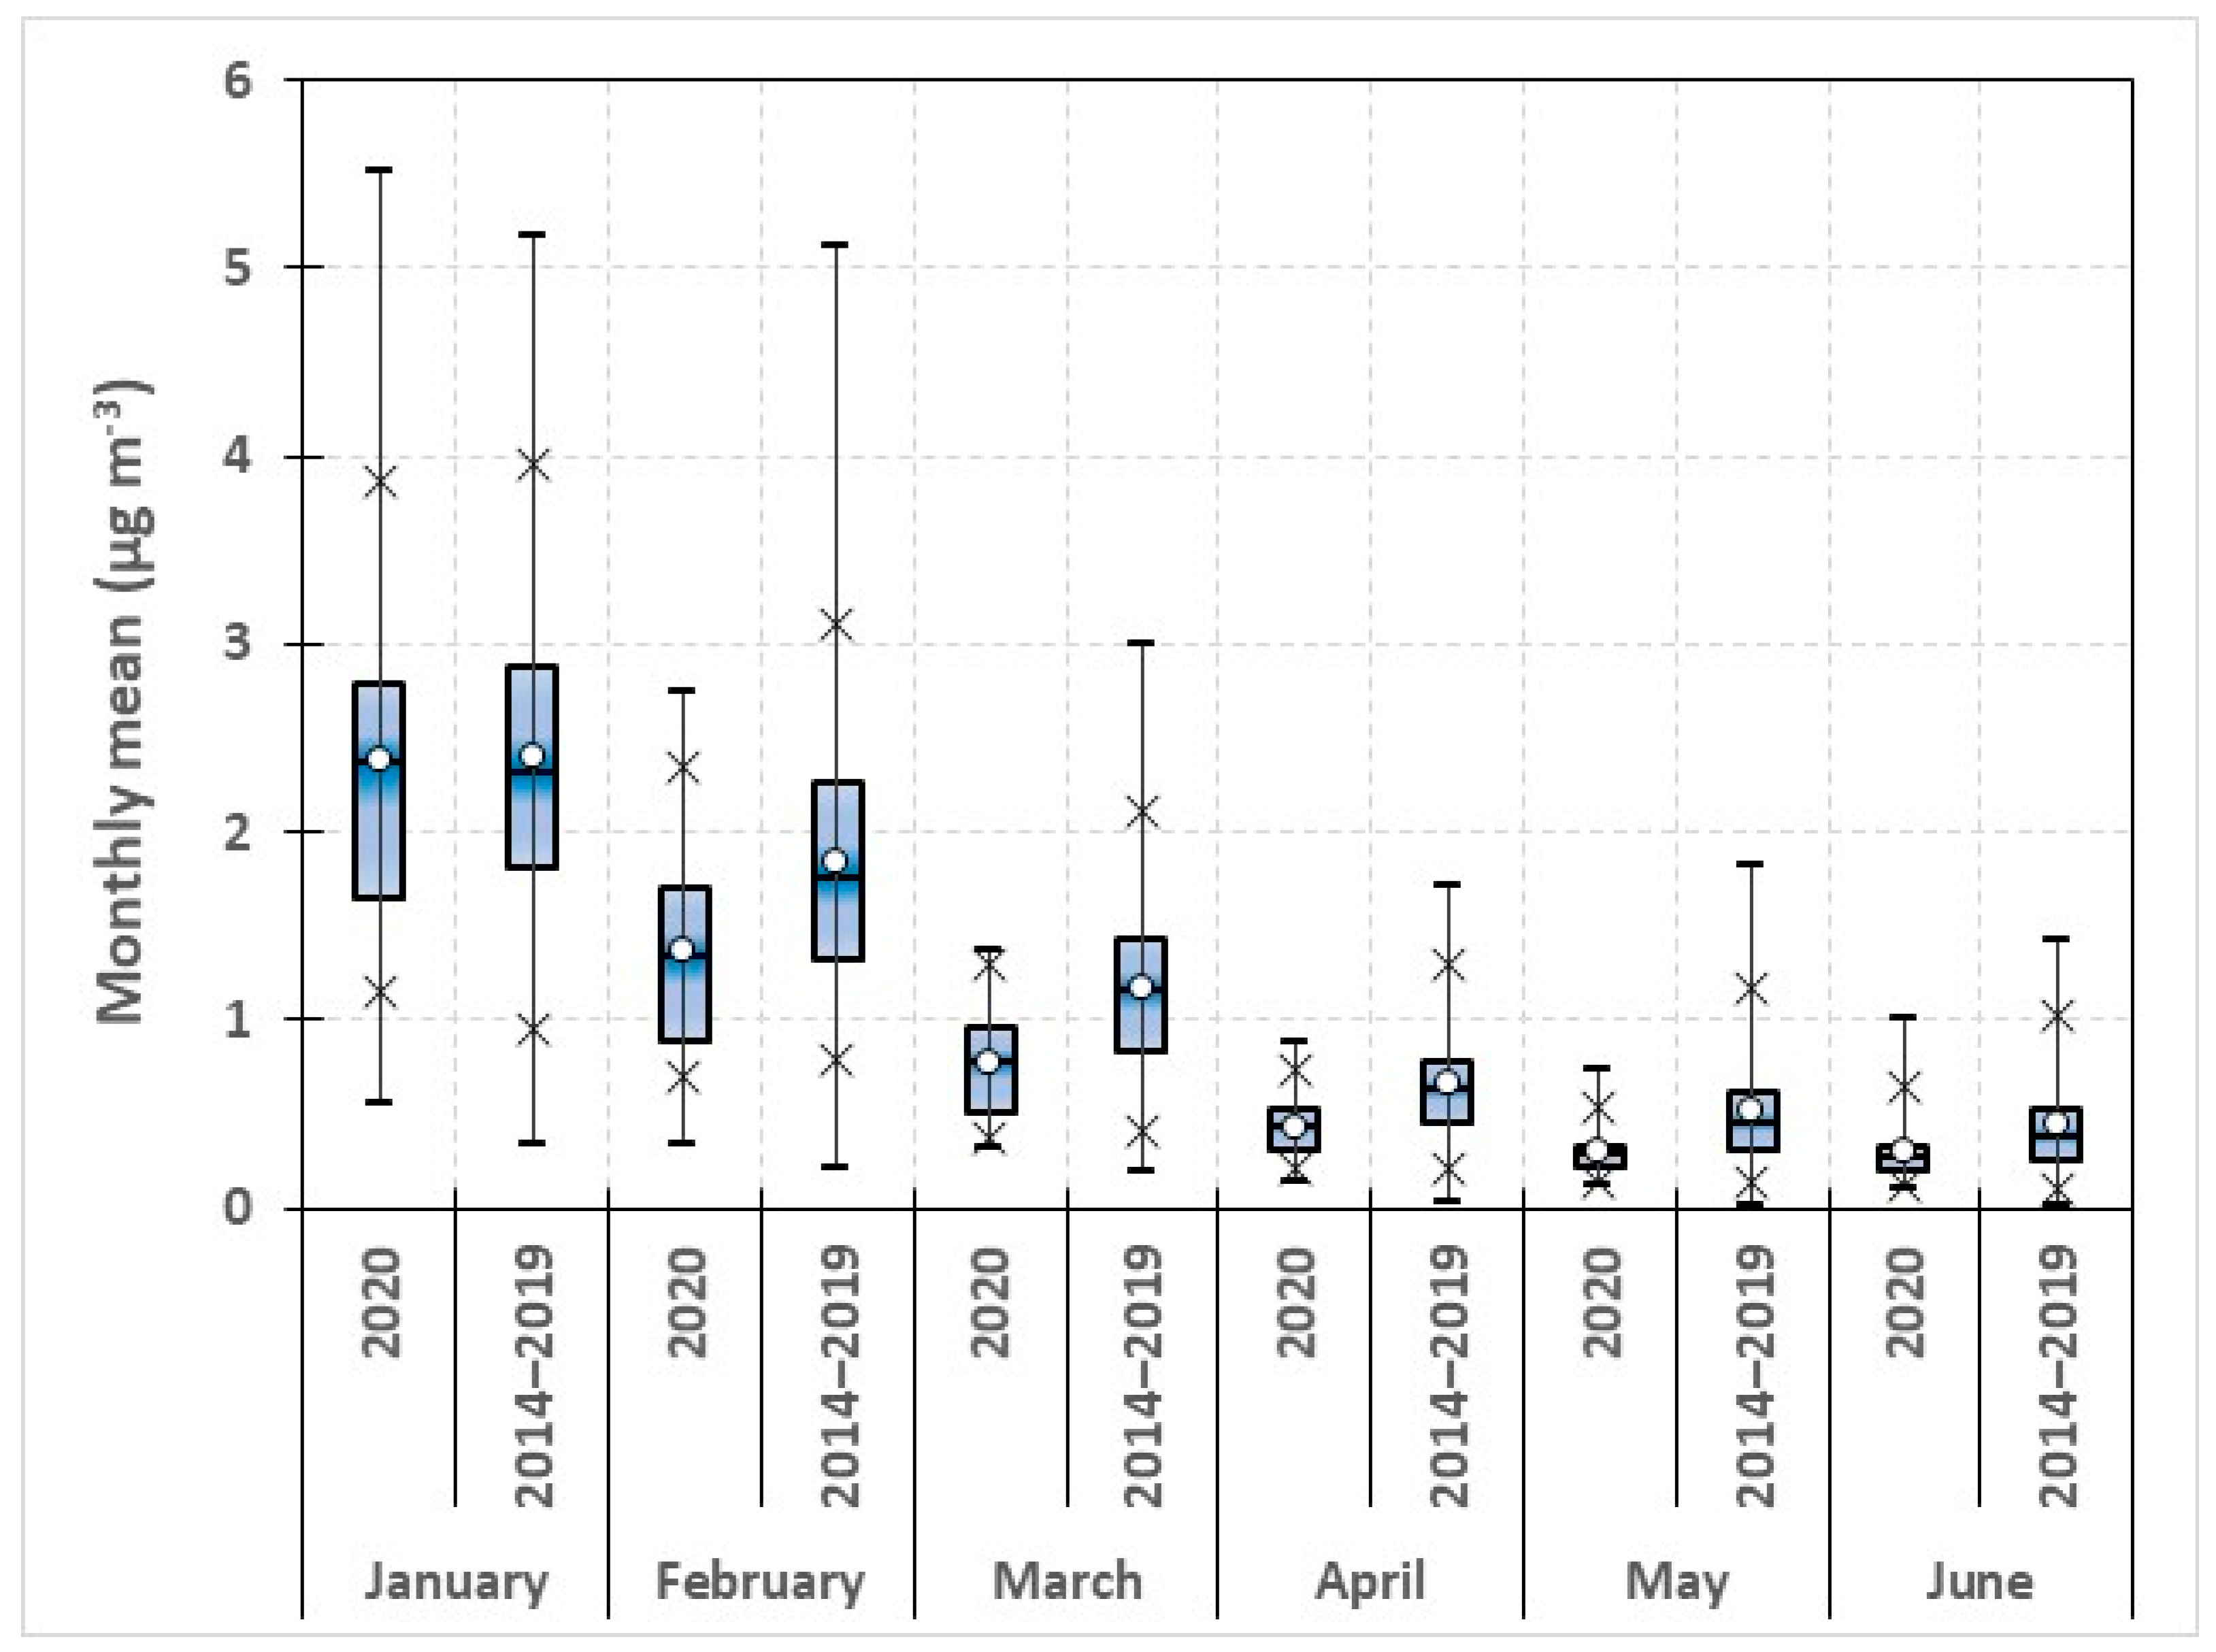
3.2. Benzene
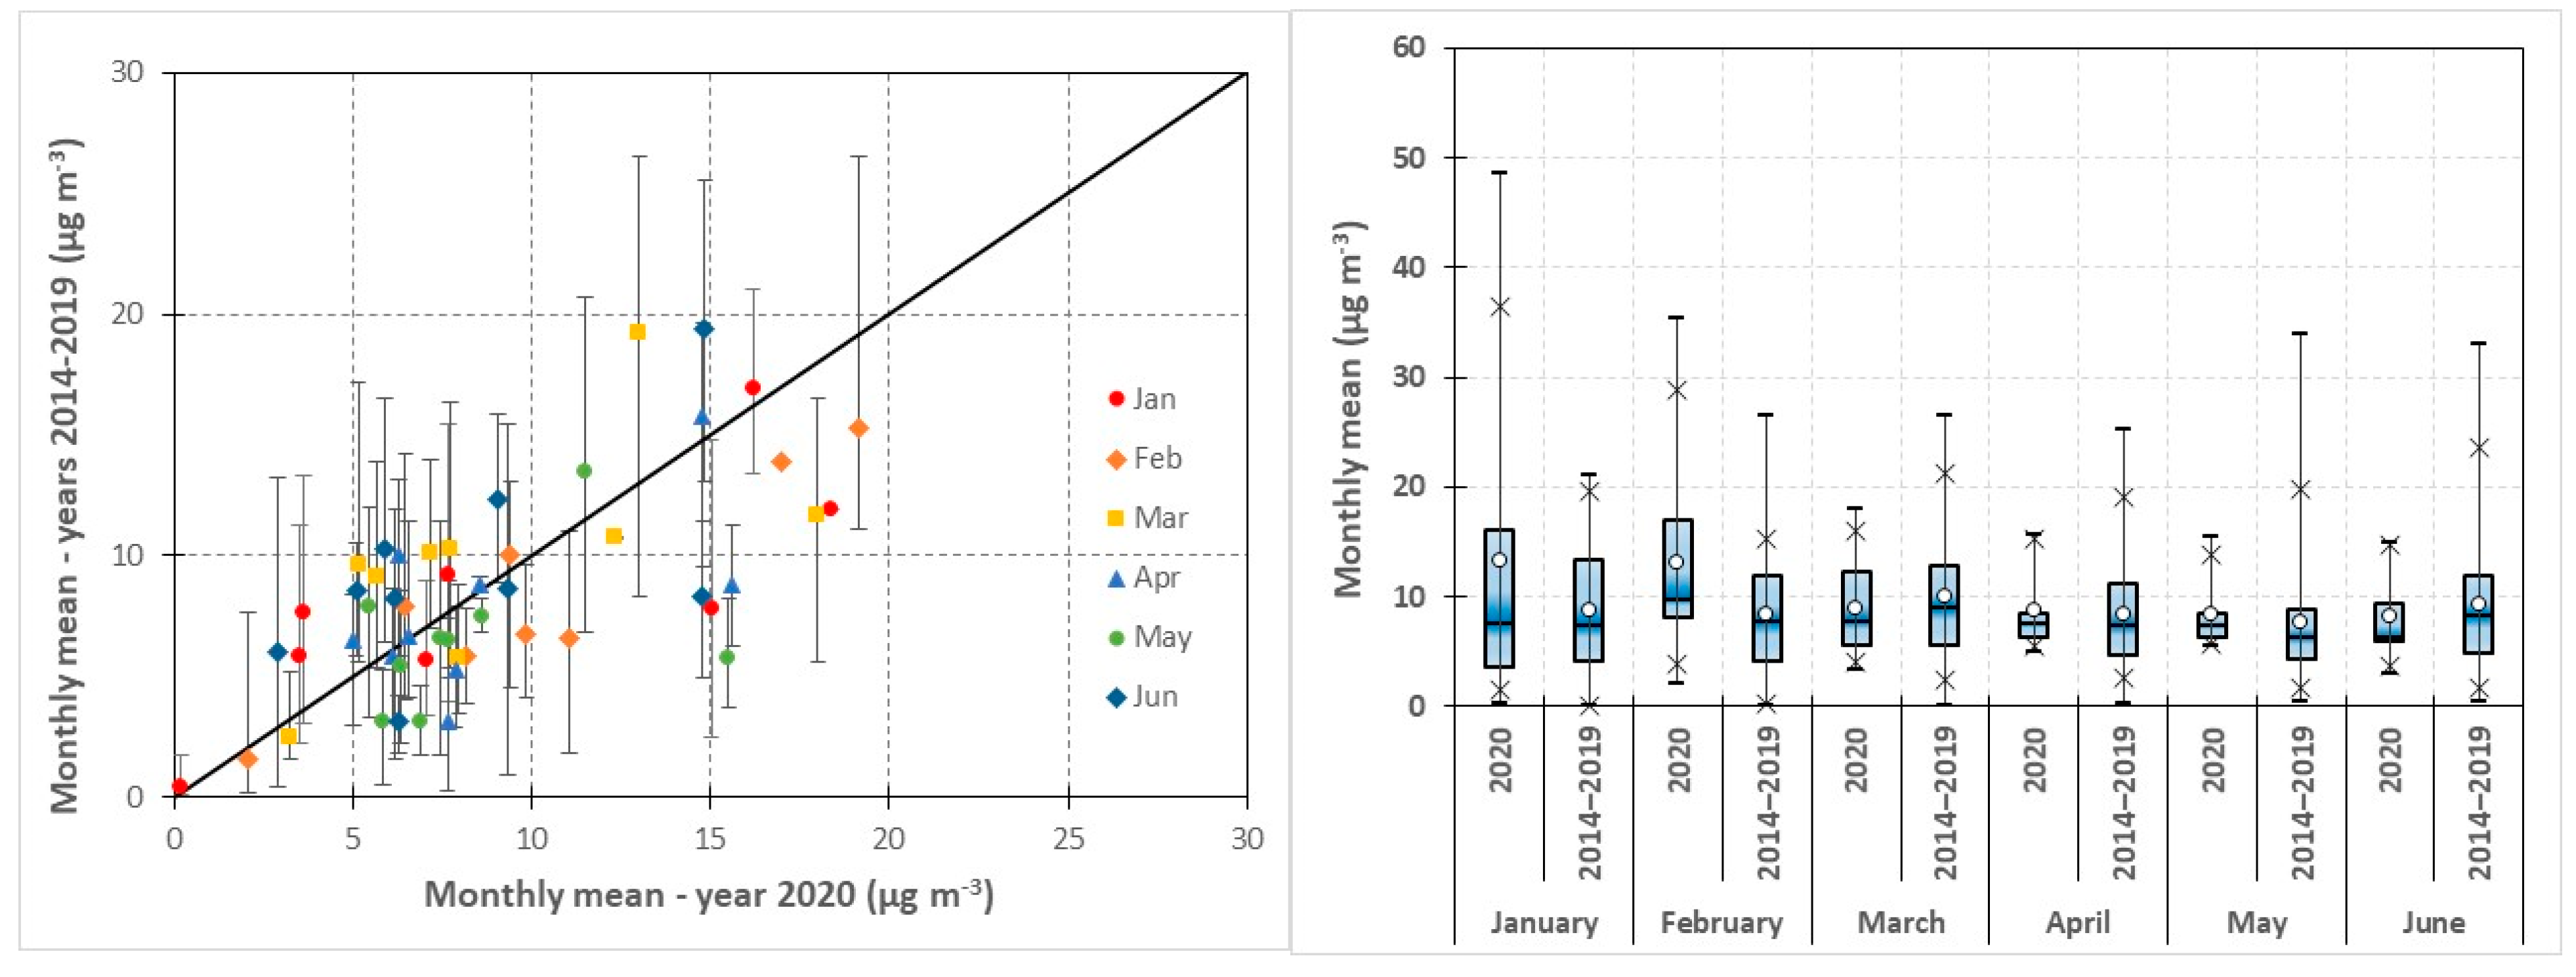
3.3. NH3
4. Conclusions
- The long-term air quality limit for NO2 (40 µg m−3 as annual average) is likely to be respected at all the monitoring stations of the Po Valley in 2020, due to the low concentration levels recorded from March to June.
- The observed reductions for the concentration levels were consistent with what could be expected based on emission inventory and source activity data: this supports the accuracy of both these factors, and thus, the reliability of the emissions scenario during the lockdown period to be used for testing the performance of air quality models at the regional scale.
- The Po Valley appears as a rather homogeneous air basin, with urban area hot-spots where the contributions of the local emissions add up to a relatively high regional background concentration level. Indeed, the low regional background reached at the end of the lockdown period was beneficial for the following period, namely, with concentration levels in June 2020 still below the average of the previous years, in spite of the resumption of pre-lockdown activities.
- The relatively slow response of the air quality levels to the sudden decrease of the emissions confirms that the Po Valley is an air basin with a weak exchange of air masses, which favors both the build-up of atmospheric pollutants and the development of secondary formation processes.
Supplementary Materials
Author Contributions
Funding
Institutional Review Board Statement
Informed Consent Statement
Data Availability Statement
Acknowledgments
Conflicts of Interest
References
- Filippini, T.; Rothman, K.J.; Goffi, A.; Ferrari, F.; Maffeis, G.; Orsini, O.; Vinceti, M. Satellite-detected tropospheric nitrogen dioxide and spread of SARS-CoV-2 infection in Northern Italy. Sci. Total Environ. 2020, 739, 140278. [Google Scholar] [CrossRef]
- Huang, G.; Sun, K. Non-negligible impacts of clean air regulations on the reduction of tropospheric NO2 over East China during the COVID-19 pandemic observed by OMI and TROPOMI. Sci. Total Environ. 2020, 745, 141023. [Google Scholar] [CrossRef]
- Marlier, M.E.; Xing, J.; Zhu, Y.; Wang, S. Impacts of COVID-19 response actions on air quality in China. Environ. Res. Commun. 2020, 2, 075003. [Google Scholar] [CrossRef]
- Ranjan, A.K.; Patra, A.K.; Gorai, A.K. Effect of lockdown due to SARS COVID-19 on aerosol optical depth (AOD) over urban and mining regions in India. Sci. Total Environ. 2020, 745, 141024. [Google Scholar] [CrossRef] [PubMed]
- Venter, Z.S.; Aunan, K.; Chowdhury, S.; Lelieveld, J. Covid-19 lockdowns cause global air pollution declines. Proc. Natl. Acad. Sci. USA 2020, 117, 18984–18990. [Google Scholar] [CrossRef]
- Bao, R.; Zhang, A. Does lockdown reduce air pollution? evidence from 44 cities in northern China. Sci. Total Environ. 2020, 731, 139052. [Google Scholar] [CrossRef]
- Li, L.; Li, Q.; Huang, L.; Wang, Q.; Zhu, A.; Xu, J.; Liu, Z.; Li, H.; Shi, L.; Li, R.; et al. Air quality changes during the COVID-19 lockdown over the Yangtze River Delta Region: An insight into the impact of human activity pattern changes on air pollution variation. Sci. Total Environ. 2020, 732, 139282. [Google Scholar] [CrossRef]
- Pei, Z.; Han, G.; Ma, X.; Su, H.; Gong, W. Response of major air pollutants to COVID-19 lockdowns in China. Sci. Total Environ. 2020, 743, 140879. [Google Scholar] [CrossRef] [PubMed]
- Han, B.-S.; Park, K.; Kwak, K.-H.; Park, S.-B.; Jin, H.-G.; Moon, S.; Kim, J.-W.; Baik, J.-J. Air Quality Change in Seoul, South Korea under COVID-19 Social Distancing: Focusing on PM2.5. Int. J. Environ. Res. Public Health 2020, 17, 6208. [Google Scholar] [CrossRef]
- Han, C.; Hong, Y.C. Decrease in Ambient Fine Particulate Matter during COVID-19 Crisis and Corresponding Health Benefits in Seoul, Korea. Int. J. Environ. Res. Public Health 2020, 17, 5279. [Google Scholar] [CrossRef] [PubMed]
- Seo, J.H.; Jeon, H.W.; Sung, U.J.; Sohn, J.-R. Impact of the COVID-19 Outbreak on Air Quality in Korea. Atmosphere 2020, 11, 1137. [Google Scholar] [CrossRef]
- Kumar, P.; Hama, S.; Omidvarborna, H.; Sharma, A.; Sahani, J.; Abhijith, K.V.; Debele, S.E.; Zavala-Reyes, J.-C.; Barwise, Y.; Tiwari, A. Temporary reduction in fine particulate matter due to ‘anthropogenic emissions switch-off’ during COVID-19 lockdown in Indian cities. Sustain. Cities Soc. 2020, 62, 102382. [Google Scholar] [CrossRef] [PubMed]
- Broomandi, P.; Karaca, F.; Nikfal, A.; Jahanbakhshi, A.; Tamjidi, M.; Kim, J.R. Impact of COVID-19 Event on the Air Quality in Iran. Aerosol Air Qual. Res. 2020, 20, 1793–1804. [Google Scholar] [CrossRef]
- Kerimray, A.; Baimatova, N.; Ibragimova, O.; Bukenov, B.; Kenessov, B.; Plotitsyn, P.; Karaca, F. Assessing air quality changes in large cities during COVID-19 lockdowns: The impacts of traffic-free urban conditions in Almaty, Kazakhstan. Sci. Total Environ. 2020, 730, 13917. [Google Scholar] [CrossRef] [PubMed]
- Kanniah, K.D.; Zaman, N.A.F.K.; Kaskaoutis, D.G.; Latif, M.T. COVID-19's impact on the atmospheric environment in the Southeast Asia region. Sci. Total Environ. 2020, 736, 139658. [Google Scholar] [CrossRef]
- Higham, J.E.; Acosta Ramírez, C.; Green, M.A.; Morse, A.P. UK COVID-19 lockdown: 100 days of air pollution reduction? Air Qual. Atmos. Health 2020, 1–8. [Google Scholar] [CrossRef] [PubMed]
- Menut, L.; Bessagnet, B.; Siour, G.; Mailler, S.; Pennel, R.; Cholakian, A. Impact of lockdown measures to combat Covid-19 on air quality over western Europe. Sci. Total Environ. 2020, 741, 140426. [Google Scholar] [CrossRef] [PubMed]
- Tobías, A.; Carnerero, C.; Reche, C.; Massagué, J.; Via, M.; Minguillón, M.C.; Alastuey, A.; Querol, X. Changes in air quality during the lockdown in Barcelona (Spain) one month into the Sars-cov-2 epidemic. Sci. Total Environ. 2020, 726, 138540. [Google Scholar] [CrossRef] [PubMed]
- Fuwape, I.A.; Okpalaonwuka, C.T.; Ogunjo, S.T. Impact of COVID-19 pandemic lockdown on distribution of inorganic pollutants in selected cities of Nigeria. Air Qual. Atmos. Health 2021, 14, 149–155. [Google Scholar] [CrossRef]
- Otmani, A.; Benchrif, A.; Tahri, M.; Bounakhla, M.; Chakir, E.M.; El Bouch, M.; Krombi, M. Impact of Covid-19 lockdown on PM10, SO2 and NO2 concentrations in Salé City (Morocco). Sci. Total Environ. 2020, 735, 139541. [Google Scholar] [CrossRef]
- Adams, M.D. Air pollution in Ontario, Canada during the COVID-19 State of Emergency. Sci. Total Environ. 2020, 742, 140516. [Google Scholar] [CrossRef]
- Mendez-Espinosa, J.F.; Rojas, N.Y.; Vargas, J.; Pachón, J.E.; Belalcazar, L.C.; Ramírez, O. Air quality variations in Northern South America during the COVID-19 lockdown. Sci. Total Environ. 2020, 749, 141621. [Google Scholar] [CrossRef] [PubMed]
- Xiang, J.; Austin, E.; Gould, T.; Larson, T.; Shirai, J.; Liu, Y.; Marshall, J.; Seto, E. Impacts of the COVID-19 responses on traffic-related air pollution in a Northwestern US city. Sci. Total Environ. 2020, 747, 141325. [Google Scholar] [CrossRef] [PubMed]
- Cameletti, M. The Effect of Corona Virus Lockdown on Air Pollution: Evidence from the City of Brescia in Lombardia Region (Italy). Atmos. Environ. 2020, 239, 117794. [Google Scholar] [CrossRef] [PubMed]
- Collivignarelli, M.C.; Abbà, A.; Bertanza, G.; Pedrazzani, R.; Ricciardi, P.; Carnevale Miino, M. Lockdown for CoViD-2019 in Milan: What are the effects on air quality? Sci. Total Environ. 2020, 732, 139280. [Google Scholar] [CrossRef]
- Zoran, M.A.; Savastru, R.S.; Savastru, D.M.; Tautan, M.N. Assessing the relationship between ground levels of ozone (O3) and nitrogen dioxide (NO2) with coronavirus (COVID-19) in Milan, Italy. Sci. Total Environ. 2020, 740, 140005. [Google Scholar] [CrossRef] [PubMed]
- Diémoz, H.; Gobbi, G.P.; Magri, T.; Pession, G.; Pittavino, S.; Tombolato, I.K.F.; Campanelli, M.; Barnaba, F. Transport of Po Valley aerosol pollution to the northwestern Alps—Part 2: Long-term impact on air quality. Atmos. Chem. Phys. 2019, 19, 10129–10160. [Google Scholar] [CrossRef]
- Pernigotti, D.; Georgieva, E.; Thunis, P.; Bessagnet, B. Impact of meteorological modelling on air quality: Summer and winter episodes in the Po valley (Northern Italy). Int. J. Environ. Pollut. 2014, 50, 111–119. [Google Scholar] [CrossRef]
- Larsen, B.R.; Gilardoni, S.; Stenstrom, K.; Niedzialek, J.; Jimenez, J.; Belis, C.A. Sources for PM air pollution in the Po Plain, Italy: II. Probabilistic uncertainty characterization and sensitivity analysis of secondary and primary sources. Atmos. Environ. 2012, 50, 203–213. [Google Scholar] [CrossRef]
- Finardi, S.; Pellegrini, U. Systematic analysis of meteorological conditions causing severe urban air pollution episodes in the central Po Valley. In Proceedings of the 9th International Conference on Harmonisation within Atmospheric Dispersion Modelling for Regulatory Purposes, Garmish-Partenkirchen, Germany, 1–4 June 2004; pp. 250–254. [Google Scholar]
- ISPRA. Inventari Regionali delle Emissioni in Atmosfera e loro Articolazione a Livello Locale; ISPRA: Rome, Italy, 2016. Available online: https://www.isprambiente.gov.it/files/snpa/consiglio-federale/DOC78_CFInventariemisisoniinatmconallegati.pdf (accessed on 10 October 2020).
- Marongiu, A.; Angelino, E.; Fossati, G.; Moretti, M.; Peroni, E.; Pantaleo, A.; Malvestiti, G.; Abbatista, M. Aggiornamento Stima Preliminare delle Emissioni in Lombardia durante L’emergenza Covid-19 nel Periodo Febbraio Aprile. ARPA Lombardia—Settore Monitoraggi Ambientali, Modellistica dell Auqalità dell’aria e Inventari. Available online: https://www.arpalombardia.it/sites/DocumentCenter/Documents/Aria%20-%20Relazioni%20approfondimento/report%20stima%20emissiva%20COVID%2019%20lombardia_aprile20.pdf (accessed on 10 October 2020).
- Oenema, O.; Velthof, G.; Klimont, Z.; Winiwarter, W. Emissions from Agriculture and their Control Potentials. IIASA TSAP Report 3. Version 2.1.; IIASA: Laxenburg, Austria, 2012. [Google Scholar]
- Lovarelli, D.; Conti, C.; Finzi, A.; Bacenetti, J.; Guarino, M. Describing the trend of ammonia, particulate matter and nitrogen oxides: The role of livestock activities in northern Italy during Covid-19 quarantine. Environ. Res. 2020, 191, 110048. [Google Scholar] [CrossRef]
- Raimondo, S.; Benigni, B.; Domenico, M. Environmental conditions and human activity nexus. The case of Northern Italy during COVID-19 lockdown. arXiv 2020, arXiv:2010.07721. in press. Available online: https://arxiv.org/pdf/2010.07721.pdf (accessed on 10 October 2020).
- European Union. Directive 2008/50/EC of the European Parliament and of the Council of 21 May 2008 on ambient air quality and cleaner air for Europe. Off. J. Eur. Union 2008, 152, 1–44. [Google Scholar]
- European Space Agency. Coronavirus Lockdown Leading to Drop in Pollution across Europe. European Space Agency: Noordwijk, The Netherlands. Available online: https://www.esa.int/Applications/Observing_the_Earth/Copernicus/Sentinel-5P/Coronavirus_lockdown_leading_to_drop_in_pollution_across_Europe (accessed on 4 January 2021).
- Pepe, N.; Pirovano, G.; Balzarini, A.; Toppetti, A.; Riva, G.M.; Amato, F.; Lonati, G. Enhanced CAMx source apportionment analysis at an urban receptor in Milan based on source categories and emission regions. Atmos. Environ. X 2019, 2, 100020. [Google Scholar] [CrossRef]
- Lonati, G.; Cernuschi, S. Temporal and spatial variability of atmospheric ammonia in the Lombardy region (Northern Italy). Atmos. Pollut. Res. 2020, 11, 2154–2163. [Google Scholar] [CrossRef]


| Region | NO2 | Benzene | NH3 |
|---|---|---|---|
| Emilia-Romagna | 43 | 9 | - |
| Lombardia | 82 | 22 | 10 |
| Piemonte | 52 | 22 | 4 |
| Veneto | 41 | 9 | - |
| Total | 218 | 62 | 14 |
| Parameter | January | February | March | April | May | June | ||||||
|---|---|---|---|---|---|---|---|---|---|---|---|---|
| 2020 | 2014–2019 | 2020 | 2014–2019 | 2020 | 2014–2019 | 2020 | 2014–2019 | 2020 | 2014–2019 | 2020 | 2014–2019 | |
| Mean | 42.5 | 42.2 | 33.6 | 38.3 | 19.7 | 31.5 | 13.5 | 22.8 | 12.5 | 19.3 | 13.6 | 18.3 |
| St. dev. | 15.5 | 16.0 | 13.2 | 15.8 | 8.3 | 14.4 | 6.2 | 11.8 | 5.8 | 11.3 | 6.7 | 10.5 |
| Minimum | 2.1 | 1.2 | 1.4 | 1.9 | 2.4 | 1.5 | 1.1 | 1.6 | 0.7 | 0.7 | 0.2 | 1.0 |
| Maximum | 88.4 | 113.1 | 80.2 | 99.3 | 47.3 | 97.3 | 36.4 | 76.2 | 30.5 | 80.9 | 38.5 | 64.8 |
| q1 | 33.9 | 32.3 | 26.5 | 28.4 | 14.4 | 22.2 | 8.9 | 14.7 | 8.5 | 11.6 | 9.1 | 10.9 |
| q2 | 41.7 | 40.9 | 33.7 | 36.7 | 19.6 | 30.0 | 13.1 | 20.6 | 12.1 | 16.6 | 12.7 | 16.1 |
| q3 | 50.7 | 51.3 | 41.5 | 47.7 | 24.3 | 40.3 | 17.2 | 29.2 | 15.3 | 24.7 | 16.9 | 23.2 |
| p5 | 15.3 | 17.2 | 11.3 | 14.0 | 6.6 | 9.5 | 4.3 | 7.0 | 4.8 | 5.5 | 5.2 | 5.5 |
| p95 | 71.2 | 70.3 | 56.3 | 66.2 | 34.8 | 56.6 | 23.2 | 44.8 | 24.4 | 40.7 | 26.9 | 38.6 |
| N | 218 | 1275 | 218 | 1278 | 218 | 1277 | 218 | 1276 | 218 | 1278 | 218 | 1283 |
| Means Test | non reject | reject | reject | reject | reject | reject | ||||||
| K-S test | non reject | reject | reject | reject | reject | reject | ||||||
| Range | January | February | March | April | May | June |
|---|---|---|---|---|---|---|
| <q114–19 | 0.0% | 17.2% | 51.6% | 50.0% | 29.0% | 6.7% |
| q214–19–q114–19 | 32.3% | 48.3% | 48.4% | 50.0% | 67.7% | 80.0% |
| q314–19–q214–19 | 64.5% | 34.5% | 0.0% | 0.0% | 3.2% | 13.3% |
| >q314–19 | 3.2% | 0.0% | 0.0% | 0.0% | 0.0% | 0.0% |
| Parameter | January | February | March | April | May | June | ||||||
|---|---|---|---|---|---|---|---|---|---|---|---|---|
| 2020 | 2014–19 | 2020 | 2014–19 | 2020 | 2014–19 | 2020 | 2014–19 | 2020 | 2014–19 | 2020 | 2014–19 | |
| Mean | 2.4 | 2.4 | 1.4 | 1.8 | 0.8 | 1.2 | 0.4 | 0.7 | 0.3 | 0.5 | 0.3 | 0.4 |
| St. dev. | 1.0 | 0.9 | 0.5 | 0.7 | 0.3 | 0.5 | 0.2 | 0.3 | 0.1 | 0.4 | 0.2 | 0.3 |
| Minimum | 0.6 | 0.3 | 0.3 | 0.1 | 0.3 | 0.2 | 0.1 | 0.0 | 0.1 | 0.0 | 0.0 | 0.0 |
| Maximum | 5.5 | 5.2 | 2.8 | 5.1 | 1.4 | 3.0 | 0.9 | 3.2 | 0.7 | 3.2 | 1.0 | 3.9 |
| q1 | 1.7 | 1.8 | 0.9 | 1.3 | 0.5 | 0.8 | 0.3 | 0.5 | 0.2 | 0.3 | 0.2 | 0.3 |
| q2 | 2.4 | 2.3 | 1.4 | 1.8 | 0.8 | 1.2 | 0.4 | 0.6 | 0.3 | 0.5 | 0.3 | 0.4 |
| q3 | 2.8 | 2.9 | 1.7 | 2.3 | 1.0 | 1.4 | 0.5 | 0.8 | 0.3 | 0.6 | 0.3 | 0.5 |
| p5 | 1.2 | 0.9 | 0.7 | 0.8 | 0.4 | 0.4 | 0.2 | 0.2 | 0.1 | 0.1 | 0.1 | 0.1 |
| p95 | 3.9 | 4.0 | 2.3 | 3.1 | 1.3 | 2.1 | 0.7 | 1.3 | 0.5 | 1.2 | 0.6 | 1.0 |
| N | 62 | 353 | 62 | 355 | 62 | 355 | 62 | 357 | 62 | 357 | 62 | 356 |
| Means Test | non reject | reject | reject | reject | reject | reject | ||||||
| K-S test | non reject | reject | reject | reject | reject | reject | ||||||
| Range | January | February | March | April | May | June |
|---|---|---|---|---|---|---|
| <q114–19 | 16.1% | 44.8% | 77.4% | 53.3% | 61.3% | 10.0% |
| q214–19–q114–19 | 19.4% | 44.8% | 22.6% | 46.7% | 38.7% | 90.0% |
| q314–19–q214–19 | 45.2% | 10.3% | 0.0% | 0.0% | 0.0% | 0.0% |
| >q314–19 | 19.4% | 0.0% | 0.0% | 0.0% | 0.0% | 0.0% |
| Parameter | January | February | March | April | May | June | ||||||
|---|---|---|---|---|---|---|---|---|---|---|---|---|
| 2020 | 2014–19 | 2020 | 2014–19 | 2020 | 2014–19 | 2020 | 2014–19 | 2020 | 2014–19 | 2020 | 2014–19 | |
| Mean | 13.4 | 8.7 | 13.2 | 8.4 | 8.9 | 10.0 | 8.7 | 8.4 | 8.4 | 7.7 | 8.3 | 9.4 |
| St. dev. | 14.6 | 5.8 | 9.8 | 5.7 | 4.6 | 5.9 | 3.8 | 5.1 | 3.2 | 6.2 | 4.2 | 6.6 |
| Minimum | 0.2 | 0.1 | 2.1 | 0.1 | 3.3 | 0.1 | 5.0 | 0.3 | 5.5 | 0.5 | 2.9 | 0.5 |
| Maximum | 48.5 | 21.0 | 35.4 | 26.6 | 18.0 | 26.6 | 15.6 | 25.3 | 15.5 | 33.9 | 14.8 | 33.0 |
| q1 | 3.6 | 4.2 | 8.2 | 4.2 | 5.7 | 5.6 | 6.3 | 4.8 | 6.3 | 4.4 | 5.9 | 4.9 |
| q2 | 7.7 | 7.4 | 9.9 | 7.8 | 7.7 | 9.0 | 7.6 | 7.3 | 7.4 | 6.3 | 6.3 | 8.4 |
| q3 | 16.2 | 13.4 | 17.0 | 12.0 | 12.3 | 12.9 | 8.5 | 11.3 | 8.6 | 8.9 | 9.3 | 11.9 |
| p5 | 1.5 | 0.1 | 3.8 | 0.3 | 4.0 | 2.4 | 5.4 | 2.6 | 5.6 | 1.7 | 3.8 | 1.6 |
| p95 | 36.5 | 19.6 | 28.9 | 15.4 | 16.0 | 21.3 | 15.3 | 19.1 | 13.9 | 19.9 | 14.8 | 23.6 |
| N | 9 | 48 | 9 | 48 | 9 | 52 | 9 | 48 | 9 | 45 | 9 | 45 |
| Means Test | non reject | non reject | non reject | non reject | non reject | non reject | ||||||
Publisher’s Note: MDPI stays neutral with regard to jurisdictional claims in published maps and institutional affiliations. |
© 2021 by the authors. Licensee MDPI, Basel, Switzerland. This article is an open access article distributed under the terms and conditions of the Creative Commons Attribution (CC BY) license (http://creativecommons.org/licenses/by/4.0/).
Share and Cite
Lonati, G.; Riva, F. Regional Scale Impact of the COVID-19 Lockdown on Air Quality: Gaseous Pollutants in the Po Valley, Northern Italy. Atmosphere 2021, 12, 264. https://doi.org/10.3390/atmos12020264
Lonati G, Riva F. Regional Scale Impact of the COVID-19 Lockdown on Air Quality: Gaseous Pollutants in the Po Valley, Northern Italy. Atmosphere. 2021; 12(2):264. https://doi.org/10.3390/atmos12020264
Chicago/Turabian StyleLonati, Giovanni, and Federico Riva. 2021. "Regional Scale Impact of the COVID-19 Lockdown on Air Quality: Gaseous Pollutants in the Po Valley, Northern Italy" Atmosphere 12, no. 2: 264. https://doi.org/10.3390/atmos12020264
APA StyleLonati, G., & Riva, F. (2021). Regional Scale Impact of the COVID-19 Lockdown on Air Quality: Gaseous Pollutants in the Po Valley, Northern Italy. Atmosphere, 12(2), 264. https://doi.org/10.3390/atmos12020264