Abstract
The spatio-temporal characteristics of particulate matter with a particle size less than or equal to 2.5 μm (PM2.5), particulate matter with a particle size less than or equal to 10 μm (PM10), meteorological parameters from September 2018 to September 2019, and Cloud-Aerosol Lidar and Infrared Pathfinder Satellite Observation (CALIPSO) aerosol optical depth (AOD) from 2007 to 2019 were investigated over the Central Line Project of China’s South-North Water Diversion (CSNWD) in Henan Province. To better understand the characteristics of the atmospheric environment over the CSNWD, air quality monitoring stations were installed in Nanyang (in the upper reaches), Zhengzhou (in the middle reaches), and Anyang (in the lower reaches). In this study, daily, monthly, and seasonal statistical analyses of PM2.5 and PM10 concentrations were performed and their relationship with meteorological parameters was investigated. The results show extremely poor air quality conditions over the Zhengzhou Station compared with the Nanyang and Anyang Stations. The annual average PM2.5 concentration did not meet China’s ambient air secondary standard (35 μg/m3 annual mean) over all the stations, while the annual average PM10 concentration satisfied China’s ambient air secondary standard (100 μg/m3 annual mean) over the Anyang and Nanyang Stations, except for the Zhengzhou Station. The highest PM2.5 and PM10 concentrations were observed during winter compared with the other seasons. The results show that PM2.5 and PM10 concentrations were negatively correlated with wind speed and temperature at the Nanyang and Zhengzhou Stations, but positively correlated with relative humidity. However, no significant negative or positive correlation was observed at Anyang Station. There is a strong linear positive correlation between PM2.5 and PM10 (R = 0.99), which indicates that the particulate matter at the three stations was mainly caused by local emissions. Additionally, the AOD values at the three stations were the highest in summer, which may be related to the residues of crops burned in Henan Province in summer.
1. Introduction
Air pollution has become a more serious problem with the development of the economy and urbanization and emissions from industrial and motor vehicles [1,2,3,4]. Among various air indicators, particulate matter with a particle size less than or equal to 2.5 μm (PM2.5) and particulate matter with a particle size less than or equal to 10 μm (PM10) are the main components of air pollutants [5,6,7,8] that can enter the body and affect human health [9,10,11], causing ischemic heart disease, chronic obstructive pneumonia, and other diseases in the population [12,13,14,15,16]. Additionally, air pollution in China affects the downwind regions [17,18,19].
In recent years, with the accumulation of PM2.5 and PM10 data over time, researchers have studied the spatio-temporal characteristics of PM2.5 and PM10 concentrations and provided theoretical and technical support for the prevention and control of air pollution [20,21,22,23]. For example, Yang et al. [24] studied the spatio-temporal characteristics of PM2.5 and PM10 over Chengdu from 2009 to 2011 and investigated their relationship with meteorological factors using statistical methods. Srishti et al. [25] investigated the spatio-temporal characteristics of atmospheric PM2.5 and PM10 over Delhi from 2013 to 2016. Elena et al. [26] analyzed the PM2.5 and PM10 characteristics and their chemical composition over the urban area of Naples.
The Central Line Project of China’s South-North Water Diversion (CSNWD) is a project that transfers water from the Danjiangkou reservoir in the upper and middle reaches of the Han River, the largest tributary of the Yangtze River, to Henan, Hebei, Beijing, Tianjin, and other places to alleviate the local water resources crisis. It can promote the economic development of central China [27,28]. The upper, middle, and lower reaches of the CSNWD have achieved good results in water resources and soil pollution prevention and control [29,30,31], but research on air pollution has not been conducted yet. At the same time, a comprehensive analysis of the concentrations of PM2.5 and PM10 in multiple areas can provide theoretical support for the prevention and control of atmospheric pollution in certain areas as well as engineering projects. In this study, spatio-temporal characteristics of PM2.5, PM10, and aerosol optical depth (AOD) were investigated in three different areas of the Henan section of the CSNWD, including upstream (Nanyang), midstream (Zhengzhou), and downstream (Anyang). By analyzing the concentration of PM2.5 and PM10 and investigating their relationships with wind speed, wind direction, temperature, and humidity, we provide theoretical support to control air pollution levels over the CSNWD.
2. Study Region and Meteorology
2.1. Geography of the Study Area
Henan is located in the middle-eastern part of China, the middle and lower reaches of the Yellow River, east of Anhui and Shandong, north of Hebei and Shanxi, west of Shanxi, and south of Hubei (Figure 1). The CSNWD is 1277 km in length, with 731 km in Henan province, accounting for 57% of the total length [12]. Across the Yellow River are the Yangtze River, the Huaihe River, and the Haihe four waters. Nanyang is located in the upper reaches of the CSNWD, and its monitoring station (112°27′29″ E, 32°59′38″ N) is located in the northeast of the main urban area of Nanyang City. It is upwind of the urban area and is less affected by the urban heat island effect. It is surrounded by farmland with flat and open terrain. Nanyang is located in the transition zone from the subtropical zone to the temperate zone, belonging to a continental monsoon humid and sub-humid climate with four distinct seasons. The annual rainfall is 703.6–1173.4 mm, decreasing from southeast to northwest. The annual sunshine duration is 1897.9 to 2120.9 h, and the annual frost-free period is 220 to 245 days. Zhengzhou is located in the middle reaches of the Henan section of the CSNWD. The monitoring station (32°59′38″ E, 113°34′9″ N) is located in the southwest of the main urban area, close to the main canal, and is surrounded by construction sites and urban main roads.
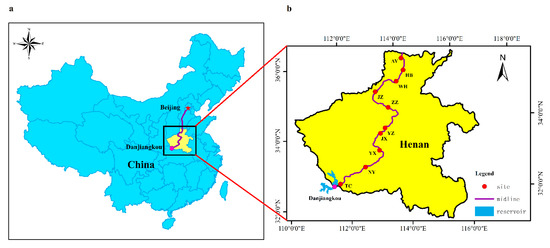
Figure 1.
Distribution of atmospheric monitoring stations in the Central Line Project of China’s South-North Water Diversion. The red box part indicates the three stations studied in this paper. (a) location of Henan Province in China; (b) location of atmospheric monitoring stations in Henan Section of CSNWD.
Zhengzhou has a northern temperate continental monsoon climate with frequent alternation of cold and warm air masses and four distinct seasons. The winter is dry and cold with little rain, and the summer is hot and rainy. Anyang Station (114°14′24″ E, 36°05′34″ N) is located in the lower reaches of the Henan section of the CSWND. Its monitoring station is located in the west of the main urban area, surrounded by national highways, and many vehicles pass nearby.
Anyang is located in a warm northern temperate zone, with a continental monsoon climate with four distinct seasons and suitable temperatures, but it is extremely cold and hot, with alternating droughts and floods. The average temperature is 12.7–13.7 °C, the average precipitation is 581.1–693.1 mm, and the four seasons’ wind direction is mostly controlled by high air currents.
2.2. Methods
In order to study the spatial and temporal characteristics of PM2.5, PM10, and AOD in the Henan section of the CSNWD, air quality monitoring stations were installed in Nanyang, Zhengzhou, and Anyang, respectively. PM2.5 concentration, PM10 concentration, wind speed, wind direction, relative humidity, temperature, and other parameters of the three stations were obtained with a time resolution of 0.5 h. The monitoring period is from October 2018 to September 2019. These stations can truly reflect the specific situation of the atmospheric environment in the upper, middle, and lower reaches of the Henan section of the CSNWD, and provide a data reference for atmospheric environmental quality. The overall characteristics of PM2.5, PM10, wind speed, wind direction, relative humidity, and temperature in the three stations were analyzed. The seasons were divided into spring (March to May), summer (June to August), autumn (September to November), and winter (December to February) to study the seasonal variation. The monthly and seasonal variations of the six parameters were calculated, and the air quality of the three stations is discussed. Meanwhile, a correlation analysis between PM2.5, PM10, and the seasonal changes in meteorological parameters was conducted to understand the influence of seasonal parameters on PM2.5 and PM10 concentrations. The diurnal variation of the six parameters was calculated and its variation rule was analyzed.
3. Results and Discussion
3.1. Overall Concentration Profile
The probability density distribution of PM2.5 and PM10 mass concentrations at Nanyang, Zhengzhou, and Anyang Station is shown in Figure 2. The average annual concentration distribution of PM2.5 and PM10 at Nanyang Station (Figure 2a,b) was roughly the same, with “low in the middle” and “high on both sides” appearing in the image. Both were concentrated in the 40–100 μg/m3 range, and the overall concentration was less than 100 μg/m3. The maximum probability of both PM2.5 and PM10 concentrations coincides at 90 μg/m3. The annual average concentrations of PM2.5 and PM10 were 59.13 μg/m3 and 66.62 μg/m3, respectively (Figure 2g and Table 1). According to China’s secondary quality standards for the annual average concentration of PM2.5 and PM10 (35 μg/m3 for PM2.5 and 70 μg/m3 for PM10) (GB3095—2012), the concentration of PM2.5 exceeded the standard by 0.68 times, and the concentration of PM10 met the standard. For Zhengzhou Station, there was a certain difference in the distribution of PM2.5 and PM10 average annual concentration, with a wide range of concentration fluctuations, mainly concentrated in the 40~200 μg/m3 range, but generally less than 200 μg/m3. The maximum probability of PM2.5 concentration appeared at 100 μg/m3 and 140 μg/m3, and the maximum probability of PM10 concentration appeared at 110 μg/m3 and 140 μg/m3 (Figure 2c,d). The annual average concentration of PM2.5 was 110.07 μg/m3, while that of PM10 was 124.21 μg/m3. The concentration of PM2.5 and PM10 exceeded China’s secondary quality standards by 2.14 and 0.77 times, respectively. The annual average concentration trend of PM2.5 and PM10 at Anyang Station was roughly the same, and the concentration mainly fell within the 0~100 μg/m3 range (Figure 2e,f). The maximum probability of PM2.5 and PM10 concentration was 10 μg/m3 and 20 μg/m3, respectively. The annual average concentration of PM2.5 was 53.69 μg/m3, and that of PM10 was 60.50 μg/m3. The concentration of PM2.5 exceeded the standard by 0.53 times, whereas PM10 met the national standard.
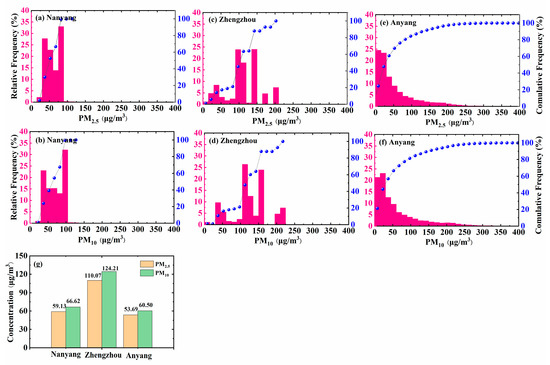
Figure 2.
Distribution of particulate matter with a particle size less than or equal to 2.5 μm (PM2.5) and particulate matter with a particle size less than or equal to 10 μm (PM10) concentration at the Nanyang (a,b), Zhengzhou (c,d), and Anyang (e,f) monitoring stations. (g) annual averages of PM2.5 and PM10.

Table 1.
Annual statistics of PM2.5 and PM10 mass concentrations at the Nanyang, Zhengzhou, and Anyang monitoring stations.
Accordingly, the concentration of PM2.5 at Nanyang Station, in the upper reaches of the Henan section of the CSNWD, exceeded the standard by 0.68 times, and PM10 met the requirements; however, PM2.5 is more harmful to the body, which indicates that the atmospheric environment in the upstream was not very good [32,33]. The main reason is the fact that the existing energy structure of Nanyang city is still predominantly powered by thermal and fossil fuels; additionally, wintertime traditional domestic heating also leads to the emission of a large number of pollution particles. The Management Office of Nanyang is located at the boundary between city and urban areas, where traffic, various ongoing construction projects, and surrounding residents’ activities will increase the concentration of particulate matter in the atmosphere. The concentration of PM2.5 and PM10 at Zhengzhou Station, in the middle reaches, exceeded the standard by 2.14 and 0.77 times, respectively, which indicates serious pollution and that the atmospheric environment in the middle reaches was also poor. The reason is that Zhengzhou is a central city in the central Plains city cluster with a large population and a lot of traffic. The Zhengzhou Management Office is located in the suburbs, with more building dust. The concentration of PM2.5 at the downstream Anyang Station exceeded the standard by 0.53 times, whereas the concentration of PM10 was in line with the national standard, indicating that the atmospheric environment downstream was relatively poor, mainly due to local emissions. The Anyang Management Office is located at the boundary between urban and rural areas, and there are many industrial and mining enterprises in the surrounding area. Frequent vehicle traffic leads to relatively high pollutant emissions [34].
Therefore, in comparison, the middle reaches of the Henan section (Zhengzhou) of the CSNWD have the most serious pollution, followed by the upstream reaches (Nanyang), and the least pollution was found in the lower reaches (Anyang). Additionally, the concentration of PM2.5 in the upper, middle, and lower reaches exceeded the standard, but the concentration of PM10 in the upper and lower reaches remained below the standard, indicating that there is an extremely urgent need to improve the atmospheric environment in the upper, middle, and lower reaches of the CSNWD.
In terms of meteorological parameters, at Nanyang Station, the temperature (T) and humidity (RH) were distributed in a “hill” shape (Figure 3a,b). The temperature range was approximately −6 °C to 40 °C, and the maximum probability appeared at 25 °C. The temperature difference was large, which corresponds to the climate of Nanyang. The humidity (RH) range was 5%~100%, the overall distribution was relatively uniform, and the probability of occurrence of the maximum value was 40%. The annual mean temperature was 16.49 °C, and the annual mean humidity (RH) was 56.90%, which is consistent with the climatic characteristics of Nanyang as a transition zone from subtropical to temperate (Table 2). Wind speed (W) was mainly concentrated in the range of 0~2 m/s, with the maximum probability of 1 m/s. Strong winds of 6 m/s occasionally occurred, with the annual average wind speed of 1.25 m/s. The wind direction (V) was mainly concentrated in the 0~100° and 300~360° range, with an occasional wind direction of 180° and a maximum probability of 0° and 320°. This indicates that the Nanyang Management Office is dominated by northerly winds, and the wind speed is relatively low.
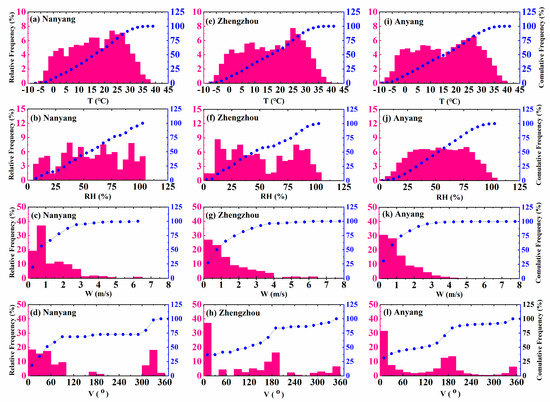
Figure 3.
Probability density distribution of meteorological parameters at the Nanyang (a–d), Zhengzhou (e–f), and Anyang (i–l) monitoring stations.
Table 2.
Annual statistics of meteorological parameters at the Nanyang, Zhengzhou, and Anyang monitoring stations.
The temperature (T) at Zhengzhou Station had an approximately normal distribution, and the humidity (RH) had close to a “mountain” distribution. The temperature (T) ranged from −8 °C to 40 °C, and the maximum probability appeared at 25 °C, with a large temperature difference; the humidity (RH) ranged from 5% to 105%, and the maximum probability was 40% (Figure 3e,f). The annual average temperature was 16.44 °C, and the annual average humidity was 51.65%, which accorded with the characteristics of Zhengzhou’s continental monsoon climate in the northern temperate zone (Table 2). The wind speed (W) was mainly concentrated within the 0~4 m/s range, with the maximum probability of 0 m/s. There were also occasional strong winds of 6 m/s, with an average annual wind speed of 1.36 m/s. The wind direction (V) mainly ranged between approximately 170° and 190°, with the maximum probability occurring at 0° (Figure 3g,h). These results show that the Zhengzhou Management Office is also dominated by southerly winds, and the wind speed is relatively low.
The probability density distribution of meteorological parameters at Anyang Station is shown in Figure 3i–l. The temperature (T) and humidity (RH) were approximately in line with a normal distribution. The temperature (T) ranged from −10 °C to 40 °C, with the maximum probability occurring at 28 °C. The humidity (RH) ranged from 0% to 10%, with a maximum probability of 80%. The annual average temperature was 15.68 °C and the annual average humidity was 54.49%, which coincides with the characteristics of the continental monsoon climate in the warm temperate zone. The wind speed (W) mainly ranged from 0 m/s to 2 m/s, with the maximum probability of 0 m/s and the annual average wind speed of 1.02 m/s. The range of wind direction (V) was mainly concentrated at 0° and 180° and the maximum probability of occurrence was 0°. These results indicate that the wind at Anyang Management Office is mainly in the north, followed by the south, and occasionally there are winds in other directions. The wind speed is low all year round.
To sum up, it can be seen that Nanyang Station and Zhengzhou Station behaved roughly the same in terms of temperature (T), humidity (RH), wind speed (W), and wind direction (V), while the wind direction at Anyang Station in the lower reaches was slightly different from that of the upper (Nanyang Station) and middle reaches (Zhengzhou Station).
3.2. Seasonal Variations
3.2.1. Seasonal Characteristics of PM10, PM2.5, and Meteorological Parameters
The box charts of PM2.5 and PM10 changes at the three monitoring stations are shown in Figure 4. The PM2.5 concentration at Nanyang Station was not greatly affected by seasonal changes. It was highest in January (65.39 μg/m3) and lowest in May (56.14 μg/m3). Overall, it was the highest in winter (63.97 μg/m3) and the lowest in summer (57.16 μg/m3). At Zhengzhou Station, the concentration of PM2.5 was the highest among the three stations. The highest value appeared in November (123 μg/m3), whereas the lowest appeared in June (94.28 μg/m3), still showing the trend of the highest concentration in winter (117.51 μg/m3) and the lowest concentration in summer (95.55 μg/m3). However, the concentration of PM2.5 at Anyang Station had a more obvious seasonal variation. In winter (97.96 μg/m3), it was much higher than that in summer (18.95 μg/m3), with the highest value in November (116.94 μg/m3) and the lowest value in May (16.19 μg/m3). PM10 and PM2.5 showed a similar seasonal change trend, with the highest in winter and the lowest in summer on the whole.
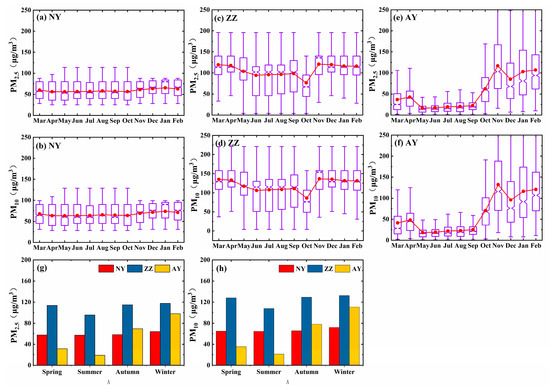
Figure 4.
Box plot of monthly changes of PM2.5 and PM10 mass concentrations at the Nanyang (NY) (a,b), Zhengzhou (ZZ) (c,d), and Anyang (AY) (e,f) monitoring stations. (g) Seasonal changes of PM2.5 mass concentrations and (h) seasonal changes of PM10 mass concentrations. The upper and lower edges of the box-shaped rectangle represent 10% and 90% of the values, respectively, while the synapses represent the standard deviation of each parameter.
In regard to temperature (T), it can be seen from Figure 5 and Table 3 that for all the three monitoring stations it had a strong seasonal variation, with the highest temperature in summer and the lowest in winter, with the peak temperature appearing in July, and the minimum temperature appearing in January, which is consistent with the local climate characteristics. The humidity (RH) also showed an obvious seasonal variation. Nanyang Station had the highest humidity (80.81%) in winter and the lowest humidity (29.88%) in summer. Similarly, Zhengzhou Station experienced the highest humidity in winter (74.63%) and the lowest humidity in summer (23.18%), with the maximum in November (79.85%), and the minimum in July (22.44). Anyang Station behaved slightly different. The humidity was the highest (64.74%) in autumn and the lowest in spring (45.48), occurring the highest in November (70.45%) and the lowest in March (37.48). Overall, of the three stations, Nanyang Station had the highest humidity, and Anyang station had the lowest. With respect to the wind speed (W), for all three stations, it fluctuated slightly under the influence of seasons. On the whole, the wind speed was higher in spring and summer than in autumn and winter. The wind speed at Nanyang Station was the maximum in July (1.58 m/s) and the minimum in January (0.85 m/s). Zhengzhou Station had the highest wind speed (2.01 m/s) in June and the lowest (0.73 m/s) in November. Anyang Station experienced the maximum in May (1.38 m/s) and the minimum in October (0.81 m/s). In terms of the seasonal variation in wind direction, the wind direction (V) of the three monitoring stations only had a small fluctuation due to the seasonal influence. Nanyang Station had the largest wind direction value in autumn, with the maximum value in November (153.91°); the minimum value occurred in summer, being the least value in June (105.48°). At Zhengzhou Station, the largest variation occurred in summer, with the maximum value appearing in August (153.91°) and the minimum value appearing in November (88.44°). The wind direction value at Anyang Station in spring was higher than that in winter, but the maximum value appeared in May (138.38°) and the minimum value appeared in August (103.42°).
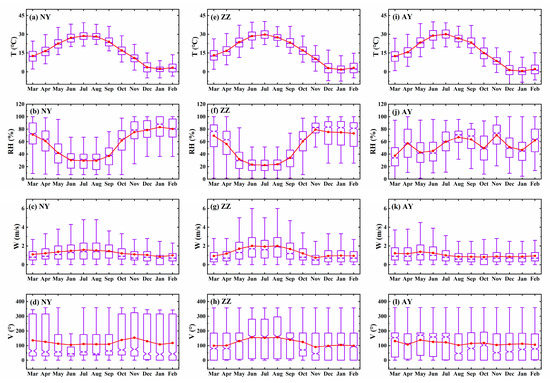
Figure 5.
Box plot of monthly changes in meteorological parameters at the Nanyang (NY) (a–d), Zhengzhou (ZZ) (e–h), and Anyang (AY) (i–l) monitoring stations. The upper and lower edges of the box-shaped rectangle represent 10% and 90% of the values, respectively, while the synapses represent the standard deviation of each parameter.
Table 3.
Monthly statistics of PM2.5 and PM10 mass concentrations and meteorological parameters at the Nanyang, Zhengzhou, and Anyang monitoring stations.
To sum up, the concentrations of PM2.5 and PM10, at the three stations, were higher in winter than in summer. The main reason, in terms of climate, maybe that the temperatures are high in summer, the vertical movement of the atmosphere is strong, and the atmospheric boundary layer gets uplifted, thus reducing the concentration of particulate matter [24,35]. On the contrary, in winter, due to the low temperature, the atmospheric boundary layer shrinks, leading to an increase in particulate matter concentration [36]. The concentrations of PM2.5 and PM10, at Zhengzhou and Anyang Stations, were much higher than those in summer, especially at Anyang Station. In addition to climatic reasons, the main reason might be the enhanced emission of pollutants from the increased burning of fuels required for heating purposes in November in Anyang. Additionally, the concentrations of PM2.5 and PM10 were the highest over Zhengzhou, among the three stations, which might be related to the fact that Zhengzhou is the capital city of Henan Province and the core of the Central Plains Economic Zone, where the local total industrial and living emissions exceed the standard. In terms of meteorology, the meteorological parameters at the three monitoring stations were basically in line with the normal seasonal variation. The humidity decreased slightly from Nanyang Station upstream to Anyang Station downstream. The humidity at Nanyang Station and Zhengzhou Station was higher in winter than in summer, which might be because Nanyang Station and Zhengzhou Station are close to the reservoir area. In winter, the reservoir area has sufficient water, with more water being evaporated into the air. Summer is a dry season and less water evaporates into the air [37].
3.2.2. Relationships among PM2.5, PM10, and Meteorological Parameters
Figure 6 and Figure 7, respectively, show the correlation plot of PM2.5 and meteorological parameters, and PM10 and meteorological parameters, at the three monitoring stations. Figure 8 and Figure 9 show the pollution roses for PM2.5 and PM10, respectively, over the three stations. It can be seen from Figure 6 and Figure 7 that the PM2.5 and PM10 at the three stations were significantly negatively correlated with temperature (T). The lower the temperature, the higher the concentration of PM2.5 and PM10. This result is similar to those of previous studies conducted in Beijing and Shanghai [38,39]. The reason is that there is less precipitation in winter and a low wind speed. The boundary layer shrinks and the atmospheric environment tends to stabilize, which is conducive to the formation of PM2.5 and PM10 [37,39]. In summer, there is much precipitation, a high wind speed, a high boundary layer, and an unstable atmospheric environment. PM2.5 and PM10 are easily blown away, thus reducing their concentrations [40,41]. PM2.5 and PM10 had a strong correlation with humidity (RH) at Nanyang and Zhengzhou Stations, with a correlation coefficient (R2) of 0.71 (0.71) and 0.95 (0.95), respectively. Previous studies revealed that relative humidity has a great influence on the concentration of particulate matter. The higher the relative humidity, the higher the content of water vapor in the air, making the pollutants adhere to the water vapor and generating secondary sulfates and nitrates [33,42,43,44]. Additionally, the higher the humidity, the more PM2.5 and PM10 will accumulate, thus increasing the concentration of PM2.5 and PM10. In Anyang, there was almost no linear relationship between PM2.5, PM10, and humidity, with the correlation coefficient (R2) of 0.02 for each.
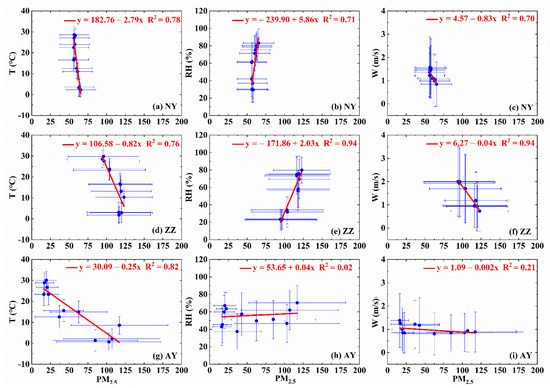
Figure 6.
Correlation plot of PM2.5 and meteorological parameters at the Nanyang (NY) ((a) PM2.5 and T, (b) PM2.5 and RH, (c) PM2.5 and W) Zhengzhou (ZZ) ((d) PM2.5 and T, (e) PM2.5 and RH, (f) PM2.5 and W), and Anyang (AY) ((g) PM2.5 and T, (h) PM2.5 and RH, (i) PM2.5 and W) monitoring stations. The scatter points represent the monthly mean values of each parameter. The red solid lines represent the fitted lines. The synapses stand for standard deviations.
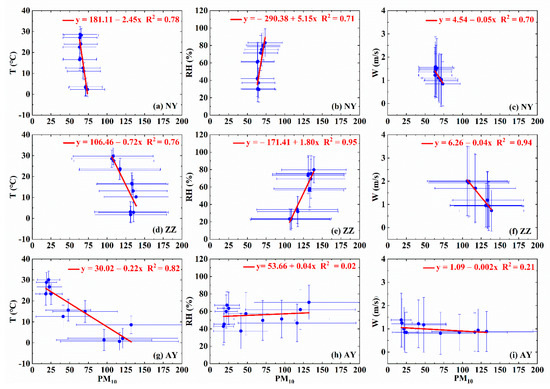
Figure 7.
Correlation plot of PM2.5 and meteorological parameters at the Nanyang (NY) ((a) PM10 and T, (b) PM10 and RH, (c) PM10 and W), Zhengzhou (ZZ) ((d) PM10 and T, (e) PM10 and RH, (f) PM10 and W), and Anyang (AY) ((g) PM10 and T, (h) PM10 and RH, (i) PM10 and W) monitoring stations. The scatter points represent the monthly mean values of each parameter. The red solid lines represent the fitted lines. The synapses stand for standard deviations.
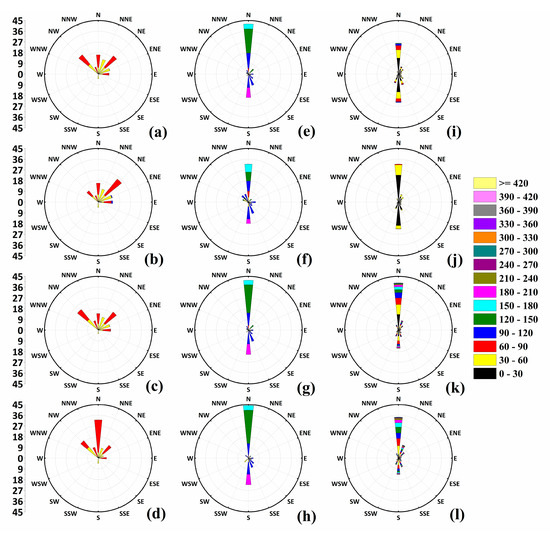
Figure 8.
PM2.5 pollution rosettes for the Nanyang (a–d), Zhengzhou (e–h), and Anyang (i–l) monitoring stations. The first to fourth rows correspond to spring, summer, fall, and winter.
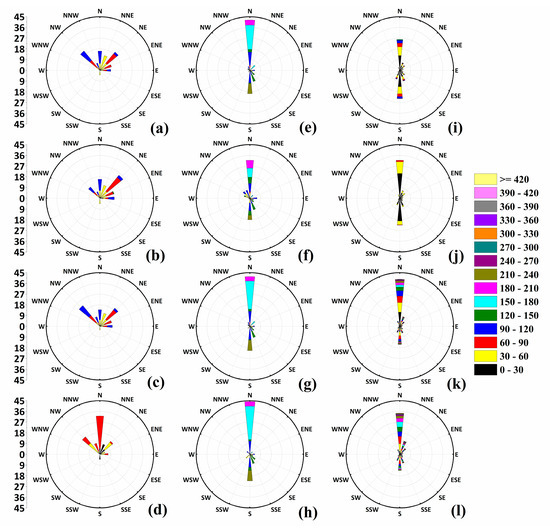
Figure 9.
PM10 pollution rosettes for the Nanyang (a–d), Zhengzhou (e–h), and Anyang (i–l) monitoring stations. The first to fourth rows correspond to spring, summer, fall, and winter.
It can be seen from Figure 8 and Figure 9 that PM2.5 and PM10 are significantly negatively correlated with wind speed at Nanyang Station. The correlation coefficient (R2) of both PM2.5 and PM10 is 0.70, indicating that the higher the wind speed, the lower the concentration of PM2.5 and PM10. The reason for this might be that the wind direction at the Nanyang monitoring station is mostly from the south during the four seasons, and occasionally from the north, where there are schools and industrial and mining enterprises. The south wind blows away atmospheric particles, reducing the concentration of PM2.5 and PM10. Earlier studies conclude that an increase in wind speed is conducive to the diffusion of particles, causing the particles to be blown away and reducing the concentration of PM2.5 and PM10 [2,24,25]. There was a strong negative correlation between PM2.5, PM10, and the wind speed at Zhengzhou Station. The R2 of PM2.5, PM10, and wind speed was the same, with a value of 0.94. The higher the wind speed, the lower the concentration of PM2.5 and PM10. The reason for this might be that the wind direction at the Zhengzhou monitoring station is mainly northwest, followed by southeast. The Zhengzhou monitoring station is located in the west of the Zhengzhou urban area, and the northwest wind dilutes the atmospheric particles from the urban area, reducing the concentration of PM2.5 and PM10. However, at Anyang Station, the correlation between PM2.5, PM10, and wind speed was relatively low, with R2 being 0.21, indicating that wind speed has little influence on the concentration of PM2.5 and PM10 in this area. The wind direction at Anyang monitoring station in all four seasons was mainly northwest, followed by southeast.
Figure 10 shows the correlation plot of PM2.5 and PM10 at the three monitoring stations in the upper, middle, and lower reaches of the CSNWD. The literature shows that the concentration of PM2.5 is mainly determined by the local area, while the concentration of PM10 is mainly characterized by sand and dust, which can be transported from the outside [26,32]. It is evident from Figure 10 that the fitting degree of PM2.5 and PM10 in spring, summer, autumn, and winter at the three stations is very high, with a correlation coefficient (R2) of 0.99, and the fitting rate of a straight line to scattered points is very high, which indicates that the concentrations of PM2.5 and PM10 were the same in the same time period, so there is a strong linear positive correlation between them, which indicates that PM2.5 and PM10 follow homology to a certain extent. This result shows that the PM2.5 and PM10 emissions at the three stations were mainly from local sources, and there was no pollution caused by external transmission problems. Additionally, as can be seen from the slope of Figure 10 and the ratio of PM2.5 to PM10 in Figure 11, the proportion of PM2.5 in PM10 is very high, reaching more than 88%. All the three monitoring stations show that the ratio of PM2.5 to PM10 in summer was higher than that in the other three seasons, indicating that, compared with other seasons, PM2.5 in summer might be caused by anthropogenic activities, which is consistent with the research results of Zhang et al. Additionally, the PM2.5/PM10 (Figure 11) values at Anyang were slightly higher than those in the other two regions, especially in spring and summer, which is the same in autumn and winter. This may be because the source of atmospheric particulates in autumn and winter, in Anyang, is mainly fuel consumed for domestic heating, while the concentration of PM2.5 and PM10 in spring and summer is not high, which is mainly caused by human activities.
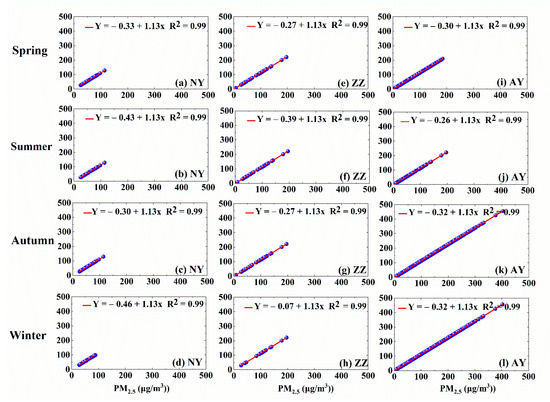
Figure 10.
Correlation diagram of PM2.5 and PM10 at the Nanyang (NY) ((a) spring; (b) summer; (c) autumn; (d) winter), Zhengzhou (ZZ) ((e) spring; (f) summer; (g) autumn; (h) winter ), and Anyang(AY) ((i) spring; (j) summer; (k) autumn; (l) winter ) monitoring stations.
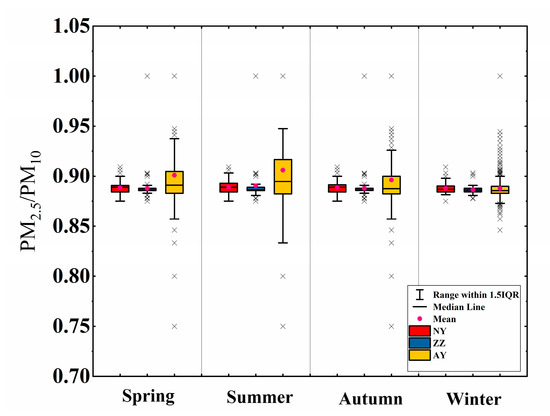
Figure 11.
Box diagram of the ratio of PM2.5 and PM10 at the Nanyang (NY), Zhengzhou (ZZ), and Anyang (AY) monitoring stations. ‘×’ represents the outliers.
3.3. Daily Variation
Figure 12 shows the daily variation in characteristics of PM2.5, PM10, and meteorological parameters at the three monitoring stations. As can be seen from the figure, the concentration of PM2.5 and PM10 at the three stations did not change much in a day. At Nanyang Station, the concentration range of PM2.5 is 107.08~114.20 μg/m3, and that of PM10 is 120.83~128.74 μg/m3. At Zhengzhou Station, PM2.5 falls between 107.08 and 114.20 μg/m3, while PM10 remains between 120.83 and 128.74 μg/m3. At Anyang Station, PM2.5 ranges from 43.12 to 58.84 μg/m3, while PM10 is concentrated in the 48.53 to 66.36 μg/m3 range. The PM2.5 and PM10 concentrations over the entire study region are higher at night than in the day, which may be due to the increase in humidity caused by transpiration at night, which leads to the increase in PM2.5 and PM10. The temperature and humidity of the three stations fluctuated within the range of a day. The temperature range was basically between 13 °C and 20 °C. The temperature in the day was higher than that at night, which is a normal diurnal variation. In terms of humidity, Nanyang Station displayed the range from 49.71% to 63.29%; Zhengzhou station displayed the range from 48.98% to 57.85%; and Anyang station displayed the range from 37.70% to 69.39%, all of which are low in the day and high during night. At Anyang Station, there was a big difference in the humidity between day and night. This may be due to weakened photosynthesis at night, increased transpiration, and increased water vapor in the air. The wind speed and wind direction did not change much during the day. Only the wind speed at Anyang Station increased at 8 a.m., reached its peak at about 2 p.m., and then slowly decreased. It can be seen from the figure that in the time period when the wind speed increases (from 8 a.m. to 2 p.m.), the humidity (RH), PM2.5, and PM10 show a decreasing trend in the corresponding time period, while in the time period when the wind speed decreases (after 2 p.m.), the humidity (RH), PM2.5, and PM10 are increasing. Such a reciprocal dependence could be attributed to the direct relation between wind speed and concentration of particulate matter in the air.
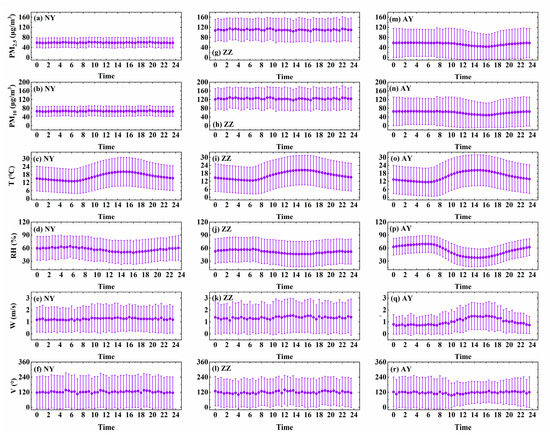
Figure 12.
Daily variation characteristics of PM2.5 and PM10 and meteorological parameters at the Nanyang (NY) (a–f), Zhengzhou (ZZ) (g–l), and Anyang (AY) (m–r) monitoring stations. The scatter points represent the number of days. The synapses stand for standard deviations.
4. Conclusions
In this paper, the spatiotemporal characteristics of PM2.5, PM10, and meteorological parameters at Nanyang Station in the upstream, Zhengzhou Station in the middle, and Anyang Station in the downstream reaches of the CSNWD were analyzed and studied from September 2018 to September 2019. Meanwhile, the AOD products of CALIPSO were used to analyze the atmospheric optical properties of aerosols at the three monitoring stations from 2007 to 2019. This study may not only help researchers understand the atmospheric environmental quality of the Henan section of the CSNWD, but also provide data and theoretical support to government departments to manage and protect the ecological environment in this area. The results are as follows:
- (1)
- The middle reaches (Zhengzhou) of the Henan section of the CSNWD are the most seriously polluted, followed by the upstream reaches (Nanyang), while the downstream reaches (Anyang) are the least polluted. The annual average concentration of PM2.5 in the upper, middle, and lower reaches exceeded the standard, while the concentration of PM10 only exceeded the standard in the middle reaches.
- (2)
- The concentration, wind speed, wind direction, humidity, and temperature of PM2.5 and PM10 in the study region change with the normal seasonal shift, but some differences were caused by the surrounding environment, which induces unexpected changes during the seasons or even contrary qualities to the normal seasons.
- (3)
- The concentrations of PM2.5 and PM10 in the upstream reaches (Nanyang) of the Middle Route Project of the South-North water diversion were negatively correlated, positively correlated, and negatively correlated with wind speed, humidity, and temperature, respectively; the concentrations of PM2.5 and PM10 in the middle reaches (Zhengzhou) were negatively correlated, positively correlated, and negatively correlated with wind speed, humidity, and temperature, respectively; and the concentrations of PM2.5 and PM10 in the downstream reached (Anyang) had no obvious correlation with wind speed and humidity. The concentration of PM2.5 and PM10 was negatively correlated with temperature. The wind speed was roughly the same as that during the normal seasons.
- (4)
- The sources of PM2.5 and PM10 in the upper, middle, and lower reaches of the CSNWD in the Henan section were mainly local and almost free from external pollution transport.
- (5)
- The concentration of PM2.5 and PM10 and wind speed at Nanyang Station and Zhengzhou Station remained unchanged throughout the day, while the humidity and temperature change daily normally. The wind speed at Anyang Station changed slightly in a day, and the humidity, PM2.5, and PM10 showed certain changes with the wind speed.
- (6)
- The CALIPSO_AOD values at the three stations were higher in summer than in the other three seasons, whereas the AOD values at the Zhengzhou and Anyang Stations were higher than those at Nanyang.
Author Contributions
Conceptualization, B.S.; methodology, M.Z., and B.S.; software, M.B., D.W. and Z.Z.; validation, Y.L., L.A., and B.-L.L.; investigation, M.Z., and F.M.H.; writing—original draft preparation, B.S.; writing—review and editing, M.B. and M.Z.; project administration, M.Z.; funding acquisition, M.Z. All authors have read and agreed to the published version of the manuscript.
Funding
This research was funded by the National Natural Science Foundation of China (No. 41801282, 51879130), Programs for Science and Technology Development of Henan Province (No. 202102310294 & 192102310008), and the Jiangsu Provincial Department of Education for the Special Project of Jiangsu Distinguished Professor (1311062001001 & 1421061901001).
Institutional Review Board Statement
Not applicable.
Informed Consent Statement
Not applicable.
Data Availability Statement
The data presented in this study are available on request from the corresponding author.
Acknowledgments
We thank the South-North Diversion Central Line Construction Authority for its support and assistance.
Conflicts of Interest
The authors declare no conflict of interest.
References
- Edenhofer, O.; Seyboth, K. Intergovernmental Panel on Climate Change (IPCC). In Encyclopedia of Energy Natural Resource & Environment Economy; Elsevier: Amsterdam, The Netherlands, 2013. [Google Scholar]
- Khamutian, R.; Najafi, F.; Soltanian, M.; Shokoohizadeh, M.J.; Afshari, A. The association between air pollution and weather conditions with increase in the number of admissions of asthmatic patients in emergency wards: A case study in Kermanshah. Med. J. Islam. Repub. Iran 2015, 29, 229. [Google Scholar]
- Lelieveld, J.; Evans, J.S.; Fnais, M.; Giannadaki, D.; Pozzer, A. The contribution of outdoor air pollution sources to premature mortality on a global scale. Nature 2015, 525, 367–371. [Google Scholar] [CrossRef] [PubMed]
- Menon, S.; Hansen, J.; Nazarenko, L.; Luo, Y. Climate Effects of Black Carbon Aerosols in China and India. Science 2002, 297, 2250–2253. [Google Scholar] [CrossRef]
- Charlson, R.J.; Schwartz, S.E.; Hales, J.M.; Cess, R.D.; Coakley, J.A.; Hansen, J.E.; Hofmann, D.J. Climate forcing by anthropogenic aerosols. Science 1992, 255, 423–430. [Google Scholar] [CrossRef]
- Zhang, Y.L.; Cao, F. Fine particulate matter (PM2.5) in China at a city level. Sci. Rep. 2015, 5, 14884. [Google Scholar] [CrossRef] [PubMed]
- Sun, J.; Ariya, P.A. Atmospheric organic and bio-aerosols as cloud condensation nuclei (CCN): A review. Atmos. Environ. 2006, 40, 795–820. [Google Scholar] [CrossRef]
- Approximation, H. Atmospheric Science–An Introductory Survey, 2nd ed.; Academic Press: Cambridge, MA, USA, 1977. [Google Scholar]
- Kaufman, Y.J.; Tanré, D.; Boucher, O. A satellite view of aerosols in the climate system. Nature 2002, 419, 215–223. [Google Scholar] [CrossRef] [PubMed]
- Kaufman, Y.J.; Boucher, O.; Tanré, D.; Chin, M.; Remer, L.A.; Takemura, T. Aerosol anthropogenic component estimated from satellite data. Geophys. Res. Lett. 2005, 32. [Google Scholar] [CrossRef]
- Chung, C.E.; Ramanathan, V.; Kim, D.; Podgorny, I.A. Global anthropogenic aerosol direct forcing derived from satellite and ground-based observations. J. Geophys. Res. Atmos. 2005, 110. [Google Scholar] [CrossRef]
- Huang, F.; Pan, B.; Wu, J.; Chen, E.; Chen, L. Relationship between exposure to PM2.5 and lung cancer incidence and mortality: A meta-analysis. Oncotarget 2017, 8, 43322–43331. [Google Scholar] [CrossRef] [PubMed]
- Ramanathan, V.; Crutzen, P.J.; Kiehl, J.T.; Rosenfeld, D. Aerosols, Climate, and the Hydrological Cycle. Science 2001, 294, 2119–2124. [Google Scholar] [CrossRef]
- Maji, K.J.; Arora, M.; Dikshit, A.K. Burden of disease attributed to ambient PM2.5 and PM10 exposure in 190 cities in China. Environ. Sci. Pollut. Res. 2017, 24, 11559–11572. [Google Scholar] [CrossRef] [PubMed]
- Wang, J.; Zhao, B.; Wang, S.; Yang, F.; Xing, J.; Morawska, L.; Ding, A.; Kulmala, M.; Kerminen, V.-M.; Kujansuu, J.; et al. Particulate matter pollution over China and the effects of control policies. Sci. Total Environ. 2017, 584–585, 426–447. [Google Scholar] [CrossRef] [PubMed]
- Pope, C.A.; Dockery, D.W. Health Effects of Fine Particulate Air Pollution: Lines that Connect. J. Air Waste Manag. Assoc. 2006, 56, 709–742. [Google Scholar] [CrossRef] [PubMed]
- Sahu, L.K.; Kondo, Y.; Miyazaki, Y.; Kuwata, M.; Koike, M.; Takegawa, N.; Tanimoto, H.; Matsueda, H.; Yoon, S.C.; Kim, Y.J. Anthropogenic aerosols observed in Asian continental outflow at Jeju Island, Korea, in spring 2005. J. Geophys. Res. 2009, 114, D03301. [Google Scholar] [CrossRef]
- Pani, S.K.; Ou-Yang, C.F.; Wang, S.H.; Ogren, J.A.; Sheridan, P.J.; Sheu, G.R.; Lin, N.H. Relationship between long-range transported atmospheric black carbon and carbon monoxide at a high-altitude background station in East Asia. Atmos. Environ. 2019, 210, 86–99. [Google Scholar] [CrossRef]
- Komazaki, Y.; Kondo, Y.; Uno, I.; Kanaya, Y.; Pan, X.; Miyakawa, T.; Taketani, F. Long-term observations of black carbon mass concentrations at Fukue Island, western Japan, during 2009–2015: Constraining wet removal rates and emission strengths from East Asia. Atmos. Chem. Phys. 2016, 16, 10689–10705. [Google Scholar]
- Querol, X.; Alastuey, A.; Rodriguez, S.; Plana, F.; Puig, O. PM10 and PM2.5 source apportionment in the Barcelona Metropolitan area, Catalonia, Spain. Atmos. Environ. 2001, 35, 6407–6419. [Google Scholar] [CrossRef]
- Ho, K.F.; Lee, S.C.; Chan, C.K.; Yu, J.C.; Chow, J.C.; Yao, X.H. Characterization of chemical species in PM2.5 and PM10 aerosols in Hong Kong. Atmos. Environ. 2003, 37, 31–39. [Google Scholar] [CrossRef]
- Fang, X.; Bi, X.; Xu, H.; Wu, J.; Zhang, Y.; Feng, Y. Source apportionment of ambient PM10 and PM2.5 in Haikou, China. Atmos. Res. 2017, 190, 1–9. [Google Scholar] [CrossRef]
- Zhou, X.; Cao, Z.; Ma, Y.; Wang, L.; Wu, R.; Wang, W. Concentrations, correlations and chemical species of PM2.5/PM10 based on published data in China: Potential implications for the revised particulate standard. Chemosphere 2016, 144, 518–526. [Google Scholar] [CrossRef] [PubMed]
- Li, Y.; Chen, Q.; Zhao, H.; Wang, L.; Tao, R. Variations in PM10, PM2.5 and PM1.0 in an Urban Area of the Sichuan Basin and Their Relation to Meteorological Factors. Atmosphere 2015, 6, 150–163. [Google Scholar] [CrossRef]
- Jain, S.; Sharma, S.K.; Vijayan, N.; Mandal, T.K. Seasonal characteristics of aerosols (PM2.5 and PM10) and their source apportionment using PMF: A four year study over Delhi, India. Environ. Pollut. 2020, 262, 114337. [Google Scholar] [CrossRef]
- Chianese, E.; Tirimberio, G.; Riccio, A. PM2.5 and PM10 in the urban area of Naples: Chemical composition, chemical properties and influence of air masses origin. J. Atmos. Chem. 2019, 76, 151–169. [Google Scholar] [CrossRef]
- Wei, Y.; Tang, D.; Ding, Y.; Agoramoorthy, G. Incorporating water consumption into crop water footprint: A case study of China’s South–North Water Diversion Project. Sci. Total Environ. 2016, 545–546, 601–608. [Google Scholar] [CrossRef]
- Xu, H.; Li, M.; Li, G.; Zhang, S.; Yang, Z. Impact of the south-to-north water diversion project on groundwater resources: A case study in pinggu basin, Beijing, China. Environ. Eng. Manag. J. 2013, 12, 2239–2247. [Google Scholar]
- Yang, Y.; Lei, Y.; Zhang, Q. Quantity versus Quality in China’s South-to-North Water Diversion Project: A System Dynamics Analysis. Water 2015, 7, 2142–2160. [Google Scholar] [CrossRef]
- Dou, M.; Zhang, J.; Li, G.; Zhao, P. A multi-objective water trading optimization model for Henan Province’s water-receiving area in the Middle Route of China’s South-to-North Water Diversion Project. Water Policy 2019, 21, 693–707. [Google Scholar] [CrossRef]
- Zhu, Y.P.; Zhang, H.P.; Chen, L.; Zhao, J.F. Influence of the South–North Water Diversion Project and the Mitigation Projects on the water quality of Han River. Sci. Total Environ. 2008, 406, 57–68. [Google Scholar] [CrossRef]
- Wang, X.; Dickinson, R.E.; Su, L.; Zhou, C.; Wang, K. PM 2.5 Pollution in China and How It Has Been Exacerbated by Terrain and Meteorological Conditions. Bull. Am. Meteorol. Soc. 2018, 99, 105–119. [Google Scholar] [CrossRef]
- Bilal, M.; Nichol, J.; Nazeer, M.; Shi, Y.; Wang, L.; Kumar, K.; Ho, H.; Mazhar, U.; Bleiweiss, M.; Qiu, Z. Characteristics of Fine Particulate Matter (PM2.5) over Urban, Suburban, and Rural Areas of Hong Kong. Atmosphere 2019, 10, 496. [Google Scholar] [CrossRef]
- Chan, C.K.; Yao, X. Air pollution in mega cities in China. Atmos. Environ. 2008, 42, 1–42. [Google Scholar] [CrossRef]
- Su, B.; Li, H.; Zhang, M.; Bilal, M.; Wang, M.; Atique, L.; Zhang, Z.; Zhang, C.; Han, G.; Qiu, Z. Optical and Physical Characteristics of Aerosol Vertical Layers over Northeastern China. Atmosphere 2020, 11, 501. [Google Scholar] [CrossRef]
- Zhang, M.; Su, B.; Bilal, M.; Atique, L.; Han, G. An Investigation of Vertically Distributed Aerosol Optical Properties over Pakistan Using CALIPSO Satellite Data. Remote Sens. 2020, 12, 2183. [Google Scholar] [CrossRef]
- Guoyu, R.; Hongbin, L.; Ziying, C.; Li, Z.; Weijing, X. Multi-Time-Scale Climatic Variations over Eastern China and Implications for the South-North Water Diversion Project. J. Hydrometeorol. 2011, 12, 600–617. [Google Scholar]
- Hu, M.; Wong, H.; Yin, Q.; Wang, J. Estimation of daily PM2.5 concentration and its relationship with meteorological conditions in Beijing. J. Environ. Sci. 2016, 48, 161–168. [Google Scholar]
- Ye, B.; Ji, X.; Yang, H.; Yao, X.; Chan, C.K.; Cadle, S.H.; Chan, T.; Mulawa, P.A. Concentration and chemical composition of PM2.5 in Shanghai for a 1-year period. Atmos. Environ. 2003, 37, 499–510. [Google Scholar] [CrossRef]
- Che, H.; Xia, X.; Zhu, J.; Li, Z.; Dubovik, O. Column aerosol optical properties and aerosol radiative forcing during a serious haze-fog month over North China Plain in 2013 based on ground-based sunphotometer measurements. Atmos. Chem. Phys. 2014, 14, 2125–2138. [Google Scholar] [CrossRef]
- Lijie, H.; Lunche, W.; Aiwen, L.; Ming, Z.; Muhammad, B.; Minghui, T. Aerosol Optical Properties and Associated Direct Radiative Forcing over the Yangtze River Basin during 2001–2015. Remote Sens. 2017, 9, 746. [Google Scholar] [CrossRef]
- Hien, P.D.; Bac, V.T.; Tham, H.C.; Nhan, D.D.; Vinh, L.D. Influence of meteorological conditions on PM 2.5 and PM 2.510 concentrations during the monsoon season in Hanoi, Vietnam. Atmos. Environ. 2002, 36, 3473–3484. [Google Scholar] [CrossRef]
- Tran, H.N.Q.; Moelders, N. Investigations on meteorological conditions for elevated PM2.5 in Fairbanks, Alaska. Atmos. Res. 2011, 99, 39–49. [Google Scholar] [CrossRef]
- Qianqian, Y.; Qiangqiang, Y.; Tongwen, L.; Huanfeng, S.; Liangpei, Z. The relationships between PM2.5 and meteorological factors in China: Seasonal and regional variations. Int. J. Environ. Res. 2017, 14, 1510. [Google Scholar] [CrossRef]
Publisher’s Note: MDPI stays neutral with regard to jurisdictional claims in published maps and institutional affiliations. |
© 2021 by the authors. Licensee MDPI, Basel, Switzerland. This article is an open access article distributed under the terms and conditions of the Creative Commons Attribution (CC BY) license (http://creativecommons.org/licenses/by/4.0/).