Article

Response of Methane and Nitrous Oxide Emissions from Peatlands to Permafrost Thawing in Xiaoxing’an Mountains, Northeast China

1
Key Laboratory of Sustainable Forest Ecosystem Management-Ministry of Education, School of Forestry, Northeast Forestry University, Harbin 150040, China
2
Heilongjiang Sanjiang Plain Wetland Ecosystem Research Station, Fuyuan 156500, China
3
Duke University Wetland Center, Nicholas School of the Environment, Duke University, Durham, NC 27708, USA
4
Northeast Institute of Geography and Agroecology, Chinese Academy of Science, Changchun 130102, China
*
Author to whom correspondence should be addressed.
Atmosphere 2021, 12(2), 222; https://doi.org/10.3390/atmos12020222
Submission received: 13 January 2021 / Revised: 30 January 2021 / Accepted: 2 February 2021 / Published: 6 February 2021
(This article belongs to the Special Issue Climate-Ecosystem Interaction in Northern Wetlands)

Abstract

:
Permafrost thawing may lead to the release of carbon and nitrogen in high-latitude regions of the Northern Hemisphere, mainly in the form of greenhouse gases. Our research aims to reveal the effects of permafrost thawing on CH4 and N2O emissions from peatlands in Xiaoxing’an Mountains, Northeast China. During four growing seasons (2011–2014), in situ CH4 and N2O emissions were monitored from peatland under permafrost no-thawing, mild-thawing, and severe-thawing conditions in the middle of the Xiaoxing’an Mountains by a static-chamber method. Average CH4 emissions in the severe-thawing site were 55-fold higher than those in the no-thawing site. The seasonal variation of CH4 emission became more aggravated with the intensification of permafrost thawing, in which the emission peaks became larger and the absorption decreased to zero. The increased CH4 emissions were caused by the expansion of the thawing layer and the subsequent increases in soil temperature, water table, and shifts of plant communities. However, N2O emissions did not change with thawing. Permafrost thawing increased CH4 emissions but did not impact N2O emissions in peatlands in the Xiaoxing’an Mountains. Increased CH4 emissions from peatlands in this region may amplify global warming.

1. Introduction

Permafrost underlies 23.9% of the exposed land area of the Northern Hemisphere [1], which stores about 50% of the earth’s soil organic carbon (SOC) [2,3]. In most regions, the thawing permafrost is driven by global warming, and the thawing area and speed may increase during the 21st century [4]. The thawing process may release vast amounts of carbon (C) and nitrogen (N), mainly as CO2, CH4 and N2O, from the frozen soil [5,6,7,8]. CO2, CH4 and N2O are the three main greenhouse gases that contribute to 87.5% of global warming [9]. Therefore, it is important to pay more attention to the impact of permafrost thawing on greenhouse gas (GHG) emissions. Previous research [10] shows that C absorption by plants increased more than carbon loss induced by heterotrophic respiration after permafrost thawing, which strengthened the C sink. This should cause a negative feedback to diminish global warming. However, given the higher global warming potentials (GWPs) of CH4 and N2O, when CH4 and N2O are converted to CO2 (GWPs100), increasing emissions of CH4 and N2O might partially or completely offset the enhanced C sink [10,11].
CH4 is produced by methanogenic archaea during soil organic matter degradation under anaerobic conditions [12]. N2O is produced in soils mainly by two microbial processes: aerobic nitrification and anaerobic denitrification [13]. Global warming affects several environmental factors in wetlands, mainly including the depth of the permafrost active layer [14,15], soil temperature [16], and water table level [17]. These factors also control CH4 and N2O production and emission from wetlands in permafrost regions [5,18,19]. One model has projected that CH4 emissions will increase by 25–30% when soil active layers are deepened by 30–50% in permafrost in Russia [20]. Positive correlations were found between the soil active layer and CH4 emissions in permafrost regions [21,22]. Deepened active layers increased nitrogen availability [23], which could increase the substrates of nitrifying and denitrifying bacteria and further enhance N2O emissions [24]. Temperature is also one of the most important environmental factors affecting the bacteria active layer. Rising soil temperatures induced by permafrost thawing would enhance the activity of methanogens and nitrifying and denitrifying bacteria, further enhancing CH4 and N2O production and emissions [18,25]. Increased N2O emission due to thawing has been found by a lab-incubation experiment [25], but the in situ evidence in wetlands is still insufficient [26,27].
Besides the effects of deepened soil active layers, changes in hydrological conditions caused by permafrost thawing also affect CH4 and N2O emissions from wetlands. Permafrost thawing leads to increased formation of thermokarst lakes and ponds in continuous and discontinuous permafrost regions [28,29], which also increased flooding events in some locations [17]. High water level will increase the thickness of soil anaerobic layer, thus promoting methane production and emission [30]. However, higher water levels may inhibit nitrification and decrease N2O production and emissions in this way [31]. Pärn et al. [32] found a bell-shaped regression curve between N2O emissions and soil volumetric water content; the N2O emission peaked at around 50% soil moisture. Viru et al. [33] studied four disturbed peatlands and found that N2O emission was the highest when the water level was 30 to 40 cm below soil surface. These results indicate that medium soil moisture was the optimal level for microbial activity in the soil matrix, and favored N2O production and emission. Therefore, if permafrost thawing leads to the increase in soil saturation, N2O emission from wetlands may be inhibited. The composition and growth of wetland plant communities may also change with water levels and soil nitrogen availability during permafrost thawing [10,34,35]. Changed vegetation compositions of plant species not only provides different substrates for associated microbes with CH4 and N2O, but also have different gas transmission capacities, thus also altering CH4 and N2O emission [36,37].
Most research about the effects of permafrost thawing on greenhouse gas emissions has focused on Arctic and subarctic regions [5,15,17,38]. Few studies have focused on the southern global permafrost boundary [11]. The Xing’an Mountains are the second largest permafrost region in China, after the Qinghai–Tibetan Plateau, having a permafrost area of 0.38 × 10⁶ km2 [39]. This area is also the main wetland distribution region in China [40].
Northeast China’s permafrost region lies at the southern margin of Eurasian permafrost, where mean annual air temperature is about 0 ± 1.0 °C [41]. Thinner permafrost layers and higher soil temperature made the region more sensitive to climate warming. Jin et al. [41] predicted that permafrost areas would decline to an estimated 35% of that amounts in the 1970s and 1980s if air temperature increases 1.0 to 1.5 °C during the next 40–50 years. Some studies have reported GHG emissions in this region [42,43,44,45,46,47]. Among these studies, Miao et al. [42,43] and Cui et al. [44] discussed the relationship between GHG emissions and active layer depth in one peatland site. Liu et al. [45] studied but did not find a relationship between the active layer depth and GHG emissions. The other research did not measure the active layer depth of wetlands, although their research sites were on the permafrost region [46,47]. None of these studies focused on the change of GHG emissions on the permafrost thawing gradient. Few studies about the influence and mechanisms of permafrost thawing on wetland CH4 and N2O emissions inhibits the understanding of how wetlands in high latitude regions respond and feed back to global warming.
In this paper, field CH4 and N2O emissions from peatlands were observed under different permafrost thawing conditions in the Xiaoxing’an Mountains during the 2011–2014 growing seasons. The objectives were to test the effects of permafrost thawing on CH4 and N2O emissions in peatlands, and to identify the crucial environmental factors regulating CH4 and N2O emissions during permafrost thawing. We hypothesized that: (1) permafrost thawing will increase the release of CH4 and N2O from peatlands in this region; and (2) increased CH4 and N2O release are driven by both biotic and abiotic factors.

2. Materials and Methods

2.1. Site Description

The study area was located in the middle of the Xiaoxing’an Mountains, Northeast China (48°03′53″–48°17′11″ N, 128°30′36″–128°45′00″ E; 260–500 m a.s.l.), which is at the southern margin of Eurasian permafrost. The region is located in a temperate climate zone, with a mean annual temperature of 0.4 °C and mean annual precipitation of about 630 mm. Wetlands have developed in this area because of the low, flat valleys and permafrost which prevents water from penetrating underground. Peat has accumulated due to the cold and hydrologic conditions.
Three peatlands with no-thawing, mild-thawing, and severe-thawing permafrost conditions were selected in this study. The depths of the soil active layers were 60–90 cm (no-thawing), 110–140 cm (mild-thawing), and 140–170 cm (severe-thawing) during the years 2011–2014.
The dominant plant in the permafrost no-thawing peatland was Larix gmelinii, with a mean height of 5.0 m and canopy cover of 40%. Trees were typically short because low nutrient levels and low temperatures in peat limited the tree growth. The region’s inhabitants call them “old little trees”. The dominant shrub species was Ledum palustre var. angustum, followed by Vaccinium uliginosum. High shrubs grow up to 0.5 m, but short shrubs are only 0.2 m in height. Herbs were scattered among the species of Calamagrostis angustifolia and Eriophorum vaginatum. The ground layer was covered by moss (mainly Sphagnum spp.) with a high coverage of 80%.
The dominant plant in the permafrost mild-thawing peatland was also L. gmelinii, with a mean height of 8.0 m and canopy cover of 50%. The high shrub species was Betula ovalifolia, which could grow up to 1.5 m. Short shrub species included L. palustre var. angustum and V. uliginosum, with mean height of about 0.4–0.5 m. The dominant herbs included Carex schmidtii and E. vaginatum. The ground was covered by Sphagnum cymbifolium, S. magellanicum and Polytrichum juniperinum.
No trees existed in the permafrost severe-thawing peatland due to the increased flooding conditions after permafrost thawing. The dominant plant was Carex schmidtii. Also present were C. angustifolia, Sanguisorba parviflora, Equisetum heleocharis, Caltha palustris, Iris laevigata, etc. The mean vegetation height was 0.5 m.
Peat depths in most of this region were about 0.5–1 m but reached 3 m in some areas. According to the results from a peatland in the same area located about 50 km away from our research sites, the peat ages from 60 to 217 cm depth were 1310–5116 years BP (Lin et al., 2004) [48]. Chemical characteristics of the soil in the study peatlands are shown in Table 1.

2.2. CH4 and N2O Flux Measurements

Triplicate plots in the no-thawing site and quadruplicate plots in the mild-thawing and severe-thawing sites were established in 2011. CH4 and N2O fluxes, soil temperatures, and water table levels were measured simultaneously three or four times per month during the growing season (May~early October) from 2011 to 2014.
We used static chambers to collect gas samples between 08:00 a.m. and 11:00 a.m. (GMT + 8 h). We did not observe the diurnal variations of the studied sites. However, due to the results from Sanjiang Plain, GHG flux at 09:00 a.m. was almost equal to the daily mean flux [49]. Therefore, we collected gas samplings between 08:00–11:00 a.m. to reduce the error between the sampling time flux and the daily average flux. Stainless-steel chambers (0.7 m in height and 0.25 m2 in area) were equipped with rubber stoppers for headspace sampling and a fan for mixing air during the measurements. Four gas samples were drawn from a port on top of the chamber at 0, 10, 20 and 30 min using a 50 mL syringe. Samples were injected into pre-evacuated packs and analyzed within a week on a gas chromatograph (GC, Angelent 7890). CH4 and N2O concentration analyses were according to Song et al. [49]. The gas fluxes were calculated by the following equation:
F = d c d t · M V 0 · P P 0 · T 0 T · H
where F is the gas flux; dc/dt is the slope of gas concentration changing with time; M is the molar mass of each gas; P is the atmosphere pressure of the chamber; T is the absolute temperature inside the chamber; V0, P0, and T0 are the gas molar volume, atmospheric pressure, and absolute air temperature under standard conditions, respectively; and H is the height of chamber. Data were accepted when r2 of the linear regression between gas concentrations and time was ≥0.90 for CH4 or ≥0.80 for N2O.

2.3. Environmental Factors and Plant Biomass

We recorded air temperature inside the chamber and soil temperature at 10 cm with digital thermometers (JM624, China) when collecting gas samples. Water table position relative to the soil surface was measured by digging a small well near the chambers at each peatland. Soil thaw depth was measured with a steel rod with scales on it. We harvested herbs in each site to gain the aboveground biomass in mid-July every year. Three 1 m × 1 m plots were selected randomly in each site, and herbs were cut at the peat surface in each plot and weighed immediately. The plants were subsequently sampled and taken to the laboratory, where they were oven-dried to a constant mass at 80 °C. The dry biomass was calculated by multiplying the fresh weight of the plants by the dry/wet ratio of the sample.

2.4. Data Analysis

One-way ANOVA (Duncan comparison) was employed to test the difference of CH4 or N2O fluxes among sites with different thawing stages. Regression analysis was performed to test which environmental factors regulate CH4 or N2O fluxes. Significance of the test was set at a probability of 0.05. All error bars were standard errors of the mean. The statistical analysis was performed by SPSS version 18.0 software (SPSS Inc., Chicago, IL, USA).

3. Results

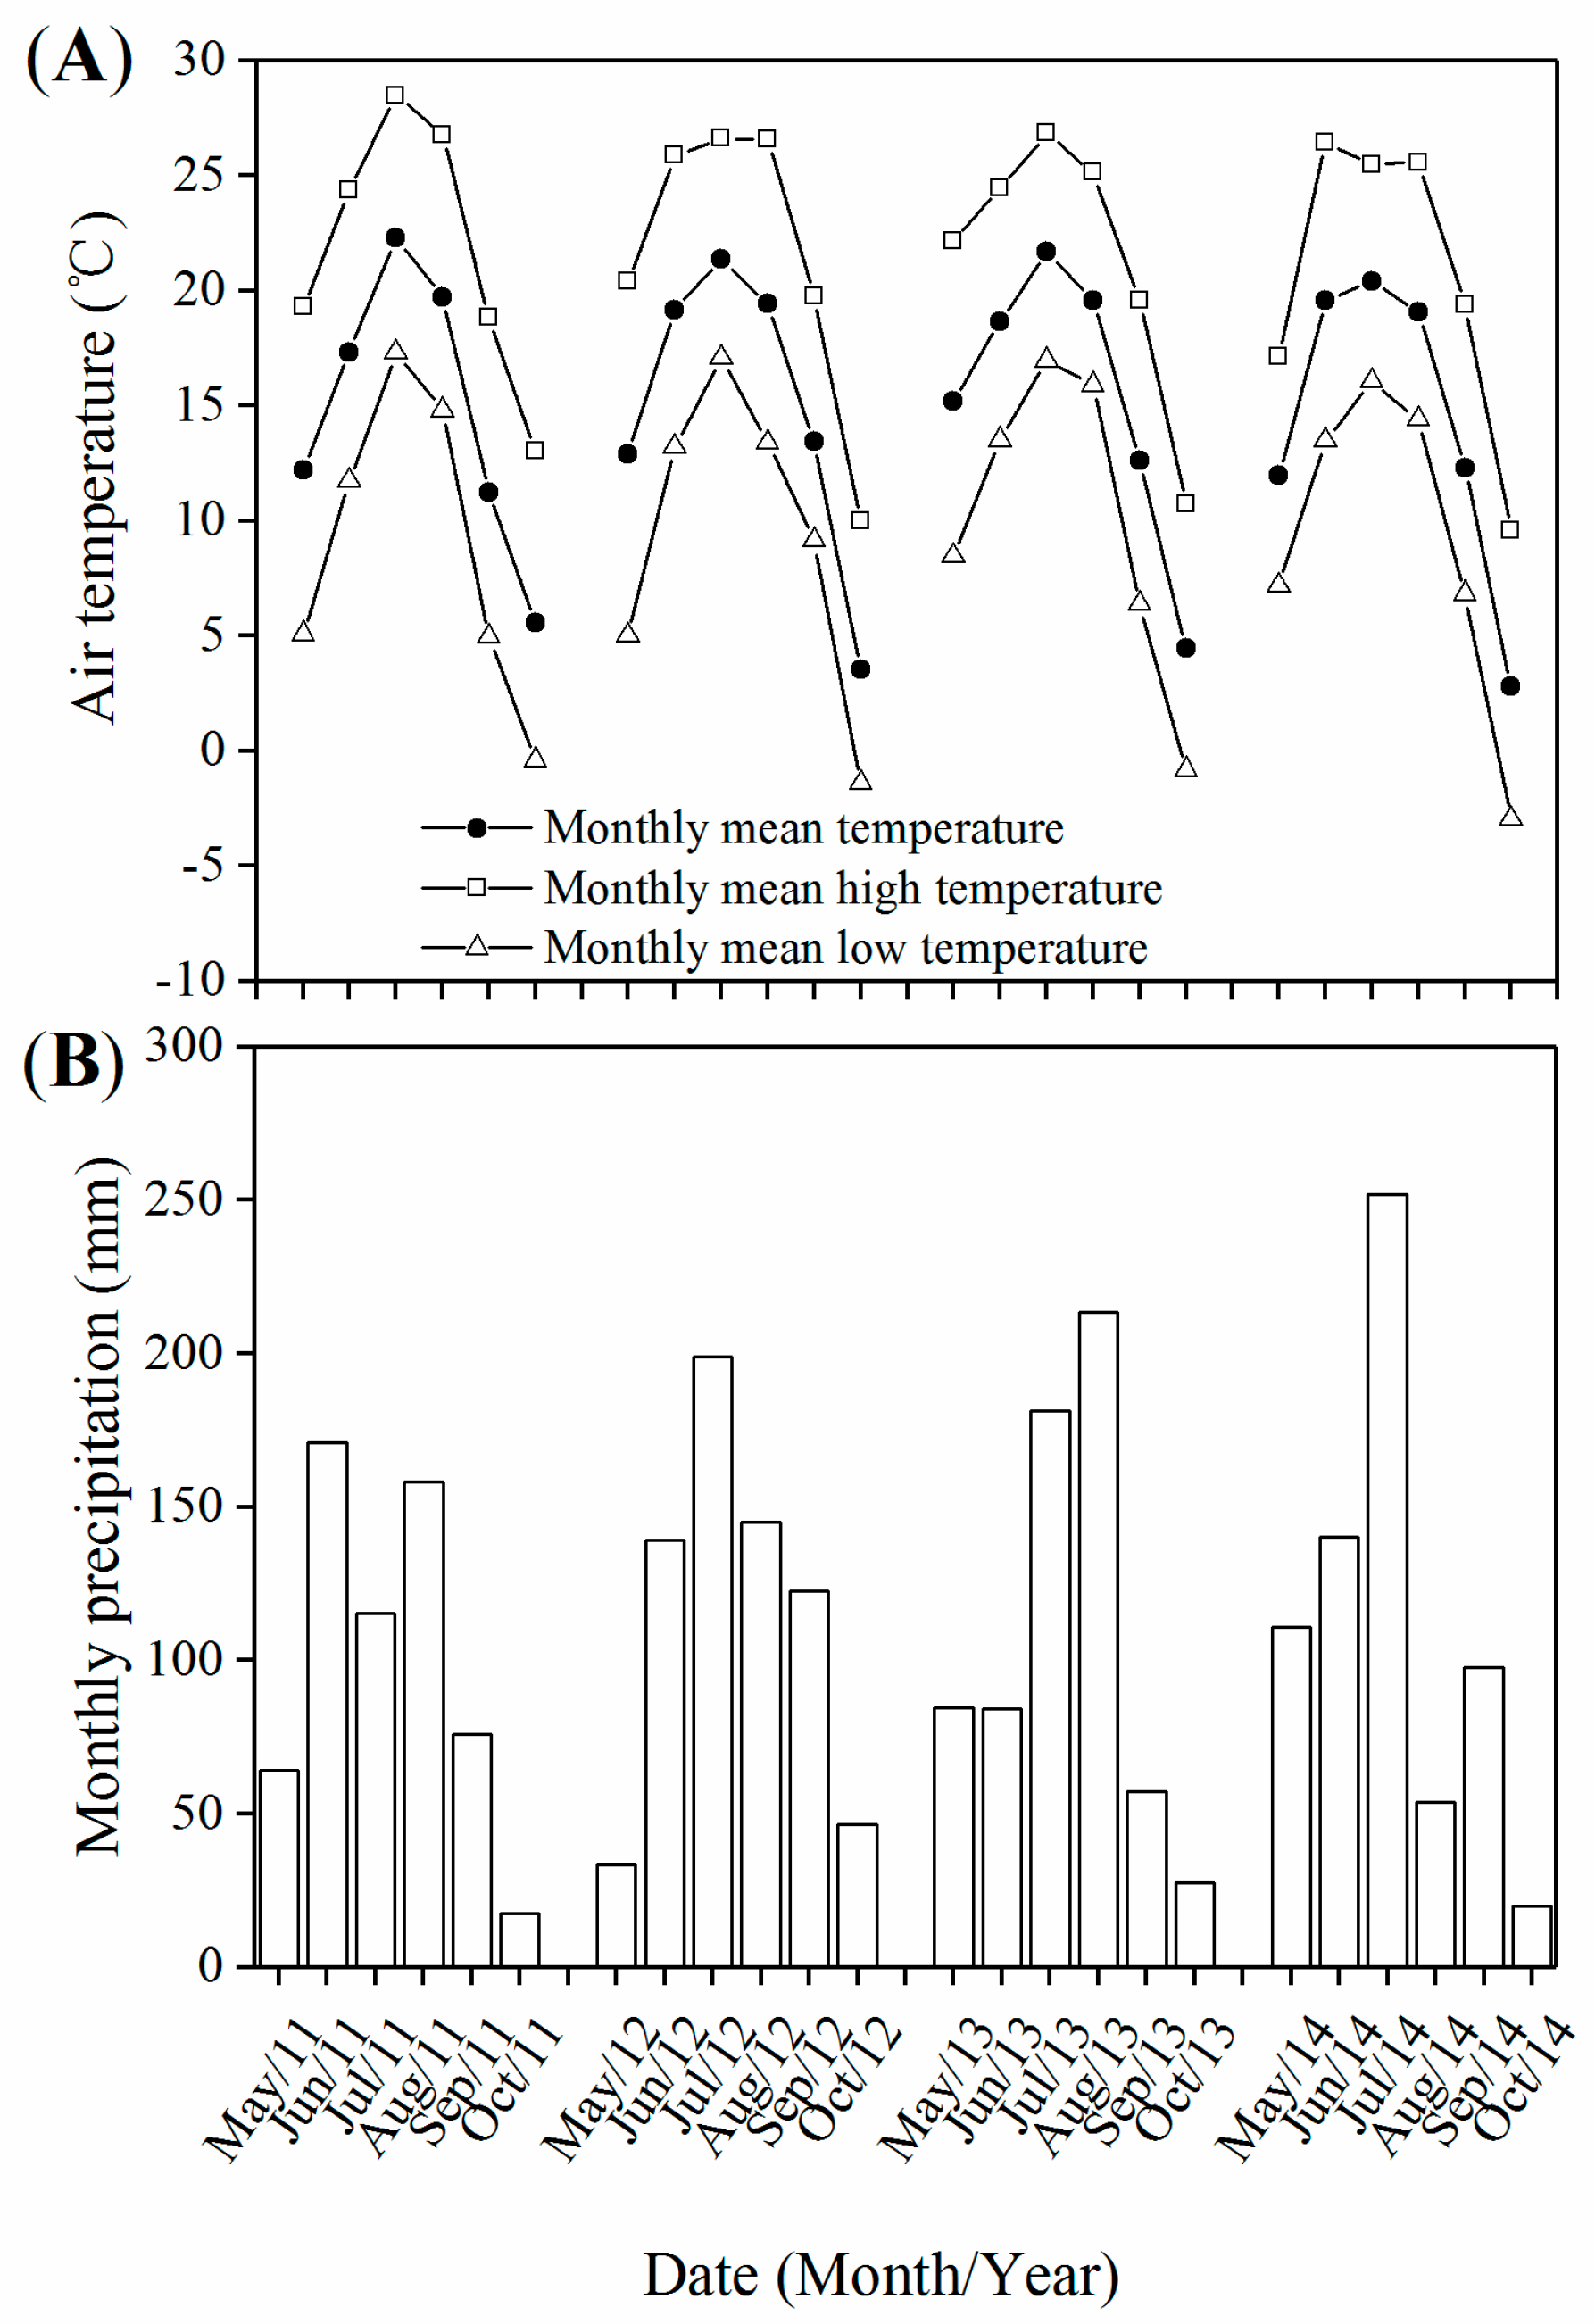
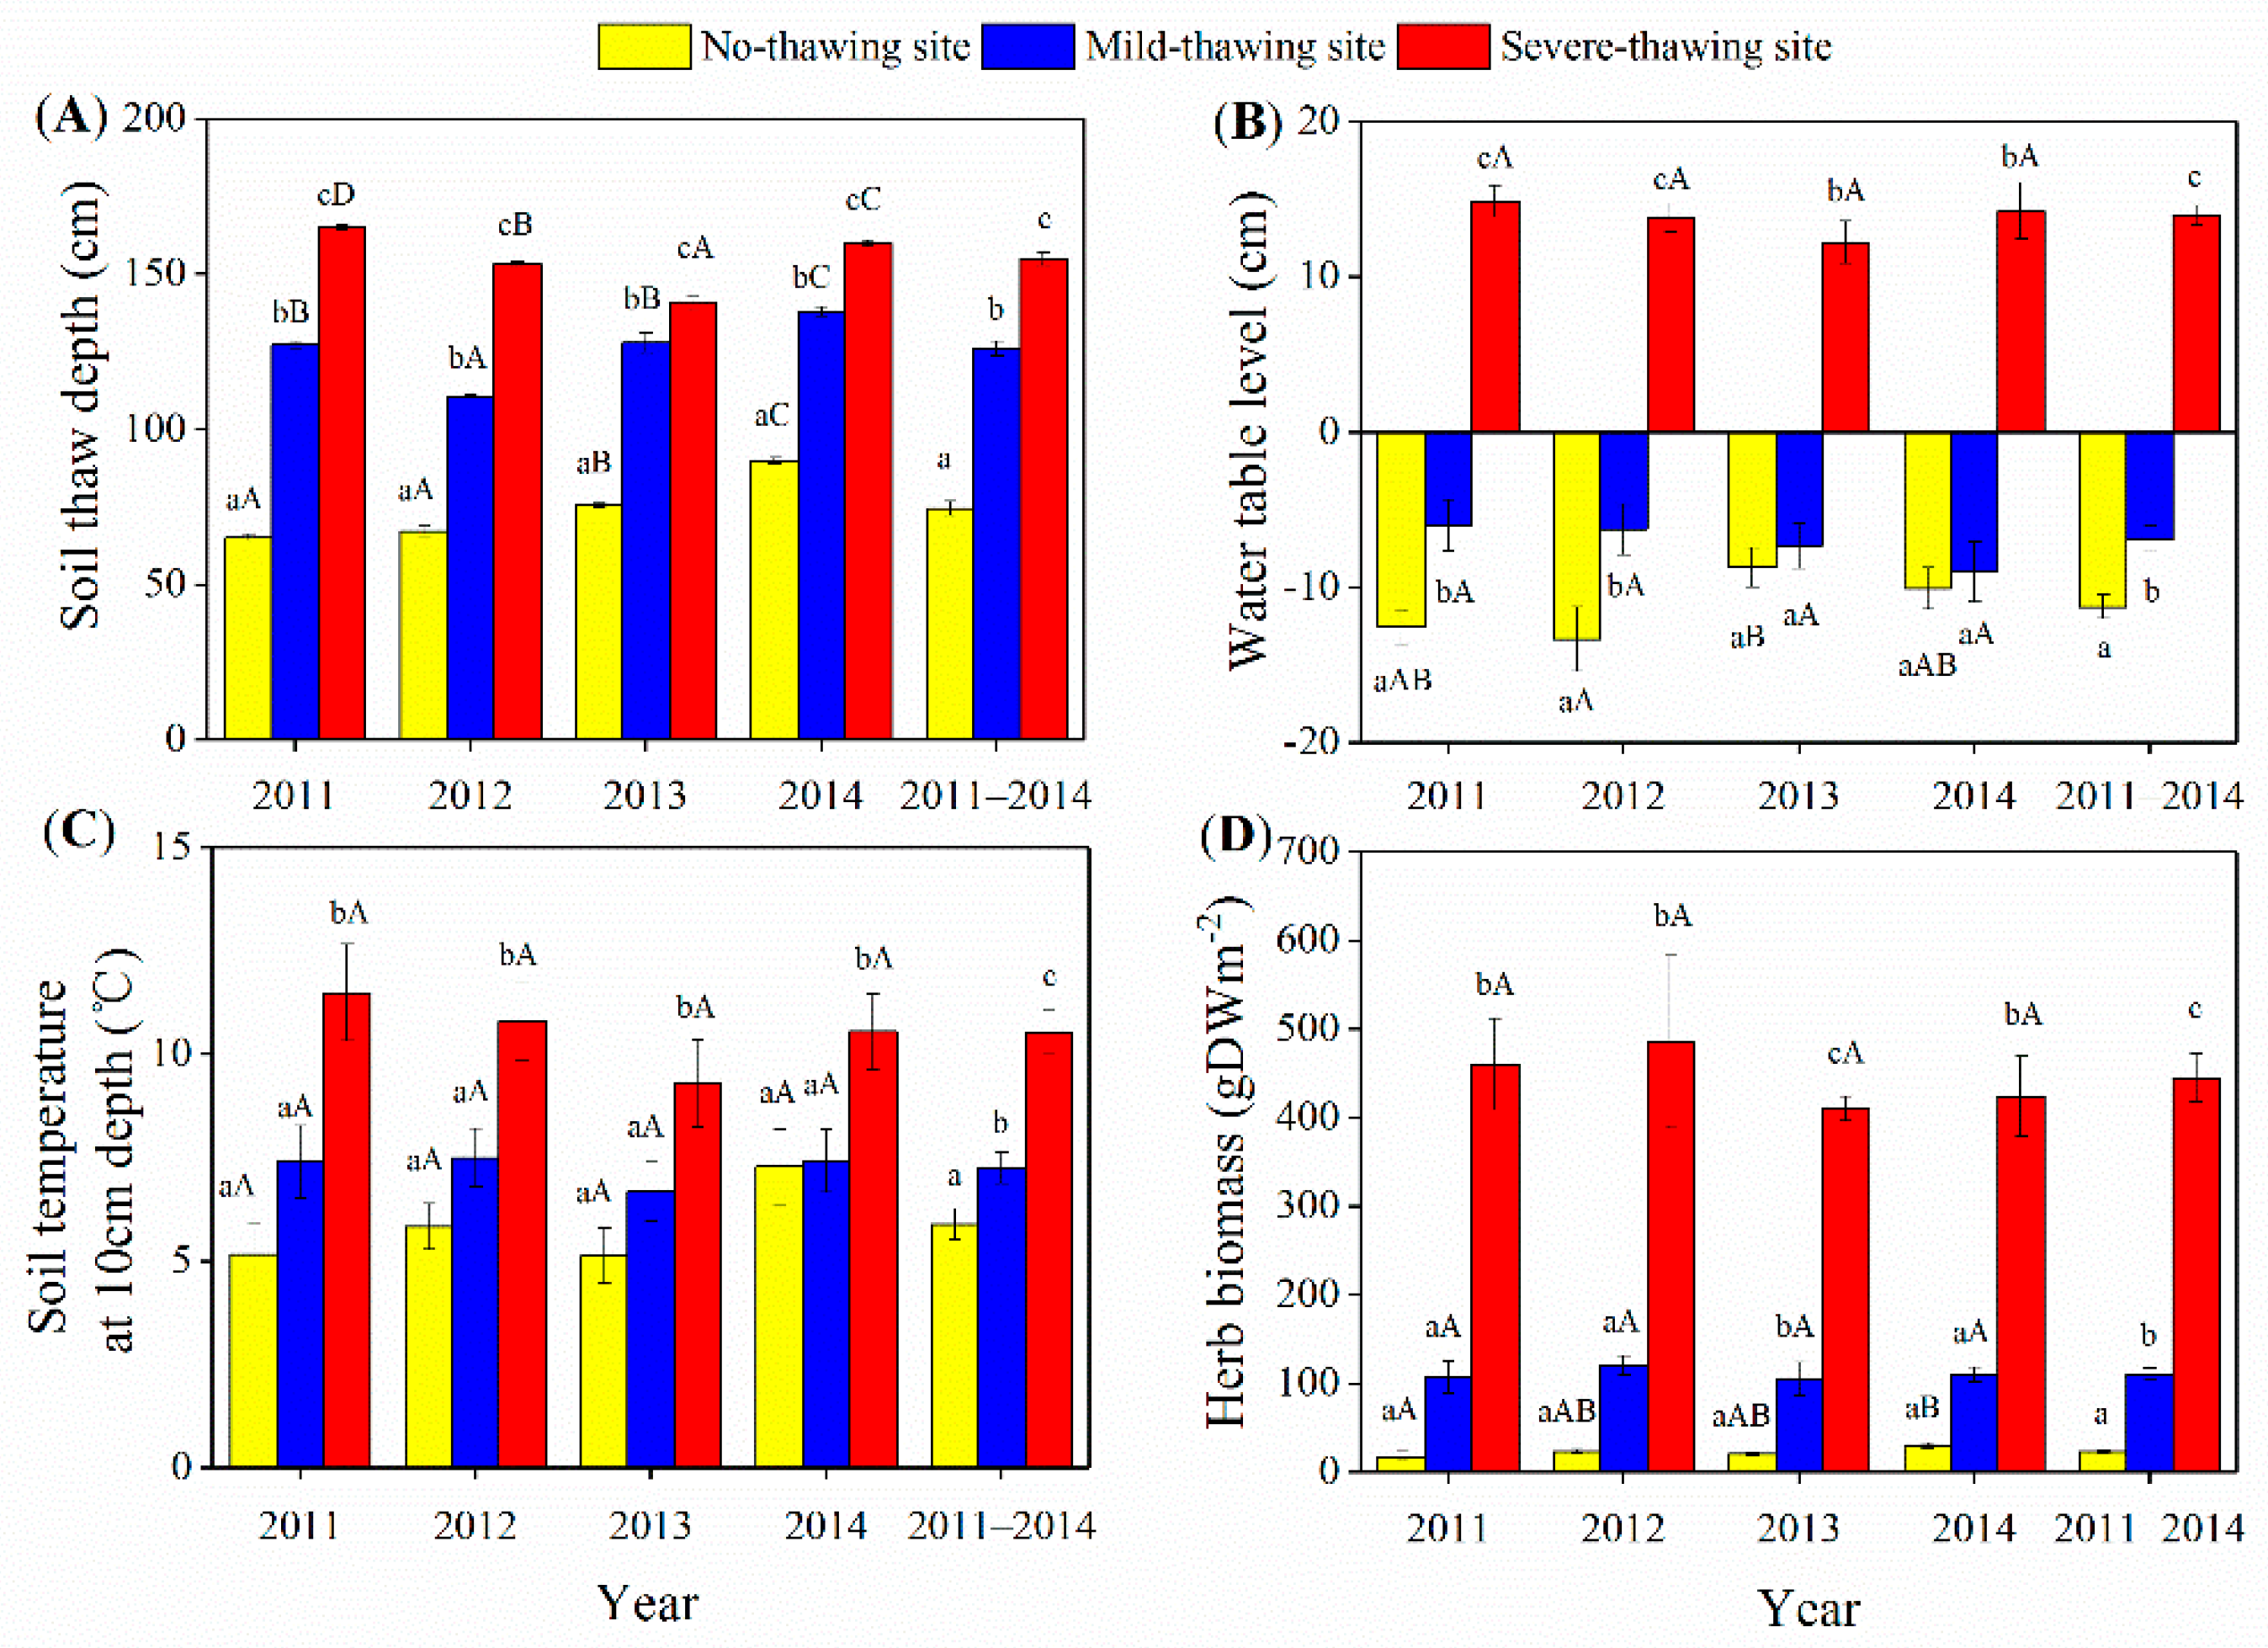
3.1. Variations of Environmental Factors

The highest temperatures and the highest precipitation appeared in July or August (Figure 1). Mean temperatures and precipitation during all four growing seasons (May to October) from 2011 to 2014 were above the 50-year average for years 1961–2010. Mean temperatures were 0.7 °C, 1.0 °C, 1.4 °C, and 0.3 °C higher, and precipitation amounts were 45.3 mm, 128.3 mm, 91.8 mm, and 116.9 mm more than the average. The highest yearly mean temperature was recorded in 2013, and the highest precipitation in 2012.
Among the observed years, the seasonal variations in the thawing depth, water table levels, and soil temperature at 10 cm depths were similar (Figure 2). The active layers peaked at the end of the growing season (Figure 2A). The soil temperatures peaked in July or August (Figure 2B). The water tables dropped to the lowest level of the year during the short drought period from June to July (Figure 2C). During the four investigated years, the maximum active layers were 65.2–90.0 cm, 110.8–138.0 cm, and 141–165.2 cm in the no-thawing, mild-thawing, and severe-thawing sites, respectively (Figure 3A). Seasonal mean water tables were −11.2 cm, −6.9 m, and 14.0 cm in no-thawing, mild-thawing, and severe-thawing sites, respectively (Figure 3B). Seasonal mean soil temperatures at a depth of 10 cm were 5.9 °C, 7.3 °C, and 10.5 °C in the no-thawing, mild-thawing, and severe-thawing sites, respectively (Figure 3C). Dominant plants shifted from trees/shrubs to herbs because of the permafrost thawing. The herb aboveground biomasses were 23.5, 111.0, and 445.2 gm−2 in permafrost no-thawing, mild-thawing, and severe-thawing sites, respectively (Figure 3D).

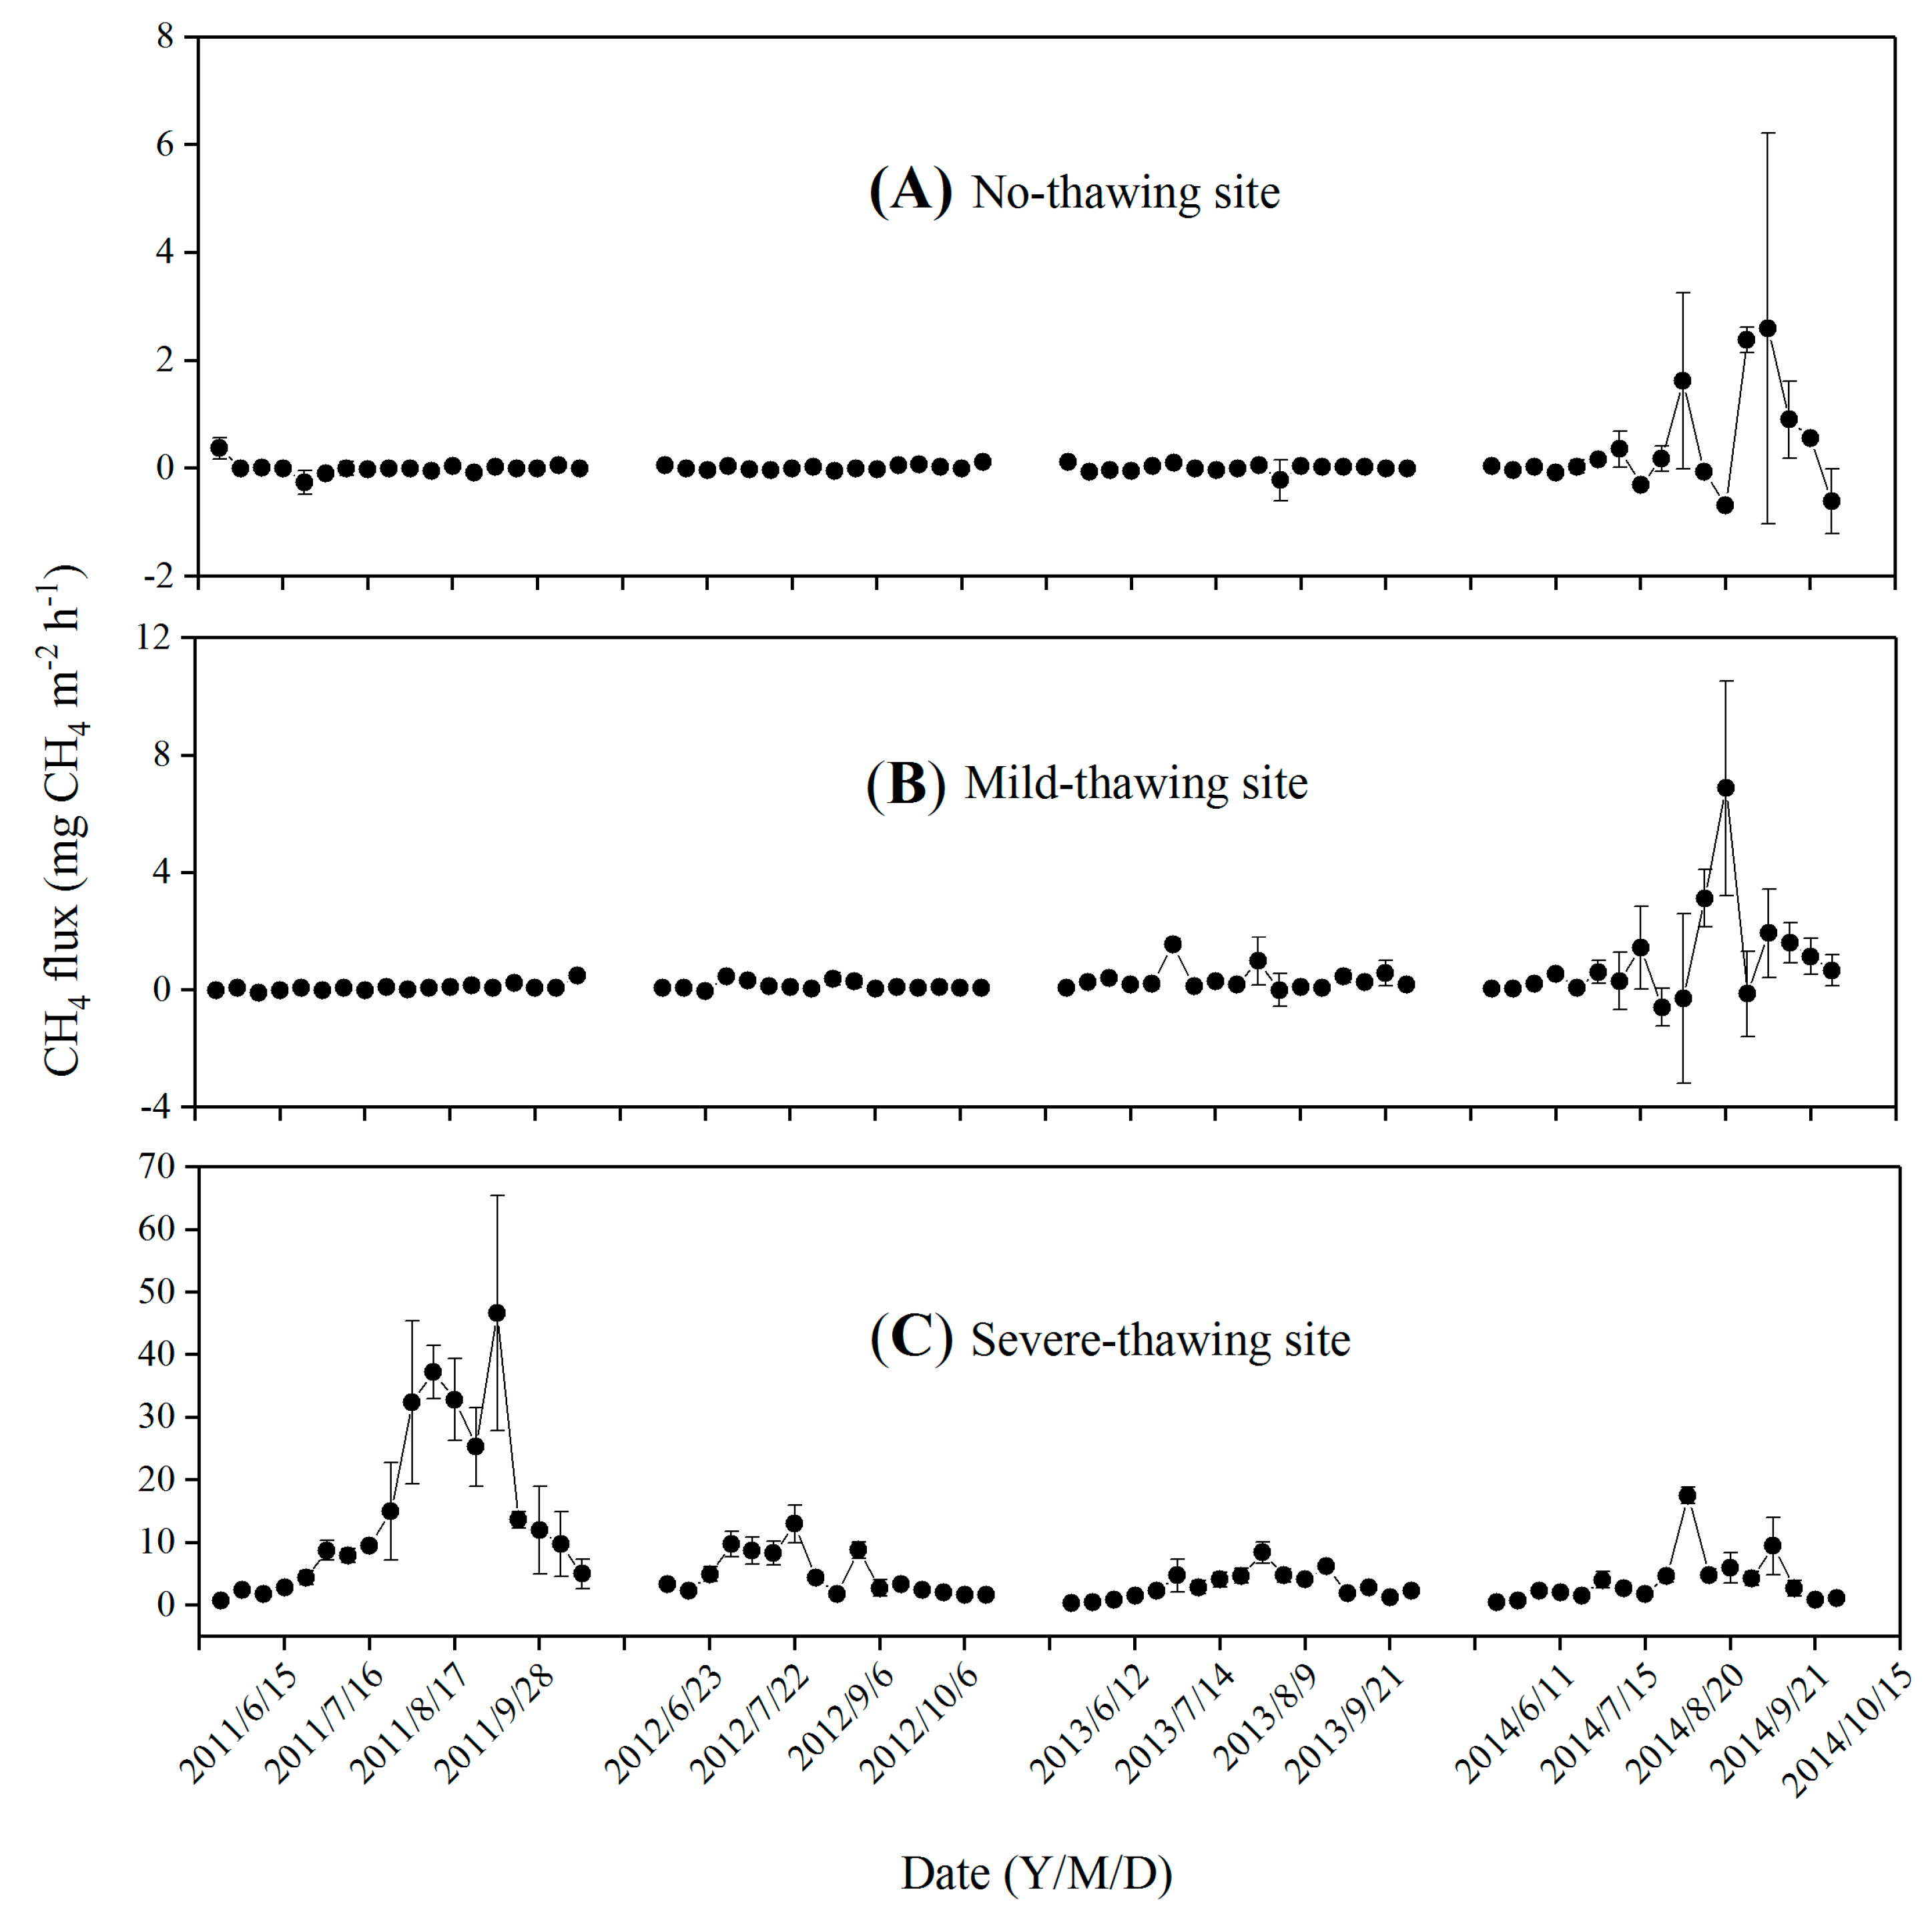
3.2. Seasonal Variations of CH4 Fluxes

In the no-thawing site in years 2011–2013 and in the mild-thawing site from 2011 to 2012, CH4 fluxes were low (≤0.5 mg m−2 h−1) and did not vary seasonally. In the other years, CH4 flux peaks appeared in summer, and the fluxes ranged from −0.68 to 2.60 mg CH4 m−2 h−1 in the no-thawing site and from −0.59 to 6.88 mg CH4 m−2 h−1 in the mild-thawing site, respectively (Figure 4A,B). Negative values indicate that peatlands absorb CH4 from the atmosphere.
Noticeable seasonal variations of CH4 fluxes ranged from 0.35 to 46.63 mg CH4 m−2 h−1 (Figure 4C) in the severe-thawing site. The CH4 fluxes were always ≤1 mg CH4 m−2 h−1 in spring before the soil active layer thawed. The fluxes peaked mostly in July and August, and occasionally in early September (e.g., September 3, 2011).
CH4 fluxes were positively related to soil temperatures and soil thawing depths (p < 0.05, Table 2) but not water tables (p > 0.05) in the no-thawing site. No relationship was found between CH4 fluxes and any environmental factors in the mild-thawing site (p > 0.05). CH4 fluxes were exponentially correlated with soil temperatures in the severe-thawing site (p > 0.01, Table 2). A quadratic relationship was found between CH4 fluxes and soil thawing depths (p < 0.01, Table 2), with no relationship between CH4 fluxes and water tables (p > 0.05).

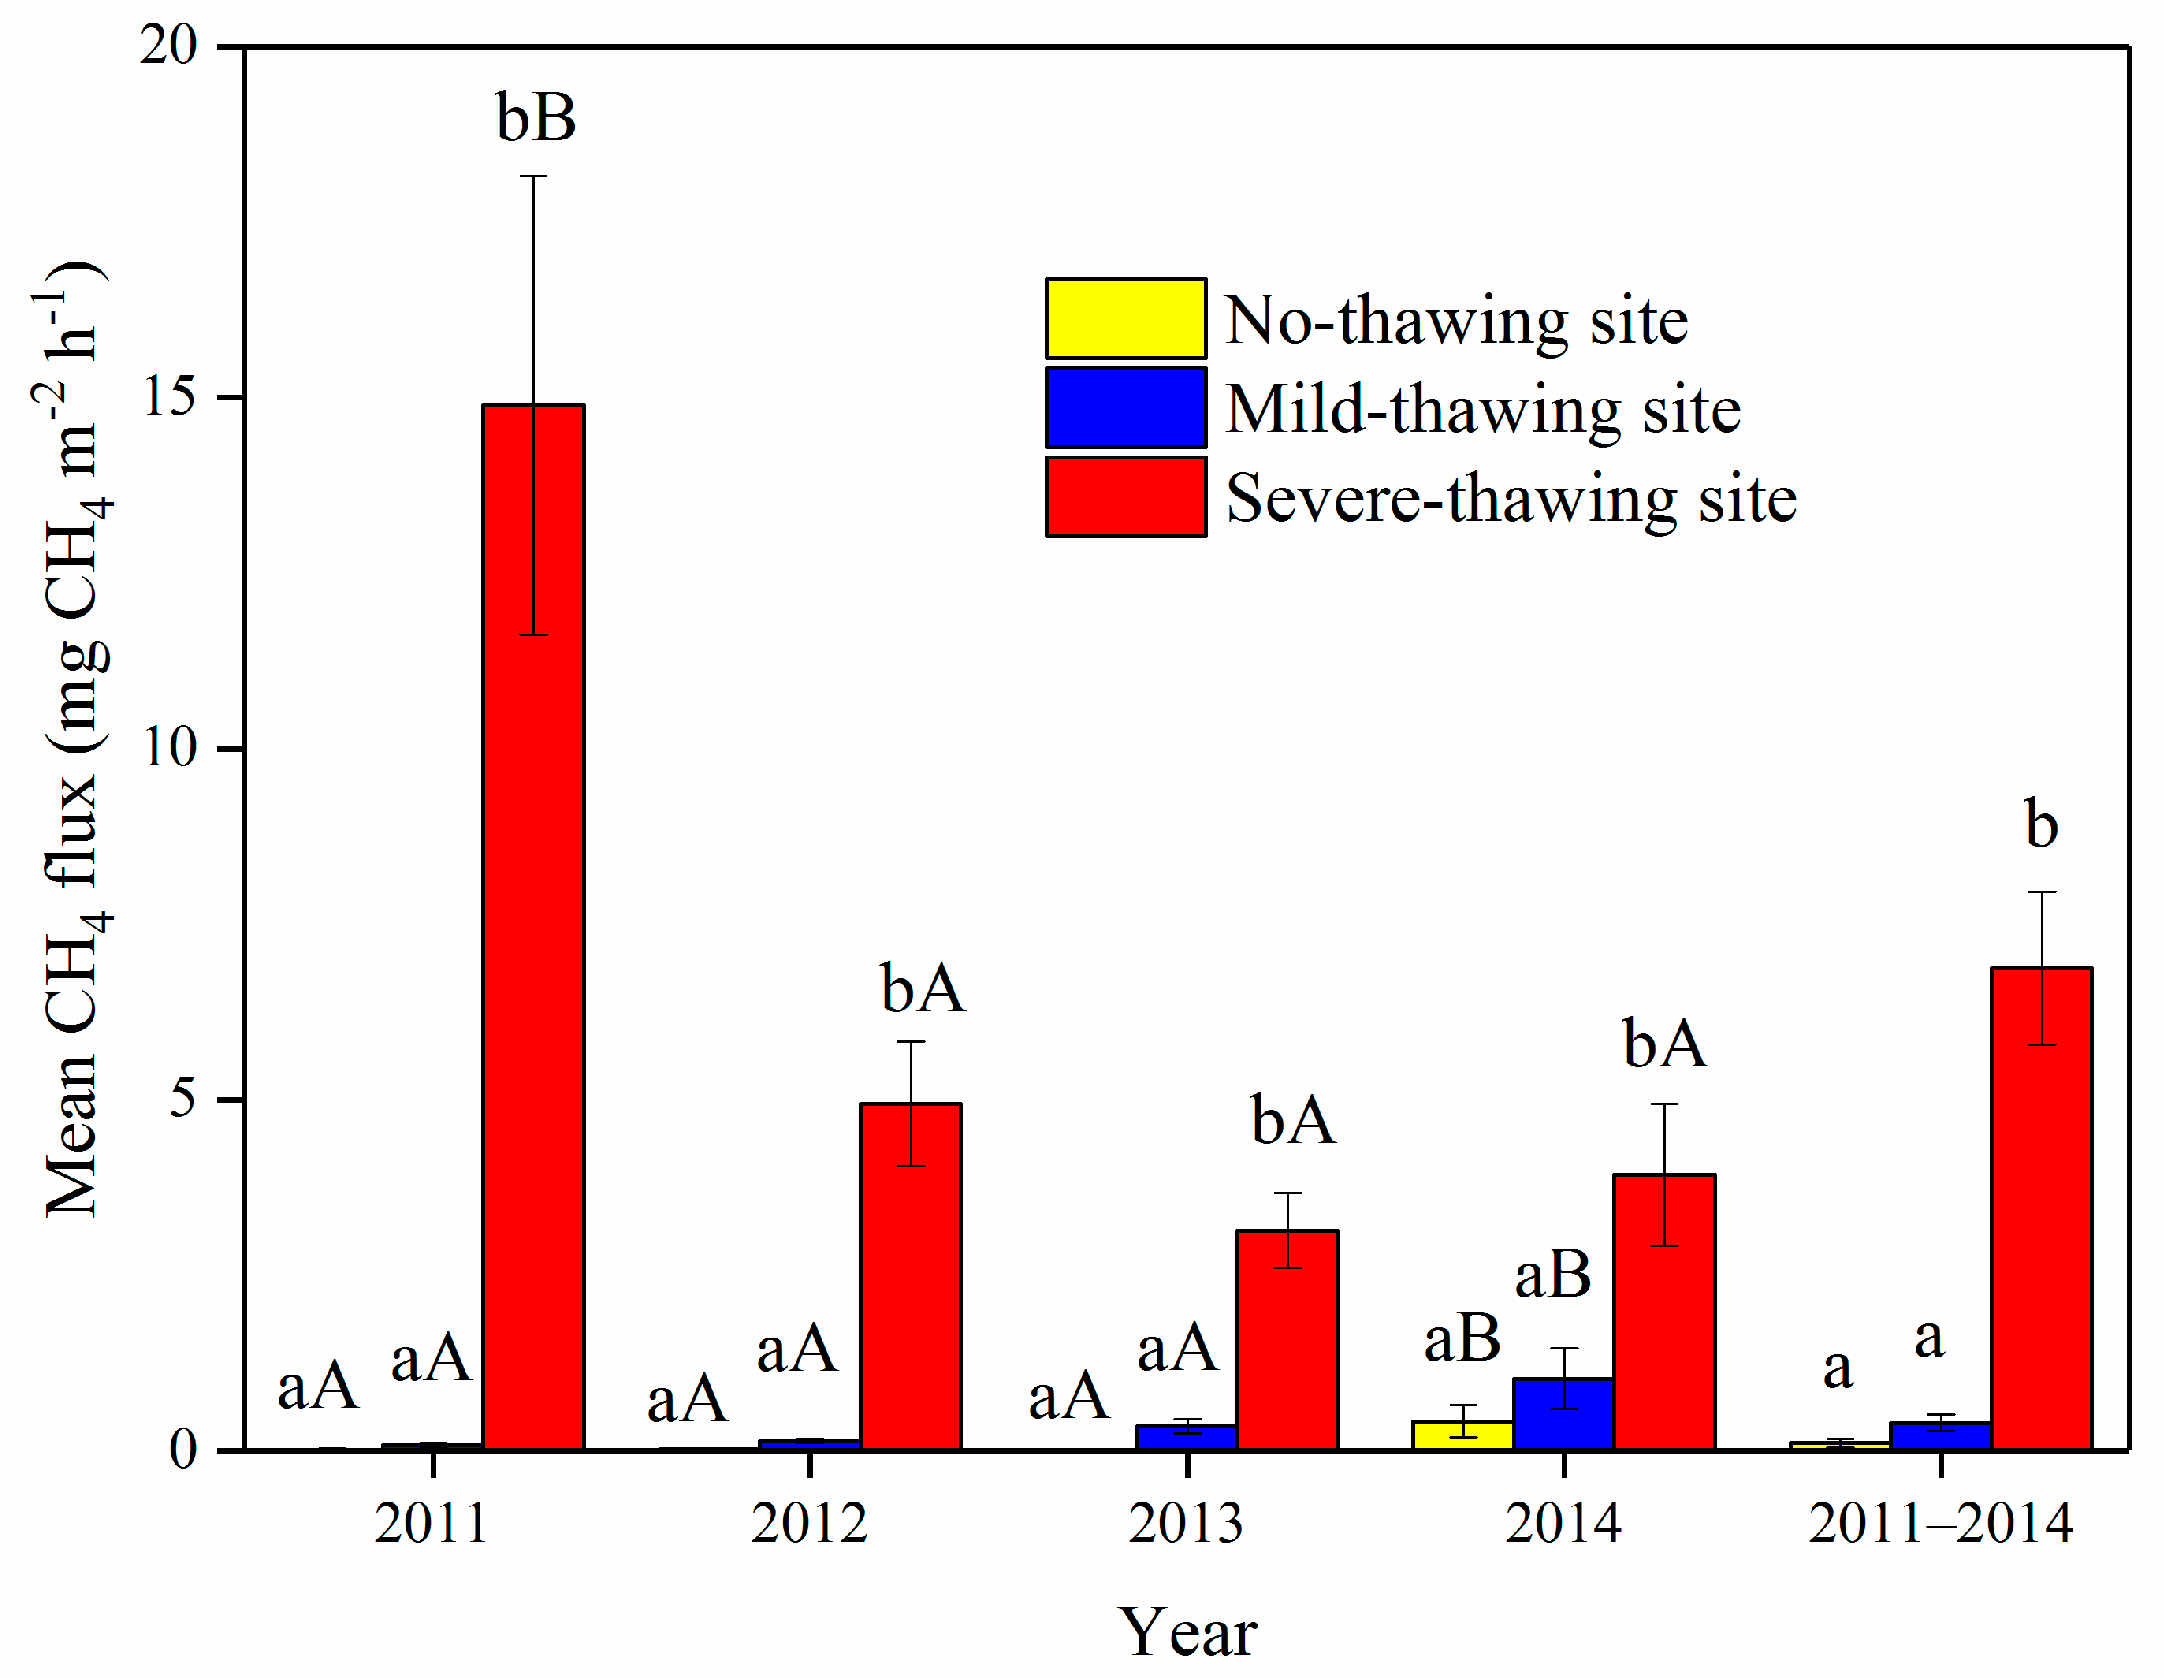
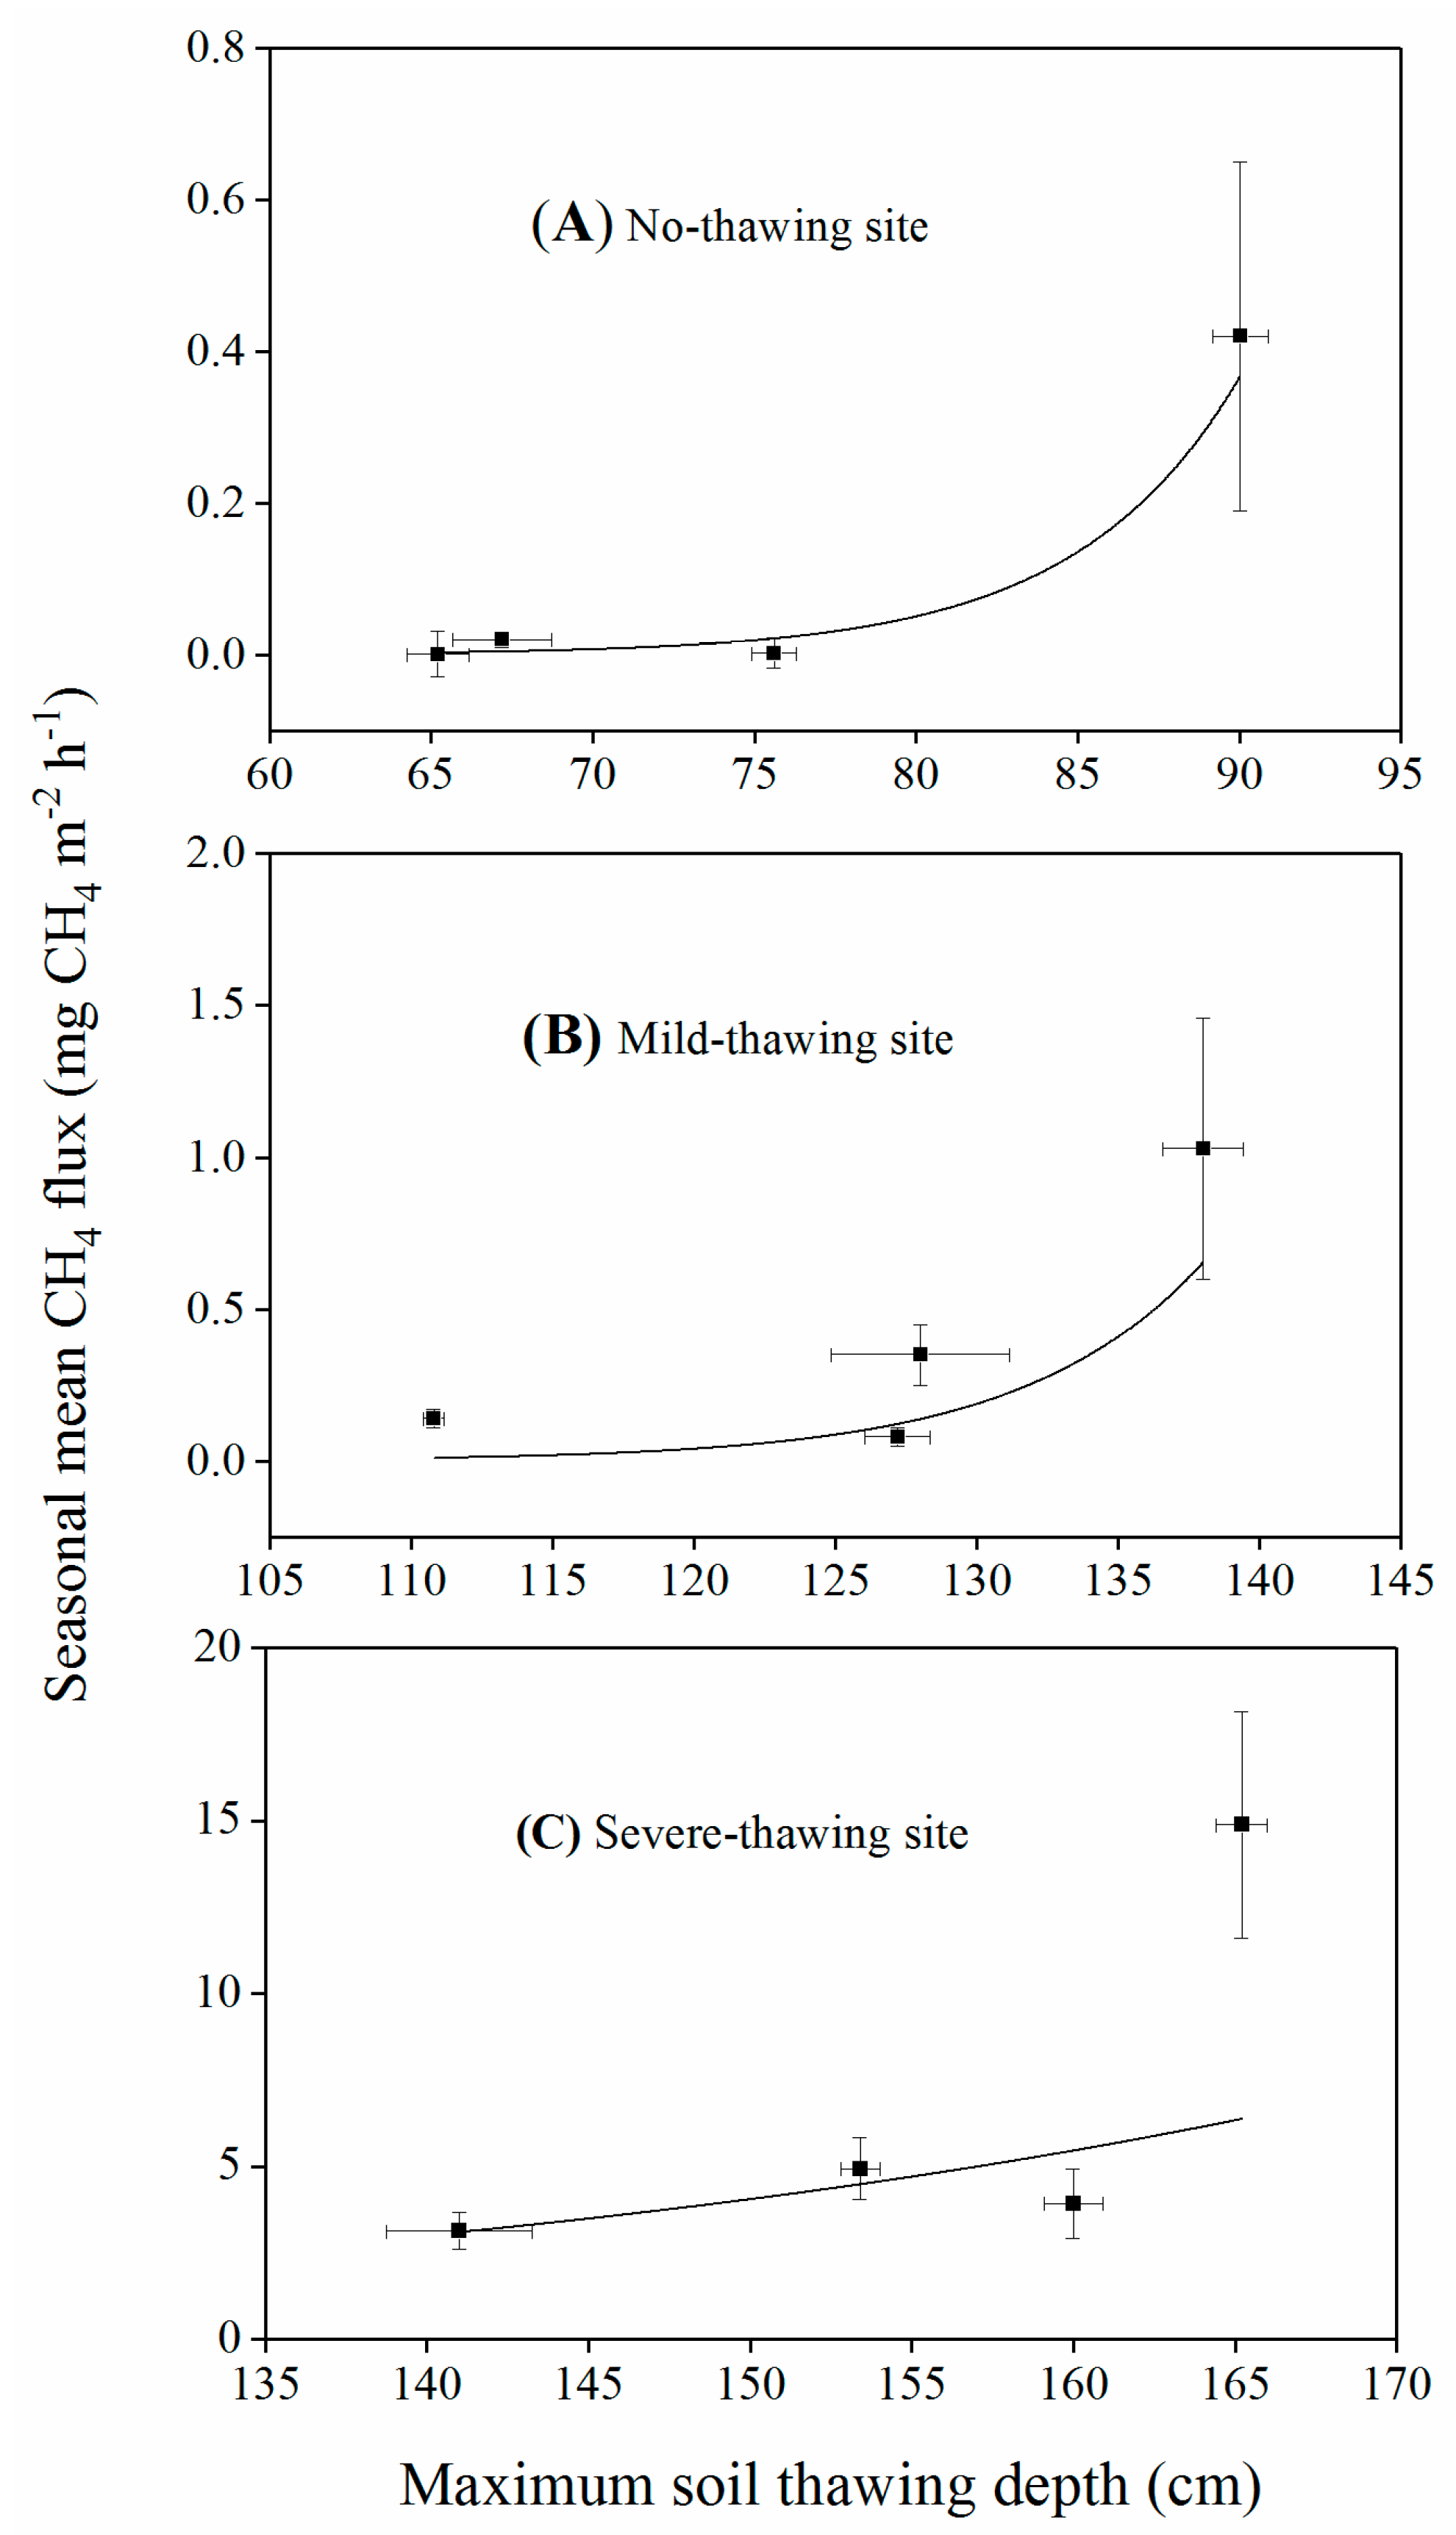
3.3. Annual and Spatial Variations of CH4 Fluxes

CH4 fluxes increased with thawing, as well as soil temperature, water table and aboveground biomass of herbs (Figure 3 and Figure 5). In the no-thawing and mild-thawing sites, mean CH4 fluxes were significantly higher in 2014 than in other years (Figure 5, p < 0.05), while in the severe-thawing site mean CH4 fluxes were significantly higher in 2011 (Figure 5, p < 0.001). Interannual variations of CH4 fluxes were in accordance with the variations of maximum thawing depth (R2 = 0.442−0.619, p = 0.213−0.335, Figure 6) but not with the variations in air temperature, water table depth, and other environmental factors.
Mean CH4 fluxes over the four growing seasons were 0.12 ± 0.06 mg CH4 m−2 h−1, 0.38 ± 0.12 mg CH4 m−2 h−1 and 6.58 ± 1.09 mg CH4 m−2 h−1 in the no-thawing, mild-thawing, and severe-thawing sites, respectively (Figure 5). The mean CH4 fluxes from the severe-thawing site were always significantly higher than from the mild-thawing and no-thawing sites (p < 0.001). However, no significant difference was found between mild- and no-thawing sites (p > 0.05).

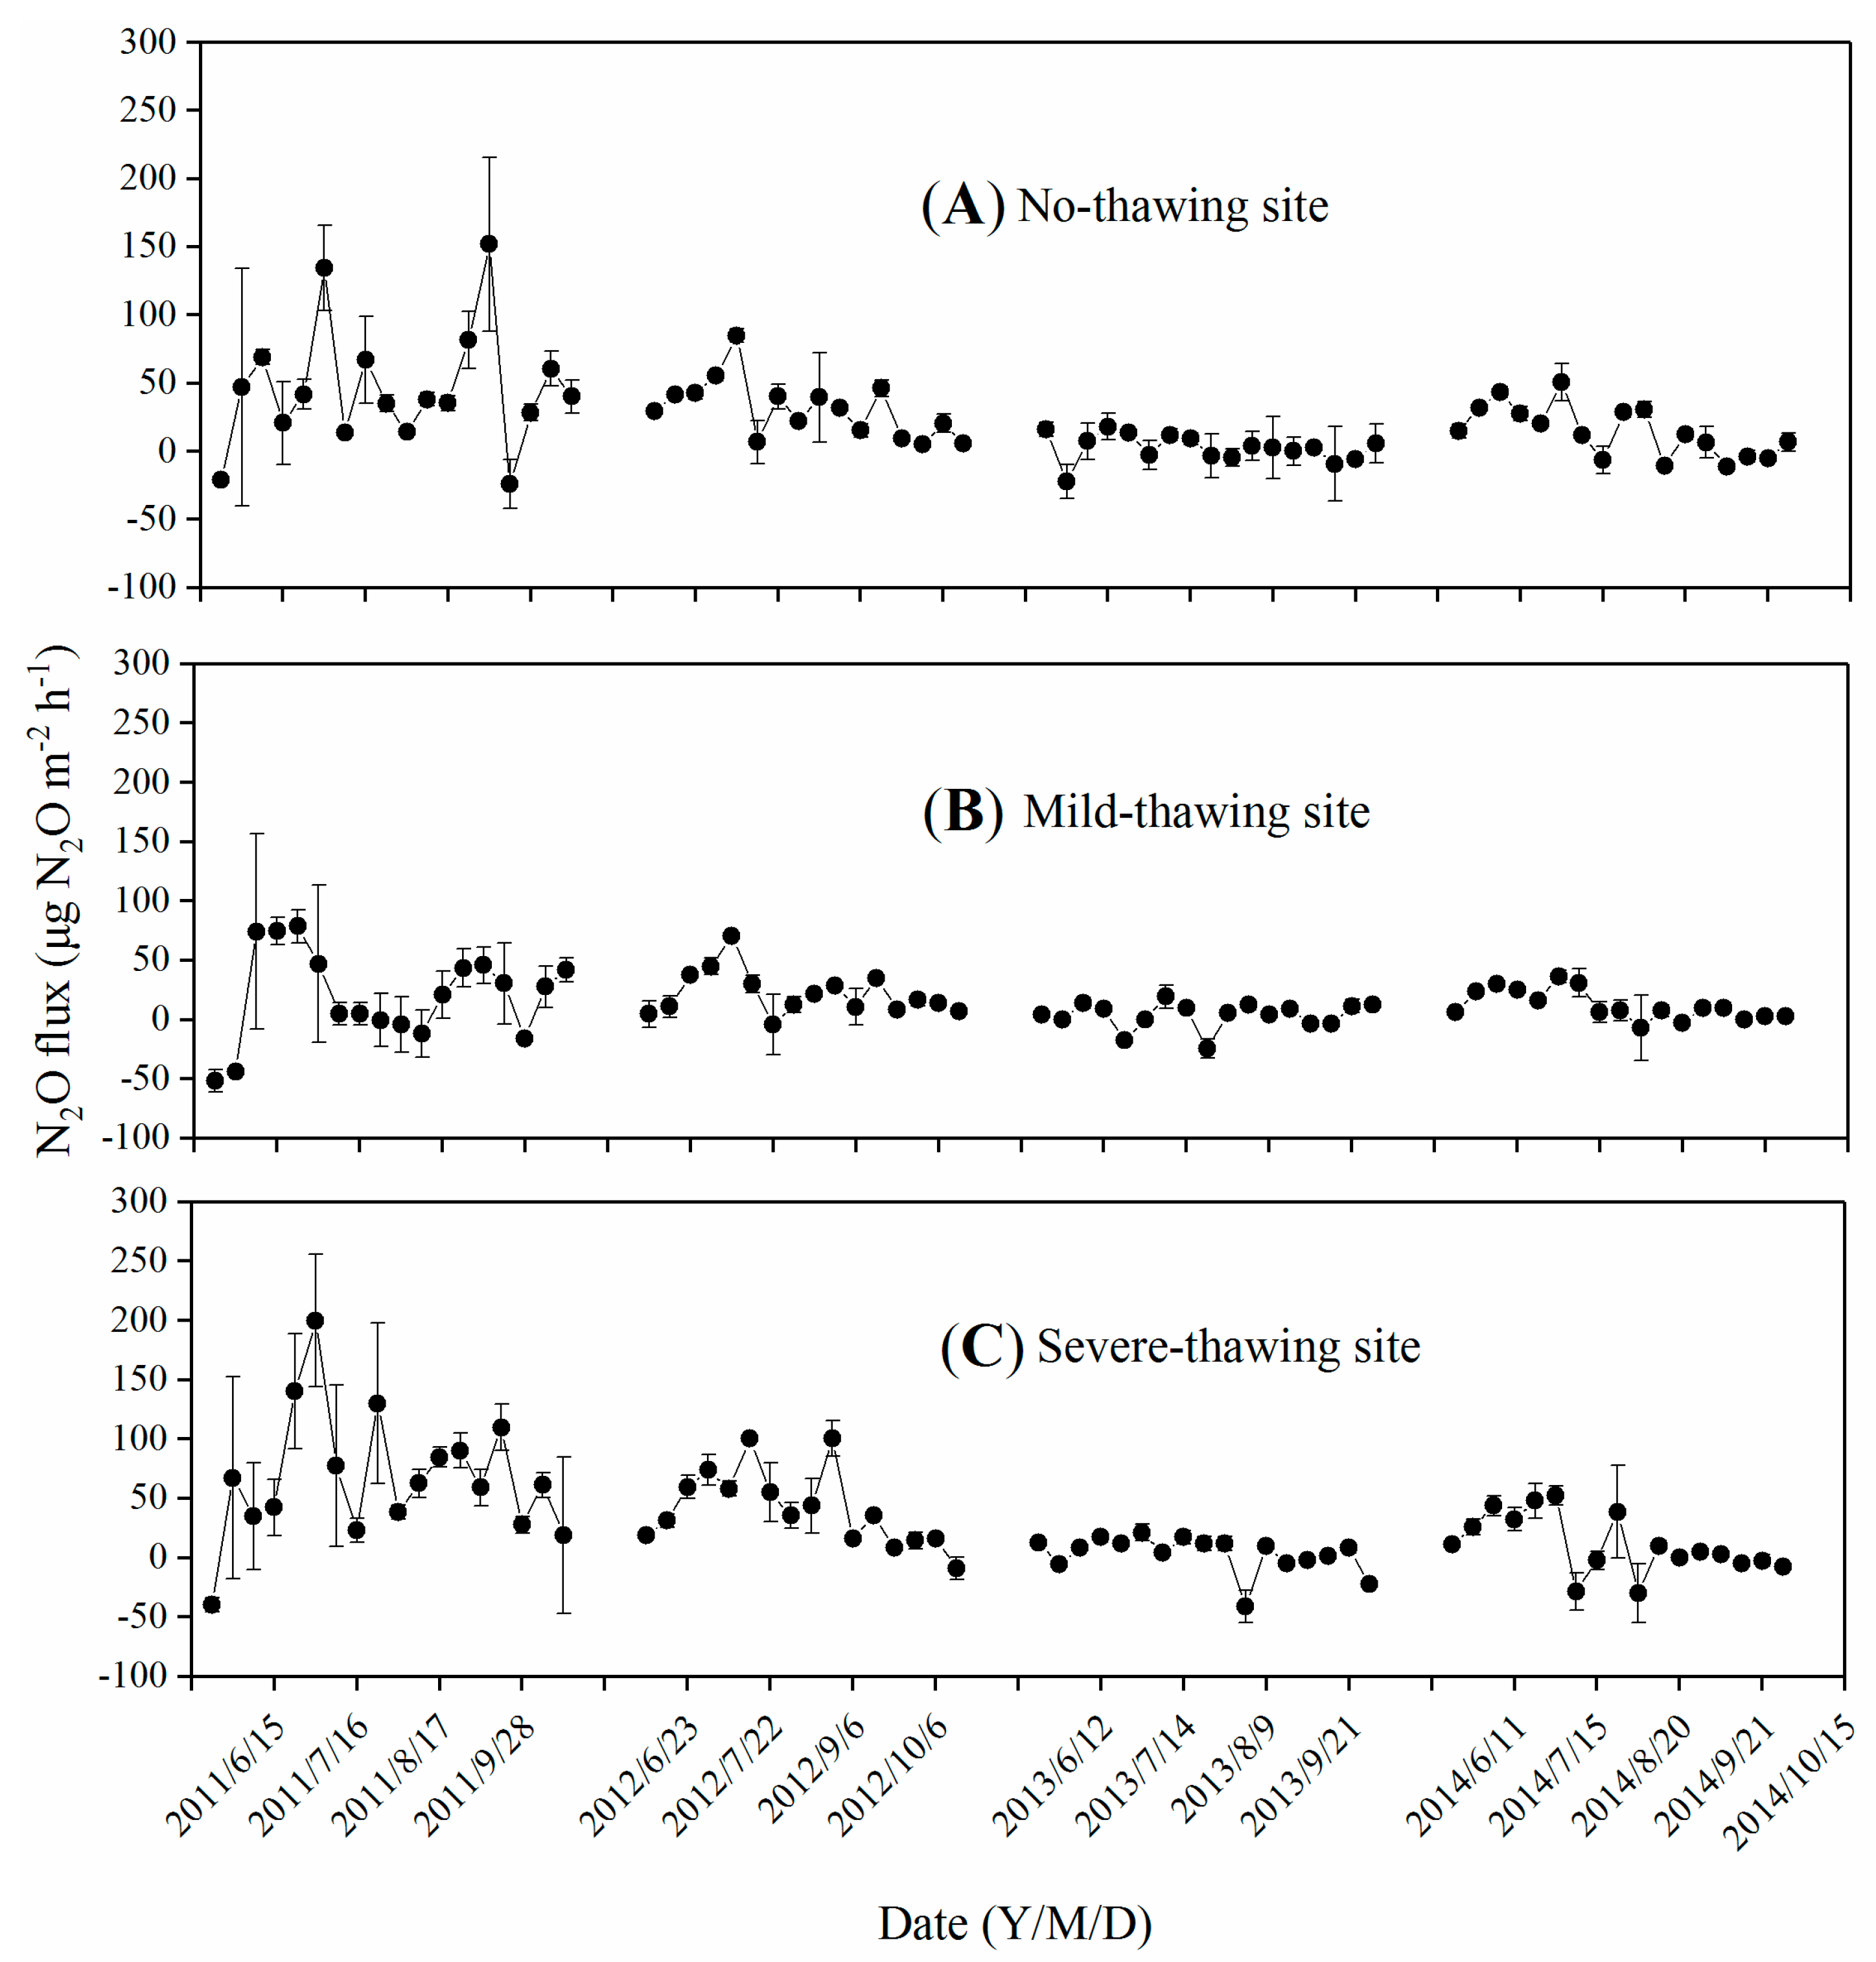
3.4. Seasonal Variations of N2O Fluxes

Obvious seasonal variations of N2O fluxes were observed in all four growing seasons, except in the no-thawing and severe-thawing sites in 2013 and in the mild-thawing site in 2013 and 2014. High N2O flux peaks with no more than 200 μg m−2 h−1 appeared in 2011 in all the three study sites, and those with low N2O flux peaks of about 20 μg m−2 h−1 appeared in 2013 (Figure 7). Flux peaks could appear in any month from June to September, and more than two peaks were observed at most sites and in most years. N2O absorptions were observed in all three study sites under different permafrost thawing conditions. The rates ranged from −24.1 to 151.8 μg N2O m−2 h−1, from −51.7 to 78.7 μg N2O m−2 h−1, and from −41.1 to 199.9 μg N2O m−2 h−1 in the no-thawing, mild-thawing, and severe-thawing sites, respectively (Figure 7). N2O fluxes were always low in years with little seasonal variations.
N2O fluxes increased with soil temperatures (p < 0.05) in the severe-thawing site but decreased with water levels (p < 0.01) in the no-thawing site (Table 3). No significant correlations were found between N2O fluxes and environmental factors in the mild-thawing site.

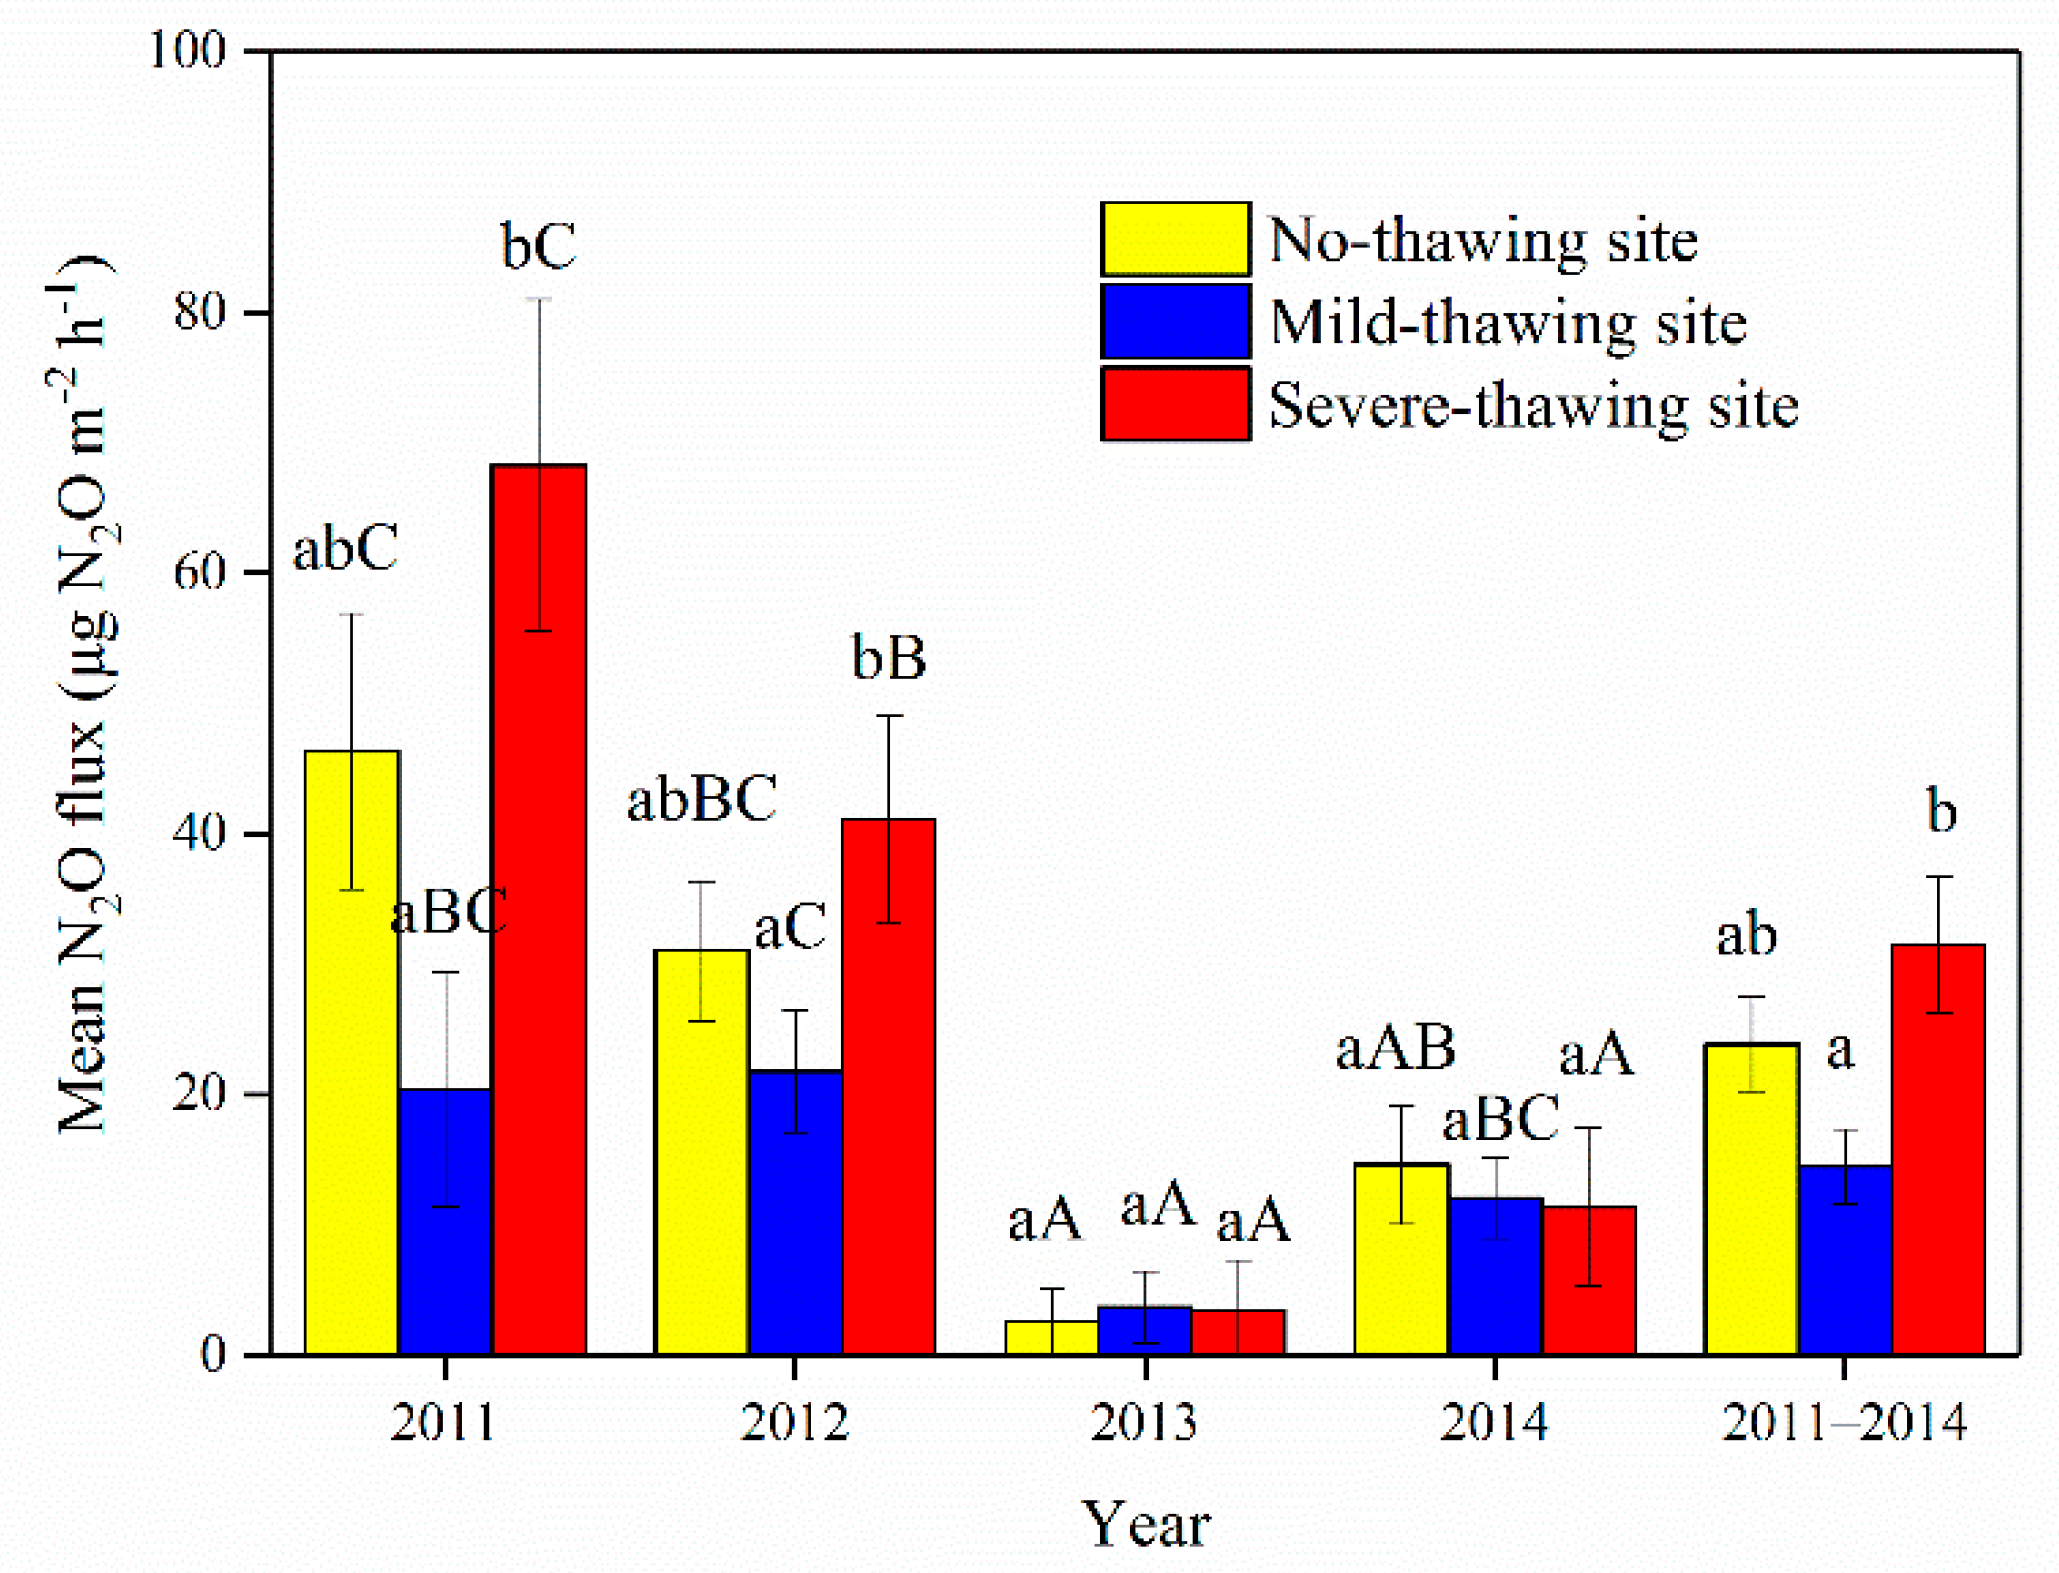
3.5. Annual and Spatial Variations of N2O fluxes

Mean N2O fluxes from the no-thawing site were significantly higher in 2011 than 2013 and 2014 (Figure 8, p > 0.05). Mean N2O fluxes from the mild-thawing site were significantly higher in 2012 than 2013 (p < 0.05), and both years were not significantly different from 2011 and 2014 (Figure 8, p > 0.05). In the severe-thawing site, the highest N2O fluxes happened in 2011 (Figure 8, p < 0.05).
Mean N2O fluxes from the severe-thawing site in 2011 and 2012 or over the entire four years were significantly higher than from the mild-thawing site (p < 0.01). No significant differences were found among the three sites in the years 2013 and 2014 (p > 0.05). Additionally, no significant differences were found between the no-thawing site and the other two sites in each and over the entire four years (p > 0.05). Mean N2O fluxes for the four growing seasons were 22.9 ± 3.6 μg N2O m−2 h−1, 13.9 ± 2.9 μg N2O m−2 h−1 and 30.2 ± 5.2 μg N2O m−2 h−1 in the no-thawing, mild-thawing, and severe-thawing sites, respectively (Figure 8). Mean N2O fluxes for the entire four-year period were higher in the severe-thawing than the mild-thawing site (Figure 8, p < 0.05).

4. Discussion

4.1. Permafrost Thawing Increased CH4 Fluxes

4.1.1. Effects of Thawing on Seasonal Variations of CH4 Fluxes

Our results showed that with permafrost thawing, seasonal variations of CH4 flux from peatlands became more noticeable, emission peaks became higher, and CH4 absorption frequency decreased or disappeared (Figure 4). This was in accordance with the results from peatlands in permafrost regions in northern Europe [50], Alaska [6,8,51], and Canada [52]. These responses are related to the increased soil inundation with permafrost thawing inducing a thicker anaerobic layer in peat, along with increased soil temperature, which enhanced CH4 production and emission.
There were significant correlations between CH4 fluxes and soil temperatures in the severe-thawing sites (Table 2). Temperature is one of the key factors in controlling CH4 emissions from wetlands [46,53]. High temperatures stimulate methanogenic bacteria activities and further accelerate CH4 production and emission. This has been demonstrated by previous studies [45,54,55]. The quadratic relationship between CH4 fluxes and soil thawing depths (p < 0.01, Table 2) in the severe-thawing site might be affected by soil temperature. Soil temperatures were highest in the middle of the growing season, resulting in higher CH4 emission rates in this period rather than at the end of the growing season, when the soil thaw depths were highest.
There were weak or no significant relationships (p > 0.05) between CH4 emissions and soil temperatures, soil thawing depth, or water tables in the no-thawing or mild-thawing sites (Table 2). This is because CH4 emissions were low in these two sites. Previous studies also showed that there were no significant relationships between CH4 emissions and environmental factors when CH4 fluxes were low enough to fluctuate near zero [46,53].
The water table is one of the most important factors controlling CH4 fluxes from wetlands. However, according to our previous results in the same region, the relationship was obvious between water table level and spatial variation of CH4 fluxes rather than seasonal variation of CH4 fluxes. This is because there was a time lag between the variations of water table and the CH4 fluxes from wetlands. CH4 fluxes may not change until some time (from hours to weeks) after the water table has changed [46]. The time lag effect of the water table on CH4 production and emission led to no correlation between seasonal variation of CH4 fluxes and the water table in all the three studied sites.
The seasonal mean CH4 emission increasing with thawing depth in this study is in line with previous reports. For example, in Siberia, when permafrost active layers deepened from 29.8 cm to 50.8 cm, mean CH4 fluxes increased six-fold [56]. CH4 fluxes from Alaskan peatlands with active permafrost depths more than 2.2 m were 15–28-fold higher than those from peatlands, where the permafrost active layer was only 0.4 m [51]. CH4 fluxes from discontinuous permafrost regions in western Canada increased by 30-fold with permafrost thawing [57]. Similarly, in our sites, the severe thawing increased the emission by 55-fold, which confirms part of our first hypothesis that permafrost thawing will increase the release of CH4 from peatlands in this region. This indicates that the frozen soil organic carbon may be more sensitive to global warming in the southern permafrost margin of Eurasia. Methane contributes 18.3% to global warming, only lower than CO2 [9]. Therefore, increased CH4 emissions caused by permafrost thawing in this region will provide a positive feedback to global warming.
The permafrost active layer deepened with thawing in our study peatlands. Thawing permafrost provides more organic substrates and more suitable temperatures for methanogens [3], or increases the abundance of methanogens [58,59]. Thus, CH4 production and emission rates increased. Furthermore, water levels rose with permafrost thawing, and vegetation types changed from trees and shrubs to herbs. Anaerobic conditions were the basis of CH4 production [12]. Herbs can provide more organic substrates for CH4 production [60,61] and provide a pathway for CH4 release which bypasses the oxic zone [62]. Therefore, the differences of CH4 emissions from peatlands under different permafrost thawing conditions were driven by the combined effects of permafrost active layer depth, water table levels and vegetation types, which is consist with our second hypothesis that increased CH4 release is driven by both biotic and abiotic factors.

4.1.2. Effects of Thawing on Annual Variations of CH4 Fluxes

There are few studies reporting the controls of interannual variations of CH4 emissions from peatlands. Huttunen et al. [63] found that interannual variation of CH4 emissions from ten minerotrophic peatlands was controlled by interannual variation of rain amounts. Results from a fen in New Hampshire and a bog in south Canada suggested that significant interannual differences of CH4 fluxes were driven by water table levels and air and peat temperatures [64,65]. In this study, we did not find significant relationships (p > 0.05) between annual mean CH4 fluxes and mean soil temperatures, water tables, or herb aboveground biomass because there were smaller interannual changes of these environmental factors or herb biomass. We found that annual mean CH4 fluxes were in accordance with the annual maximum thawing depth of the permafrost active layer in all three thawing or no-thawing sites, although without significant correlations between the emission and thawing depth (Figure 6). Miao et al. [42] found that seasonal CH4 fluxes were correlated to the thaw depth in the same permafrost region in northeast China. However, they only observed less than two years of CH4 fluxes and lacked interannual variations. Shigubara et al. [66] found that soil thawing depth can partly explain the interannual variations of CH4 flux in northeastern Siberia. Our results also showed that interannual variation of CH4 fluxes may be controlled by the differences of maximum permafrost active layer thawing depths; however, more years of data are needed to confirm this conclusion.

4.2. No Effects of Permafrost Thawing on N2O Fluxes

The similar seasonal N2O flux and N2O flux peaks among sites indicated that permafrost thawing did not change the seasonal N2O flux in our investigated peatland.
Seasonal variations of N2O fluxes from the no-thawing site were weak and negatively correlated to water table levels (p < 0.05) and did not correlate to permafrost thawing depth or peat temperature (Table 3). This indicated that high water table levels may inhibit N2O emissions in this site. Viru et al. [33] studied four disturbed peatlands and found that N2O emission was the highest when the water level was 30 to 40 cm below soil surface. Pärn et al. [32] found that N2O emissions from organic soils peaked at around 50% soil moisture and then decreased with the increase in soil moisture, which was accordance with our results. Similar results have also been found in other permafrost or seasonal frost regions [67,68]. In severe inundation conditions, wetlands might also change from a N2O source to a N2O sink [69].
No significant correlations were found between N2O fluxes and any observed environmental factors in the mild-thawing site (p > 0.05). This might be because some environmental factors were not included in our investigation, such as peat nitrogen availability [23,70], or because the low flux rates induced non-relationships between N2O fluxes and the environmental factors [71].
N2O fluxes were significantly and positively correlated to peat temperature (p < 0.01, Table 3) rather than permafrost thawing depth or water table level (p > 0.05) in the severe-thawing site. This is because the stable water levels in this site stayed between 10 and 20 cm above soil surface during most of the study period. Therefore, water condition was not the key controlling factor of N2O fluxes. With increasing peat temperature, available peat substrate and the active layer of nitrifying and denitrifying bacteria increased and further enhanced N2O production and effluxes [31,72]. Single environmental factors can explain no more than 10% of the seasonal N2O variations of the three studied sites, indicating that the process of N2O production and emission and the control factors are complex. No environmental factors showed enhanced or weakened correlations with N2O fluxes on the permafrost thawing gradients.
There were no significant differences of mean annual N2O emissions between no-thawing and mild-thawing sites (p > 0.05) or between the no-thawing and severe-thawing sites (p > 0.05) in this study. This is not consistent with part of our first hypothesis, that permafrost thawing will increase the release of N2O from peatlands in this region. Our results were in accordance with the previous study results in boreal and subarctic areas [73,74]. N2O emissions from Alaskan tundra remained at very low levels and did not increase with permafrost thawing [73]. N2O emissions did not increase with permafrost thawing in an Alaskan bog, where even zero emissions were found both in permafrost thawing and no-thawing sites [74]. There were also some different results. Permafrost cores collected from Greenland showed N2O production rates 20-fold higher after permafrost thawing, drainage, and rewetting [5]. However, how much of this produced N2O could be released to the atmosphere remained unknown. The results from the discontinuous permafrost zone in northeast Europe and Russia showed that N2O emissions from bare peat or vegetated peat surface were both promoted by permafrost thawing, with a five-fold increase from 0.56 to 2.81 mg N2O m−2 d−1 [26,27]. This is in accordance with Elberling’s lab incubation results [5]. However, we did not find this kind of increasing trend of N2O emissions during observation over four growing seasons. One reason is that the increased water table after permafrost thaw inhibited N2O emissions from peatland, as mentioned above. Another reason may be due to the changes of plants. Increased herb biomass along the permafrost thawing gradient indicated that plants may absorb more nutrient, consequently inhibiting N2O production by competing for NO3 with soil microorganisms [27,75]. Due to the inhibition of the water table and plants, N2O emission did not increase significantly, although the active layer and soil temperature increased after permafrost thawing.
N2O emissions from the severe-thawing site were significantly higher than those from the mild-thawing site. These differences were in accordance with soil temperature, soil thawing depth, water level, and herb aboveground biomass. However, N2O emissions from the mild-thawing sites decreased more compared to the no-thawing site, although there were the same changing trends of environmental factors between the mild-thawing and no-thawing sites as between the severe-thawing and mild-thawing sites. Therefore, there were no gradually increasing trends of N2O emissions from sites with permafrost thawing because of the complexity of controlling environmental factors or low emission rates. Because the N2O emission from peatland in this region did not increase or decrease significantly with permafrost thawing, there was no significant positive or negative feedback on global warming.

5. Conclusions

Our study shows that with more severe permafrost thawing, seasonal variations of CH4 emissions from peatlands notably increased, CH4 emission peaks became higher, CH4 absorption decreased, and, in some cases, gradually disappeared. Mean seasonal CH4 emission rates were significantly higher (p < 0.05) from the severe-thawing site than the mild-thawing and no-thawing sites, which confirmed part of our hypothesis that permafrost thawing will increase CH4 emissions from peatlands in this region. Increasing CH4 emission was induced by the deeper permafrost active layer and in conjunction with the increases in soil temperature, water table level, and changes of vegetation composition and biomass. As global warming continues, permafrost thawing in these peatlands will become more severe. Severe thawing will release more CH4 to the atmosphere and further amplify global warming. Due to the inhibition of water table and herb biomass increase, N2O emissions showed no changes in either seasonal variations or average seasonal rates, although the active layer and soil temperature increased after permafrost thawing. Therefore, even though global warming continues and permafrost thawing become more severe, N2O emissions from the peatlands in this area will not increase and will have little feedback to the global climate.

Author Contributions

Conceptualization and methodology, X.S. and C.S.; investigation, X.S. and X.J.; data curation, X.S. and H.W.; writing—original draft preparation, X.S. and T.C.; writing—review and editing, X.S., H.W., C.S., X.J., C.J.R., and T.C. All authors have read and agreed to the published version of the manuscript.

Funding

This research was funded by the National Natural Science Foundation of China (grant number 31870443, 41001052); the Fundamental Research Funds for the Central Universities (grant number 2572020BA06); and the Natural Science Foundation of Heilongjiang Province of China (grant number LH2020C033).

Institutional Review Board Statement

Not applicable.

Informed Consent Statement

Not applicable.

Data Availability Statement

The data applied in this study are available on request from the first and the corresponding author.

Acknowledgments

We would like to thank Lin Ye, Jian Wang, Yueqiang Sun and Zhaoping Wang from Yichun Forestry Bureau for their help in field sampling, and Randy Neighbarger from Duke University for his help in language editing.

Conflicts of Interest

The authors declare no conflict of interest.

References

  1. Zhang, T.; Barry, R.G.; Knowles, K.; Heginbottom, J.A.; Brown, J. Statistics and characteristics of permafrost and ground-ice distribution in the Northern Hemisphere. Polar Geogr. 2008, 31, 47–68. [Google Scholar] [CrossRef]
  2. Tarnocai, C.; Canadell, J.G.; Schuur, E.A.G.; Kuhry, P.; Mazhitova, G.; Zimov, S. Soil organic carbon pools in the northern circumpolar permafrost region. Glob. Biogeochem. Cycles 2009, 23, GB2023. [Google Scholar] [CrossRef]
  3. Schuur, E.A.G.; Mcguire, A.D.; Schädel, C.; Grosse, G.; Harden, J.W.; Hayes, D.J.; Hugelius, G.; Koven, C.D.; Kuhry, P.; Lawrence, D.M.; et al. Climate change and the permafrost carbon feedback. Nature 2015, 520, 171–179. [Google Scholar] [CrossRef]
  4. Lawrence, D.M.; Slater, A.G. A projection of severe near-surface permafrost degradation during the 21st century. Geophys. Res. Lett. 2005, 32, L24401. [Google Scholar] [CrossRef] [Green Version]
  5. Elberling, B.; Christiansen, H.H.; Hansen, B.U. High nitrous oxide production from thawing permafrost. Nat. Geosci. 2010, 3, 332–335. [Google Scholar] [CrossRef]
  6. Natali, S.M.; Schuur, E.A.G.; Mauritz, M.; Schade, J.D.; Celis, G.; Grummer, K.G.; Johnston, C.; Krapek, J.; Pegoraro, E.; Salmon, V.G.; et al. Permafrost thaw and soil moisture driving CO2 and CH4 release from upland tundra. J. Geophys. Res. Biogeosci. 2015, 120, 525–537. [Google Scholar] [CrossRef]
  7. Kohnert, K.; Serafimovich, A.; Metzger, S.; Hartmann, J.X.R.; Sachs, T. Strong geologic methane emissions from discontinuous terrestrial permafrost in the Mackenzie Delta, Canada. Sci. Rep. 2017, 7, 5828. [Google Scholar] [CrossRef] [PubMed] [Green Version]
  8. Lara, M.J.; Lin, D.H.; Andresen, C.; Lougheed, L.; Tweedie, C.E. Nutrient Release From Permafrost Thaw Enhances CH4 Emissions From Arctic Tundra Wetlands. J. Geophys. Res. Biogeosci. 2019, 124, 1560–1573. [Google Scholar] [CrossRef]
  9. IPCC 2007. Climate Change 2007: The Physical Science Basis; Cambridge University Press: New York, NY, USA, 2007. [Google Scholar]
  10. Johansson, T.; Malmer, N.; Crill, P.; Friborg, T.; Åkerman, J.; Mastepanov, M.; Christensen, T.R. Decadal vegetation changes in a northern peatland, greenhouse gas fluxes and net radiative forcing. Glob. Chang. Biol. 2006, 12, 2352–2369. [Google Scholar] [CrossRef]
  11. Turetsky, M.R.; Wieder, R.K.; Vitt, D.H.; Evans, R.J.; Scott, K.D. The disappearance of relict permafrost in boreal north America: Effects on peatland carbon storage and fluxes. Glob. Chang. Biol. 2007, 13, 1922–1934. [Google Scholar] [CrossRef]
  12. Segers, R. Methane production and methane consumption-a review of processes underlying wetland methane fluxes. Biogeochemistry 1998, 41, 23–51. [Google Scholar] [CrossRef]
  13. Richardson, D.; Felgate, H.; Watmough, N.; Thomson, A.; Baggs, E. Mitigating release of the potent greenhouse gas N2O from the nitrogen cycle—Could enzymic regulation hold the key? Trends Biotechnol. 2009, 27, 388–397. [Google Scholar] [CrossRef]
  14. Åkerman, H.J.; Johansson, M. Thawing permafrost and thicker active layers in sub-arctic Sweden. Permafr. Periglac. Process. 2008, 19, 279–292. [Google Scholar] [CrossRef]
  15. Kim, Y. Effect of thaw depth on fluxes of CO2 and CH4 in manipulated Arctic coastal tundra of Barrow, Alaska. Sci. Total Environ. 2015, 505, 385–389. [Google Scholar] [CrossRef] [PubMed]
  16. Romanovsky, V.E.; Sazonova, T.S.; Balobaev, V.T.; Shender, N.I.; Sergueev, D.O. Past and recent changes in air and permafrost temperatures in eastern Siberia. Glob. Planet. Chang. 2007, 56, 399–413. [Google Scholar] [CrossRef]
  17. Christensen, T.R.; Johansson, T.R.; Åkerman, H.J.; Mastepanov, M.; Malmer, N.; Friborg, T.; Crill, P.; Svensson, B.H. Thawing sub-arctic permafrost: Effects on vegetation and methane emissions. Geophys. Res. Lett. 2004, 31, L04501. [Google Scholar] [CrossRef]
  18. Bubier, J.L.; Moore, T.R. An ecological perspective on methane emission from northern wetlands. Trends. Ecol. Evol. 1994, 9, 460–464. [Google Scholar] [CrossRef]
  19. Yan, L.; Zhang, X.; Wu, H.; Kang, E.; Li, Y.; Wang, J.; Yan, Z.; Zhang, K.; Kang, X. Disproportionate changes in the CH4 emissions of six water table levels in an alpine peatland. Atmosphere 2020, 11, 1165. [Google Scholar] [CrossRef]
  20. Anisimov, O.A.; Reneva, S. Permafrost and changing climate: The Russian perspective. Ambio 2006, 35, 169–175. [Google Scholar] [CrossRef]
  21. Friborg, T.; Christensen, T.R.; Hansen, B.U.; Nordstroem, C.; Soegaard, H. Trace gas exchange in a high-arctic valley 2: Landscape CH4 fluxes measured and modeled using eddy correlation data. Glob. Biogeochem. Cycles 2000, 14, 715–724. [Google Scholar] [CrossRef]
  22. van Huissteden, J.; Maximov, T.C.; Dolman, A.J. High methane flux from an arctic floodplain (Indigirka lowlands, eastern Siberia). J. Geophys. Res. 2005, 110, G02002. [Google Scholar] [CrossRef] [Green Version]
  23. Salmon, V.G.; Soucy, P.; Maurizt, M.; Celis, G.; Natali, S.M.; Mack, M.C.; Schuur, E.A.G. Nitrogen availability increases in a tundra ecosystem during five years of experimental permafrost thaw. Glob. Chang. Biol. 2016, 22, 1927–1941. [Google Scholar] [CrossRef] [PubMed]
  24. Liu, Y.S.; Zhu, R.B.; Ma, D.W.; Xu, H.; Luo, Y.H.; Huang, T.; Sun, L.G. Temporal and spatial variations of nitrous oxide fluxes from the littoral zones of three alga-rich lakes in coastal Antarctica. Atmos. Environ. 2012, 45, 1464–1475. [Google Scholar] [CrossRef]
  25. Teepe, R.; Brumme, R.; Beese, F. Nitrous oxide emissions from soil during freezing and thawing periods. Soil. Biol. Biochem. 2001, 33, 1269–1275. [Google Scholar] [CrossRef]
  26. Voigt, C.; Lamprecht, R.E.; Marushchak, M.E.; Lind, A.; Novakovskiy, A.; Aurela, M.; Martikainen, P.J.; Biasi, C. Warming of subarctic tundra increases emissions of all three important greenhouse gases-carbon dioxide, methane, and nitrous oxide. Glob. Chang. Biol. 2017, 23, 3121–3138. [Google Scholar] [CrossRef] [PubMed]
  27. Voigt, C.; Marushchak, M.E.; Lamprecht, R.E.; Jackowicz-Korczyńskic, M.; Lindgren, A.; Mastepanov, M.; Granlund, L.; Christensen, T.R.; Tahvanainen, T.; Martikainen, P.J.; et al. Increased nitrous oxide emissions from Arctic peatlands after permafrost thaw. Proc. Natl. Acad. Sci. USA 2017, 114, 6238–6243. [Google Scholar] [CrossRef] [PubMed] [Green Version]
  28. Payette, S.; Delwaide, A.; Caccianiga, M.; Beauchemin, M. Accelerated thawing of subarctic peatland permafrost over the last 50 years. Geophys. Res. Lett. 2004, 31, L18208. [Google Scholar] [CrossRef]
  29. Jorgenson, M.T.; Shur, Y.L.; Pullman, E.R. Abrupt increase in permafrost degradation in Arctic Alaska. Geophys. Res. Lett. 2006, 33, L02503. [Google Scholar] [CrossRef]
  30. Ding, W.X.; Cai, Z.C.; Tsuruta, H.; Li, X.P. Effect of standing water depth on methane emissions from freshwater marshes in northeast China. Atmos. Environ. 2002, 36, 5149–5157. [Google Scholar] [CrossRef]
  31. Zhu, R.B.; Liu, Y.S.; Ma, J.; Xu, H.; Sun, L. Nitrous oxide flux to the atmosphere from two coastal tundra wetlands in eastern Antarctica. Atmos. Environ. 2008, 42, 2437–2447. [Google Scholar] [CrossRef]
  32. Pärn, J.; Verhoeven, J.T.A.; Butterbach-Bahl, K.; Dise, N.B.; Ullah, S.; Aasa, A.; Egorov, S.; Espenberg, M.; Järveoja, J.; Jauhiainen, J.; et al. Nitrogen-rich organic soils under warm well-drained conditions are global nitrous oxide emission hotspots. Nat. Commun. 2018, 9, 1135. [Google Scholar] [CrossRef] [PubMed] [Green Version]
  33. Viru, B.; Veber, G.; Jaagus, J.; Kull, A.; Maddison, M.; Muhel, M.; Espenberg, M.; Teemusk, A.; Mander, Ü. Wintertime Greenhouse Gas Fluxes in Hemiboreal Drained Peatlands. Atmosphere 2020, 11, 731. [Google Scholar] [CrossRef]
  34. Camill, P.; Chihara, L.; Adams, B.; Andreassi, C.; Barry, A.; Kalim, S.; Limmer, J.; Mandell, M.; Rafert, G. Early life history transitions and recruitment of Picea mariana in thawed boreal permafrost peatlands. Ecology 2010, 91, 448–459. [Google Scholar] [CrossRef]
  35. Helbig, M.; Pappas, C.; Sonnentag, O. Permafrost thaw and wildfire: Equally important drivers of boreal tree cover changes in the Taiga Plains, Canada. Geophys. Res. Lett. 2016, 43, 1598–1606. [Google Scholar] [CrossRef]
  36. Jørgenson, C.J.; Struwe, S.; Elberling, B. Temporal trends in N2O flux dynamics in a Danish wetland -effects of plant mediated gas transport of N2O and O2 following changes in water level and soil mineral-N availability. Glob. Chang. Biol. 2012, 18, 210–222. [Google Scholar] [CrossRef]
  37. Hu, Q.W.; Cai, J.Y.; Yao, B.; Wu, Q.; Wang, Y.Q.; Xu, X.L. Plant-mediated methane and nitrous oxide fluxes from a carex meadow in Poyang Lake during drawdown periods. Plant Soil 2016, 400, 367–380. [Google Scholar] [CrossRef]
  38. Taylor, M.A.; Celis, G.; Ledman, J.D.; Bracho, R.; Schuur, E.A.G. Methane efflux measured by eddy covariance in Alaskan upland tundra undergoing permafrost degradation. J. Geophys. Res. Biogeosci. 2018, 123, 2695–2710. [Google Scholar] [CrossRef]
  39. Zhou, Y.W.; Guo, D.X. Principal characteristics of permafrost in China. J. Glaciol. Cryopedol. 1982, 4, 1–19, (In Chinese with English Abstract). [Google Scholar]
  40. Liu, X.T. Wetlands in Northeast China; Science Press: Beijing, China, 2005. (In Chinese) [Google Scholar]
  41. Jin, H.; Yu, Q.; Lü, L.; Guo, D.; He, R.; Yu, S.; Sun, G.; Li, Y. Degradation of permafrost in the Xing’anling Mountains, northeastern China. Permafr. Periglac. Process 2007, 18, 245–258. [Google Scholar] [CrossRef]
  42. Miao, Y.; Song, C.; Sun, L.; Wang, X.; Meng, H.; Mao, R. Growing season methane emission from a boreal peatland in the continuous permafrost zone of Northeast China: Effects of active layer depth and vegetation. Biogeosciences 2012, 9, 4455–4464. [Google Scholar] [CrossRef] [Green Version]
  43. Miao, Y.Q.; Song, C.C.; Wang, X.W.; Meng, H.N.; Sun, L.; Wang, J.Y. Annual carbon gas emissions from a boreal peatland in continuous permafrost zone, northeast China. CLEAN Soil Air Water 2016, 44, 456–463. [Google Scholar] [CrossRef]
  44. Cui, Q.; Song, C.C.; Wang, X.W.; Shi, F.X.; Yu, X.Y.; Tan, W.W. Effects of warming on N2O fluxes in a boreal peatland of Permafrost region, Northeast China. Sci. Total Environ. 2018, 616, 427–434. [Google Scholar] [CrossRef]
  45. Liu, X.; Guo, Y.D.; Hu, H.Q.; Sun, C.K.; Zhao, X.K.; Wei, C.L. Dynamics and controls of CO2 and CH4 emissions in the wetland of a montane permafrost region, northeast China. Atmos. Environ. 2015, 122, 454–462. [Google Scholar] [CrossRef]
  46. Sun, X.X.; Mu, C.C.; Song, C.C. Seasonal and spatial variations of methane emissions from montane wetlands in Northeast China. Atmos. Environ. 2011, 45, 1809–1816. [Google Scholar] [CrossRef]
  47. Yu, B.; Stott, P.; Yu, H.X.; Li, X.Y. Methane emissions and production potentials of forest swamp wetlands in the Eastern Great Xing’an Mountains, Northeast China. Environ. Manage. 2013, 52, 1149–1160. [Google Scholar] [CrossRef]
  48. Lin, Q.H.; Leng, X.T.; Hong, B. Peat δ13C record of climate change in XiaoXingan Ling in the past 5000 years. Earth Environ. 2004, 32, 50–54, (In Chinese with English Abstract). [Google Scholar]
  49. Song, C.C.; Xu, X.F.; Tian, H.Q.; Wang, Y.Y. Ecosystem–atmosphere exchange of CH4 and N2O and ecosystem respiration in wetlands in the Sanjiang Plain, Northeastern China. Glob. Chang. Biol. 2009, 15, 692–705. [Google Scholar] [CrossRef]
  50. Ström, L.; Christensen, T.R. Below ground carbon turnover and greenhouse gas exchanges in a sub-arctic wetland. Soil Biol. Biochem. 2007, 39, 1689–1698. [Google Scholar] [CrossRef]
  51. Wickland, K.P.; Striegl, R.G.; Neff, J.C.; Sachs, T. Effects of permafrost melting on CO2 and CH4 exchange of a poorly drained black spruce lowland. J. Geophys. Res. 2006, 111, G02001. [Google Scholar]
  52. Liblik, L.; Moore, T.R.; Bubier, J.L.; Robinson, S.D. Methane emissions from wetlands in the zone of discontinuous permafrost: Fort Simpson, NWT, Canada. Glob. Biogeochem. Cycles 1997, 11, 485–494. [Google Scholar] [CrossRef] [Green Version]
  53. Bubier, J.L.; Moore, T.R.; Bellisario, L.M.; Comer, N.T.; Crill, P.M. Ecological controls on methane emission from a northern peatland complex in the zone of discontinuous permafrost, Manitoba, Canada. Glob. Biogeochem. Cycles 1995, 9, 455–470. [Google Scholar] [CrossRef]
  54. Dinsmore, K.J.; Skiba, U.M.; Billett, M.F.; Rees, R.M.; Drewer, J. Spatial and temporal variability in CH4 and N2O fluxes from a Scottish ombrotrophic peatland. Soil Biol. Biochem. 2009, 41, 1315–1323. [Google Scholar] [CrossRef] [Green Version]
  55. Ström, L.; Falk, J.M.; Skov, K.; Jackowicz-Korczynski, M.; Mastepanov, M.; Christensen, T.R.; Lund, M.; Schmidt, N.M. Controls of spatial and temporal variability in CH4 flux in a high arctic fen over three years. Biogeochemistry 2015, 125, 21–35. [Google Scholar] [CrossRef]
  56. Nakano, T.; Kuniyoshi, S.; Fukuda, M. Temporal variation in methane emission from tundra wetlands in a permafrost area, northeastern Siberia. Atmos. Environ. 2000, 34, 1205–1213. [Google Scholar] [CrossRef]
  57. Turetsky, M.R.; Wieder, R.K.; Vitt, D.H. Boreal peatland C fluxes under varying permafrost regimes. Soil. Biol. Biochem. 2002, 34, 907–912. [Google Scholar] [CrossRef]
  58. Mackelprang, R.; Waldrop, M.P.; DeAngelis, K.M.; David, M.M.; Chavarria, K.L.; Blazewicz, S.J.; Rubin, E.M.; Jansson, J.K. Metagenomic analysis of a permafrost microbial community reveals a rapid response to thaw. Nature 2011, 480, 368–371. [Google Scholar] [CrossRef] [Green Version]
  59. Hultman, J.; Waldrop, M.P.; Mackelprang, R.; David, M.M.; McFarland, J.; Blazewicz, S.J.; Harden, J.; Turetsky, M.R.; McGuire, A.D.; Shah, M.B.; et al. Multi-omics of permafrost, active layer and thermokarst bog soil microbiomes. Nature 2015, 521, 208–212. [Google Scholar] [CrossRef]
  60. Ström, L.; Ekberg, A.; Mastepanov, M.; Christensen, T.R. The effect of vascular plants on carbon turnover and methane emissions from a tundra wetland. Glob. Chang. Biol. 2003, 9, 1185–1192. [Google Scholar] [CrossRef] [Green Version]
  61. Koelbener, A.; Ström, L.; Edwards, P.J.; Venterink, H.O. Plant species from mesotrophic wetlands cause relatively high methane emissions from peat soil. Plant Soil 2010, 326, 147–158. [Google Scholar] [CrossRef]
  62. Sun, X.X.; Song, C.C.; Guo, Y.D.; Wang, X.W.; Yang, G.S.; Li, Y.C.; Mao, R.; Lu, Y.Z. Effect of plants on methane emissions from a temperate marsh in different seasons. Atmos. Environ. 2012, 60, 277–282. [Google Scholar] [CrossRef]
  63. Huttunen, J.T.; Nykänen, H.; Turunen, J.; Martikainen, P.J. Methane emissions from natural peatlands in the northern boreal zone in Finland, Fennoscandia. Atmos. Environ. 2003, 37, 147–151. [Google Scholar] [CrossRef]
  64. Treat, C.C.; Bubier, J.L.; Varner, R.K.; Crill, P.M. Timescale dependence of environmental and plant-mediated controls on CH4 flux in a temperate fen. J. Geophys. Res. 2007, 112, G01014. [Google Scholar]
  65. Moore, T.R.; Young, A.D.; Bubier, J.L.; Humphreys, E.R.; Lafleur, P.M.; Roulet, N.T. A multi-year record of methane flux at the Mer Bleue bog, southern Canada. Ecosystems 2011, 14, 646–657. [Google Scholar] [CrossRef]
  66. Shigubara, R.; Sugimoto, A.; Murase, J.; Iwahana, G.; Tei, S.; Liang, M.; Takano, S.; Morozumi, T.; Maximov, T.C. Multi-year effect of wetting on CH4 flux at taiga–tundra boundary in northeastern Siberia deduced from stable isotope ratios of CH4. Biogeosciences 2019, 16, 755–768. [Google Scholar] [CrossRef] [Green Version]
  67. Yang, J.S.; Liu, J.S.; Wang, J.D.; Yu, J.B.; Sun, Z.G.; Li, X.H. Emissions of CH4 and N2O from a wetland in Sangjiang Plain. J. Plant. Ecol. 2006, 30, 432–440, (In Chinese with English Abstract). [Google Scholar]
  68. Morishita, T.; Matsuura, Y.; Kajimoto, T.; Osawa, A.; Zyryanova, O.A.; Prokushkin, A.S. CH4 and N2O dynamics of a Larix gmelinii forest in a continuous permafrost region of central Siberia during the growing season. Polar Res. 2014, 8, 156–165. [Google Scholar] [CrossRef] [Green Version]
  69. Yu, J.B.; Liu, J.S.; Wang, J.D.; Sun, W.D.; Patrick, W.H., Jr.; Meixner, F.X. Nitrous oxide emission from Deyeuxia angustifolia freshwater marsh in Northeast China. Environ. Manage. 2007, 40, 613–622. [Google Scholar] [CrossRef]
  70. Chen, Q.Q.; Zhu, R.B.; Wang, Q.; Xu, H. Methane and nitrous oxide fluxes from four tundra ecotopes in Ny-Ålesund of the High. J. Environ. Sci. 2014, 26, 1403–1410. [Google Scholar] [CrossRef]
  71. Lohila, A.; Aurela, M.; Hatakka, J.; Pihlatie, M.; Minkkinen, K.; Penttilä, T.; Laurila, T. Responses of N2O fluxes to temperature, water table and N deposition in a northern boreal fen. Eur. J. Soil Sci. 2010, 61, 651–661. [Google Scholar] [CrossRef]
  72. Wang, J.Y.; Song, C.C.; Zhang, J.; Wang, L.L.; Zhu, X.Y.; Shi, F.X. Temperature sensitivity of soil carbon mineralization and nitrous oxide emission in different ecosystems along a mountain wetland-forest ecotone in the continuous permafrost of Northeast China. Catena 2014, 121, 110–118. [Google Scholar] [CrossRef]
  73. Rodionow, A.; Flessa, H.; Kazansky, O.; Guggenberger, G. Organic matter composition and potential trace gas production of permafrost soils in the forest tundra in northern Siberia. Geoderma 2006, 135, 49–62. [Google Scholar] [CrossRef]
  74. Waldrop, M.P.; Mcfarland, J.; Euskirchen, E.S.; Turetsky, M.R.; Harden, J.W.; Manies, K.; Jones, M.; McGuire, A.D. Carbon balance and greenhouse gas fluxes in a thermokarst bog in interior Alaska: Positive and negative feedbacks from permafrost thaw. In AGU Fall Meeting Abstracts; AGU: Washington, DC, USA, 2012; p. B14D-03. [Google Scholar]
  75. Yang, G.; Peng, Y.; Marushchak, M.E.; Chen, Y.; Wang, G.; Li, F.; Zhang, D.; Wang, J.; Yu, J.; Liu, L.; et al. Magnitude and pathways of increased nitrous oxide emissions from uplands following permafrost thaw. Environ. Sci. Technol. 2018, 52, 9162–9169. [Google Scholar] [CrossRef] [PubMed]
Figure 1. Monthly air temperature (A) and precipitation (B) from May to October 2011–2014.
Atmosphere 12 00222 g001
Figure 2. Seasonal variation of soil thaw depth (A), water table level (B) and soil temperature (C) in different sampling sites.
Atmosphere 12 00222 g002
Figure 3. Differences in soil thaw depth (A), water table level (B), soil temperature (C) and herb biomass (D) among sampling years and sites. Data are means ± SE. For water table level and soil temperature, n = 18 in 2011, n = 16 in 2012, and n = 17 in 2013 and 2014. For soil thaw depth, n = 10 in each year. For herb biomass, n = 3 in each year. Different lowercase letters indicate the significant differences among sites in the same year or the mean of the four years. Different capital letters indicate the significant differences in the same site between different years.
Atmosphere 12 00222 g003
Figure 4. Seasonal variation of CH4 fluxes in no-thawing (A), mild-thawing (B) and severe-thawing (C) sites. Data are means ± SE. n = 3 for the no-thawing site, n = 4 for the mild-thawing and severe-thawing sites.
Atmosphere 12 00222 g004
Figure 5. Mean CH4 fluxes in different years and sampling sites. Data are means ± SE. n = 18 in 2011, n = 16 in 2012, n = 17 in 2013 and 2014. Different lowercase letters indicate the significant differences among sites in the same year or the mean of the four years. Different capital letters indicate the significant differences in the same site between different years.
Atmosphere 12 00222 g005
Figure 6. Relationship between seasonal mean CH4 flux and annual maximum soil thawing depth in no-thawing (A), mild-thawing (B) and severe-thawing (C) sites.
Atmosphere 12 00222 g006
Figure 7. Seasonal variation of N2O fluxes in no-thawing (A), mild-thawing (B) and severe-thawing (C) sites. Data are means ± SE. n = 3 for the no-thawing site, n = 4 for the mild-thawing and severe-thawing sites.
Atmosphere 12 00222 g007
Figure 8. Mean N2O fluxes in different years and sampling sites. Data are means ± SE. n = 18 in 2011, n = 16 in 2012, n = 17 in 2013 and 2014. Different lowercase letters indicate the significant differences among sites in the same year or the mean of the four years. Different capital letters indicate the significant differences in the same site between different years.
Atmosphere 12 00222 g008
Table 1. Soil chemical characteristics in the sampling sites.
Soil Characteristics No-Thawing SiteMild-Thawing SiteSevere-Thawing Site
0–20 cm20–40 cm0–20 cm20–40 cm0–20 cm20–40 cm
pH4.75 ± 0.054.89 ± 0.024.72 ± 0.025.00 ± 0.064.74 ± 0.134.79 ± 0.15
SOC/gkg−1238.91 ± 3.57290.96 ± 64.76213.15 ± 15.62192.92 ± 12.85182.61 ± 3.89168.49 ± 4.04
TN/gkg−113.33 ± 0.4113.28 ± 0.4213.37 ± 0.0413.66 ± 0.3412.48 ± 1.4012.18 ± 0.26
C/N17.9221.9115.9414.1214.6313.83
Data are mean ± SE (n = 3).
Table 2. Correlations between CH4 flux and environmental factors.
SiteEquationVariabledfR2p
No-thawing siteFs = −0.173 + 0.048TSoil temperature670.074<0.05
Fs = 0.237 + 0.007TDThaw depth670.083<0.05
Severe thawing siteFs = 0.82 × 100.159TSoil temperature670.407<0.01
Fs = −3.172 + 0.26TD − 0.001TD2Thaw depth670.142<0.01
Fs indicates single CH4 flux. Soil temperatures were measured at 10 cm depth.
Table 3. Correlations between N2O flux and environmental factors.
SiteEquationVariabledfR2p
No-thawing siteFs = 10.087 − 1.227xWater table670.058<0.05
Severe thawing siteFs = −4.682 + 3.430xSoil temperature670.098<0.05
Fs indicates single N2O flux. Soil temperatures were measured at 10 cm depth.
Publisher’s Note: MDPI stays neutral with regard to jurisdictional claims in published maps and institutional affiliations.

