Article

Impact of Residual Water Vapor on the Simultaneous Measurements of Trace CH4 and N2O in Air with Cavity Ring-Down Spectroscopy

1
School of Optoelectronic Science and Engineering, University of Electronic Science and Technology of China, Chengdu 610054, China
2
Institute of Optics and Electronics, Chinese Academy of Sciences, Chengdu 610209, China
3
University of Chinese Academy of Sciences, Beijing 100049, China
*
Author to whom correspondence should be addressed.
Atmosphere 2021, 12(2), 221; https://doi.org/10.3390/atmos12020221
Submission received: 21 January 2021 / Revised: 31 January 2021 / Accepted: 3 February 2021 / Published: 6 February 2021
(This article belongs to the Section Aerosols)

Abstract

:
Methane (CH4) and nitrous oxide (N2O) are among the most important atmospheric greenhouse gases. A gas sensor based on a tunable 7.6 μm continuous-wave external-cavity mode-hop-free (EC-MHF) quantum cascade laser (from 1290 to 1350 cm−1) cavity ring-down spectroscopy (CRDS) technique was developed for the simultaneous detection of CH4 and N2O in ambient air with water vapor (H2O) mostly removed via molecular sieve drying to minimize the impact of H2O on the simultaneous measurements. Still, due to the broad and strong absorption spectrum of H2O in the entire mid-infrared (mid-IR) spectral range, residual H2O in the dried ambient air due to incomplete drying and leakage, if not properly accounted for, could cause a significant influence on the measurement accuracy of the simultaneous CH4 and N2O detection. In this paper, the impact of residual H2O on the simultaneous CH4 and N2O measurements were analyzed by comparing the CH4 and N2O concentrations determined from the measured spectrum in the spectral range from 1311 to 1312.1 cm−1 via simultaneous CH4 and N2O measurements and that determined from the measured spectrum in the spectral range from 1311 to 1313 cm−1 via simultaneous CH4, N2O, and H2O measurements. The measured dependence of CH4 and N2O concentration errors on the simultaneously determined H2O concentration indicated that the residual H2O caused an under-estimation of CH4 concentration and over-estimation of N2O concentration. The H2O induced CH4 and N2O concentration errors were approximately linearly proportional to the residual H2O concentration. For the measurement of air flowing at 3 L per min, the residual H2O concentration was stabilized to approximately 14 ppmv, and the corresponding H2O induced errors were −1.3 ppbv for CH4 and 3.7 ppbv for N2O, respectively.

1. Introduction

Global warming is considered to be the cause of climate change, and it has brought great consequences to human society [1]. Methane (CH4) and nitrous oxide (N2O) are two of the most important atmospheric greenhouse gases, contributing significantly to global warming as well as climate change. Their global warming potential (GWP) for a time horizon of 100 years are 25 [2] and 298 [3] times greater than CO2. Due to their excellent stability and long atmospheric life periods, even small changes in N2O and CH4 concentrations in air will have a long-term effect on the atmosphere [4]. Therefore, highly sensitive and precise measurements of CH4 and N2O concentrations and their temporal variations in the atmosphere with ppbv (parts per billion by volume) accuracy are essential for environmental monitoring and greenhouse gas controlling [5,6]. Up to now, plenty of techniques have been developed to detect trace gases, such as non-dispersive gas sensing including non-dispersive infra-red (NDIR) absorption spectroscopy, tunable diode laser absorption spectroscopy (TDLAS), cavity ring down spectroscopy (CRDS), and photoacoustic spectroscopy (PAS) [7,8]. Mahbub et al. have recently designed rapidly pulsed near-infrared light emitting diodes (NIR LED) based nondispersive infrared (NDIR) spectroscopy at 1.65 μm for continuous remote sensing of atmospheric methane (CH4), and the limits of detection (LOD) of CH4 is 300 ppm [9]. Shao et al. have used a single DFB diode laser emitting at 2.33 μm combined with the TDLAS technique for continuously detecting atmospheric CO and CH4 at a level of 0.73 and 36 ppbv, respectively [10]. Among these various techniques, CRDS is a direct absorption technique with a significantly improved sensitivity than the conventional direct absorption spectroscopy due to its long effective absorption path length and insensitivity to intensity fluctuations of the light source [11,12,13], which has been widely used to detect trace gases in real time with ultrahigh sensitivity and relatively low system complexity in recent years [14]. With the rapid development of mid-infrared (mid-IR) quantum cascade lasers (QCL) and QCLs utilized in CRDS to employ the strongest absorption lines for trace gas detection, the sensitivity of CRDS was further improved [15,16,17] and has achieved the required sensitivities for real-time monitoring of trace species from ppmv (parts per million by volume) down to the pptv (parts per trillion by volume) levels. For example, Banik et al. utilized a 5.2 μm EC-QCL CRDS for the sensitive measurements of N2O at a level of 4.5 ppbv [18]. Maity et al. applied CRDS with an EC-QCL operating between 7.5 and 8 µm for detecting CH4 at a minimum detection limit of 52 ppbv [19]. Tang et al. developed a CRDS setup for the simultaneous CH4 and N2O detection of ambient air in the spectral range between 1290 and 1350 cm−1 with the ppt-level sensitivity and ppb-level accuracy by drying the water vapor (H2O) inside the sample cell down to sub-ppm level so the influence of H2O on the simultaneous CH4 and N2O measurements becomes negligible [20].
However, the presence of gases other than the target species during the measurement will seriously affect the measurement accuracy [21,22,23,24,25]. Water vapor, one of the most important interference gases in the atmosphere, has a wide absorption spectrum from microwave to far-IR, and especially in the mid-IR spectral region. The spectrum of H2O cited from the HITRAN database [26] is shown in Figure 1a. Additionally, the concentration of H2O in the atmosphere varies in a large dynamic range from nearly 0 up to 4% over temporal and spatial scales [27] and mixing ratios of CH4 and N2O are significantly affected by variations of water vapor. Moreover, without drying almost no CRD signals can be experimentally detected by the CRDS experimental setup used in this paper due to the high H2O concentration (in 1% level) in the ambient air and the limitation of the maximum detectable absorption coefficient (~3 × 10⁻⁵ cm−1, corresponding ring-down time is about 1.5 μs) of the setup. According to the HITRAN database, the spectral absorptions for a typical ambient concentration of CH4 (2 ppmv) and N2O (0.3 ppmv) with an H2O concentration of 10 ppmv and 1.4%, respectively are given in Figure 1b. Generally, H2O in the ambient air can be largely removed by passing the air over molecular sieves [28,29,30] and the concentration of H2O can be effectively decreased to even less than 1 ppmv [20]. In this case, its impact on the CH4 and N2O detection becomes negligible. However, it is possible that if over-drying, the molecular sieve might also adsorb target gases and in turn affects the retrieval of the target quantity due to its non-uniformly distributed pore sizes. A more practical way may be reducing the amount of molecular sieve to minimize its influence on the target gas detection. In this case, the residual H2O in the levels from several ppmv up to 100 ppmv exists in the dried air due to incomplete drying. In addition, a possible leakage in the gas-handling system may also cause the increase of H2O concentration inside the sample cell.
In this paper, a CW-CRDS experimental setup with a mode-hop-free (MHF) EC-QCL operating between 1290 to 1350 cm−1 is applied to simultaneously detect CH4 and N2O in clean laboratory air. In this experimental setup, the H2O is dried to a concentration from several ppmv to 200 ppmv by passing the measured air through molecular sieve filling tubes. A method is developed to determine simultaneously the concentrations of CH4, N2O, and residual H2O by measuring the absorption spectrum in a spectral range covering the absorption lines of CH4, N2O, and H2O. The impact of residual H2O on the simultaneous CH4 and N2O measurements is analyzed by comparing the results that with and without determining simultaneously the concentration of residual H2O is increased with time due to the slow leakage of the laboratory air into the closed ring-down cavity (sample cell) of the CRDS setup. Then, the same method is applied to analyze the impact of residual H2O on the simultaneous CH4 and N2O measurements in flowing air.

2. Experiments

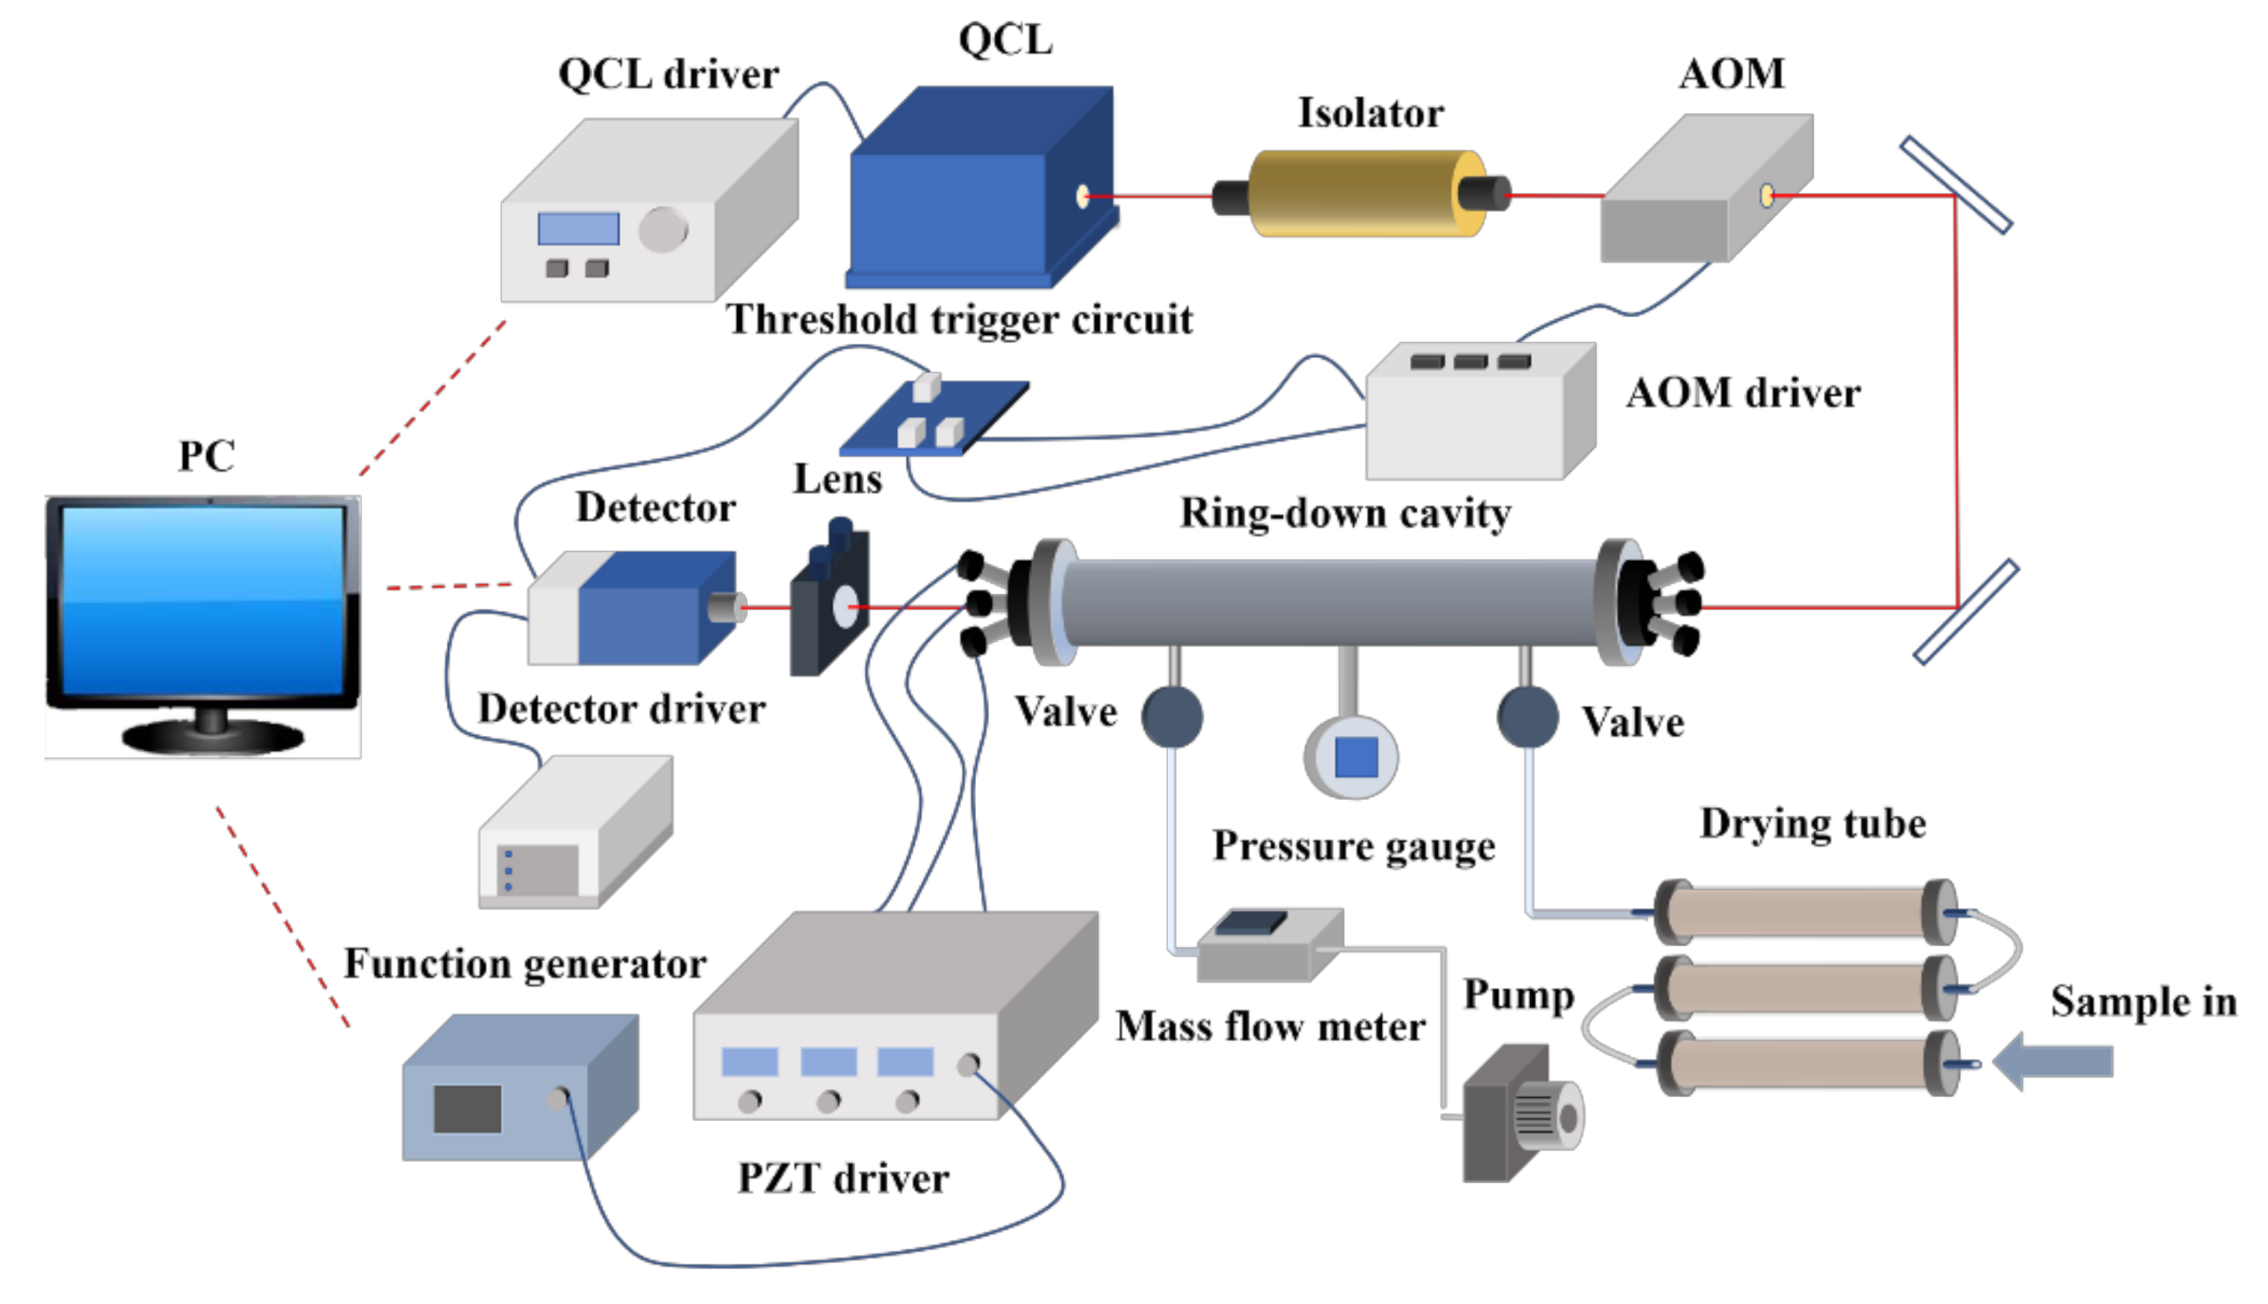
The apparatus used for the CRDS experiment is similar to that described in [20] and is schematically depicted in Figure 2. In brief, a tunable mid-IR external-cavity CW-MHF QCL (41074-MHF, Daylight Solutions, San Diego, California, USA) with an MHF tuning range of 1290–1350 cm−1 and power nearly 160 mW is utilized as the light source. The QCL emits a collimated laser beam with a narrow spectral linewidth (<30 MHz or 0.001 cm−1) which meets the requirements for high-precision spectral measurements. Moreover, the QCL is tuned via the laser controller with a step of 0.01 cm−1 (with accuracy < 0.003 cm−1). In order to avoid back reflections of light from other optical components affecting the laser output, an optical isolator with central wavelength 7.2 µm and isolation ratio >30 dB (FIO-5-7.2, Innpho, Verona, NJ, USA) is placed in front of the laser. Then, the light passes through an acousto-optic modulator (AOM) (I-M041, Gooch and Housego, Ilminster, UK) acting as a fast-optical switch that produces the zeroth and first-order diffraction beams. The AOM is controlled by a high-speed (with response time < 50 ns) threshold trigger circuit. The first-order diffraction beam is coupled into the stable high-finesse ring-down cavity which consists of a 50 cm long quartz-coated sample cell and two high-reflectivity plane-concave mirrors (CRD Optics) with reflectivity R > 99.98% and 1 m radius of curvature attached to two ends of the ring-down cell. Three piezoelectric transducers (PZT, Model PE-4, Thorlabs, Newton, NJ, USA) mounted on the rear cavity mirror is applied to achieve the periodic laser-cavity coupling. A triangular signal (Vpp = 5 V, frequency = 40 Hz) is applied to the PZTs to modulate the cavity length over one half of the wavelength. A periodic resonant signal (TEM00 mode) is built-up periodically inside the cavity due to mode-matching between the laser and cavity. The QCL beam leaking from the cavity is focused by a focusing lens and subsequently detected by a TE-cooled HgCdTe infrared photovoltaic detector (PVMI-4TE-8, Vigo, Poland). When the measured light intensity reaches a preset voltage value, the threshold trigger circuit sends a trigger signal to the AOM to switch-off the first-order beam. The ring-down signal is then recorded by a data acquisition (DAQ) card (M2i.3010, Spectrum Instrumentation, Großhansdorf, Germany) and analyzed by a MATLAB program. A vacuum pump (MPC 301Z, Welch, Concord, MA, USA), a pressure gauge (LEX1, Keller, Winterthur, Switzerland), and a mass flow meter (EL-FLOW Select, Bronkhorst, The Netherlands) are used to control the pressure and gas flows inside the sample cell. Three plexiglass drying tubes filled with 3A molecular sieves (Rhawn, Shanghai, China) which can absorb molecules with a dynamic diameter less than 0.3 nm are connected to the gas inlet of the sample cell to remove the water vapor from the measured gas mixture flowing into the sample cell. It is experimentally found that only when the concentration of water vapor in the measured air is below a certain level, the CRDS signal becomes observable and measurable. Differed from that in [20], no 3A molecular sieves are put inside the sample cell for further drying in order to minimize the possible adsorptions of CH4 and N2O by the desiccants. In this case, the H2O concentration inside the closed sample cell increases with time as the outside H2O leak into the sample cell due to the imperfect seal of the sample cell and the large H2O concentration difference inside and outside the sample cell. It is worth mentioning that the H2O leakage may also cause small variations of the CH4 and N2O concentrations inside the sample cell as CH4 and N2O concentrations in the laboratory room fluctuate with time during the measurement period.
Experimentally by determining the ring-down time τ from the measured ring-down signal, the wavelength-dependent absorption coefficient α λ of the target gas can be obtained by
α ( λ ) = 1 c ( 1 τ - 1 τ 0 )
where c is the speed of light, λ is the wavelength, and τ 0 is the ring-down time in the empty sample cell (in our case, the “empty” sample cell is filled with high-purity nitrogen which has negligible absorption in the measurement spectral range). The absolute concentration of the target gas can be determined by comparing the measured absorption spectrum to the HITRAN database. For the simultaneous determination of multiple gases, the measured absorption spectrum can be expressed as
α ( λ ) = i = 1 N c i × α i ( λ ) + b a c k g r o u n d
where ci is the concentration of gas i (i = 1, 2, …, N) in the gas mixture, and αi(λ) is the corresponding absorption spectrum, which can be obtained from the HITRAN database. Once the number N is determined, the concentrations of the multiple target gases can be determined by multi-parameter fitting the measured absorption spectrum to Equation (2). The absorption of interference gases can be treated as the background term which is set as a free parameter in the multi-parameter fitting. From Equation (2), to minimize the influence of background absorption on the simultaneous determination of multiple target gases, the level of background absorption should be as low as possible compared to the absorption caused by the target gases. In this case, the selection of wavelength range for the absorption spectrum measurement of multiple target gases is essential.
The gas mixture used in the experiment is the ambient air collected from the laboratory room with H2O partially removed by molecular sieves. The relative moisture level in the laboratory room fluctuates between 50% and 60%, which represents a H2O concentration range of 1.4–1.7%. The ambient air enters the sample cell (the ring-down cavity) through a vacuum valve (MPC 301Z, Welch). All the experimental data are recorded in the clean-room laboratory with approximately 296 K temperature and 950 mbar pressure (or 1 atmospheric pressure), respectively. For the simultaneous determination of CH4 and N2O, N is set to 2 in Equation (2), and the impact of H2O is included in the background term. The concentration of H2O can also be simultaneously determined by setting N = 3 in Equation (2) and H2O being treated as an additional target gas when performing the multi-parameter fitting.

3. Results and Discussion

3.1. Spectral Range Selection

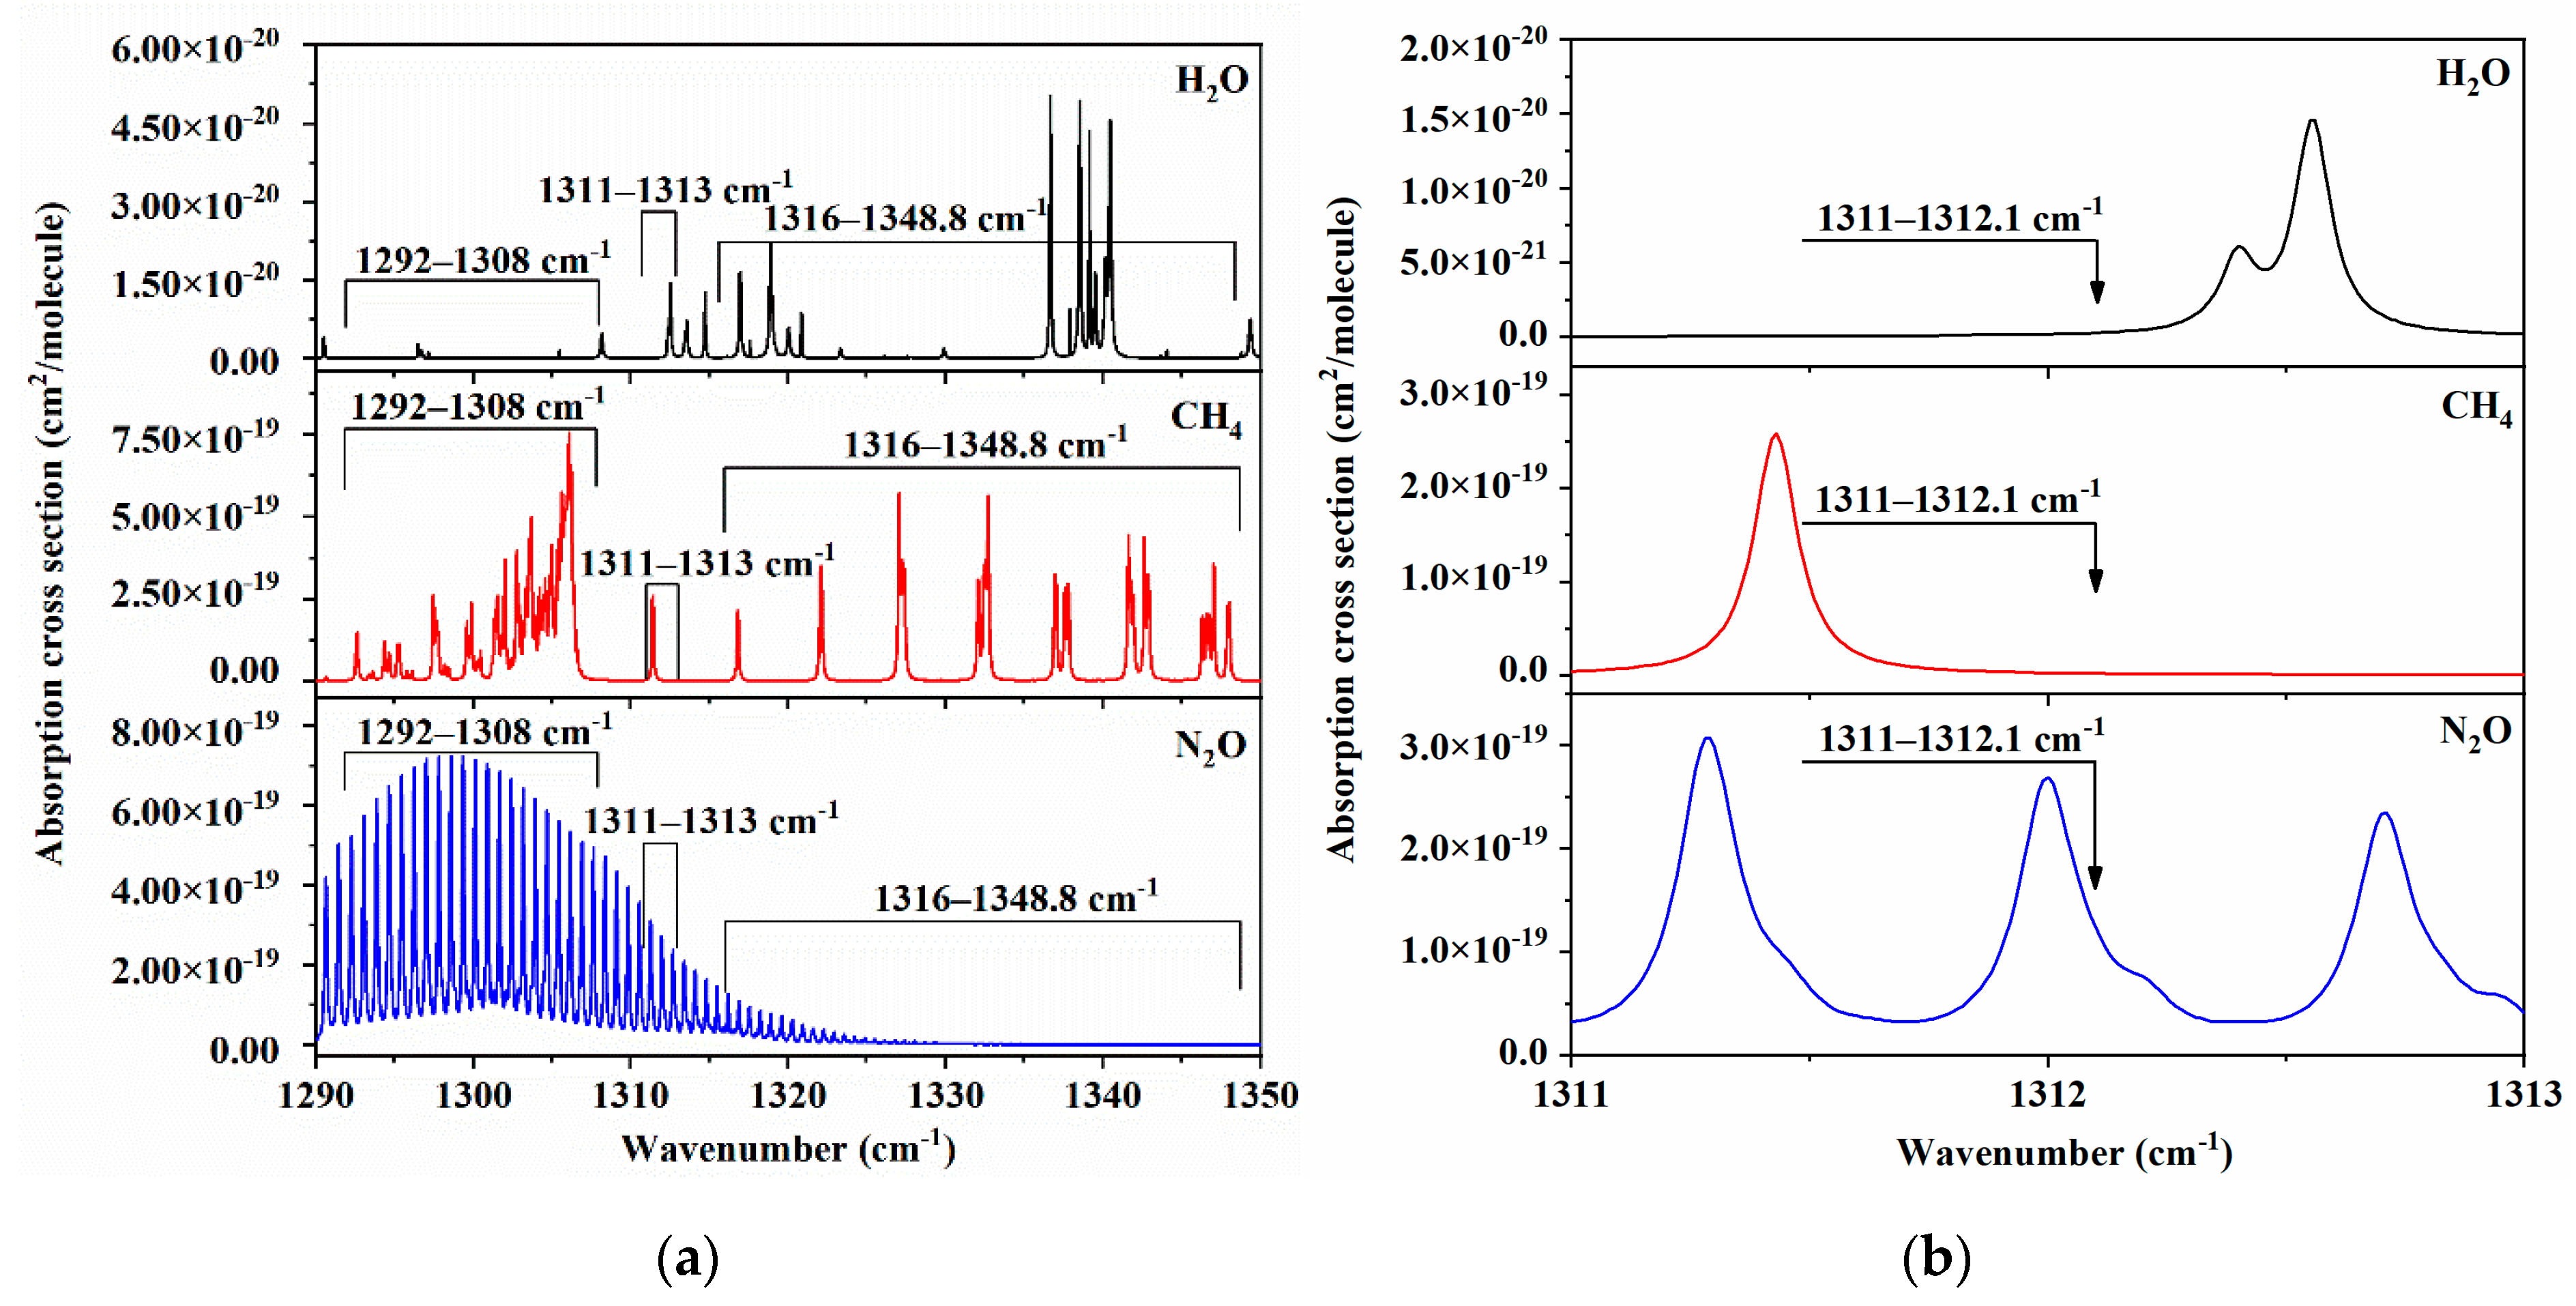
To achieve simultaneous measurements of CH4, N2O, as well as H2O, it is important to carefully select the measured spectral range. There are three factors that should be considered for wavelength selection: (1) Absorption lines of CH4, N2O, and H2O should all appear in the selected spectral range; (2) the intensity of absorption lines must be moderate for measurements of either strong absorptions of species present in trace amounts or measurements of weak absorptions of abundant species; (3) the absorption lines should be relatively isolated from each other and also from other CH4, N2O, and H2O lines to minimize the influence of neighboring lines and line-mixing effects. Figure 3a shows the absorption lines of CH4, N2O, and H2O in the MHF tuning range (1290–1350 cm−1) of the QCL used in the experiment. From Figure 3a, the absorption lines in the spectral range from 1292 to 1308 cm−1 are too abundant to be separated for both CH4 and N2O measurements. On the other hand, the intensities of N2O absorption lines are too low in the spectral range from 1316 to 1348.8 cm−1, which are less than 1.278 × 10⁻¹⁹ cm2/molecule. As a result, the spectral range from 1311 to 1313 cm−1 is an excellent choice for the simultaneous measurements of CH4, N2O, and H2O. The spectral lines of CH4, N2O, and H2O from 1311 to 1313 cm−1 are shown in Figure 3b. In this spectral range, the absorption cross sections of CH4, N2O, and H2O are up to 2.587 × 10⁻¹⁹, 3.079 × 10⁻¹⁹, and 1.459 × 10⁻²⁰ cm2/molecule, respectively. For the simultaneous determination of CH4 and N2O, only the spectrum measured from 1311 to 1312.1 cm−1 is used, in order to minimize the impact of H2O on the CH4 and N2O measurements. On the other hand, the whole measured spectrum from 1311 to 1313 cm−1 is employed when the concentration of H2O is also simultaneously determined together with CH4 and N2O. By comparing the results obtained without and with the simultaneous determination of H2O, the impact of H2O on the simultaneous CH4 and N2O measurements can be analyzed.

3.2. Impact of Residual Water Vapor on CH4 and N2O Measurements

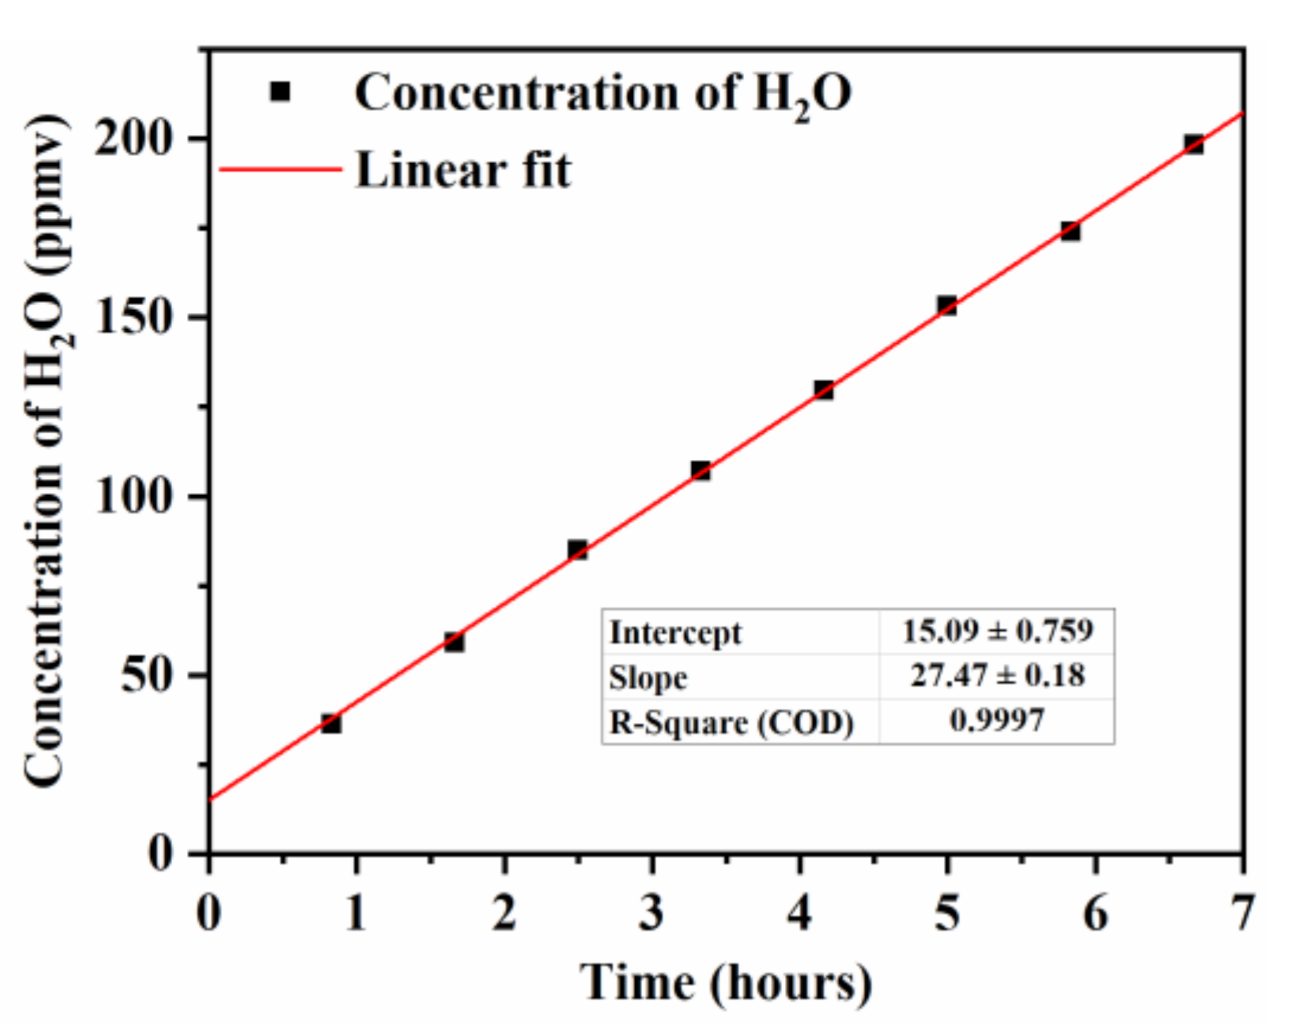
Firstly, the gas inlet and outlet valves connecting to the sample cell are open and laboratory air is fed into the sample cell by the vacuum pump at a flow rate of 3 L per min for 5 min. The H2O in the sample cell is partially dried due to the molecular sieves inside the plexiglass drying tubes. Then, the gas inlet and outlet valves are adjusted to make the air pressure in the sample cell approximately equal to the outside air pressure (about 950 mbar), and then the valves are closed to form a closed sample cell filling with ambient air with H2O partially removed. The experiment is performed to continuously measure the laboratory air for about 7 h from 13:30 to 20:30 on 30 July 2019. The QCL is tuned from 1311 to 1313 cm−1 in 20 min and the measurement is repeated every 50 min (repeated 8 times in 7 h). The concentrations of CH4, N2O, and H2O are then determined via fitting the measured spectra to Equation (2) with N = 3. The measured H2O concentration is presented in Figure 4. An approximately linear relationship between the H2O concentration and the measurement time is observed. This linear increase of H2O concentration inside the sample cell with time is due to leakage of the sample cell and the gas system. From the linear dependence, the leak rate of H2O can be determined to be approximately 27 ppmv/h. On the other hand, the intercept of 15 ppmv indicates the drying capacity of the molecular sieves at the flow rate of 3 L per min.
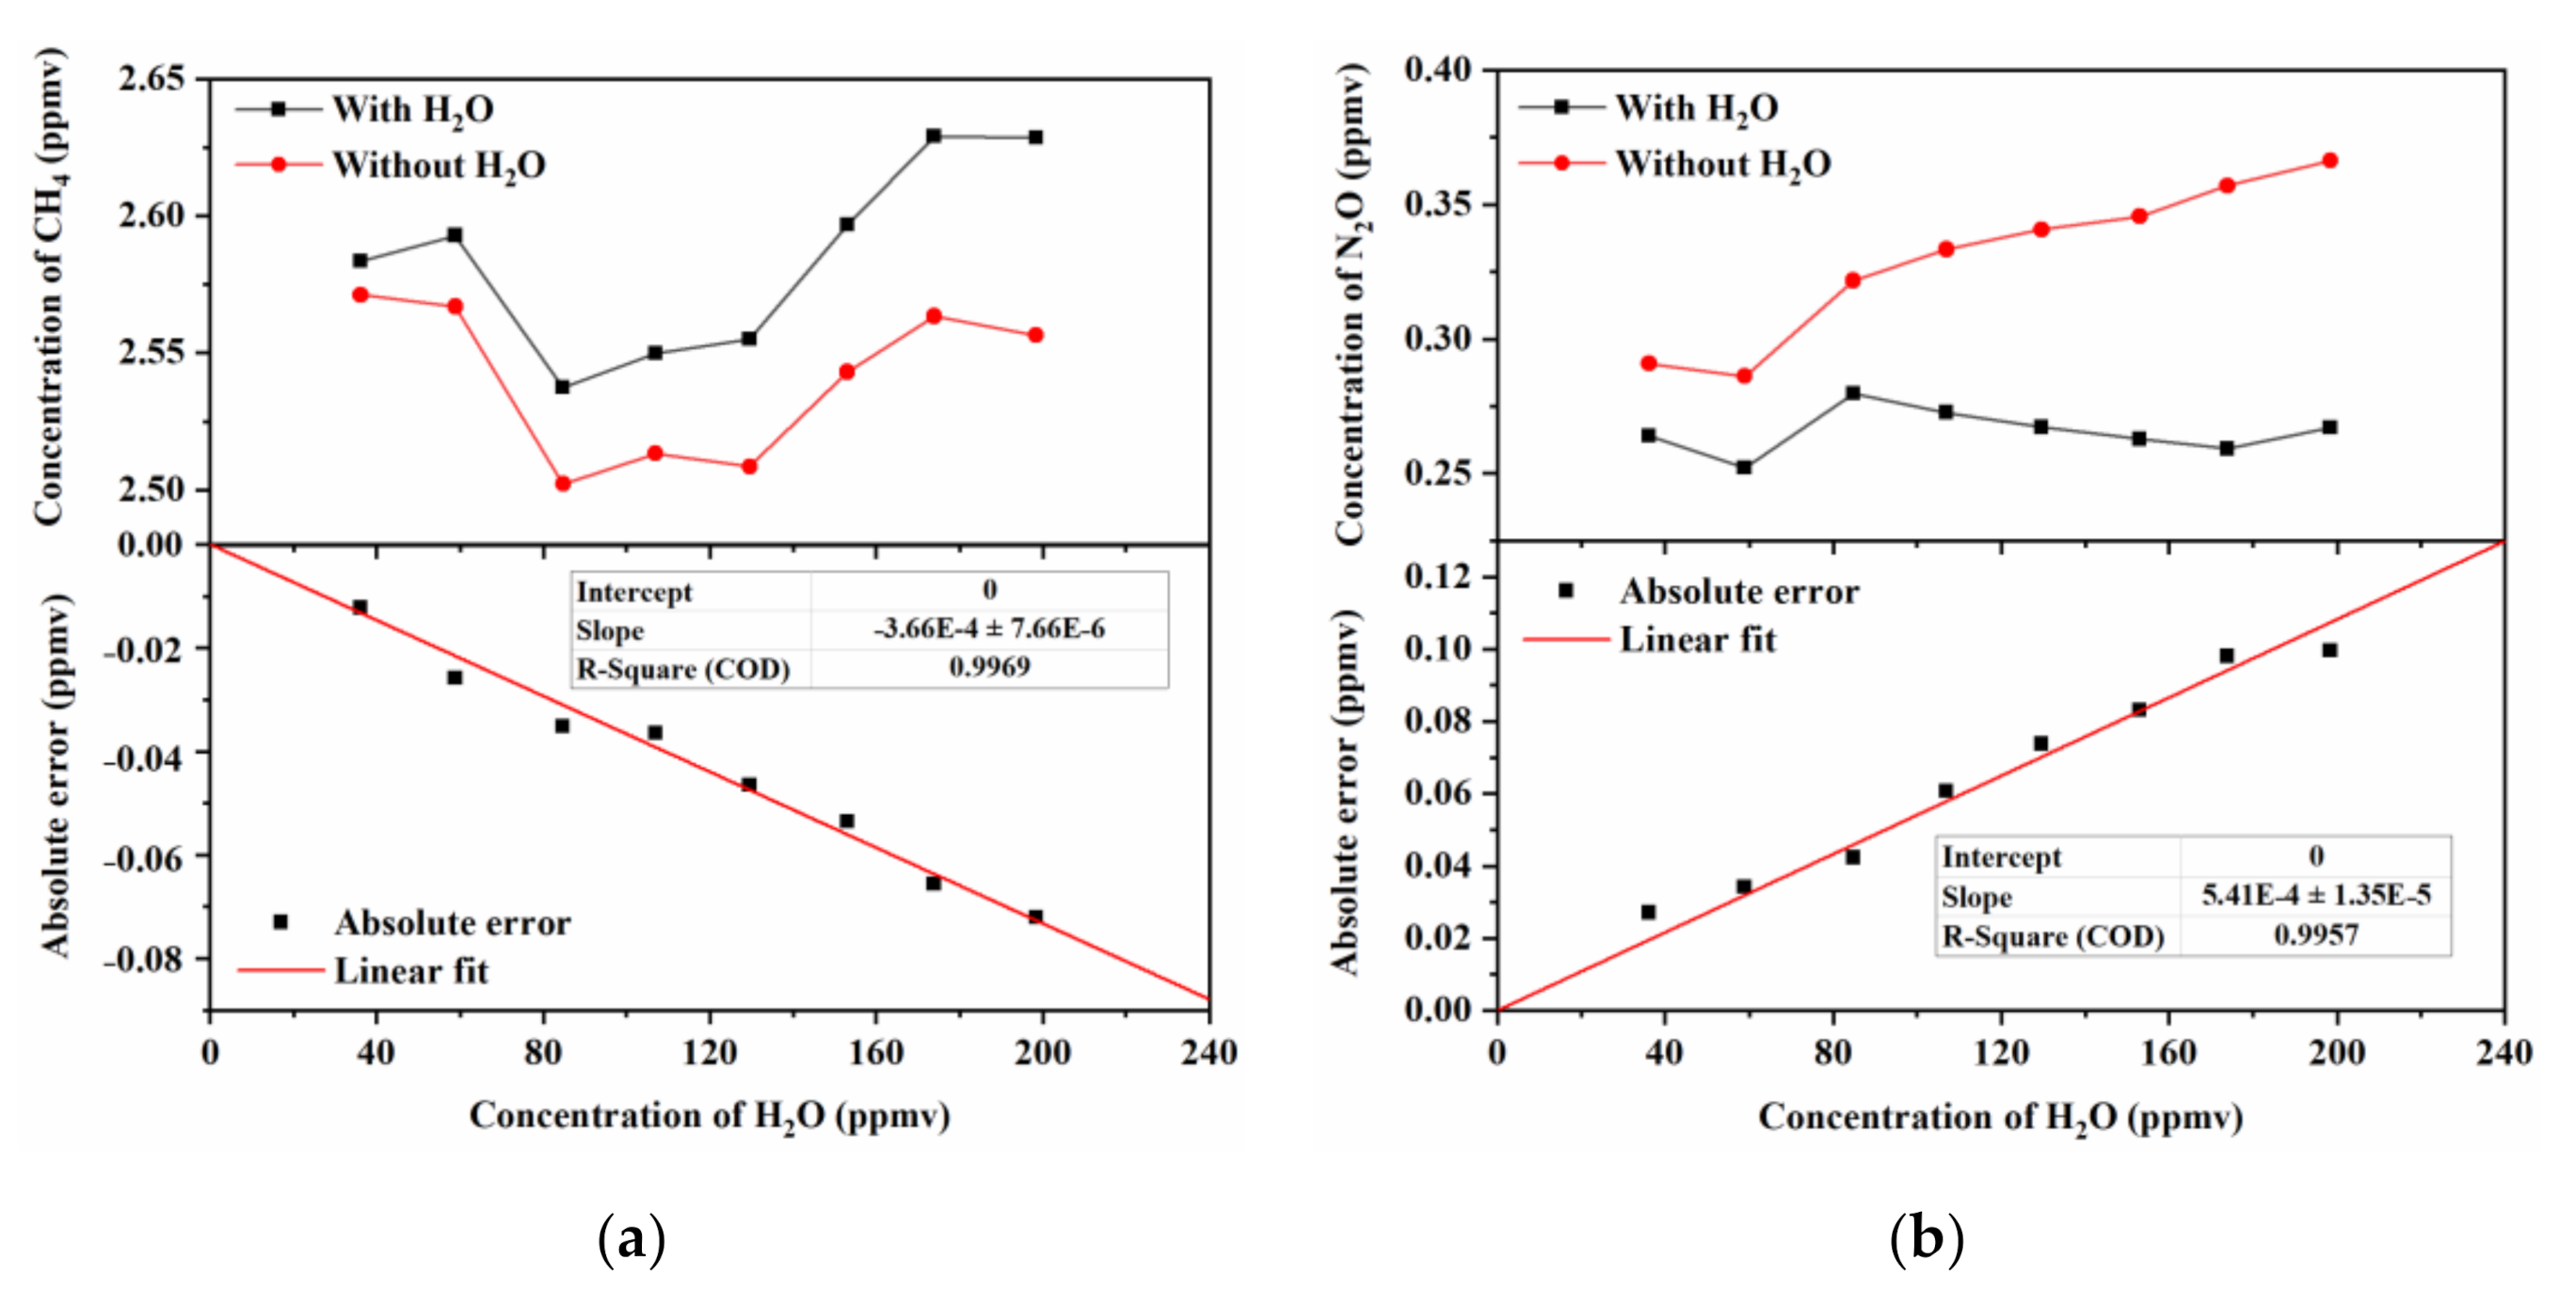
On the other hand, the CH4 and N2O concentrations can also be determined by employing the spectrum measured in the spectral range from 1311 to 1312.1 cm−1. In this case, the concentration of H2O is set to zero and its influence on the CH4 and N2O measurements is included in the background term in Equation (2). In the spectral range from 1311 to 1312.1 cm−1, there are two N2O absorption lines and one CH4 absorption line, which are used to determine the CH4 and N2O concentrations. As the CH4 and N2O lines are somewhat away from the H2O, absorption lines appeared at approximately 1312.5 cm−1 so the influence of H2O is minimized. Still, the influence of H2O might be not negligible due to the wide broadening of the H2O absorption lines. To analyze the impact of the residual H2O on the simultaneous CH4 and N2O measurements, the CH4 and N2O concentrations determined by the spectra measured from 1311 to 1312.1 cm−1 and by that from 1311 to 1313 cm−1 are compared, and the results are presented in Figure 5. Clearly, the existence of residual H2O has a significant influence on the CH4 and N2O measurements. The impact on the CH4 measurement is negative, indicating that the CH4 concentration is under-estimated due to the existence of H2O. On the other hand, the impact on the N2O measurement is positive, indicating that the N2O concentration is over-estimated due to H2O. The H2O induced differences for both CH4 and N2O concentrations increase with the increasing H2O concentration. Approximately, linear dependences of the CH4 and N2O concentration differences (H2O induced measurement errors) on the H2O concentration are observed with slopes of approximately −3.66 × 10⁻⁴ and +5.41 × 10⁻⁴, respectively. That means, a 10 ppmv residual H2O will cause measurement errors of −3.66 ppbv for the CH4 concentration and +5.41 ppbv for the N2O concentration. Or in other words, for a stable air measurement, the concentration of the residual H2O inside the sample cell must be below approximately 1.85 ppmv in order to keep the H2O induced measurement errors for the CH4 and N2O measurements below 1 ppbv.
In Figure 6, the first and eighth measured and fitted spectra from 1311 to 1313 cm−1 and the corresponding residuals are shown. In the eighth measurement, the peak absorption of H2O is significantly higher than that of N2O and CH4 and many data points around the H2O peaks become undetectable due to the reduced signal-to-noise ratio (SNR) of the ring-down signals. It is clearly indicated that the fitting residual of N2O is larger than CH4, since the second absorption peak of N2O is closer to the absorption peak of H2O and is more affected by the changes of H2O concentration.

3.3. CH4 and N2O Measurements of Flowing Air

In practical applications, the CH4 and N2O concentrations in the ambient air need to be monitored continuously. In this case, the measured air is flowing through the sample cell. Therefore, the simultaneous measurement of CH4 and N2O concentrations is performed with flowing air and the impact of residual H2O on the simultaneous CH4 and N2O determination is analyzed. This experiment is performed by keeping the sample cell open and flowing the laboratory air through the sample cell continuously at a flow rate of 3 L per min for 7 h from 8:30 to 15:30 on 1 August, 2019, and the measurements are performed with the same procedure as in Section 3.2. The results are presented in Figure 7. Obviously, the H2O concentration initially shows a downward trend in the first 3 h, and then gradually becomes stabilized to around 13–15 ppmv, which is consistent with the value (15 ppmv) obtained in Section 3.2 showing the drying capacity of the molecular sieves at the flow rate of 3 L per min. Due to the impact of residual H2O, the CH4 and N2O concentrations are under-estimated by approximately −1.3 ppbv and over-estimated by approximately 3.7 ppbv, respectively. These H2O induced measurement errors are somewhat smaller than that estimated with the stable air in the closed sample cell (Section 3.2). From the measurement results with the flowing air, the residual H2O induced errors can be corrected once the H2O concentration becomes constant. Therefore, in real applications, once the H2O concentration becomes stabilized, there is no need to measure the residual H2O concentration repeatedly to reduce the measurement time (the time for one measurement is reduced by nearly half from 20 min to nearly 10 min in our case). From the results presented in Figure 5 and Figure 7, the fluctuation of the CH4 concentration during the whole measurement period is larger than that of N2O, which is in agreement with our previous measurement results [20].

4. Discussion

In this paper, the influence of residual H2O on the simultaneous measurement of CH4 and N2O trace greenhouse gases in ambient air with tunable mid-IR CRDS coupled with EC-QCL in the spectral range from 1311 to 1313 cm−1 has been investigated by treating the residual H2O either as a background gas or as a target gas, whose concentration is being determined simultaneously with the CH4 and N2O concentrations. The experimental results showed that H2O has to be dried to a concentration below at least 200 ppmv. Therefore, the CRDS measurement is possible. Even so the residual H2O still caused a significant impact on the CH4 and N2O measurements. The residual H2O caused an under-estimation of CH4 concentration and over-estimation of N2O concentration, and the H2O induced measurement errors were approximately linearly proportional to the residual H2O concentration. The impact of residual H2O on the simultaneous CH4 and N2O measurements could be minimized by measuring the spectra also including the absorption lines of H2O and determining the H2O concentration simultaneously. In practical applications, due to the linear dependence of the induced errors in CH4 and N2O measurements on the residual H2O concentration, the influence of residual H2O could also be corrected if the residual H2O concentration was stable and accurately measured. The results presented in this paper could be helpful to the more accurate monitoring of CH4 and N2O in atmospheric air.

Author Contributions

Conceptualization, Q.W. and B.L.; formal analysis, Q.W. and B.L.; investigation designed, Q.W. and J.W.; resources, B.L., J.W. and B.Z.; software, Q.W. and J.W.; supervision, B.L., B.Z. and P.Y.; writing—original draft, Q.W.; writing—review and editing, B.L. All authors have read and agreed to the published version of the manuscript.

Funding

This research received no external funding.

Institutional Review Board Statement

Not applicable.

Informed Consent Statement

Not applicable.

Data Availability Statement

Not applicable.

Conflicts of Interest

The authors declare no conflict of interest.

References

  1. Gillett, N.P.; Stone, D.A.; Stott, P.A.; Nozawa, T.; Karpechko, A.Y.; Hegerl, G.C.; Wehner, M.F.; Jones, P.D. Attribution of polar warming to human influence. Nat. Geosci. 2008, 1, 750–754. [Google Scholar] [CrossRef]
  2. Boucher, O.; Friedlingstein, P.; Collins, B.; Shine, K.P. The indirect global warming potential and global temperature change potential due to methane oxidation. Environ. Res. Lett. 2009, 4, 4. [Google Scholar] [CrossRef]
  3. Rapson, T.D.; Dacres, H. Analytical techniques for measuring nitrous oxide. TrAC Trends Anal. Chem. 2014, 54, 65–74. [Google Scholar] [CrossRef] [Green Version]
  4. Prather, M.J.; Hsu, J. Coupling of nitrous oxide and methane by global atmospheric chemistry. Science 2010, 330, 952–954. [Google Scholar] [CrossRef] [Green Version]
  5. Ren, W.; Jiang, W.; Tittel, F.K. Single-QCL-based absorption sensor for simultaneous trace-gas detection of CH4 and N2O. Appl. Phys. A 2014, 117, 245–251. [Google Scholar] [CrossRef]
  6. Hamilton, D.J.; Orr-Ewing, A.J. A Quantum cascade laser-based optical feedback cavity-enhanced absorption spectrometer for the simultaneous measurement of CH4 and N2O in air. Appl. Phys. A 2010, 102, 879–890. [Google Scholar] [CrossRef]
  7. Hodgkinson, J.; Tatam, R.P. Optical gas sensing: A review. Meas. Sci. Technol. 2012, 24, 24. [Google Scholar] [CrossRef] [Green Version]
  8. Liu, X.; Cheng, S.; Liu, H.; Hu, S.; Zhang, D.; Ning, H. A survey on gas sensing technology. Sensors 2012, 12, 9635–9665. [Google Scholar] [CrossRef] [Green Version]
  9. Mahbub, P.; Noori, A.; Parry, J.S.; Davis, J.; Lucieer, A.; Macka, M. Continuous and real-time indoor and outdoor methane sensing with portable optical sensor using rapidly pulsed IR LEDs. Talanta 2020, 218. [Google Scholar] [CrossRef]
  10. Shao, L.; Fang, B.; Zheng, F.; Qiu, X.; He, Q.; Wei, J.; Li, C.; Zhao, W. Simultaneous detection of atmospheric CO and CH4 based on TDLAS using a single 2.3 μm DFB laser. Spectrochim. Acta Part A Mol. Biomol. Spectrosc. 2019, 222. [Google Scholar] [CrossRef]
  11. Crosson, E. A cavity ring-down analyzer for measuring atmospheric levels of methane, carbon dioxide, and water vapor. Appl. Phys. A 2008, 92, 403–408. [Google Scholar] [CrossRef]
  12. Wheeler, M.D.; Newman, S.M.; Orr-Ewing, A.J.; Ashfold, M. Cavity ring-down spectroscopy. J. Chem. Soc. Faraday Trans. 1998, 94, 337–351. [Google Scholar] [CrossRef]
  13. Romanini, D.; Kachanov, A.; Sadeghi, N.; Stoeckel, F. CW cavity ring down spectroscopy. Chem. Phys. Lett. 1997, 264, 316–322. [Google Scholar] [CrossRef]
  14. Berden, G.; Peeters, R.; Meijer, G. Cavity ring-down spectroscopy: Experimental schemes and applications. Int. Rev. Phys. Chem. 2000, 19, 565–607. [Google Scholar] [CrossRef]
  15. De, A.; Banik, G.D.; Maity, A.; Pal, M.; Pradhan, M. Continuous wave external-cavity Quantum cascade laser-based high-resolution cavity ring-down spectrometer for ultrasensitive trace gas detection. Opt. Lett. 2016, 41, 1949–1952. [Google Scholar] [CrossRef]
  16. Curl, R.F.; Capasso, F.; Gmachl, C.; Kosterev, A.A.; McManus, B.; Lewicki, R.; Pusharsky, M.; Wysocki, G.; Tittel, F.K. Quantum cascade lasers in chemical physics. Chem. Phys. Lett. 2010, 487, 1–18. [Google Scholar] [CrossRef]
  17. Wysocki, G.; Lewicki, R.; Curl, R.; Tittel, F.; Diehl, L.; Capasso, F.; Troccoli, M.; Höfler, G.; Bour, D.; Corzine, S.; et al. Widely tunable mode-hop free external cavity Quantum cascade lasers for high resolution spectroscopy and chemical sensing. Appl. Phys. A 2008, 92, 305–311. [Google Scholar] [CrossRef]
  18. Banik, G.D.; Som, S.; Maity, A.; Pal, M.; Maithani, S.; Mandal, S.; Pradhan, M. An EC-QCL based N2O sensor at 5.2 μm using cavity ring-down spectroscopy for environmental applications. Anal. Methods 2017, 9, 2315–2320. [Google Scholar] [CrossRef]
  19. Maity, A.; Pal, M.; Banik, G.D.; Maithani, S.; Pradhan, M. Cavity ring-down spectroscopy using an EC-QCL operating at 7.5 µm for direct monitoring of methane isotopes in air. Laser Phys. Lett. 2017, 14. [Google Scholar] [CrossRef]
  20. Tang, J.; Li, B.; Wang, J. High-precision measurements of nitrous oxide and methane in air with cavity ring-down spectroscopy at 7.6 µm. Atmos. Meas. Tech. 2019, 12, 2851–2861. [Google Scholar] [CrossRef] [Green Version]
  21. Sang, J.; Zhou, S.; Zhang, L.; He, T.; Li, J. Impact of H2O on atmospheric CH4 measurement in near-infrared absorption spectroscopy. Spectrochim. Acta Part A Mol. Biomol. Spectrosc. 2020, 237. [Google Scholar] [CrossRef]
  22. Deng, H.; Sun, J.; Liu, N.; Wang, H.; Yu, B.; Li, J. Impact of H2O broadening effect on atmospheric CO and N2O detection near 4.57 μm. J. Mol. Spectrosc. 2017, 331, 34–43. [Google Scholar] [CrossRef]
  23. Owen, K.; Es-Sebbar, E.-T.; Farooq, A. Measurements of NH3 linestrengths and collisional broadening coefficients in N2, O2, CO2, and H2O near 1103.46cm−1. J. Quant. Spectrosc. Radiat. Transf. 2013, 121, 56–68. [Google Scholar] [CrossRef]
  24. Chen, H.; Winderlich, J.; Gerbig, C.; Hoefer, A.; Rella, C.W.; Crosson, E.R.; Van Pelt, A.D.; Steinbach, J.H.; Kolle, O.; Beck, V.; et al. High-accuracy continuous airborne measurements of greenhouse gases (CO2 and CH4) using the cavity ring-down spectroscopy (CRDS) technique. Atmos. Meas. Tech. 2010, 3, 375–386. [Google Scholar] [CrossRef] [Green Version]
  25. Wallace, C.J.; Jeon, C.; Anderson, C.N.; Havey, D.K. H2O Broadening of a CO2 line and its nearest neighbors near 6360 cm−1. J. Phys. Chem. A 2011, 115, 13804–13810. [Google Scholar] [CrossRef] [PubMed]
  26. Gordon, I.E.; Rothman, L.S.; Hill, C.; Kochanov, R.V.; Tan, Y.; Bernath, P.F.; Birk, M.; Boudon, V.; Campargue, A.; Chance, K.V.; et al. The HITRAN2016 molecular spectroscopic database. J. Quant. Spectrosc. Radiat. Transf. 2017, 203, 3–69. [Google Scholar] [CrossRef]
  27. Rella, C.W.; Chen, H.; Andrews, A.E.; Filges, A.; Gerbig, C.; Hatakka, J.; Karion, A.; Miles, N.; Richardson, S.J.; Steinbacher, M.; et al. High accuracy measurements of dry mole fractions of carbon dioxide and methane in humid air. Atmos. Meas. Tech. 2013, 6, 837–860. [Google Scholar] [CrossRef] [Green Version]
  28. Chen, H.; Karion, A.; Rella, C.W.; Winderlich, J.; Gerbig, C.; Filges, A.; Newberger, T.; Sweeney, C.; Tans, P.P. Accurate measurements of carbon monoxide in humid air using the cavity ring-down spectroscopy (CRDS) technique. Atmos. Meas. Tech. 2013, 6, 1031–1040. [Google Scholar] [CrossRef] [Green Version]
  29. Zellweger, C.; Steinbacher, M.; Buchmann, B. Evaluation of new laser spectrometer techniques for in-situ carbon monoxide measurements. Atmos. Meas. Tech. 2012, 5, 2555–2567. [Google Scholar] [CrossRef] [Green Version]
  30. Butenhoff, C.; Khalil, M. Correction for water vapor in the measurement of atmospheric trace gases. Chemosphere 2002, 47, 823–836. [Google Scholar] [CrossRef]
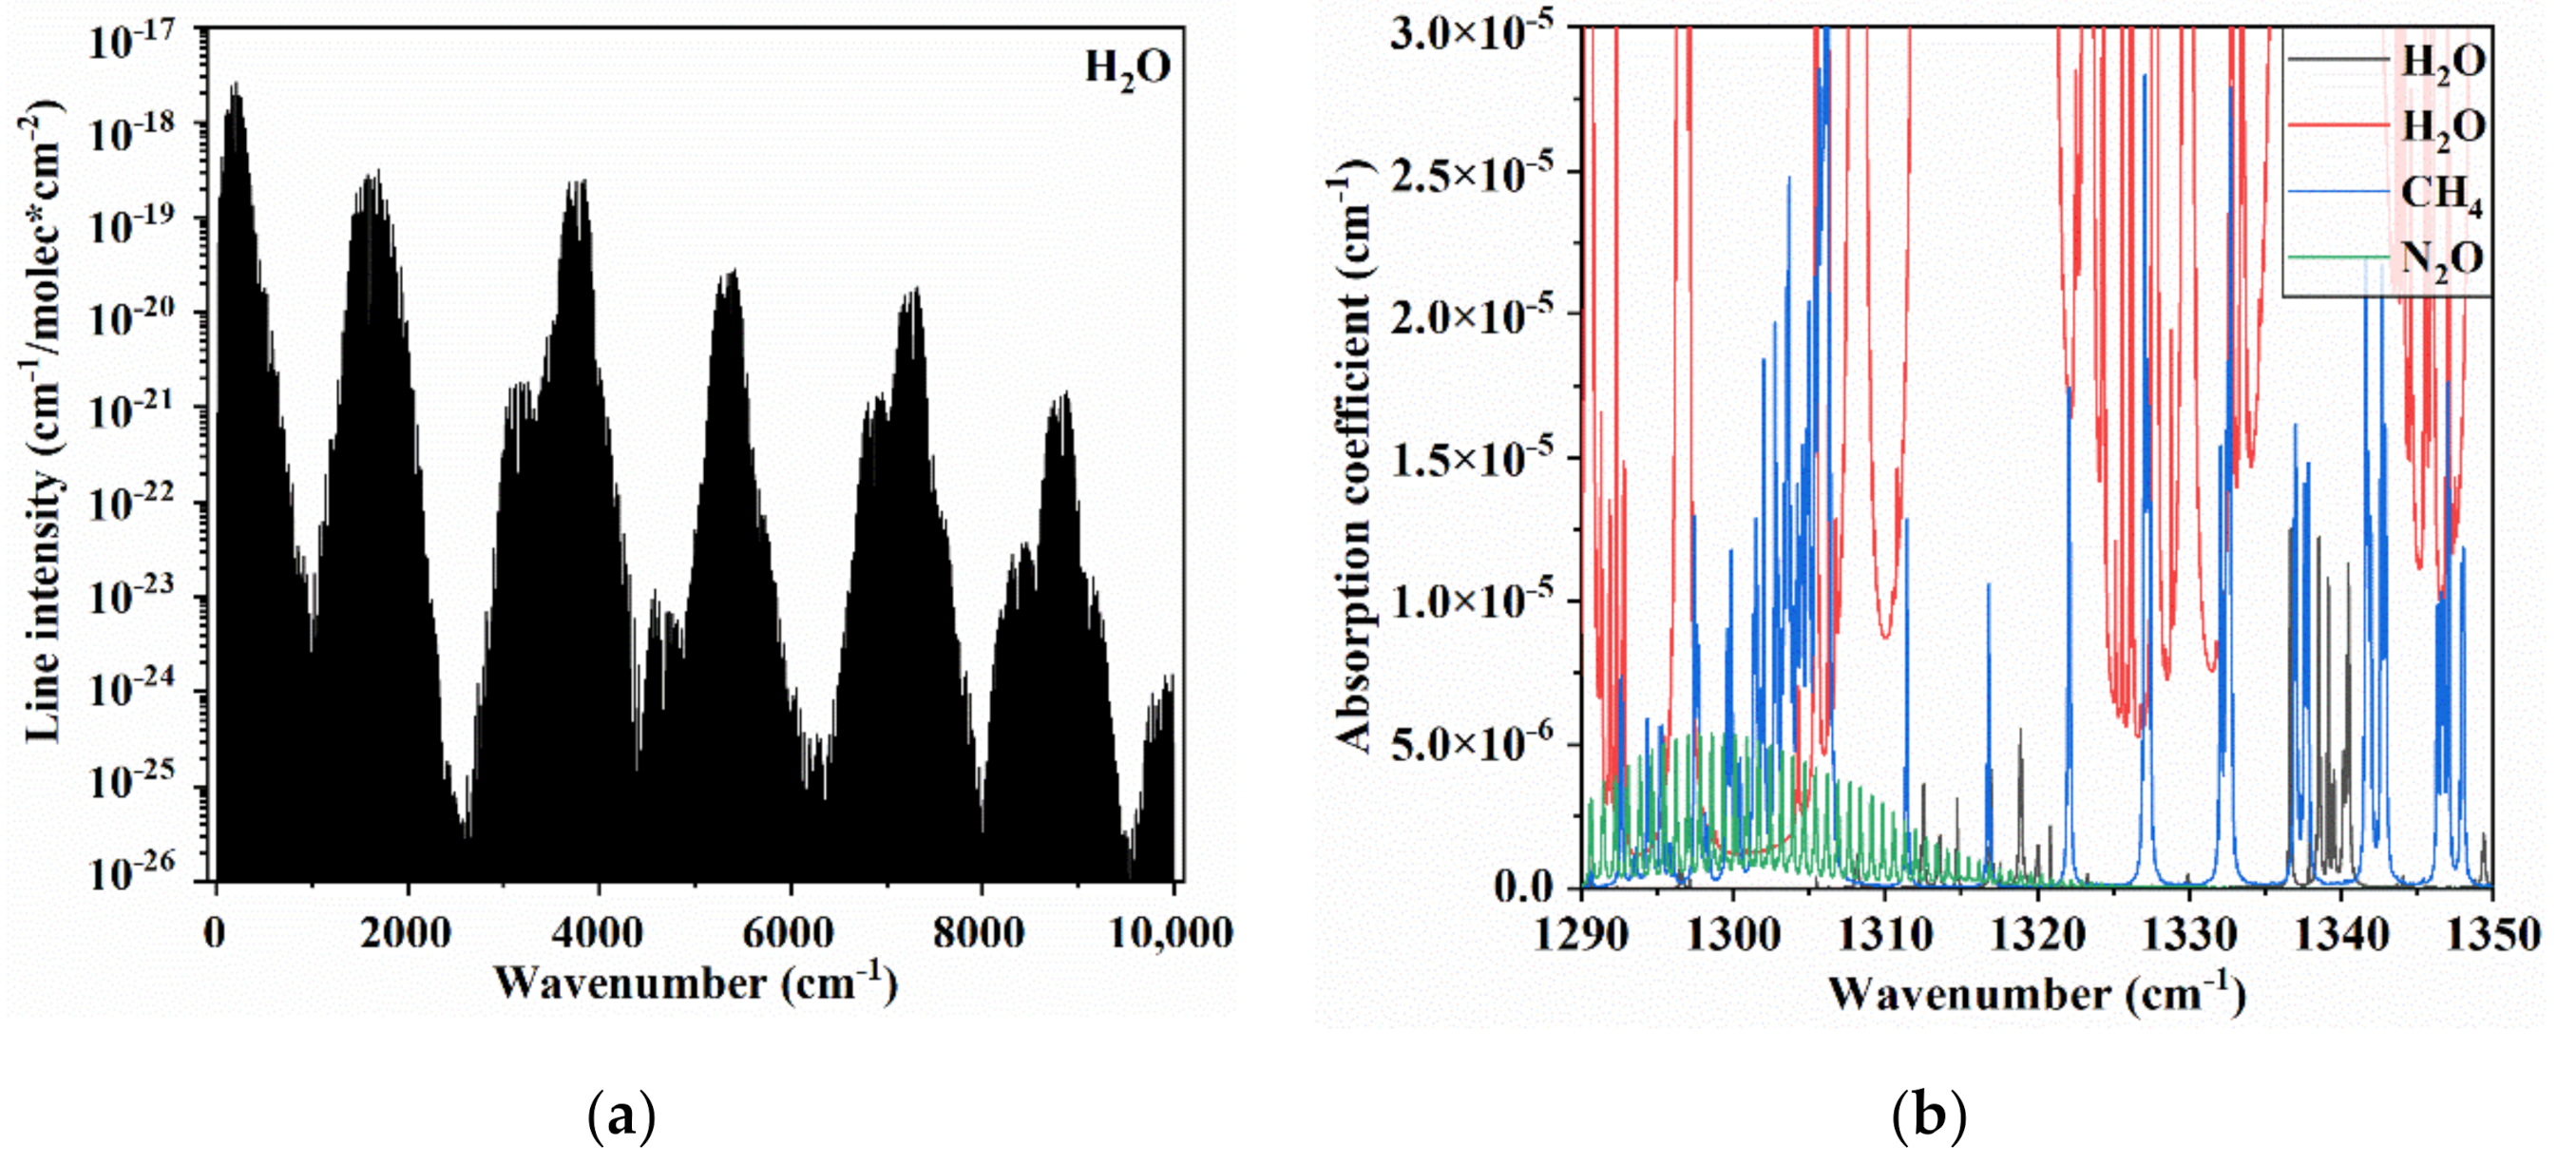
Figure 1. (a) The spectral lines of H2O from HITRAN2016 at 1 atm pressure and 296 K temperature. (b) The absorption coefficients of 2 ppmv CH4, 0.3 ppmv N2O, and 10 ppmv as well as 1.4% H2O at 1 atm pressure and 296 K temperature using HITRAN database data and Voigt linear simulation.
Atmosphere 12 00221 g001
Figure 2. Schematic diagram of the cavity ring-down spectroscopy (CRDS) experimental setup.
Atmosphere 12 00221 g002
Figure 3. (a) The spectra of CH4, N2O, and H2O from 1290 to 1350 cm−1. (b) The spectra of CH4, N2O, and H2O from 1311 to 1313 cm−1.
Atmosphere 12 00221 g003
Figure 4. The linear regression of H2O concentration.
Atmosphere 12 00221 g004
Figure 5. The differences of (a) CH4 and (b) N2O concentrations between that determined with and without simultaneously determining the H2O concentration.
Atmosphere 12 00221 g005
Figure 6. (a) The first and (b) eighth measured and fitted spectra and the corresponding residuals.
Atmosphere 12 00221 g006
Figure 7. The differences of (a) CH4 and (b) N2O concentrations between that determined with and without simultaneously determining the H2O concentration for flowing air.
Atmosphere 12 00221 g007
Publisher’s Note: MDPI stays neutral with regard to jurisdictional claims in published maps and institutional affiliations