Abstract
This study uses four-year radar-based precipitation organization and reanalysis datasets to study the mechanisms that lead to the abrupt springtime onset of precipitation associated with isolated storms in the Southeast United States (SE US). Although the SE US receives relatively constant precipitation year-round, previous work demonstrated a “hidden” summertime maximum in isolated precipitation features (IPF) whose annual cycle resembles that of monsoon climates in the subtropics. In the SE US, IPF rain abruptly ramps up in May and lasts until sometime between late August and early October. This study suggests that the onset of the IPF season in the SE US is brought about by a combination of slow thermodynamic processes and fast dynamic triggers, as follows. First, in the weeks prior to IPF onset, a gradual seasonal build-up of convective available potential energy (CAPE) occurs in the Gulf of Mexico. Then, in one-to-two pentads prior to onset, the upper-tropospheric jet stream shifts northward, favoring the presence of slow-moving frontal systems in the SE US. This poleward shift in the jet stream location in turn allows the establishment of the North Atlantic subtropical high western ridge over the SE US which, with associated poleward transport of high CAPE air from the Gulf of Mexico, leads to the establishment of the warm-season regime of IPF precipitation in the SE US.
1. Introduction
Although the Southeast United States (SE US) does not have well-defined wet and dry rainy seasons [1], it displays a strong seasonality of the subset of precipitation associated with sub-mesoscale isolated storms—hereafter referred to as isolated precipitation features, or IPF [2]. Namely, the SE US has a clear warm season maximum in rain from IPF that has been shown to resemble that of a monsoon climate [2,3]. However, precipitation from larger, mesoscale precipitation features (MPF) remains relatively constant throughout the year [3] in the SE US.
The geographic and temporal characteristics of the springtime transition to the summer precipitation regime have some characteristics of a monsoon climate. A study of high-resolution surface-radar precipitation for the SE US over four years [3] showed that the annual cycle of precipitation in the SE US has a 6:1 ratio of summer-to-winter IPF rain, while the MPF rain rate is on average the same year-round. In their study, the onset of the IPF rainy season was shown to begin in south Florida in mid-April and then occur nearly simultaneously across the southeastern coastal plain during early-to-mid May. Subsequently, onset progressed northward and inland from mid-June through early July. They also found that the timing of the IPF season onset in spring was more consistent from year to year in the southern portion of the domain, suggesting a mechanism of onset related to the annual cycle of solar radiation. However, in the northern and inland portions of the domain, they hypothesized that the mechanism for IPF onset was of a more dynamic nature due to the variable onset timing from year to year. In addition to the mid-summer maximum in IPF rainfall, [3] found pauses in IPF rain lasting from two to seven pentads, which were reminiscent of “active” and “break” periods of a monsoon.
In addition to the effect of the slow seasonal cycle of insolation, the seasonal characteristics of precipitation in the SE US are also influenced by changes in the position of the midlatitude jet stream and its associated midlatitude cyclones and fronts [4,5,6] as well as the intensification and westward migration of the North Atlantic subtropical high (NASH) [7,8,9,10]. These synoptic-scale dynamical processes may play a role in the onset of the summer IPF regime, although this connection has not been previously explored.
Seasonal changes in the upper-level jet stream and midlatitude cyclone structure strongly affect precipitation variability in the SE US (e.g., [6,11]). The upper-tropospheric jet stream over the eastern US is strongest during the winter when it is located between 20° and 40° N. By summer, the jet has weakened and shifted northward to 40–60° N [12]. This springtime northward shift affects the track and structure of midlatitude cyclones in the SE US (e.g., [6]). A study of seasonal and interannual changes in the structure, evolution, and propagation of midlatitude cyclones that affect the SE US [6] found that most winter season precipitation occurs in association with midlatitude cyclones. For example, midlatitude cyclones are responsible for over 70% of the total wintertime precipitation in the Carolinas [6]. However, in the summer midlatitude cyclones play a much less important role in producing precipitation, with only about 30% of the total summertime precipitation in the Carolinas occurring on days when a midlatitude cyclone is present in the region [6]. Moreover, [6] found that the observed seasonal changes in the structure and propagation of midlatitude cyclones can be understood within the framework of the thinning/broadening trough paradigm described in [13]. In particular, [6] found seasonal changes in upper-tropospheric geopotential anomalies that were consistent with a regime shift from wintertime cyclones that are associated with eastward propagating “broadening troughs” and rapidly propagating fronts [6], to summertime cyclones characterized by “thinning troughs” [6] that propagate more slowly in the anticyclonically sheared side of the midlatitude jet stream and lead to nearly stationary upper-tropospheric cut-off cyclones and slow-moving or stationary fronts. This transition is consistent with previous studies that have found a springtime increase in the frequency of thinning troughs in the upper-troposphere [14,15] and that cut-off lows are most common in the eastern US during March–May and throughout the summer [16]. As shown in [6], the transition to thinning troughs occurs as the upper-level westerly jet weakens and shifts northward in the spring and summer [12]. These springtime regime changes in the upper troposphere can produce notable seasonal changes in the low-level structure and precipitation patterns of midlatitude cyclones in the SE US [6]. Namely, wintertime midlatitude cyclones often extend deep into the subtropics as they move eastward and are accompanied by propagating fronts that bring fast surface wind and temperature shifts and a day or two of precipitation to the SE US. In summer, by contrast, semi-stationary upper-level midlatitude troughs are accompanied at the surface by slow moving, stationary frontal boundaries, less variable temperatures and winds, and longer rainy periods to the SE US [6]. Previous work suggested that this mechanism explains the abrupt onset of the rainy season in the South Atlantic convergence zone (SACZ), that is, that the sudden shift to thinning upper tropospheric troughs in the austral spring brings about stationary fronts and the onset of the SACZ [17]. In Southeast Asia, a stalled frontal zone, the Mei-Yu front, also extends into the subtropics launching the monsoon season sometime around the month of May [18]. The present study analyzes whether the springtime shift in the upper-level jet stream and associated changes in midlatitude cyclone regime, superimposed on the seasonal increase in solar radiation, play a role in the onset of the IPF season in the SE US.
The role of the NASH on the springtime IPF precipitation onset is also an important focus of this study. In the SE US, the NASH, a semipermanent lower-tropospheric high-pressure center that extends across the Atlantic [19], dominates the warm-season climate of the region. During the spring and summer, the midlatitude cyclone track shifts northward as the NASH expands and intensifies into a strong pressure maximum located in the central Atlantic that extends from North America to Europe [19]. The western side of the NASH, also known as the NASH western ridge, plays an important role in northward moisture transport and summertime precipitation variability in the SE US on timescales that range from the diurnal cycle to multi-decadal variability [8,9,20,21,22,23].
This study aims to investigate the mechanisms for the springtime onset of IPF precipitation in the SE US for 2009–2012. In particular, this study looks into the role of seasonal changes in thermodynamic and dynamic atmospheric conditions—including the character and propagation of midlatitude cyclones and fronts, convective instability, and the annual westward migration of the NASH in the timing of the onset of widespread isolated convection in the spring. This study is organized as follows. Section 2 presents the datasets and methodology. Section 3 places the variability of the IPF season onset in the context of dynamic and thermodynamic environmental conditions. Section 4 synthesizes the main results, and Section 5 presents the conclusions.
2. Data and Methods
This study used a radar-based precipitation organization dataset [1], available from 2009 to 2012 for the SE US, and dynamic and thermodynamic fields from the daily North American Regional Reanalysis (NARR, [24]) at 32 km horizontal resolution for the same period. Pentads and composites of IPF rain, convective available potential energy (CAPE), and low and upper tropospheric winds were calculated and analyzed.
The precipitation data were derived from the high-resolution radar-based National Mosaic and Multi-Sensor Quantitative Precipitation Estimation dataset (NMQ; [25]), at roughly 1 km horizontal and 15-min temporal resolution. Following previous work, rain features larger than 100 km in maximum dimension were objectively identified in instantaneous NMQ radar images as MPF, using the 100 km size threshold of an MCS [26]. Individual features smaller than 100 km were classified as IPF. A rain feature was defined as a contiguous group of pixels with instantaneous rain rate greater than or equal to 0.5 mm h−1, which is a threshold that corresponds to light rain and filters remnant non-meteorological signal in the data. The IPF and MPF features were identified in instantaneous rain maps each hour for 2009–2012 using the aforementioned definitions [2,3]. Then, precipitation was summed at each pixel to produce maps of pentad values (5-day means) for IPF, MPF, and total precipitation. Following previous studies of monsoon onset [17,27], pentads were used to filter out some of the day-to-day synoptic-scale variability of the atmosphere, allowing lower frequency variability to stand out. Using this pentad dataset, a recent study [2] divided the SE US into 34 boxed regions (2° on a side) and analyzed IPF onset across the region using a methodology previously applied to studies of regional patterns of the South America monsoon onset [17,27,28], based on sustained rainfall above a threshold value. For each 2° box across the SE US and for the SE US as a whole, onset was defined as the first pentad for which the annual IPF rain time series exceeded the four-year mean IPF rain average (0.76 mm day−1) and remained above this threshold for at least five of the eight subsequent pentads. In the present study, the end of the IPF rainy season was defined as the last pentad when IPF rain was above the threshold with at least five of the eight subsequent pentads below the threshold.
Pentads of dynamic and thermodynamic fields were calculated from NARR [14] and used to establish the synoptic-scale environment in the SE US near the time of onset for each year. This analysis focused on thermodynamic instability, the position of the NASH, and the migration of the jet stream latitude. For each pentad, CAPE was averaged over the portion of the SE US that falls between 25° and 40° N and extends from 90° W to the coastline. The daily and pentad positions of the NASH western ridge were determined according to the methodology used in [8,9,21], as the location where the 850 hPa surface’s 1560 m geopotential contour crosses the NASH ridge line. The ridge line was defined where the easterlies on the equatorward side of the NASH reverse to westerlies on the poleward side of the NASH. The shifts in position of the jet stream in the SE US were measured using a North–South Index (NSI), which is defined here as follows. The pentad mean NARR Reanalysis 200 hPa wind was averaged over two regions corresponding to the mean wintertime and summertime preferred latitude bands of the upper-tropospheric jet over the SE US. The northern region was bounded by 90°–70° W and 40°–60° N and the southern region was bounded by 90°–70° W and 20°–40° N. Lastly, the NSI was defined as the difference between the average 200 hPa zonal wind in the northern and southern regions, calculated for each pentad. The time variation of the NSI was used to determine north–south shifts of the upper-tropospheric westerly jet over the SE US. A positive NSI means that the upper-tropospheric westerly jet is located in the northern preferred region, and a negative NSI indicates that the jet is located in the southern preferred region.
3. Results
The onset, end, and duration of the annual IPF season in the SE US, as well as the seasonal mean IPF rain rate, were determined for each year of the study period and are summarized in Table 1. On average, the IPF rainy season began the second week of May and ended in mid-September, lasting just over four months. The IPF season onset occurred in May each year, with the earliest onset in 2009 and the latest in 2011. The IPF season duration ranged from 3.5 to 5 months.

Table 1.
IPF season onset (pentad and date), end (pentad and date), and duration (number of months) for the SE US domain, for each individual year (2009–2012) and for the four years average. Domain-averaged IPF rain rate (in mm day−1) and IPF season accumulated IPF rain (mm) are shown in parentheses.
The end date was more variable than the onset date, ranging from late August to mid-October. The season duration did not appear to correlate with either earlier or later onset and end date. The IPF season domain-averaged IPF rainfall was 1.45 mm day−1, ranging from 1.2 to 1.9 mm day−1. Although the longest season (2009) had the highest integrated IPF rain, the shortest season (2010) had nearly as high accumulated IPF rain and the highest mean IPF rain rate. In contrast with the short and wet (IPF) 2010 season, 2011 was relatively long and dry (IPF), with the lowest seasonal accumulation of IPF rain despite a season duration of nearly as long as the five-month maximum.
3.1. IPF Season Evolution: IPF Rain, CAPE, and NSI Annual Cycle
The role of atmospheric dynamics and thermodynamics in the SE US IPF season onset can be gleaned from the pentad timeseries of IPF rainfall, CAPE, and NSI, as shown in Figure 1. The pentad timeseries for each individual year was plotted such that the IPF onset date occurs at t = 0. In the discussion below, time is centered at the onset pentad, with the nth pentad before onset referred to as onset−n and the nth pentad after onset referred to as onset+n. The average season (black lines in Figure 1) is the average of the 2009–2012 timeseries centered on the onset pentad.
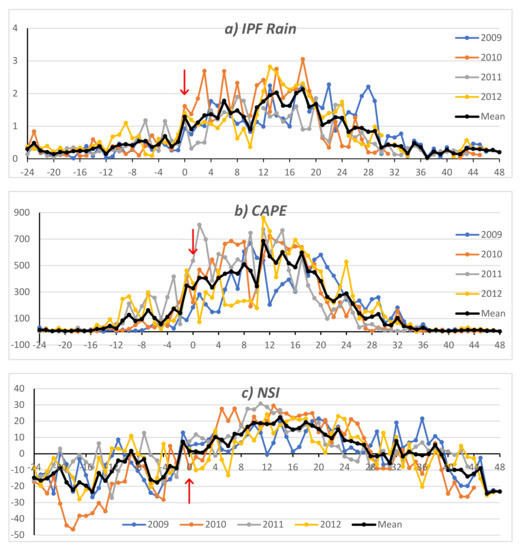
Figure 1.
Pentad timeseries of (a) IPF rain (mm day−1), and North American Regional Reanalysis (NARR), (b) convective available potential energy (CAPE) (J Kg−1) and (c) North–South Index (NSI) (m s1). All timeseries are averaged over the SE US land domain southward of 40° N and eastward of 90° W. Time is shown in terms of pentads prior to (negative values) and after (positive values) IPF onset, with IPF onset at t = 0 (red arrow). The 4-year average timeseries for each variable is also shown (black line).
On average, IPF rain increased by two to threefold between the onset−1 and the onset pentad. An exception to this was 2011, when precipitation was very variable between the onset−5 and onset+4 pentads. After onset, the average IPF rainfall continued to increase, reaching a maximum about 18 pentads later. For each year, the three-month summertime post-onset mean IPF rainfall was 3–6 times greater (statistically significant at the 99% confidence level or higher according to a Student-T test) than the mean IPF rain in the three months prior to onset. A relative minimum in IPF rainfall occurred each year about 9–10 pentads after onset. This apparent “break” in the IPF season occurred each year but was more pronounced in 2009 and 2012. As expected, there is a clear relationship (correlation of 0.69) between the mean annual cycles of CAPE (Figure 1b, black line) and IPF (Figure 1a, black line) rain. CAPE increased sharply between the onset−2 and onset−1 pentads (Figure 1b, black line), suggesting a causative role for the seasonal increase of thermodynamic instability in the onset of the IPF season in the SE US. After onset, CAPE increased rapidly, doubling by the onset+11 pentad and decreasing thereafter. The change in CAPE between the three-month period prior to onset and the three-month post-onset period is statistically significant at the 99% confidence level or higher according to a Student-T test. The strong positive correlation between the seasonal cycle of CAPE and IPF rain, with a sharp increase in CAPE preceding IPF rain onset, suggests that the seasonal cycle of IPF rain responds strongly to seasonal thermodynamic priming of the atmosphere.
The relationship between the seasonal migration of the jet stream location and IPF onset is examined in Figure 1c, which shows the timeseries of the NSI for each year and for the four-year average. In the average season timeseries (black line), the NSI was generally negative up to the onset−1 pentad, indicating that up to then, the jet stream remained in its southern, wintertime preferred latitude band of 20°–40° N. Then, one pentad before IPF onset, the NSI became positive, indicating that the jet stream weakened at 20–40° N and strengthened at 40–60° N. Since the mean NSI remained positive from onset−1 through the entire summer, this transition signaled the beginning of the annual summertime northward migration of the jet to its preferred summertime position. This was true for the mean timeseries as well as for each individual year. After onset, some differences were apparent between the individual years. In 2009 and 2011, the NSI timeseries remained positive for the remainder of the summer, indicating that after the jet stream shifted northward at onset−1, it remained in its preferred summertime position for most of the remainder of the IPF season. However, in 2010 and 2012, the NSI timeseries became negative again for several pentads after onset before finally returning to positive values for the remainder of the summer season. Overall, for each year, the difference in NSI between the three-month period prior to onset and the three-month period after onset is statistically significant at the 99% confidence level or higher according to a Student t-test.
3.2. IPF Season Evolution: Jet Stream, CAPE, and NASH Composites
The spatial context of the trends described in the previous section is studied using a composite analysis of the jet stream poleward migration, CAPE buildup, and NASH westward extension near the IPF onset pentad. Pentad composites of the 200 hPa zonal wind, CAPE, and the 1560 m geopotential contour at 850 hPa averaged for the four-year study period are shown in Figure 2 and Figure 3. Additionally, Figure 3 displays the geopotential contour for each individual year. Five pentads prior to onset (onset−5), the upper level jet stream (Figure 2a) was located at its preferred wintertime latitude band of 20°–40° N, and the western ridge of the NASH was not yet present in the four-year composite. Individually for 2009 and 2011, the NASH western ridge was present in the NARR domain, but it was located 2000 km to the east of the SE US, which was likely too far to have an influence in the SE US. At onset−5, CAPE remained low across the SE US and also across the Gulf of Mexico (Figure 3a). During the onset−4 and onset−3 pentad composites (not shown), the upper-level jet weakened, while the NASH western ridge remained absent or far east of the SE US. At onset−2, the upper-level jet stream became weaker and was still located between 20° and 40° N (Figure 2b). However, at that time the NASH western ridge was for the first time present in the composites for all years, over the Atlantic Ocean about 1000 km east of Florida (Figure 3b). For two of the years, 2009 and 2012, the NASH western ridge had by this time become established in the Gulf of Mexico. At onset−2, CAPE began to increase in the SE US, especially along the edges of the NASH western ridge. Note how the winds along the NASH western ridge between 100° and 90° W carry a tongue of high CAPE northward and then eastward toward the SE US. The onset−1 pentad composite shows that the upper-level jet stream had shifted northward to 40°–60° N (Figure 2c). Between onset−2 and onset−1, CAPE more than doubled across the SE US (Figure 1b), as warm and moist air from the Gulf of Mexico continued to be advected northward along the NASH western ridge (Figure 3c). At the onset pentad, the upper-level jet stream became split, with a branch located at 40°–50° N and a second, weaker branch located at 20°–30° N (Figure 2d), suggesting the start of a rapid poleward transition of the mean jet stream position. At this time, the NASH western ridge was clearly established along the east coast of the SE US in three of the four years (Figure 3d). By onset+3, the upper-level jet stream had completed the poleward shift to its summertime latitude range of 40°–60° N (Figure 2f,g), the NASH western ridge was well established near the SE US in all four years, and values of CAPE exceeding 1000 J kg−1 (capable of supporting convection) were present in the Gulf of Mexico and Caribbean. These features indicate that a continuous flow of warm moist air was well established over the SE US (Figure 3f,g) at about three pentads following onset, completing the transition to the summertime IPF regime.
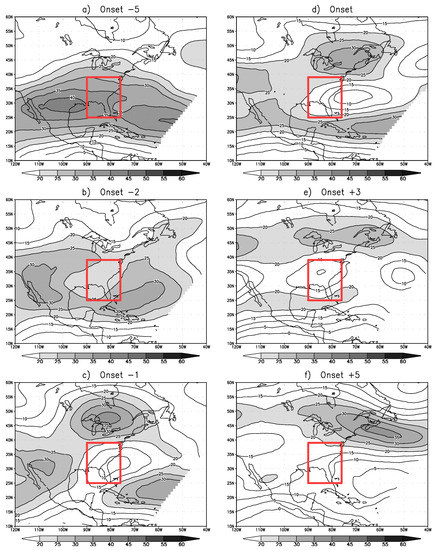
Figure 2.
Pentad composites for the four-year period of zonal wind at 200 hPa (m s−1) at the (a) onset−5, (b) onset−3, (c) onset−1, (d) onset, (e) onset+3, and (f) onset+5 pentads. Red box marks the SE US domain.
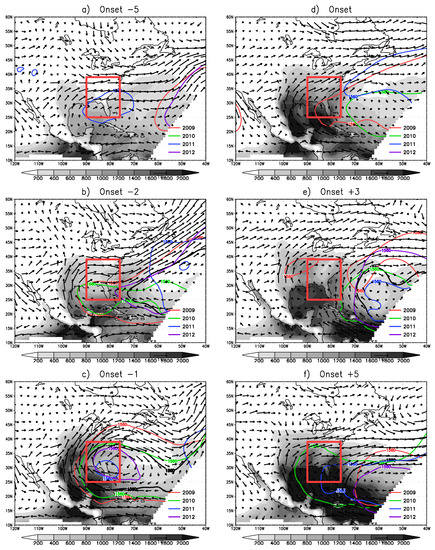
Figure 3.
Pentad composites for the four-year period of CAPE (J Kg−1, shaded starting at 200 J Kg−1 for every 200 J Kg−1) and 850 hPa winds (m s−1) at the (a) onset−5, (b) onset−3, (c) onset−1, (d) onset, (e) onset+3, and (f) onset+5 pentads. The composite 1560 m geopotential contours (m) are shown for each year (2009 in red, 2010 in green, 2011 in blue, and 2012 in purple) and for the four-year mean (black contours). Red box marks the SE US domain.
In sum, this analysis indicates that the IPF season onset is brought about by a slow CAPE buildup, an abrupt poleward migration of the jet stream, and a westward extension of the NASH. Although the use of a relatively short four-year dataset is a limitation of this study, the sequence of atmospheric changes that led to the onset of the IPF season in the SE US was quite consistent from year to year, suggesting that the proposed mechanisms for IPF season onset are robust.
3.3. IPF Onset in 2009
It is instructive to present an example of IPF onset in the SE US for a particular year (2009) to illustrate the mechanisms described in the previous section. In 2009, the IPF onset occurred relatively early, in pentad 25 (1–5 May, Table 1). By late April (pentad 24, 26–30 April), the upper level jet across the eastern US had weakened and shifted northward abruptly (not shown) from the southern U.S. (25° N) into Canada (47° N). The northward shift of the upper-level jet meant that midlatitude cyclones affecting the SE US became embedded in the weaker westerly flow and anticyclonic shear of the south side of the jet. In the days following pentad 24, this configuration favored nearly stationary frontal systems, which brought widespread rainfall across the SE US. In fact, on 1 May (start of pentad 25, not shown), a slow-moving cold front associated with an occluded midlatitude cyclone in eastern Canada extended southwestward across the Great Lakes and into Texas. The next day (2 May, Figure 4a), the cold front arrived at the northern portion of the SE US domain, bringing heavy precipitation to Tennessee and northern Georgia, Alabama, and Mississippi. This front stalled across the SE US between 2 and 8 May (Figure 4a–d), bringing rain across the SE US region associated with the maritime tropical air mass and southerly wind on the warm side of the frontal boundary. The NASH was well organized by pentad 20 (red contour in Figure 3a), and its western ridge pushed westward toward the SE US (red contours in Figure 3b–d) such that when the stationary front became established, southerly moist air was advected across the SE US for several days. These conditions led to IPF onset on pentad 25 (Table 1). Another cold front approached from the northwest and entered the SE US domain on 9 May (in pentad 26). This cold front reached all the way south to Florida, where it rained on 12 May (Figure 4f), coinciding with the onset of the IPF rainy season in Florida on pentad 27 (see top of Figure 10 in [3]).
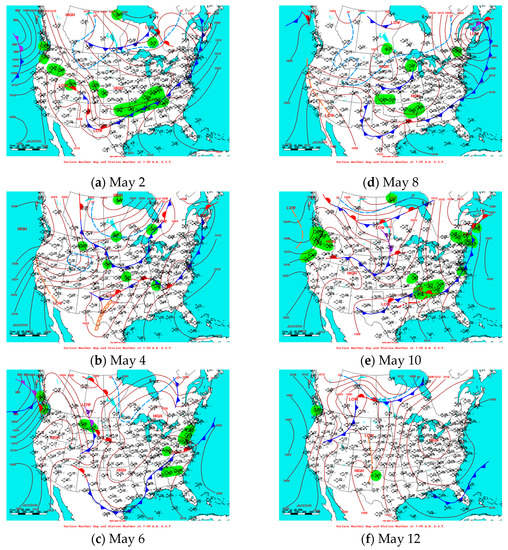
Figure 4.
Surface weather maps for (a) 2 May, (b) 4 May, (c) 6 May, (d) 8 May, (e) 10 May, and (f) 12 May 2009 at 1200 UTC (0700 local time in SE US). Sea level pressure (contours), frontal systems and surface station weather observations are also shown. From the Weather Prediction Center at the National Center for Environmental Prediction (available at https://www.wpc.ncep.noaa.gov/dailywxmap/index.html).
In summary, the leadup to the onset of the 2009 IPF rainy season in the SE US began with the arrival of the NASH western ridge, followed by a northward shift of the jet stream. As described previously, the northward shift of the jet stream contributed to the establishment of a stationary frontal system across the SE US. On the warm side of the frontal zone, the persistent southerly moist flow on the NASH western ridge for several days contributed to the onset of the IPF rainy season.
4. Discussion
In this study a confluence of dynamic and thermodynamic mechanisms was shown to drive the transition to the summer IPF precipitation regime in the SE US. The first and most important step in the series of events that lead to the onset of the IPF rainy season in the SE US is the weakening and northward shift of the upper tropospheric jet stream. In the two weeks prior to IPF season onset, the upper-tropospheric jet stream shifts from its wintertime preferred latitude at 20°–40° N to its preferred summertime latitude of 40–60° N. This springtime northward shift is a well-known behavior of the jet stream [12] over North America. The fact that this shift occurs just prior to the SE US IPF season onset suggests that changes in midlatitude cyclone track and frontal characteristics related to the poleward migration of the jet stream play a role in the onset of the IPF rainy season. During wintertime, midlatitude cyclones and their attendant frontal systems and precipitation typically move across the eastern US quickly, propagating from western Texas to just offshore from Massachusetts in about two days [6]. However, during the summer, midlatitude cyclones propagate more slowly along tracks that are located further north in Canada [6] and are accompanied by slow-moving fronts that can linger across the SE US for days at a time. This study suggests that in the SE US, the transition from faster, more southward tracking wintertime midlatitude cyclones to slower-moving summertime midlatitude cyclones that propagate at higher latitudes occurs during a two-week period in May, when the upper-tropospheric jet stream shifts northward, leaving the SE US in the slower, anticyclonically sheared side of the jet stream. Incidentally, the abrupt shift in the regime of tropospheric dynamics during the month of May is consistent with the abrupt 3-fold increase in the frequency of anticyclonically sheared upper-tropospheric troughs that has been previously observed in the Northern Hemisphere [14] in the month of May. This study for the first time suggests that the onset of the IPF season in the SE US coincides with the regime shift from fast-moving wintertime cold fronts that usually bring precipitation to the SE US for just a day or two, to slow-moving frontal systems that produce extended periods of precipitation across the SEUS [6]. During the month prior to onset, a gradual increase in CAPE takes place in the Gulf of Mexico, driven by the seasonal northward migration of the sun. When the NASH western ridge reaches the Gulf of Mexico just two pentads prior to IPF onset, it transports high CAPE air from the Gulf of Mexico into the US, leading to an increase in CAPE to fuel precipitation over the SE US.
The core finding of this study is that slow thermodynamic processes associated with the seasonal migration of the sun, and fast dynamic processes associated with changes in the jet stream and midlatitude cyclones and fronts, combine to trigger the abrupt onset of the IPF season in the SE US. This is similar to the processes involved in the onset of the rainy season in the South Atlantic Convergence zone (SACZ) in South America [17]. The abrupt establishment of the SACZ in October–November occurs when the midlatitude jet shifts southward (poleward) over South America so that midlatitude cyclones become embedded in the anticyclonic side of the jet stream and develop a thinning trough behavior [13] with frontal systems that propagate more slowly and become stationary in southeast Brazil. The difference between the SACZ and the SE US of course is that there is a well-defined dry and wet season climate in the SACZ, whereas there is no such behavior for the total precipitation in the SE US [1]. In this sense, the summer IPF regime represents a kind of “hidden” monsoon embedded within the relatively flat annual cycle of precipitation in the SE US.
5. Conclusions
This study used a four-year dataset to study the mechanisms for onset of the IPF rainy season in the SE US. Although the SE US receives more or less constant precipitation throughout the year, it has a marked seasonal cycle of isolated precipitation with an abrupt onset in May, a distinct maximum in summertime, and a more gradual end sometime in late August–early October.
This study used pentad timeseries and composites of IPF rain and NARR datasets to uncover the changes in synoptic scale thermodynamic and dynamic atmospheric conditions that lead to the spring onset of the IPF rainy season in the SE US. Namely, the chain of events that lead to the onset of the IPF season in the SE US includes (1) a slow seasonal increase in CAPE over the Gulf of Mexico, combined with (2) a fast northward shift of the upper-tropospheric jet stream and associated shift slow moving frontal systems at the surface, and finally (3) the arrival of the NASH western ridge, which transports high CAPE air northward from the Gulf of Mexico, thus fueling pentads-long periods of precipitation in the SE US that translate into the onset of the IPF rainy season.
The significance of this work is that it provides a framework for studying seasonal transitions of precipitation in rainy regions of the subtropics. First, the IPF–MPF framework can help reveal “hidden” climate signals, such as the monsoon-like annual cycle of IPF precipitation that occurs in the SE US. The IPF–MPF framework also allows a better understanding of the mechanisms that control the seasonal cycle of precipitation in the subtropics, where the slow thermodynamic priming of the atmosphere by the migration of the sun combines with fast dynamic processes associated with the jet stream to produce the onset of the IPF precipitation season. In fact, the sequence of events that brings about the onset of the IPF season in the SE US therefore shares some common features with subtropical monsoon climates such as the SACZ in South America [17] and the Mei-Yu and Baiu fronts in Asia [18].
The implications of this study to the timing and intensity of seasonal rainfall changes in a warming planet, though beyond the scope of this study, are intriguing. Recent observational and modeling studies suggested that an expansion of the tropics has been under way in recent decades (e.g., [29]). Furthermore, recent studies have suggested that as the tropics expand, the subtropics are becoming drier (e.g., [22]). A question that arises from the present study is whether this tropical expansion might cause the IPF annual cycle to stand out so that, at least in terms of the seasonal cycle of precipitation, the SE US might become more similar to a monsoon climate. The effects of tropical expansion, and more generally climate change, on the IPF season and its onset in the SE US are beyond the scope of this study.
The conclusions drawn from this four-year case study are preliminary due to the use of a relatively short dataset that is confined to the geographical domain of the SE US. Nevertheless, the strong consistency of the IPF onset timing and amplitude each year demonstrate the presence of this seasonal phenomenon. Moreover, the sequence of atmospheric changes that lead to the IPF onset were quite consistent for each year, suggesting that the proposed mechanisms are robust. A nine-year radar-based precipitation organization dataset that encompasses the entire continental US eastward of the Rockies is currently in production. Analysis of this longer dataset will help improve our confidence in the IPF season onset mechanisms proposed here and help determine the extent of the domain of the IPF season regime in the US. The new dataset may also help shed light on the interannual variability of the timing of the IPF precipitation season onset in the SE US.
Author Contributions
Conceptualization, R.N.F. Methodology, software and validation, R.N.F. and T.M.R. Formal analysis, R.N.F. and T.M.R. Investigation, R.N.F. and T.M.R. Resources, R.N.F. and T.M.R. Data curation, R.N.F. and T.M.R. Writing—original draft preparation, R.N.F. Writing—review and editing, R.N.F. and T.M.R. Visualization, R.N.F. Supervision and project administration, R.N.F. and T.M.R. Funding acquisition, R.N.F. and T.M.R. All authors have read and agreed to the published version of the manuscript.
Funding
This study was funded by a grant (AGS-1660049) from the National Science Foundation’s Climate and Large-Scale Dynamics Program of the Division of Atmospheric and Geospatial Science.
Institutional Review Board Statement
Not applicable.
Informed Consent Statement
Not applicable.
Data Availability Statement
The NARR data is publicly available from https://psl.noaa.gov/data/gridded/data.narr.html. The radar-derived data presented in this study is available from the authors upon request.
Acknowledgments
Brian Nelson from the NOAA National Centers for Environmental Information, Asheville, NC, USA provided the NMQ precipitation data. We sincerely appreciate the suggestions from two anonymous reviewers.
Conflicts of Interest
The authors declare no conflict of interest. The funders had no role in the design of the study; in the collection, analyses, or interpretation of data; in the writing of the manuscript, or in the decision to publish the results.
References
- Bombardi, R.J.; Kinter, J.L.; Frauenfeld, O.W. A Global Gridded Dataset of the Characteristics of the Rainy And Dry Seasons. Bull. Am. Meteorol. Soc. 2019, 100, 1315–1328. [Google Scholar] [CrossRef]
- Rickenbach, T.M.; Nieto-Ferreira, R.; Zarzar, C.; Nelson, B. A seasonal and diurnal climatology of precipitation organization in the southeastern United States. Q. J. R. Meteorol. Soc. 2015, 141, 1938–1956. [Google Scholar] [CrossRef]
- Rickenbach, T.M.; Ferreira, R.N.; Wells, H. Springtime Onset of Isolated Convection Precipitation across the Southeastern United States: Framework and Regional Evolution. Mon. Weather Rev. 2020, 148, 891–906. [Google Scholar] [CrossRef]
- Zishka, K.M.; Smith, P.J. The Climatology of Cyclones and Anticyclones over North America and Surrounding Ocean Environs for January and July 1950–1977. Mon. Weather Rev. 1980, 108, 387–401. [Google Scholar] [CrossRef]
- Nieto Ferreira, R.; Earl Hall, L. Midlatitude cyclones in the southeastern United States: Frequency and structure differences by cyclogenesis region. Int. J. Climatol. 2015, 35, 3798–3811. [Google Scholar] [CrossRef]
- Ferreira, R.N.; Hall, L.; Rickenbach, T.M. A Climatology of the Structure, Evolution, and Propagation of Midlatitude Cyclones in the Southeast United States. J. Climate 2013, 26, 8406–8421. [Google Scholar] [CrossRef]
- Henderson, K.G.; Vega, A.J. Regional precipitation variability in the southern United States. Null 1996, 17, 93–112. [Google Scholar] [CrossRef]
- Li, L.; Li, W.; Kushnir, Y. Variation of the North Atlantic subtropical high western ridge and its implication to Southeastern US summer precipitation. Clim. Dyn. 2012, 39, 1401–1412. [Google Scholar] [CrossRef]
- Nieto Ferreira, R.; Rickenbach, T.M. Effects of the North Atlantic Subtropical High on summertime precipitation organization in the southeast United States. Int. J. Climatol. 2020. [Google Scholar] [CrossRef]
- Zhu, J.; Liang, X. Impacts of the Bermuda High on Regional Climate and Ozone over the United States. J. Clim. 2013, 26, 1018–1032. [Google Scholar] [CrossRef]
- Catto, J.L.; Jakob, C.; Berry, G.; Nicholls, N. Relating global precipitation to atmospheric fronts. Geophys. Res. Lett. 2012, 39. [Google Scholar] [CrossRef]
- Koch, P.; Wernli, H.; Davies, H.C. An event-based jet-stream climatology and typology. Int. J. Climatol. 2006, 26, 283–301. [Google Scholar] [CrossRef]
- Thorncroft, C.D.; Hoskins, B.J.; McIntyre, M.E. Two paradigms of baroclinic-wave life-cycle behaviour. Q. J. R. Meteorol. Soc. 1993, 119, 17–55. [Google Scholar] [CrossRef]
- Postel, G.A.; Hitchman, M.H. A Climatology of Rossby Wave Breaking along the Subtropical Tropopause. J. Atmos. Sci. 1999, 56, 359–373. [Google Scholar] [CrossRef]
- Zavadoff, B.L.; Kirtman, B.P. North Atlantic Summertime Anticyclonic Rossby Wave Breaking: Climatology, Impacts, and Connections to the Pacific Decadal Oscillation. J. Clim. 2019, 32, 485–500. [Google Scholar] [CrossRef]
- Abatzoglou, J.T. Contribution of Cutoff Lows to Precipitation across the United States. J. Appl. Meteor. Climatol. 2016, 55, 893–899. [Google Scholar] [CrossRef]
- Nieto-Ferreira, R.; Rickenbach, T.M.; Wright, E.A. The role of cold fronts in the onset of the monsoon season in the South Atlantic convergence zone. Q. J. R. Meteorol. Soc. 2011, 137, 908–922. [Google Scholar] [CrossRef]
- Yihui, D.; Chan, J.C.L. The East Asian summer monsoon: An overview. Meteorol. Atmos. Phys. 2005, 89, 117–142. [Google Scholar] [CrossRef]
- Davis, R.E.; Hayden, B.P.; Gay, D.A.; Phillips, W.L.; Jones, G.V. The North Atlantic Subtropical Anticyclone. J. Clim. 1997, 10, 728–744. [Google Scholar] [CrossRef]
- Bishop, D.A.; Williams, A.P.; Seager, R.; Fiore, A.M.; Cook, B.I.; Mankin, J.S.; Singh, D.; Smerdon, J.E.; Rao, M.P. Investigating the Causes of Increased Twentieth-Century Fall Precipitation over the Southeastern United States. J. Clim. 2019, 32, 575–590. [Google Scholar] [CrossRef]
- Wei, W.; Li, W.; Deng, Y.; Yang, S. Intraseasonal variation of the summer rainfall over the Southeastern United States. Clim. Dyn. 2019, 53, 1171–1183. [Google Scholar] [CrossRef] [PubMed]
- Schmidt, D.F.; Grise, K.M. Impacts of Subtropical Highs on Summertime Precipitation in North America. J. Geophys. Res. Atmos. 2019, 124, 11188–11204. [Google Scholar] [CrossRef]
- Diem, J.E. Synoptic-Scale Controls of Summer Precipitation in the Southeastern United States. J. Clim. 2006, 19, 613–621. [Google Scholar] [CrossRef]
- Mesinger, F.; DiMego, G.; Kalnay, E.; Mitchell, K.; Shafran, P.C.; Ebisuzaki, W.; Jović, D.; Woollen, J.; Rogers, E.; Berbery, E.H.; et al. North American Regional Reanalysis. Bull. Amer. Meteor. Soc. 2006, 87, 343–360. [Google Scholar] [CrossRef]
- Zhang, J.; Howard, K.; Langston, C.; Vasiloff, S.; Kaney, B.; Arthur, A.; Van Cooten, S.; Kelleher, K.; Kitzmiller, D.; Ding, F.; et al. National Mosaic and Multi-Sensor QPE (NMQ) System: Description, Results, and Future Plans. Bull. Amer. Meteor. Soc. 2011, 92, 1321–1338. [Google Scholar] [CrossRef]
- Houze, R.A., Jr. Observed structure of mesoscale convective systems and implications for large-scale heating. Q. J. R. Meteorol. Soc. 1989, 115, 425–461. [Google Scholar] [CrossRef]
- Marengo, J.A.; Liebmann, B.; Kousky, V.E.; Filizola, N.P.; Wainer, I.C. Onset and End of the Rainy Season in the Brazilian Amazon Basin. J. Clim. 2001, 14, 833–852. [Google Scholar] [CrossRef]
- Nieto-Ferreira, R.; Rickenbach, T.M. Regionality of monsoon onset in South America: A three-stage conceptual model. Int. J. Climatol. 2011, 31, 1309–1321. [Google Scholar] [CrossRef]
- Staten, P.W.; Lu, J.; Grise, K.M.; Davis, S.M.; Birner, T. Re-examining tropical expansion. Nat. Clim. Chang. 2018, 8, 768–775. [Google Scholar] [CrossRef]
Publisher’s Note: MDPI stays neutral with regard to jurisdictional claims in published maps and institutional affiliations. |
© 2021 by the authors. Licensee MDPI, Basel, Switzerland. This article is an open access article distributed under the terms and conditions of the Creative Commons Attribution (CC BY) license (http://creativecommons.org/licenses/by/4.0/).