Article

Trends and Variability of Ozone Pollution over the Mountain-Basin Areas in Sichuan Province during 2013–2020: Synoptic Impacts and Formation Regimes

1
Sichuan Academy of Environmental Policy and Planning, Chengdu 610041, China
2
Laboratory for Climate and Ocean-Atmosphere Studies, Department of Atmospheric and Oceanic Sciences, School of Physics, Peking University, Beijing 100871, China
3
State Key Laboratory of Marine Environmental Science, and College of Ocean and Earth Sciences, Xiamen University, Xiamen 361104, China
4
College of Oceanic and Atmospheric Sciences, Ocean University of China, Qingdao 266100, China
5
Xiamen Key Laboratory of Straits Meteorology, Xiamen Meteorological Bureau, Xiamen 361012, China
6
Princeton School of Public and International Affairs, Princeton University, Princeton, NJ 08540, USA
7
Hangzhou AiMa Technologies, Hangzhou 311121, China
8
School of Civil and Environmental Engineering, Georgia Institute of Technology, Atlanta, GA 30332, USA
*
Author to whom correspondence should be addressed.
Atmosphere 2021, 12(12), 1557; https://doi.org/10.3390/atmos12121557
Submission received: 30 October 2021 / Revised: 20 November 2021 / Accepted: 21 November 2021 / Published: 25 November 2021

Abstract

:
Sichuan Province, the most industrialized and populated region in southwestern China, has been experiencing severe ozone pollution in the boreal warm season (April–September). With a surface ozone monitoring network and reanalysis dataset, we find that nearly all cities in Sichuan Province showed positive increasing trends in the warm-season ozone levels. The warm-season daily maximum 8-h average (MDA8) ozone levels increased by 2.0 ppb (4.8%) year−1 as a whole, with slightly larger trends in some sites such as a site in Zigong (5.2 ppb year−1). Seasonally, the monthly ozone level in Sichuan peaks from May to August (varies with year). The predominant warm-season synoptic patterns were objectively identified based on concurrent hourly meteorological fields from ERA5. High-pressure systems promote ozone production and result in high ozone concentrations, due to strong solar radiation as well as hot and dry atmospheric conditions. The increased occurrence of high-pressure patterns probably drives the ozone increase in Sichuan. When ozone pollution is relatively weak (with MDA8 ozone around 170 μg m−3), the air quality standard could be achieved in the short term by a 25% reduction of NOx and VOCs emissions. Strengthened emission control is needed when ozone pollution is more severe. Our study provides implications for effective emission control of ozone pollution in Sichuan.

1. Introduction

Ozone in the troposphere is mainly produced from the complex oxidation of volatile organic compounds (VOCs) with nitrogen oxides (NOx = NO + NO2) in the presence of sunlight. Surface ozone is harmful to human health as it can damage the respiratory and circulatory systems [1,2,3]. In addition, surface ozone can also deteriorate the vegetations, ecosystems, and building materials [4,5,6]. Due to effective reductions in anthropogenic emissions of ozone precursors, surface ozone concentrations began to reduce since the 1990s in the United States and Europe [7,8]. However, observations from the nationwide measurement networks showed that the ozone concentrations in China have been increasing rapidly since 2013. The increasing rate during the time period 2013–2019 is especially high in the North China Plain of 3.3 ppb year−1 in terms of the warm-season mean MDA8 (daily maximum 8-h average) values [9,10]. Regional ozone pollution events occurred frequently in China in recent years [11,12,13,14]. As one of the most industrialized and densely populated regions in southwestern China, Sichuan Province has strong anthropogenic emissions of ozone precursors [9]. Due to the intense emissions, complex terrain, and special meteorological conditions, Sichuan suffered from severe ozone pollutions in recent years [15,16,17,18]. According to the results from air quality prediction, the government of Chengdu (the capital of Sichuan) issued a yellow warning of heavy ozone pollution on 27 July 2021. The yellow warning predicted a severe ozone pollution event on 29 July that it will last for at least three days [19]. The first yellow warning of ozone pollution in China [19] indicated that ozone pollution should draw more attention.
Surface ozone concentrations are influenced by both the emissions of precursors and meteorological conditions. High temperature, low humidity, high solar radiation, and weak diffusion environment are typical weather conditions that are favorable for high ozone concentrations [15,16,20]. Categorizing the weather patterns and accordingly pinpointing the relationship between weather and ozone concentrations can help us better understand the formation of ozone pollution and predict air quality in the future. Many studies explored the influences of weather patterns on air pollution. Studies focus on meteorology conditions with ozone pollutions [16,18,21,22] are relatively less than that with fine particle pollutions [23,24,25,26,27], which started much earlier in China. Zhao and Wang [28] found that winter-time air quality in Hangzhou is not only affected by local anthropogenic emissions, but also the meteorology conditions, which influence transportation of pollutions. Shen et al. [29] used Empirical Orthogonal Functions (EOFs) to reveal the leading weather patterns in the eastern United States over 1980–2012 and defined that the polar jet frequency could be a metric to predict ozone variability in future climate regimes. Kim et al. [22] concluded that synoptic weather and its long-term trends play essential roles in the increased surface ozone concentrations observed in South Korea in recent years. With the Lamb-Jenkinson circulation classification method and linear regression model Liang et al. [21] quantified the relationship between surface ozone concentrations and circulation types in Hangzhou.
Sichuan is characterized by both mountain and basin areas. Located in the east part of Sichuan Province, the Sichuan basin (SCB) is one of the biggest basin areas in China (Figure S1). The west of Sichuan covers part of the eastern Tibetan Plateau. Influenced by the special topography, the meteorological conditions in Sichuan are complex and variable. Untangling the impacts of synoptic patterns on ozone pollution in Sichuan is challengeable but important for revealing the formation mechanisms of ozone pollution. Lu et al. [16] found that the spring ozone concentrations in Chengdu were sensitive to the synoptic patterns in 2015–2019. Ning et al. [30] classified 7 dominant synoptic patterns in the SCB in summer and pointed out that the synoptic patterns with high pressure which tend to increase ozone concentrations in the SCB have occurred more frequently over the past 40 years.
Chemically, the sensitivity of ozone formation to its precursors is nonlinear. When ozone concentrations are limited by NOx concentrations, the ozone formation regime is NOx-limited. The ozone formation regime is identified as VOC-limited (NOx-saturated) when ozone concentration is positively related to VOCs concentrations but negatively related to NOx concentrations. Ozone concentrations in the transition regime are sensitive to both NOx and VOCs concentrations. Previous studies showed that the ozone chemical regime in most industrial cities in China is more likely to be VOC-limited while the rural area is in a NOx-limited or transition regime [13]. Studies also suggested that the formation regime in most areas in Sichuan Province except for Chengdu is NOx-limited [31]. In Chengdu, the ozone formation regime is categorized as VOC-limited for most of the time [32,33]. Effective mitigation of local ozone pollution requires a better understanding of ozone formation to anthropogenic NOx and VOCs emissions.
In this study, we will first characterize the spatial distributions, seasonal variations, and trends of ozone pollution in Sichuan Province during the period 2013–2020. Then, using the principal component analysis in T-mode (PCT) method implemented in a classification software named Cost733class, we classify the predominant synoptic weather patterns in the warm season (April–September, including spring and summer ozone pollution period) over Sichuan during the same period. Accordingly, we investigate the sensitivity of the daily variability of ozone pollution to synoptic patterns. We further use the Community Multiscale Air Quality model with the decoupled direct 3D method (CMAQ-DDM-3D) to derive the typical Empirical Kinetic Modeling Approach (EKMA) ozone isopleths under different emissions control levels and accordingly provide some suggestions on emission control for ozone pollution in Sichuan Province.

2. Materials and Methods

2.1. Surface Ozone Observations and Reanalysis Dataset

Hourly surface ozone concentrations in Sichuan Province from 2014 to 2020 are obtained from the China National Environmental Monitoring Center (CNEMC) network (http://106.37.208.233:20035/, accessed on 10 August 2021). The observation sites in Sichuan increased from 38 in 2014 to 92 in 2020 (Figure S2). We follow Lu et al. [9,34] to apply data quality controls to remove unreliable data outliers and select sites with continuous observations from 2014 to 2020 for trend analysis. Thirty sites in 8 cities including Chengdu, Mianyang, Yibin, Panzhihua, Luzhou, Zigong, Deyang, and Nanchong as shown in Figure S1b are used. We use 12 metrics as introduced in Lu et al. [9] to characterize ozone pollution and its impacts on human health and ecosystems. The 5th percentile, 50th percentile (median), 95th percentile, daytime average (0800–2000 LST, Local Standard Time), nighttime average (2000–0800 LST), daily maximum 1-h average (MDA1), and MDA8 ozone are used to evaluate ozone pollution levels. The total number of days with MDA8 ozone greater than 70 ppb (NDGT70) and the sum of daily MDA8 ozone over 35 ppb (SOMO35) are used to estimate the acute and cumulative health effects of ozone pollution [1]. Ozone damages to vegetations are quantified by the sum of the difference between the hourly mean ozone concentration and 40 ppb for all daylight (AOT40) and the sum of all hourly ozone values during a specified time window weighted by a sigmoidal function (W126) [1].
The near-real-time air pollutant dataset, Tracking Air Pollution in China (TAP, http://tapdata.org.cn/, accessed on 24 June 2021) version2 ozone data, is used in this study. It provides a full-coverage and high-resolution mapping of daily MDA8 ozone in Sichuan at 10 km spatial resolution. TAP combines the information from ground observations, satellite retrieval, model results from the Community Multiscale Air Quality (CMAQ) model, and other ancillary data as introduced by Geng et al. [35] and Xue et al. [36]. The TAP PM2.5 dataset released earlier than the ozone dataset was widely used in PM2.5 research [37,38,39]. The near real-time MDA8 ozone estimates in China since 2013 were released in March 2021.

2.2. Meteorological Data and Weather Classification

ERA5 is the fifth generation reanalysis from the European Center for Medium-Range Weather Forecasts (ECMWF), which provides hourly estimates of variables describing atmospheric, land, and oceanic climate (detailed at: https://www.ecmwf.int/en/forecasts/datasets/reanalysis-datasets/era5, accessed on 19 October 2021). ERA5 has been widely used in studies on synoptic weather classification [28,40,41,42,43]. In this study, we use mean sea level pressure at 0.25° × 0.25° on 1400 LST (usually with the highest ozone pollution during the day [9], Figure S3a) from 1 April to 30 September (warm-season period) of 2013–2020 to classify the predominant synoptic weather patterns in Sichuan. The study area covers Sichuan Province and surrounding areas (95–133° E, 24–37° N). Total cloud cover, surface net solar radiation, 2-m temperature, 2-m relative humidity, 10-m wind field (U and V component), geopotential height at 700 hPa and 500 hPa, and relative vorticity at 700 hPa on 1400 LST are used to characterize the synoptic patterns.
Weather classification methods are usually divided into objective and subjective classifications [16,28,43,44,45]. The subjective classification method requires expert knowledge of meteorology, physics, and geometry, thus the classification results for a region often differ from each other in different studies [46]. The objective method classifies the weather patterns automatically and can be easily replicated. It has been developed gradually with the development of computers [47]. The Principal Component Analysis (PCA) in T-mode (PCT method) implemented in the software Cost733class is used in this study. It is recommended by previous studies as it can well capture the predominant weather patterns over a study domain [48]. The PCT method makes the input meteorological data into a matrix with the grid point values in rows and cases (time dimension) in columns [46]. The matrix is in the form of principal components (PCs), scores, and loadings. Only those PCs with large eigenvalues are used for further analysis because they are expected to contain an interpretable signal. These PCs then must be obliquely rotated to obtain a meaningful classification. Finally, a circulation pattern is classified when the type has the highest loading [49]. Cost733class is a weather classification software that covers various methods and is widely used in researches on weather classification [49,50] (http://cost733class.geo.uni-augsburg.de/cost733class-1.2, accessed on 30 September 2021).

2.3. Numerical Model Description and Simulations

We use the numerical method described in Du et al. [51] to efficiently produce ozone isopleths. This method firstly uses the decoupled direct method in three-dimension (DDM-3D) [52,53] in the CMAQ model [54] to derive the first- and second-order sensitivity coefficients of ozone concentration to NOx and VOCs emissions [55,56]. It then constructs a Reduced Form Model (RFM) [57,58] to calculate the ozone concentrations under a series of NOx and VOCs control scenarios to draw an Empirical Kinetic Modeling Approach (EKMA) curve efficiently. We analyze the EKMA curves for Chengdu, Deyang, Mianyang, Leshan, Neijiang, Suining, Yaan, Ziyang, Meishan, and Guangyuan during 8.11–8.31 in 2019 (when Sichuan suffers a typical ozone pollution event). Accordingly, we give preliminary suggestions for ozone pollution control in Sichuan Province.

3. Results and Discussion

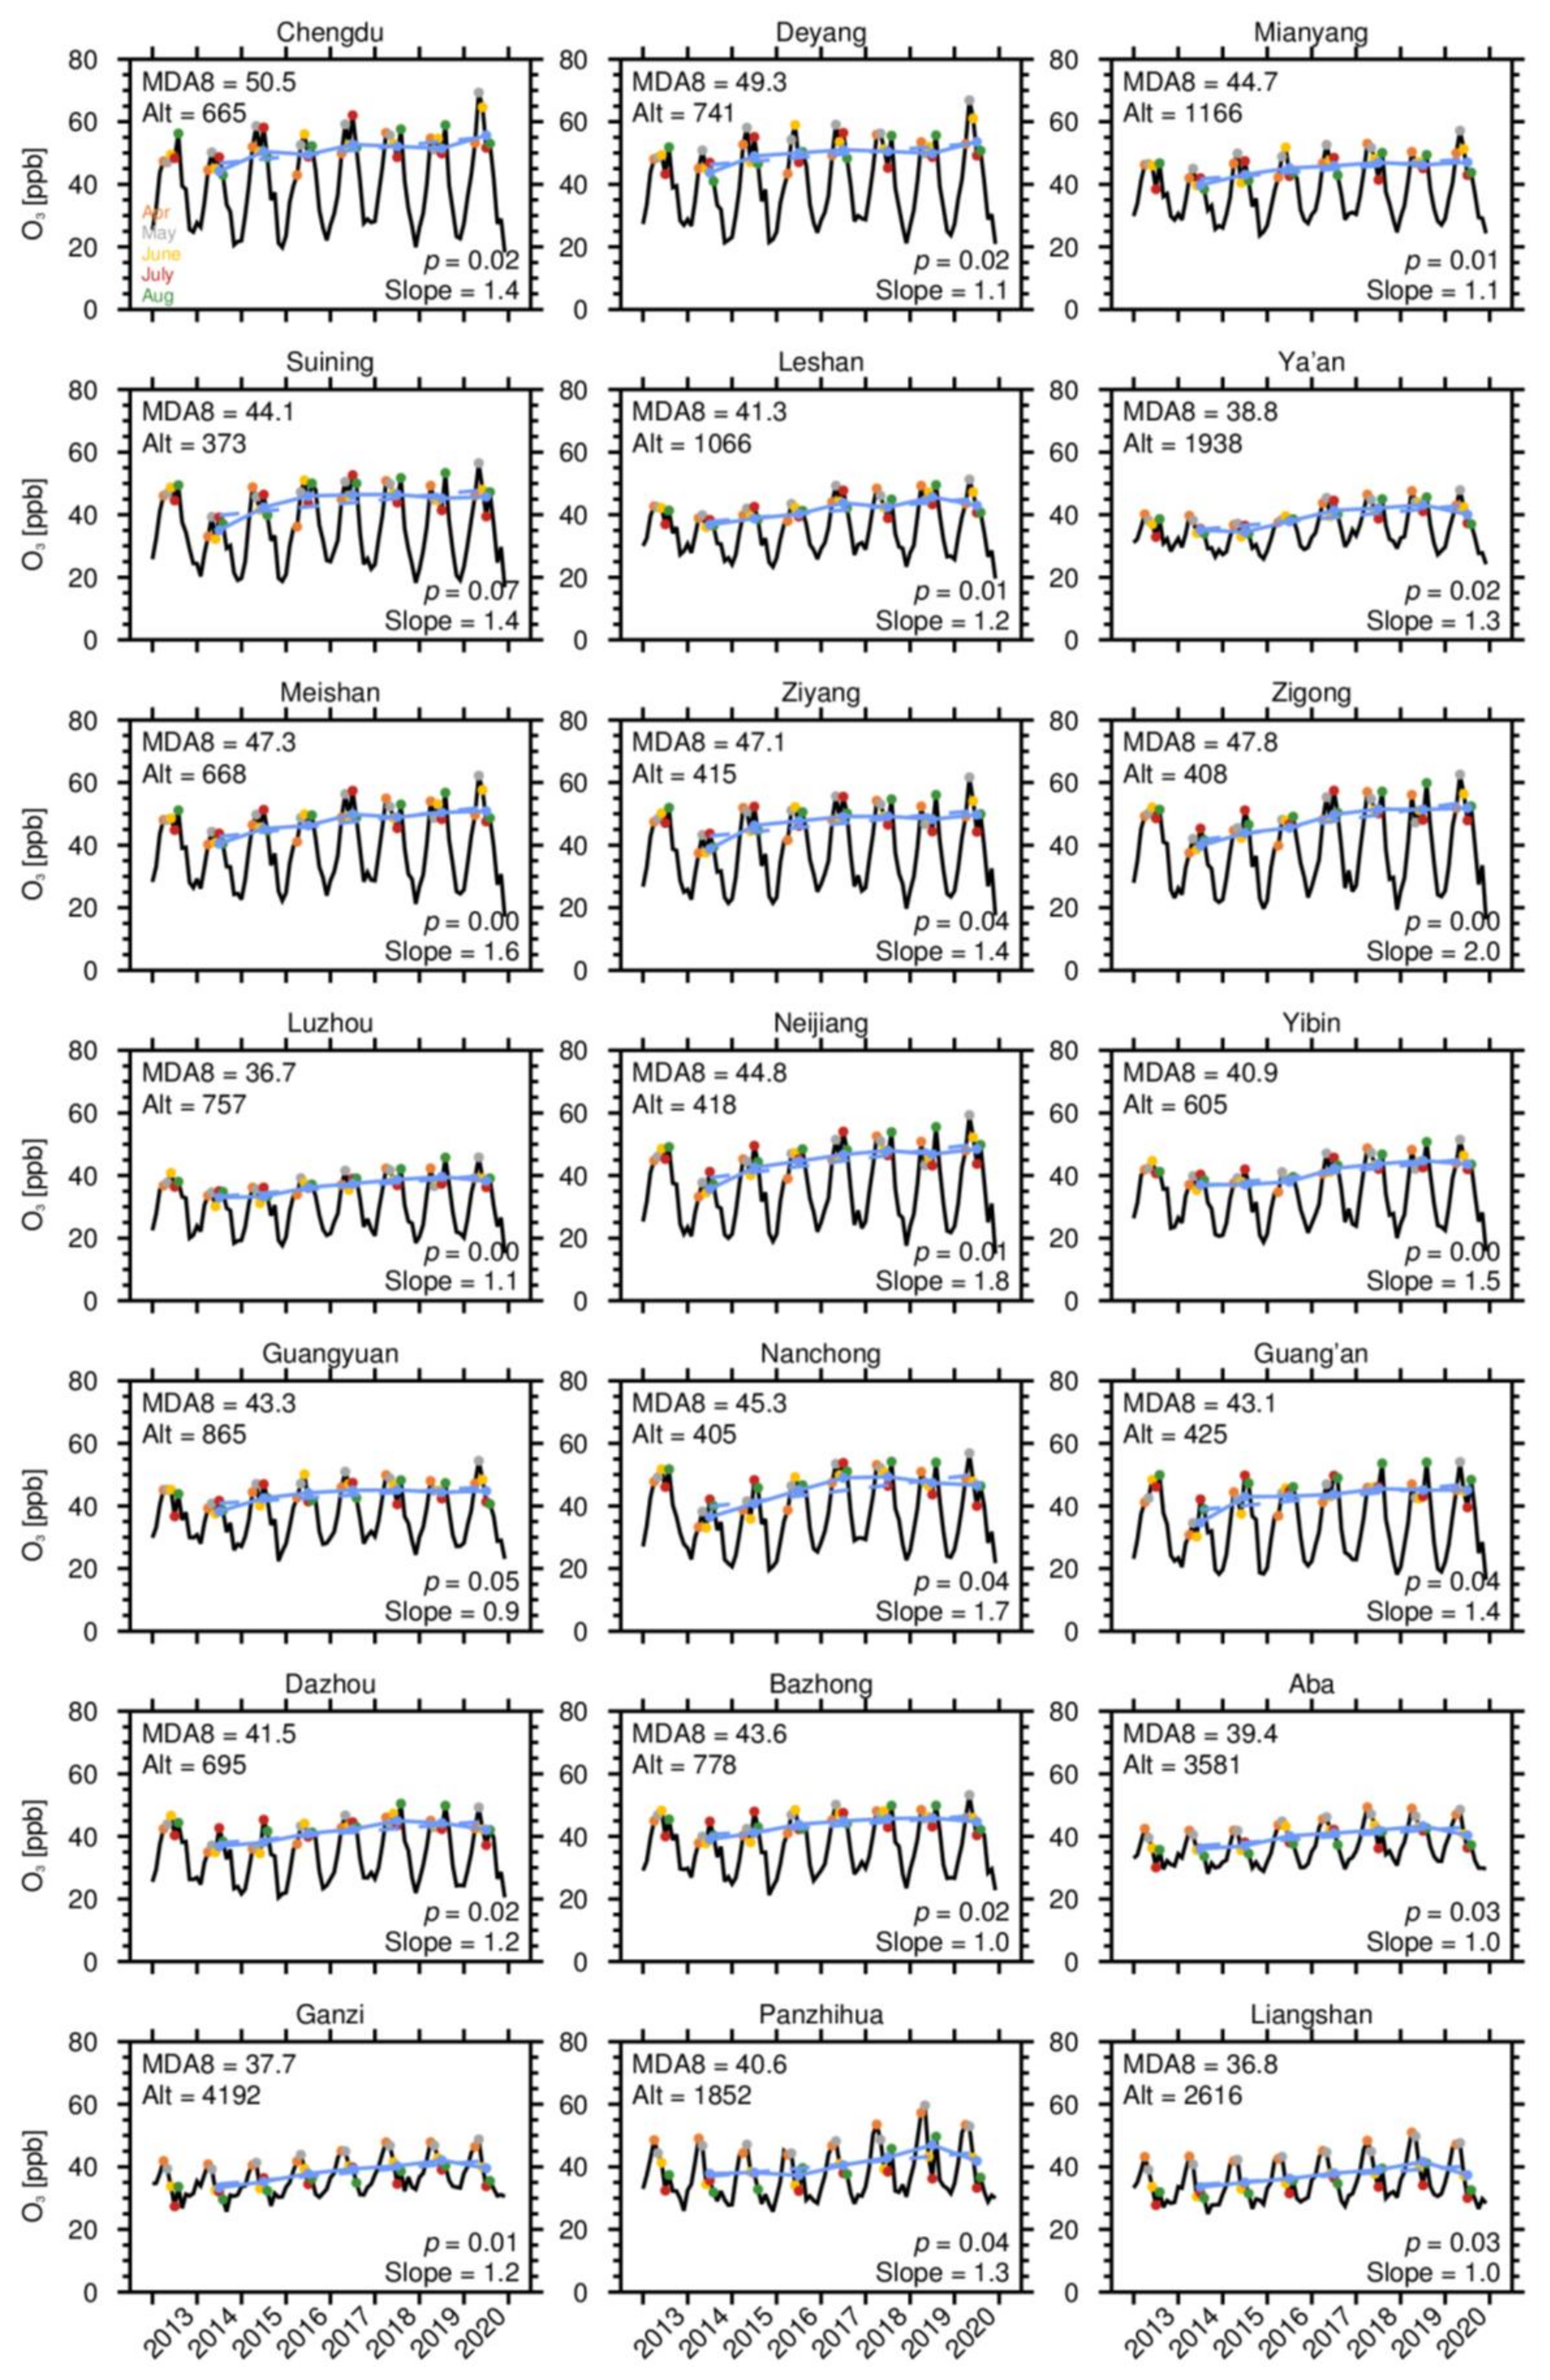
3.1. Seasonal Variations and Trends of Ozone

We analyze the linear trend of the surface ozone in the warm season (April—September) from 2014 to 2020 among the selected 30 sites with continuous observations in Sichuan Province. The locations of these sites are shown in Figure S1b. The warm-season mean MDA8 and MDA1 ozone levels respectively increased by 2.0 (4.8%) and 2.1 (4.2%) ppb year−1 across Sichuan, with more than 96% of sites showing positive trends for warm-season MDA8 ozone. The observation site in Zigong has the largest increasing trend of 5.2 ppb year−1. There are also several sites with an increasing trend over 3 ppb year−1 in Nanchong (4.6 ppb year−1), Chengdu (3.8 ppb year−1), Yibin (3.5 ppb year−1 ), and Panzhihua (3.0 ppb year−1). Figure 1c presents the trend of 8 ozone metrics averaged over 30 sites, which indicates that ozone levels are increased at all selected percentiles. Ozone levels in Sichuan Province increased at 0.3 (7.3%), 1.4 (6.2%), and 2.9 (5.0%) ppb year−1 for the 5th, 50th, and 95th percentiles, respectively (all with p < 0.01), based on a linear trend estimate (Figure 1c). The 95th percentile’s ozone concentration shows the largest positive trend, which indicates severe ozone pollutions occurred more frequently in Sichuan Province than before. The peak of the probability of functions (PDF) shifted to the high ozone concentrations from 2014 to 2020 (Figure S3b) also reflected the increased frequency of severe ozone pollution in Sichuan. Figure 1c also shows a significant positive trend in both daytime (1.8 ppb year−1, p < 0.01) and nighttime (1.1 ppb year−1, p < 0.01) mean ozone levels, which enhance the ozone diurnal contrast in Sichuan Province from 2014 to 2020 (Figure S3a).
Distinct exacerbation of ozone air quality in Sichuan Province imposed adverse impacts on both human health and vegetation. MDA8 and MDA1 metrics have been used for calculating premature death related to ozone exposures [59,60]. Warm-season averaged MDA8 and MDA1 ozone increased at 2.0 (4.8%, p < 0.01) and 2.1 (4.2%, p < 0.01) ppb year−1. NDGT70 and SOMO35 increased at 31.9% year−1 and 12.0% year−1 across Sichuan. These increased ozone metrics indicate the increased premature mortality associated with ozone pollution from 2014 to 2020. We estimated that the warm-season averaged AOT40 and W126 in Sichuan Province respectively increased at 9.4% year−1 and 11.4% year−1, indicating increased damage of vegetations due to ozone pollution (Figure S4).
To glean a comprehensive understanding of ozone concentration changes over Sichuan, we further analyze the MDA8 ozone concentration reanalysis data from TAP. The comparison with observations from CNEMC in Figure S2 shows that the TAP can well capture the spatial and temporal characteristics of warm-season MDA8 ozone in Sichuan (NMB < 8%, NMB = i = 1 N ( R i O i ) / i = 1 N O i , i: site i, Ri: TAP data, Oi: observation, N: number of observation sites). Figure 2 and Figure S2 show the spatial distribution of monthly and warm-season mean MDA8 ozone from 2013 to 2020, respectively. The highest ozone concentrations in Sichuan Province occur around Chengdu, Deyang, Mianyang, Meishan, Ziyang, Zigong, Neijiang, and Nanchong, reflecting the high density of population (Figure S5) and high intensity of anthropogenic emissions.
The TAP reanalysis data consistently show a positive ozone trend with surface observations during 2014–2020. The warm-season MDA8 ozone concentrations over 15 cities (71.4%, Table S1) were the lowest in 2014 during the period and began to increase from 2014 to 2020 (Figure 2). To estimate the increasing trend and be consistent with CNEMC observation data, we calculate the trend from 2014 (instead of 2013) to 2020. Ozone concentrations show a positive trend in almost every city in Sichuan Province since 2014, except for Suining, where the MDA8 ozone increased rapidly from 2014 to 2016 and kept almost unchanged from 2016 to 2020. The increasing trends of MDA8 ozone in the city mean are remarkable in Zigong (2.0 ppb year−1), Neijiang (1.8 ppb year−1), Nanchong (1.7 ppb year−1), and Meishan (1.6 ppb year−1). We also notice that the occurrence time of the seasonal peak of ozone varies from year to year, but mostly in May (32.1%) and August (20.8%). Ozone concentrations in cities located at high altitudes (over 1800 m) tend to peak in May while those cities in the basin tend to peak in August. The conclusions are consistent with Zhao et al. [62], which found the ozone concentrations in Aba, Liangshan, and Panzhihua peak in spring.

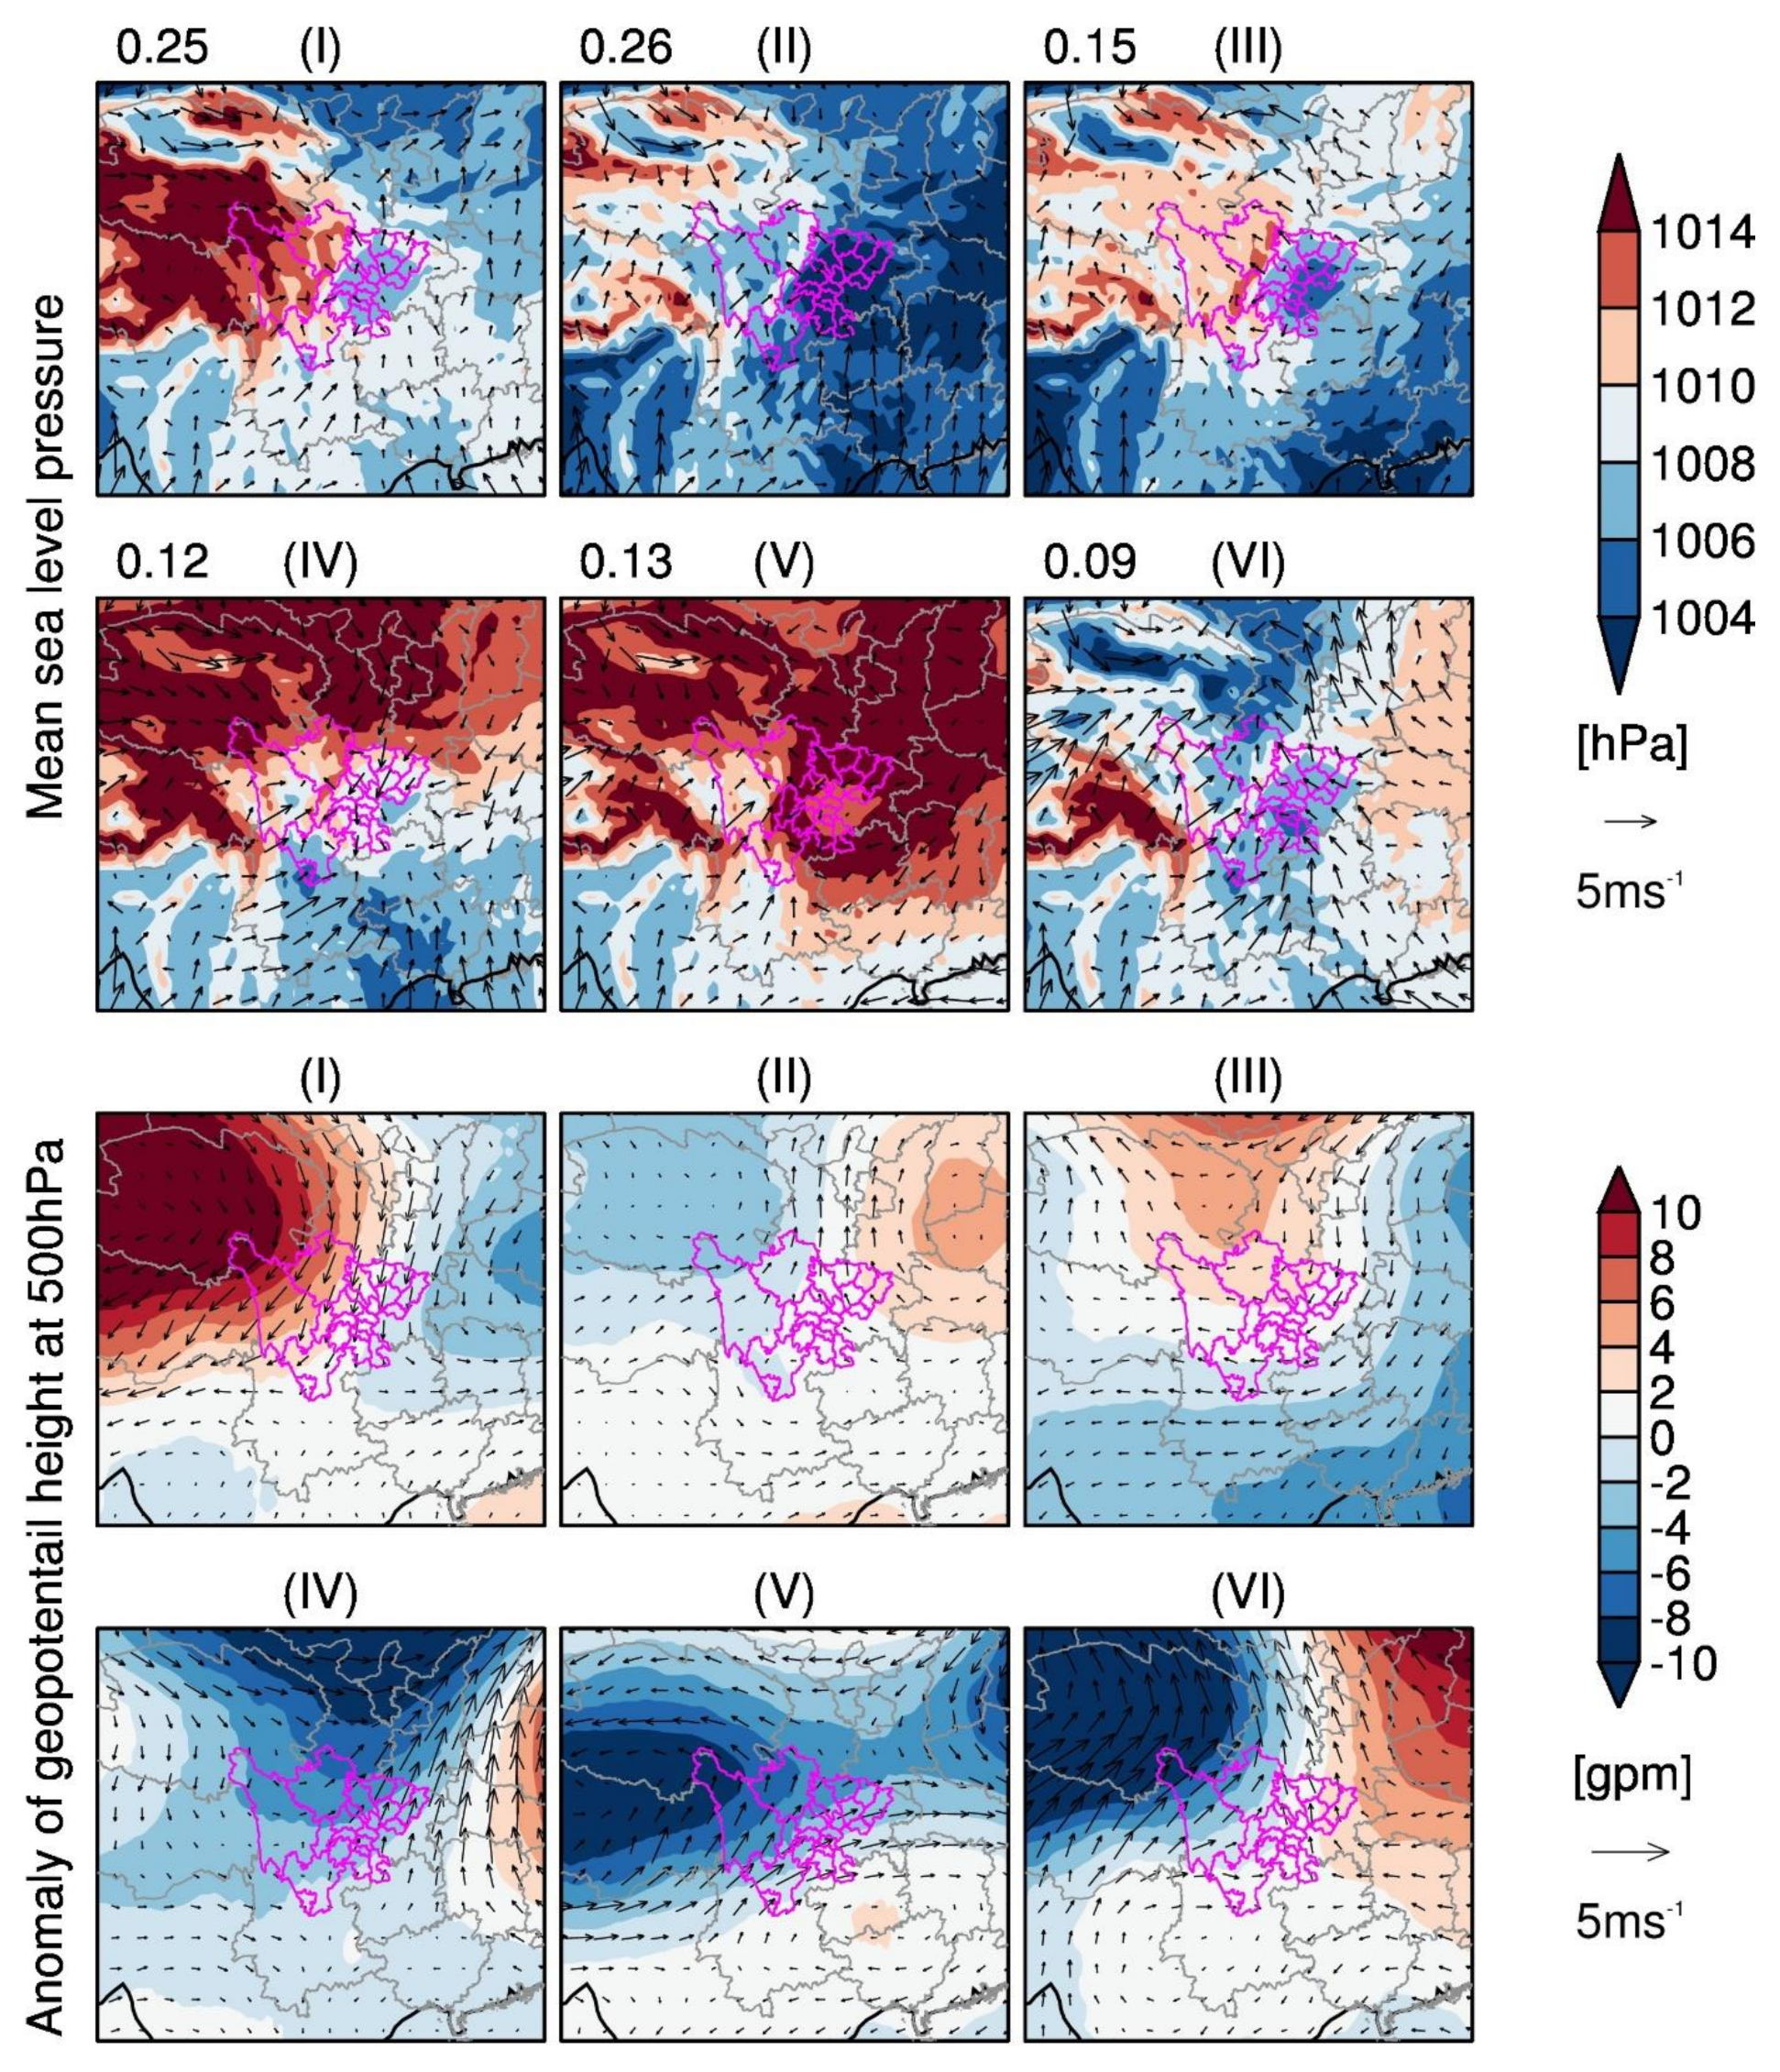
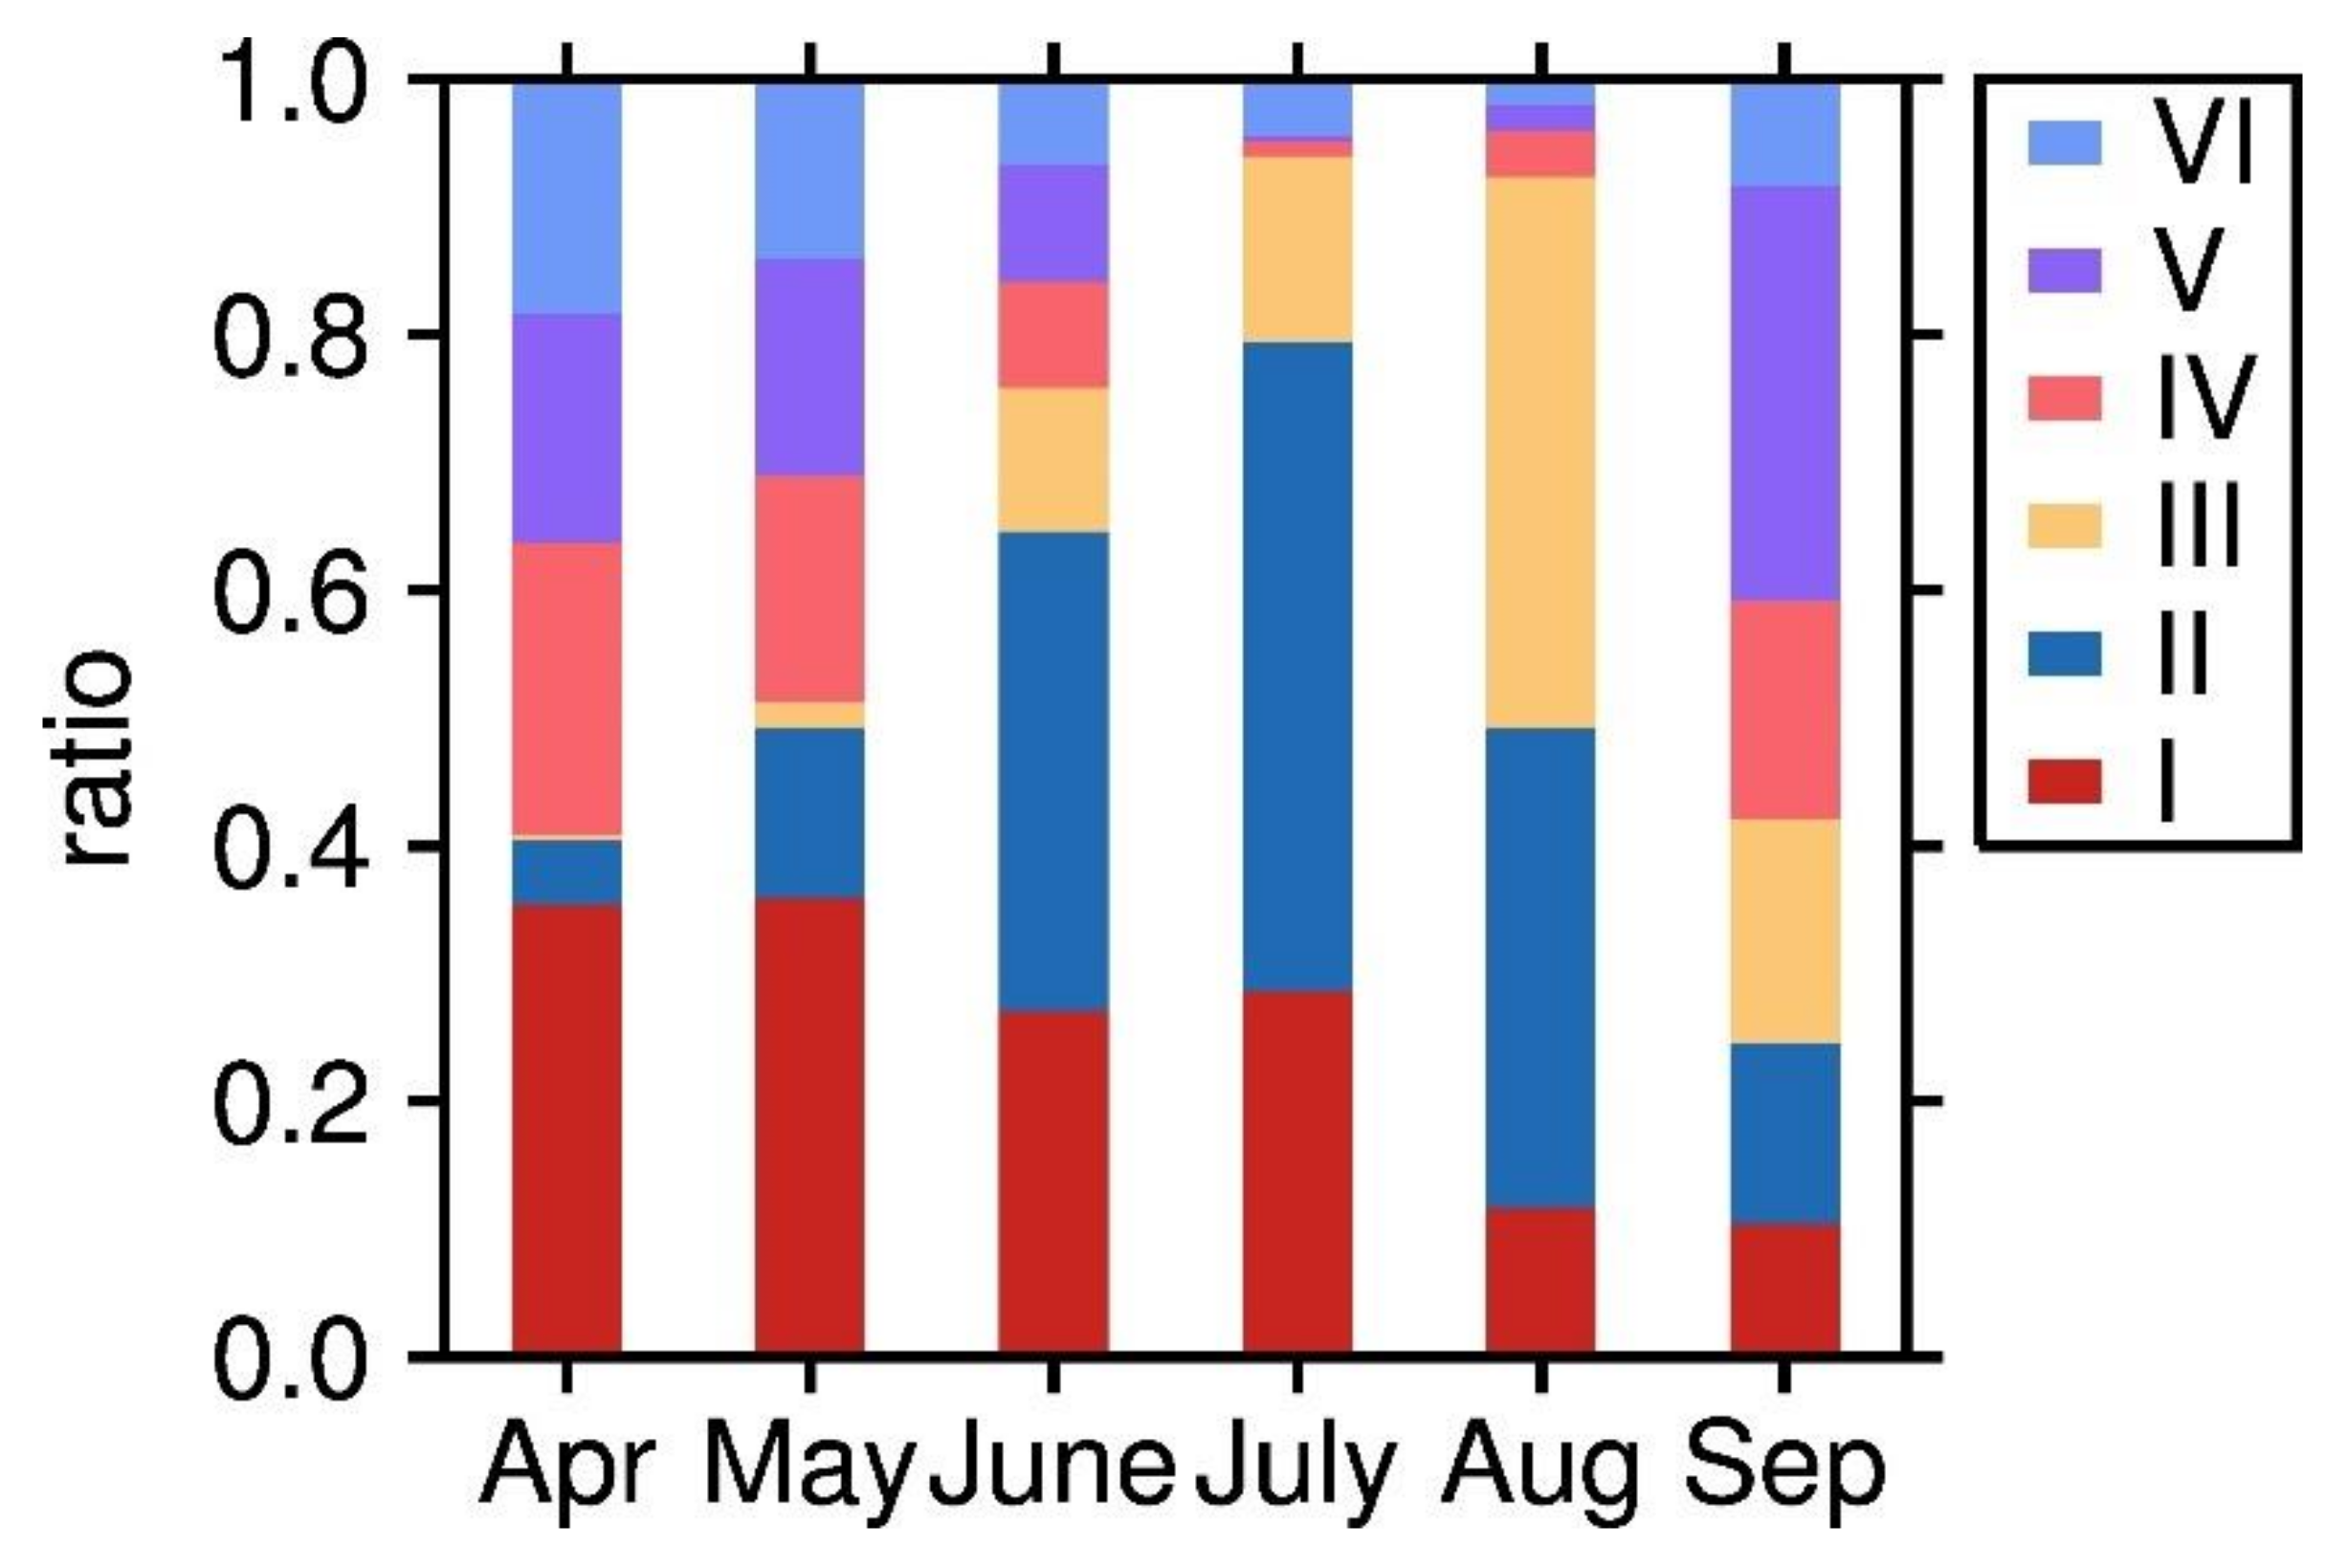
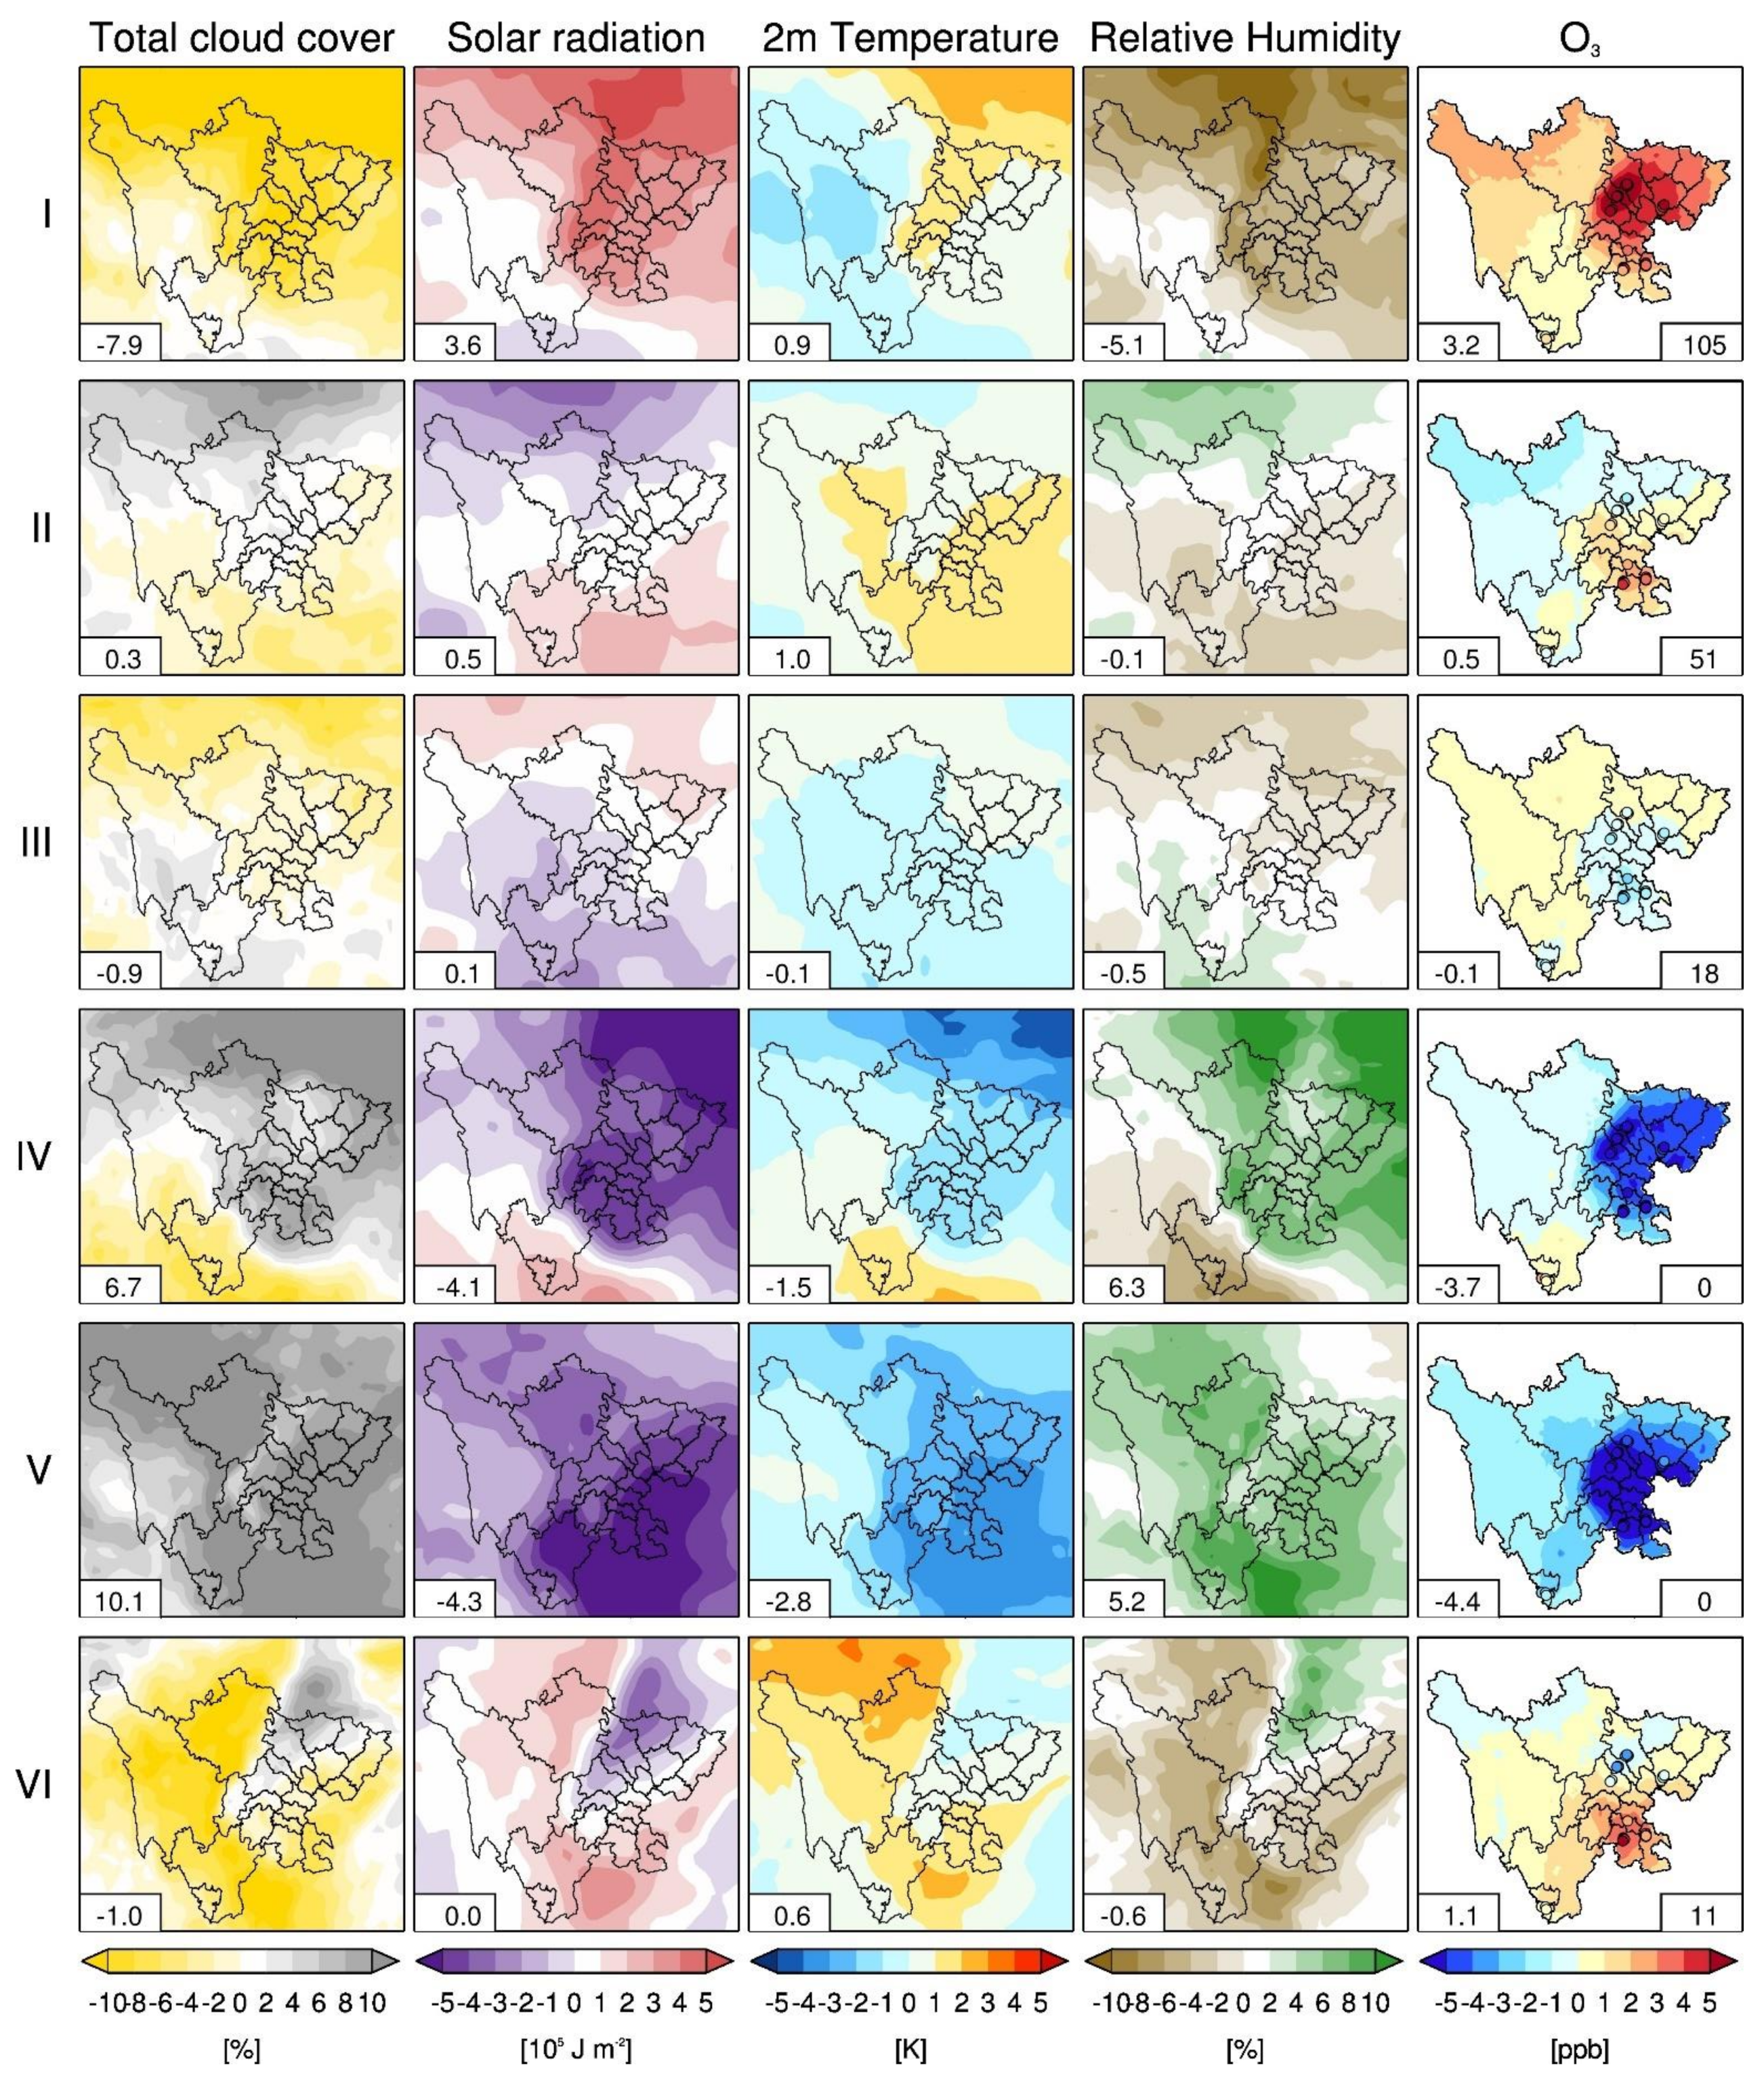
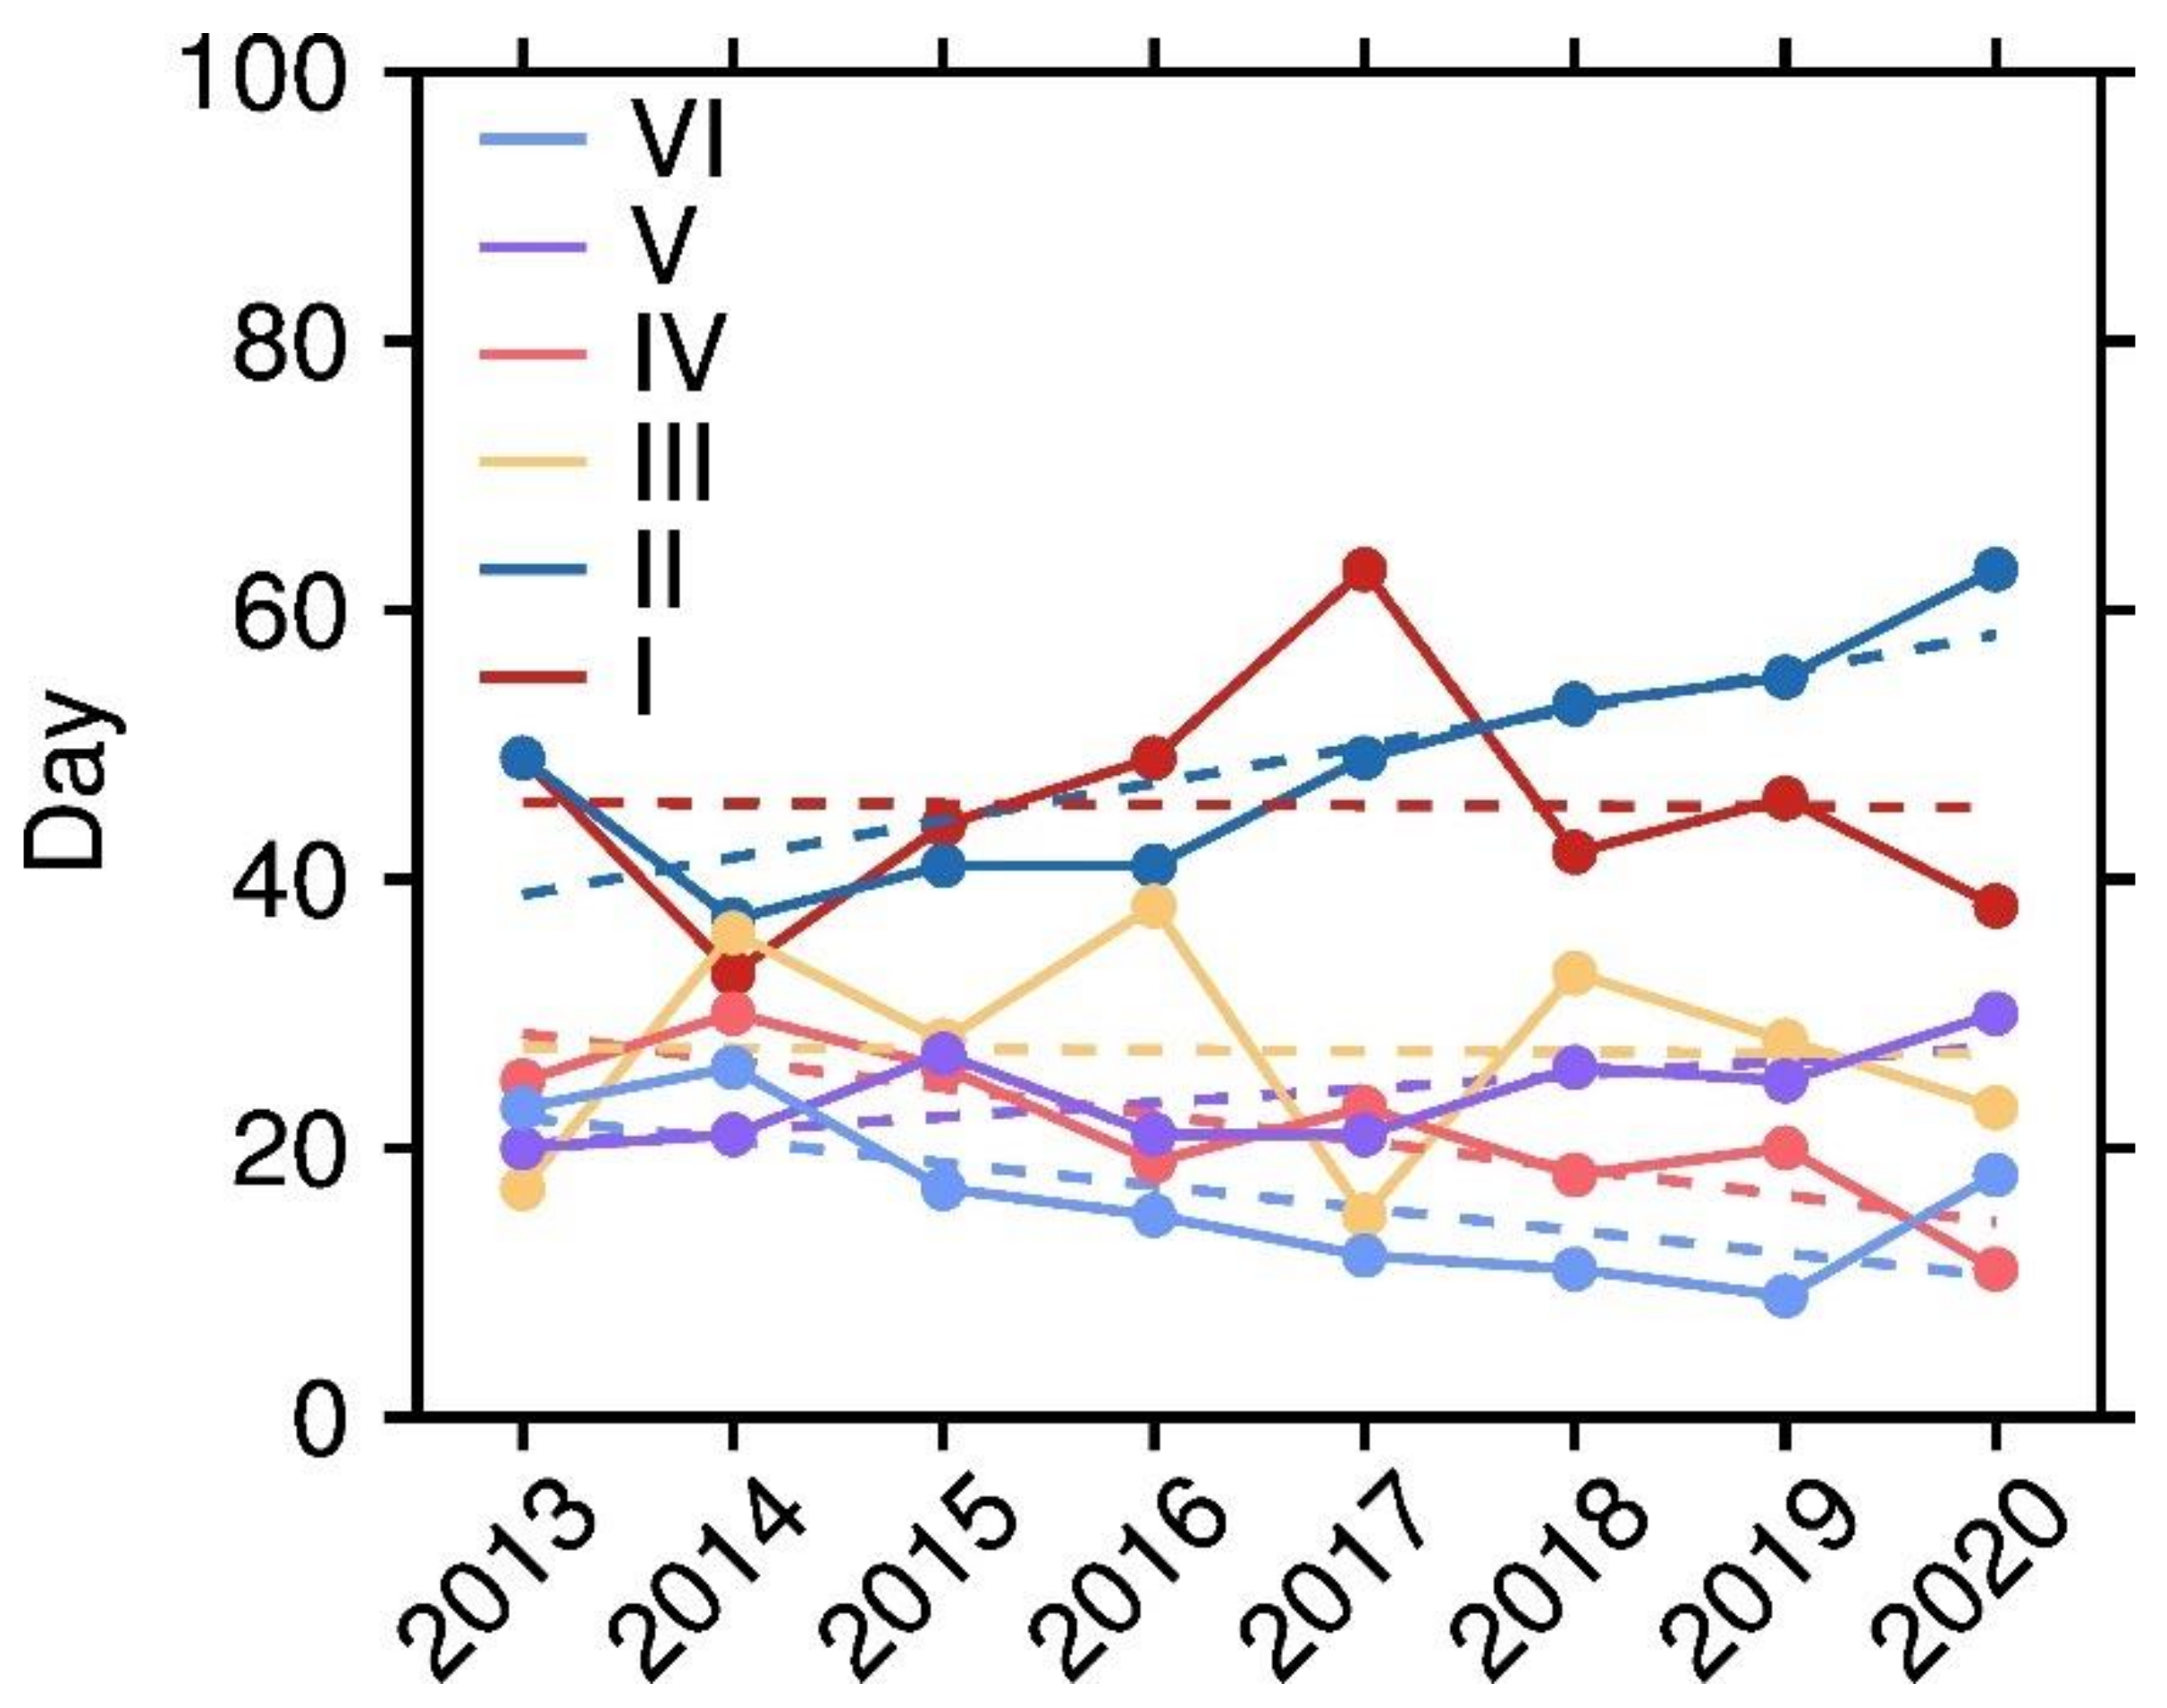
3.2. Synoptic Impacts on Daily Variations of Ozone

We identify six predominant synoptic patterns (Type I–VI) in Sichuan Province in the warm season during the period 2013–2020 based on the mean sea-level pressure (Figure 3). The six synoptic patterns exhibit distinct characteristics in mean sea-level pressure and 10 m wind field. Type I has higher pressure in the southern than the northern direction of SCB, leading to the southerly wind prevailing over SCB. Type II shows a low sea-level pressure located in SCB with the strong southerly wind in southern Sichuan and southeasterly wind in northern Sichuan. Type III is characterized by a weak easterly wind. Type IV has higher sea-level pressure located at northern toward to SCB compared to pressure at southern SCB and is characterized by northerly wind at SCB. Though the sea-level pressure is higher in Type V than other synoptic types, the pressure at SCB is lower than the surroundings. Type V is characterized by northerly wind at southern SCB and easterly wind at northern SCB. There is a low-pressure system in Inner Mongolia and a high-pressure system at the Yellow sea for Type VI (Figure S6). Type VI is characterized by the southeasterly wind. Types I and II occur more frequently than the other synoptic types (Figure 3). Type VI has the lowest occurrence among the six patterns. Type I and type VI occurs mostly in April and May (Figure 4), probably associated with spring ozone pollution in SCB. Type II occurs mostly in June-August, likely leading to ozone pollution in summer.
We calculated daily anomaly with respect to monthly mean to remove the impacts of seasonally varied meteorological conditions and ozone concentrations (Figure 5, mean values of each type are shown in Figure S7). Here, TAP ozone data is used to capture the full spatial and temporal characters of ozone concentrations in Sichuan. According to the spatial distribution of the ozone concentration anomalies in each synoptic type (the rightmost column in Figure 5), we find that Type I, II, and VI are accompanied by ozone pollution with positive anomalies of 3.2, 0.5, and 1.1 ppb, respectively, in MDA8 ozone over the SCB. Type IV and V show negative anomalies of MDA8 ozone in SCB by 3.7 and 4.4 ppb, respectively. In addition, Type III is an intermediate type with few anomalies in meteorology conditions and ozone concentrations compared to the averaged conditions. Therefore, we further divide six synoptic types into ozone pollution type (Type I, Type II, and Type VI), ozone clean type (Type IV, and Type V), and intermediate type (Type III).
Synoptic patterns with high ozone concentrations are often associated with high-pressure systems. There are positive anomalies in geopotential height in SCB for Type I, Type II, and Type VI (Figure 3). There is a ridge system located to the west of SCB in Type I and Type II (Figure S8). Besides, the strong western pacific subtropical high system in Type I and Type II (Figure S8) results in a cloudless environment in SCB [63], where received mean solar radiation exceeds 2.1 MJ m−2 at the surface along with a high surface temperature and low relative humidity. Strong solar radiation, high air temperature, and dry air are favorable conditions for ozone chemical production and emissions of natural ozone precursors including biogenic VOCs and soil NOx [10]. All these conditions lead to positive anomalies of MDA8 ozone in SCB for Type I and Type II by 3.2 and 0.5 ppb, respectively. The relative humidity of Type I is lower than Type II, potentially leading to higher ozone concentration in Type I. In eastern SCB, Type VI shows positive anomalies for geopotential height at 500 hPa level (Figure 3) and negative anomalies in relative vorticity at 700 hPa level (Figure S10), which enhance downward airflow in SCB. Then Type VI shows positive anomalies in surface temperature (0.6 K) and negative anomalies in mean relative humidity (0.6%), which lead to positive anomalies in MDA8 ozone of 1.1 ppb in SCB. On average, the MDA8 ozone increases by over 3 ppb in Yibin, Zigong, Luzhou, and Neijiang in Type VI.
Type IV and V are synoptic types controlled by low-pressure systems. From distributions of the 500 hPa geopotential height, we can observe a trough for both Type IV and Type V in SCB (Figures S8 and S9). Positive anomalies for relative vorticity (Figure S10) and negative anomalies for 500 hPa geopotential height (Figure 3) in SCB can also be observed for Type IV and Type V. Therefore, Type IV and Type V have high cloud cover (over 85%), which suppress surface solar radiation. Compared with Type IV, the positive anomalies of total cloud cover are larger in Type V, resulting in less radiation arriving on the surface in Type V than in Type IV. Cloudy sky in Type IV (Type V) decreases the surface temperature by 1.5 K (2.8 K) and increases relative humidity by 6.3% (5.2%) on the surface. Thus, the meteorology characteristics of synoptic patterns controlled by low-pressure systems are cloudy, cool, and wet, which result in negative anomalies in the MDA8 ozone by 3.7 and 4.4 ppb for Type IV and Type V, respectively. Type III tends to lead to weak changes in meteorological conditions and ozone concentrations.
The occurrence for the six predominant synoptic types in the warm season varies with year (Figure 6 and Figure S11). The occurrence of Type I, which tends to increase spring ozone concentrations, increased by 30 days in the warm season from 2014 to 2017. Meanwhile, the April–May MDA8 ozone in Sichuan increased by 6 ppb during this period. After 2017, decreased occurrence of Type I and increased frequency of Type II kept MDA8 ozone around 52 ppb. The occurrence of ozone pollution type (Type I + Type II + Type VI) increased at 3.1 days year−1 while the occurrence of ozone clean type (Type IV + Type V) decreased at 1.5 days year−1 from 2014 to 2020. The occurrence of Type III decreased at 1.6 days year−1, which increased ozone concentrations in northeastern SCB and decreased ozone concentrations in the rest part of SCB. The warm-season ozone concentrations are positively related to the occurrence of ozone pollution type (r = 0.81) and negatively related to the occurrence of ozone clean type (r = −0.74). Therefore, the warm-season ozone concentrations changes in SCB can be partly explained by the changing of meteorology conditions. Other changes in ozone concentrations are mainly from anthropogenic emissions changes.

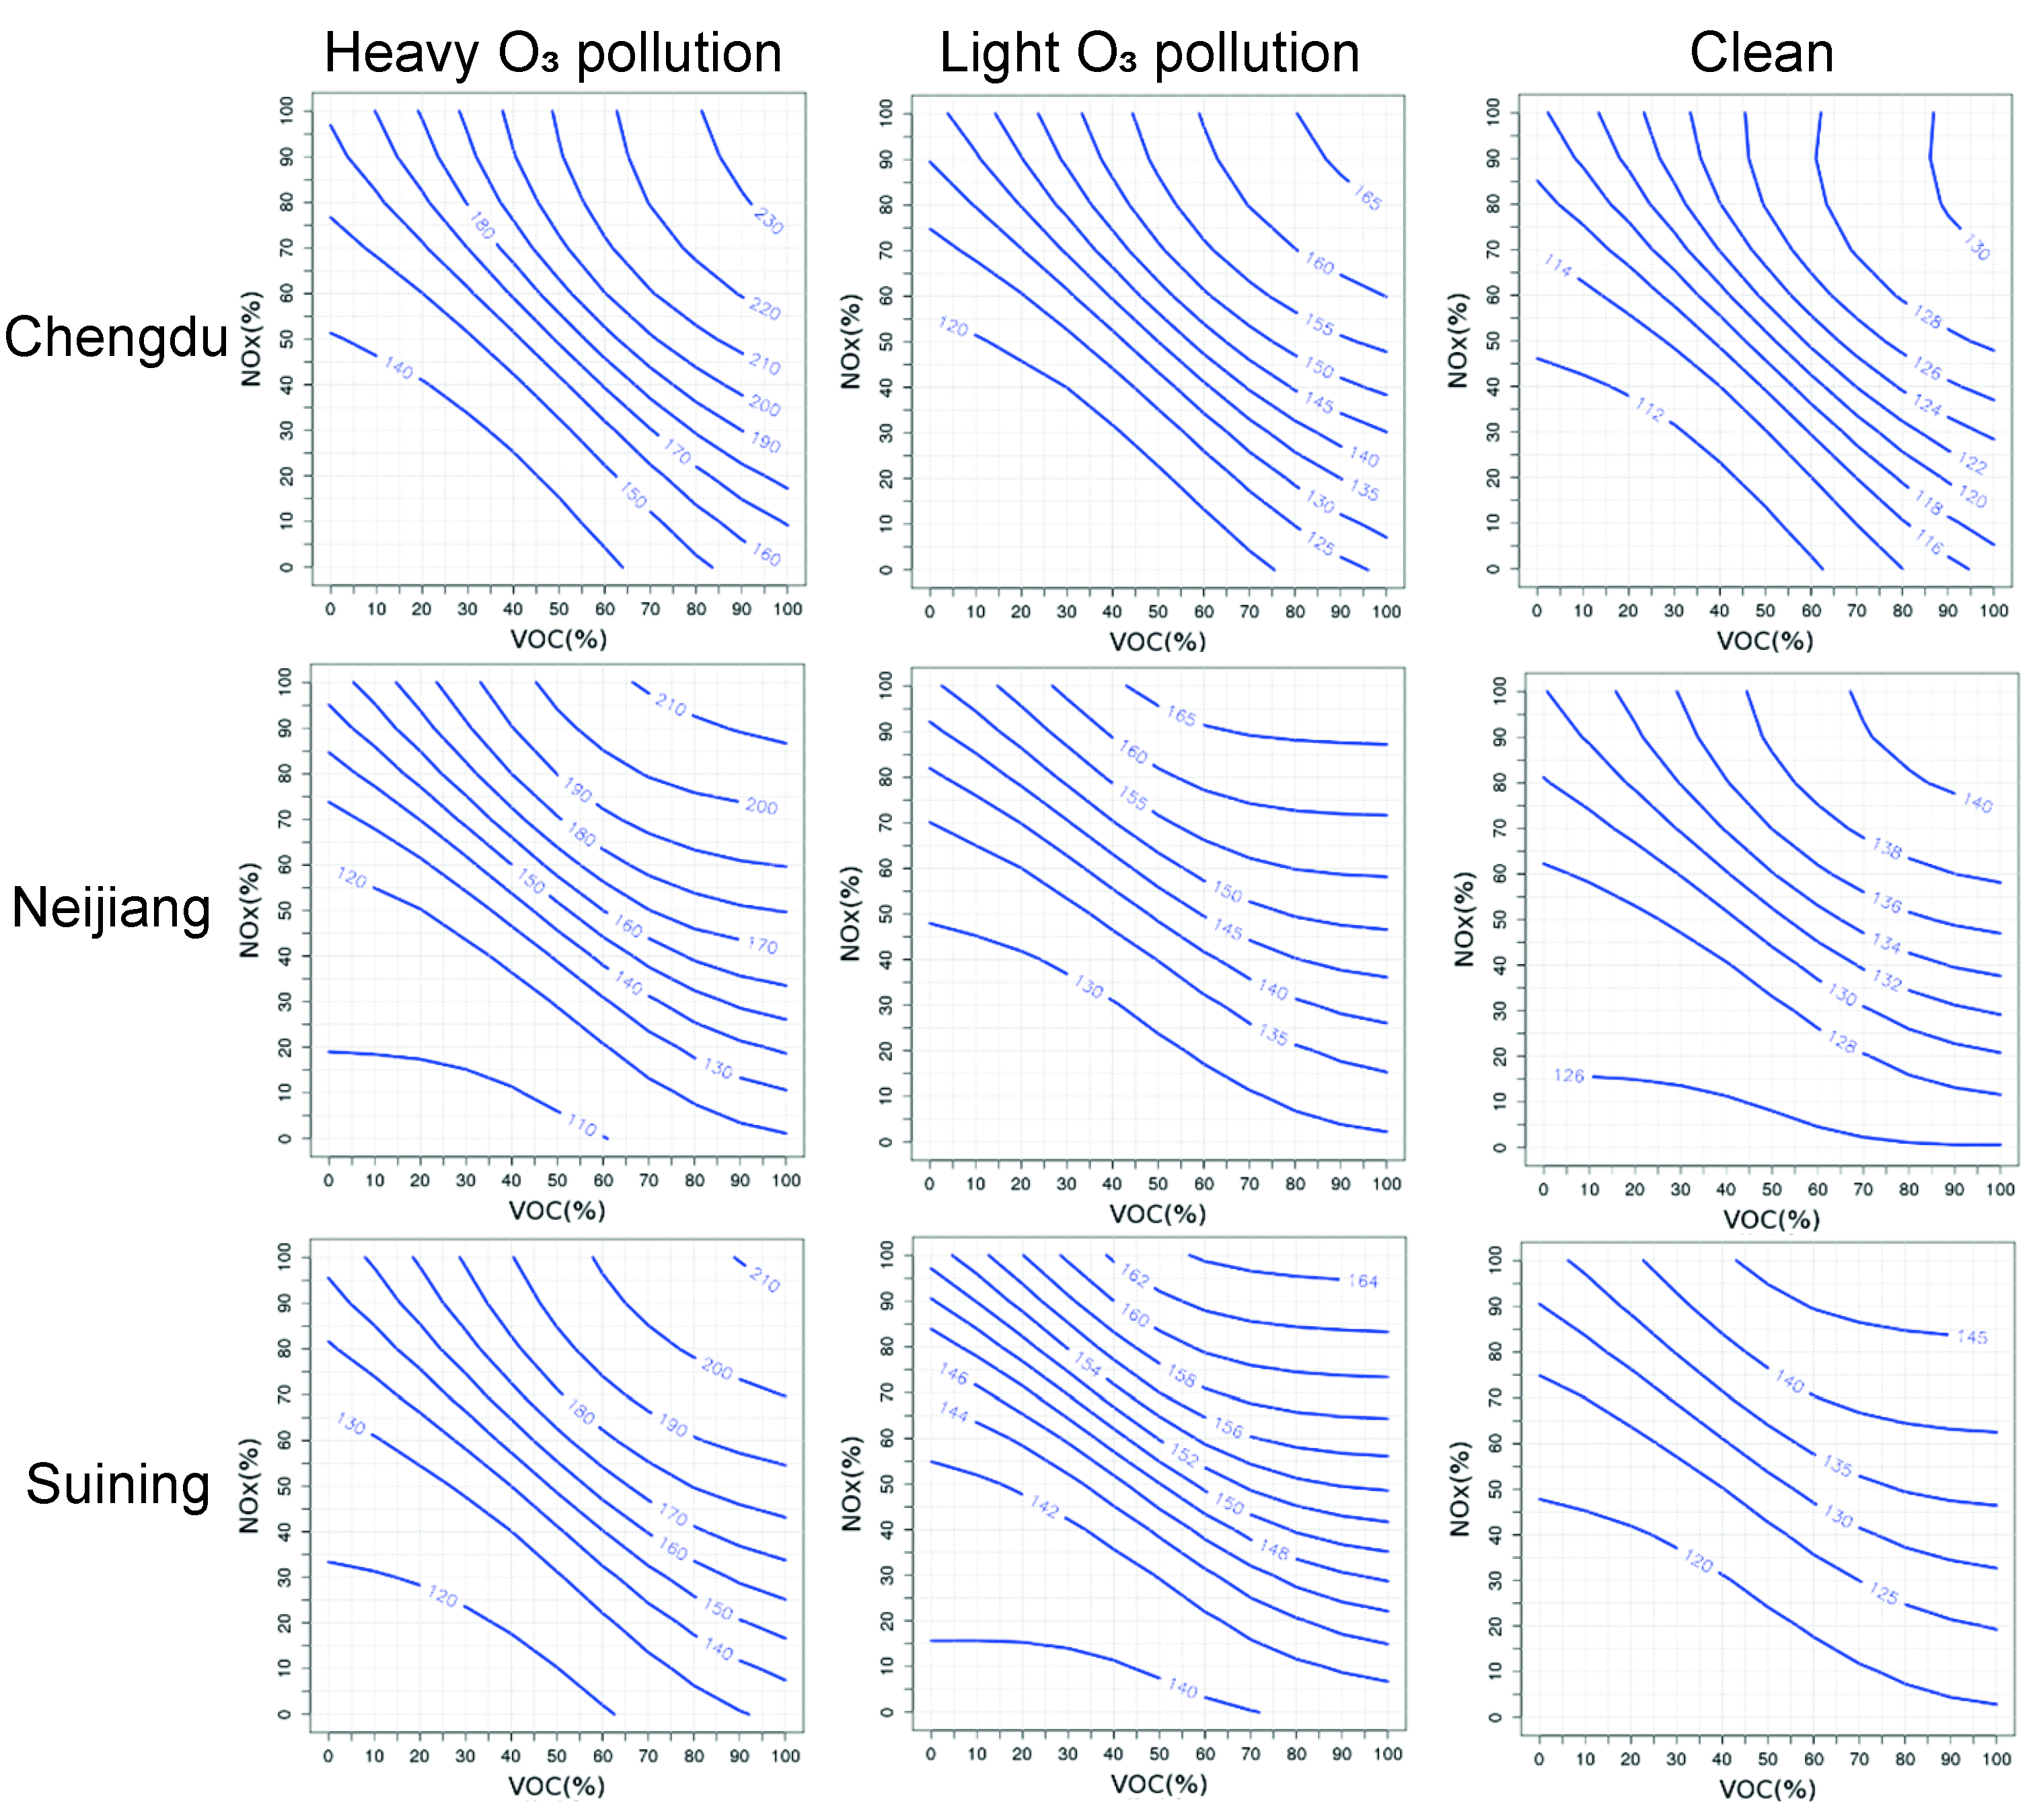
3.3. Formation Regimes of Ozone at Different Pollution Levels

There is a severe ozone pollution event during 11–31 August 2019 in Sichuan Province. Chengdu, Neijiang, and Suining had the most days with ozone pollutions in Sichuan Province during this period. The highest MDA8 ozone occurred in Deyang on 11 August, reached 276 μg m−3. Most ozone pollution days (93.3%) in Chengdu are controlled by Type II and Type III, which occurred in 90.4% of the days during this period. When controlled by Type II (Type III), the city-mean MDA8 ozone over 200 μg m−3 occurred in 85.7% (28.6%) of the days. The Type I weather pattern occurred only one day over this period and caused MDA8 ozone over 180 μg m−3 in Chengdu, Mianyang, and Deyang.
According to EKMA curves, we categorize the ozone formation regime in Sichuan. The MDA8 ozone formation in Chengdu is VOC-limited in less polluted days and transition regime in heavily polluted days. Similar results are presented by Wang et al. [64] in the Beijing-Tianjin-Hebei region. The MDA8 ozone in Neijiang and Suining is NOx-limited. We plot EKMA curves and categorize the MDA8 ozone (as city average) formation regime for 9 cities every day during 11–31 August 2019 as summarized in Table 1. Chengdu fell in VOC-limited (40.9%) and transition regime (31.8%) for the most time, while other cities in Sichuan Province mostly fell in NOx-limited conditions.
We generally derive emissions reduction suggestions of NOx and VOCs to achieve the air quality standard for ozone (160 μg m−3 for MDA8 ozone) by analyzing EKMA curves in Chengdu, Neijiang, and Suining. The ozone levels are divided into heavy ozone pollution (over 200 μg m−3), light ozone pollution (around 170 μg m−3), and clean days (less than 160 μg m−3) (Figure 7). When heavy ozone pollution occurs, a 45–60% reduction of NOx and VOCs emissions is needed to achieve the ozone standard. This large reduction of emissions is not achievable within a few days. To mitigate the ozone pollution in heavy ozone pollution days, we need a more effective way to reduce emissions before ozone pollution occurs. For MDA8 ozone of 160–170 μg m−3 in Chengdu, approximately 25% reductions of NOx and VOCs emissions are needed to achieve the ozone standard. Future work is needed to assess the impact of changes in emissions and meteorological conditions on the effectiveness of emission control.

4. Conclusions

Ozone pollution in Sichuan Province increased substantially during the time period 2013–2020. From surface observations and reanalysis data from TAP, we find high ozone concentration in cities with a high density of population and high anthropogenic emissions including Chengdu, Deyang, Mianyang, Meishan, Ziyang, Zigong, Neijiang, and Nanchong. Ozone concentration in Ganzi, Aba, Liangshan, Panzhihua, and Yaan peak in May, and other 16 cities in Sichuan peak around May to August (varies with year). From 2014 to 2020, warm-season MDA8 ozone increased at 2.0 (4.8%) ppb year−1 on average in Sichuan, with a more apparent increasing trend in Zigong, Nanchong, Chengdu, Yibin, and Panzhihua. Ozone levels for the 5th, 50th, and 95th percentiles increased by 0.3, 1.4, 2.9 ppb year−1, respectively, suggesting a higher frequency of high ozone pollution events. The ozone diurnal contrast becomes larger in Sichuan Province from 2014 to 2020. Increased MDA8, MDA1, NDGT70, SOMO35, AOT40, and W126 indicate the increased negative effects on human health and natural vegetation in Sichuan Province.
Six predominant types of synoptic patterns are divided by the objective PCT method. Type I, II, and VI are controlled by high-pressure systems and favorable to cause ozone pollutions in clear-sky conditions with strong solar radiation, high surface temperature, and dry air. By contrast, Type IV and V are controlled by low-pressure systems with opposite meteorology conditions, which suppress the accumulation of ozone. Changes in mean MDA8 ozone in SCB in the warm season from 2014 to 2020 are associated with the occurrence of the ozone pollution type and ozone clean type, which indicates the crucial role of the meteorology conditions in ozone pollution over Sichuan Province.
We further categorize the MDA8 ozone formation regime and assess the emission control strategy to reduce ozone pollution over Sichuan Province by estimating the EKMA curves in different ozone pollution levels. Chengdu is mostly in transition and VOC-limited regimes while other cities in Sichuan Province are mostly in NOx-limited regimes. By dividing the EKMA curves into heavy ozone pollution (with MDA8 ozone over 200 μg m−3), light ozone pollution (with MDA8 ozone around 170 μg m−3), and clean (with MDA8 ozone less than 160 μg m−3) type we estimate that around 45–60% and 25% NOx and VOCs emissions reduction should be enforced to avoid heavy and light ozone pollution events, respectively.

Supplementary Materials

The following are available online at https://www.mdpi.com/article/10.3390/atmos12121557/s1, Figure S1: (a) Geographical map of China, the location of Sichuan Province and surroundings. (b) The warm-season mean MDA8 in Sichuan . Figure S2: Comparison of observations and reanalysis warm-season ozone MDA8 in Sichuan province from 2013 to 2020. Figure S3: (a) Ozone diurnal cycles and (b) probability density functions (PDF) of daily MDA8 ozone in warm-season from 2014–2020 at 30 sites in Sichuan province. Figure S4: Warm-season averaged trend from 2014–2020 in Sichuan province in percentage (% per year) for 12 ozone metrics. Figure S5: The population density in Sichuan province in 2020. Figure S6: Classified 6 types of synoptic patterns of mean sea level pressure (contour) and 10 m wind field (vector) in the warm season in China from 2013 to 2020 by PCT. Figure S7: Classified 6 types of synoptic patterns of surface downward solar radiation, 2-meter temperature, 2-meter relative humidity, and mean ozone MDA8 from TAP in warm-season over 2013–2020. Figure S8: Classified 6 types of synoptic patterns of the 500 hPa geopotential height (contour) and wind (vector) over China and surrounding areas. Figure S9: Classified 6 types of synoptic patterns of the 700 hPa geopotential height (contour) and wind (vector) over China and surrounding areas. Figure S10: Classified 6 types of synoptic patterns of the 700 hPa vorticity (relative) anomaly over Sichuan province. Figure S11: The ratio of classified synoptic patterns in the warm season in SCB from 2013 to 2020. Table S1: The annual and warm-season mean MDA8 ozone and its trends in each city over Sichuan during 2014–2020 [65].

Author Contributions

Conceptualization, Y.C.; methodology, Y.C., B.L. and R.H.; software, R.H., Y.C. and Y.H. (Yipeng Huang); validation, M.Z. (Murong Zhang) and Y.H. (Yipeng Huang); formal analysis, Y.C., H.H. and M.Z. (Murong Zhang); investigation, C.W. and G.H.; resources, Y.C. and G.H.; data curation, Y.C.; writing—original draft preparation, Y.C.; writing—review and editing, Y.C., H.H., M.Z. (Murong Zhang), M.Z. (Mi Zhou), Y.Z., Y.H. (Yongtao Hu) and Y.H. (Yipeng Huang); visualization, Y.C.; supervision, Y.C., B.L. and Y.H. (Yipeng Huang); funding acquisition, B.L., Y.H. (Yipeng Huang) and Y.C. All authors have read and agreed to the published version of the manuscript.

Funding

This work is funded by the National Key R&D Program of China (2018YFC0214000), National Natural Science Foundation of China (grant 41905049).

Data Availability Statement

All data that support the findings of this study are available from the corresponding author on reasonable request.

Acknowledgments

We thank the Ministry of Environmental Protection of the People’s Republic of China for providing the O3 surface concentrations from the China National Environmental Monitoring Center (CNEMC) Network (http://106.37.208.233:20035/). Murong Zhang is sponsored by the MEL Outstanding Postdoctoral Scholarship from Xiamen University.

Conflicts of Interest

The authors declare no conflict of interest.

References

  1. Lefohn, A.S.; Malley, C.S.; Smith, L.; Wells, B.; Hazucha, M.; Simon, H.; Naik, V.; Mills, G.; Schultz, M.G.; Paoletti, E.; et al. Tropospheric ozone assessment report: Global ozone metrics for climate change, human health, and crop/ecosystem research. Elem. Sci. Anthr. 2018, 6, 1. [Google Scholar] [CrossRef] [PubMed] [Green Version]
  2. Berman, J.D.; Fann, N.; Hollingsworth, J.W.; Pinkerton, K.E.; Rom, W.N.; Szema, A.M.; Breysse, P.N.; White, R.H.; Curriero, F.C. Health benefits from large-scale ozone reduction in the United States. Environ. Health Perspect. 2012, 120, 1404–1410. [Google Scholar] [CrossRef]
  3. Malley, C.S.; Henze, D.K.; Kuylenstierna, J.C.I.; Vallack, H.W.; Davila, Y.; Anenberg, S.C.; Turner, M.C.; Ashmore, M.R. Updated global estimates of respiratory mortality in adults ≥30 years of age attributable to long-term ozone exposure. Environ. Health Perspect. 2017, 125, 087021. [Google Scholar] [CrossRef] [Green Version]
  4. Avnery, S.; Mauzerall, D.L.; Liu, J.; Horowitz, L.W. Global crop yield reductions due to surface ozone exposure: 2. Year 2030 potential crop production losses and economic damage under two scenarios of O3 pollution. Atmos. Environ. 2011, 45, 2297–2309. [Google Scholar] [CrossRef]
  5. Yue, X.; Unger, N.; Harper, K.; Xia, X.; Liao, H.; Zhu, T.; Xiao, J.; Feng, Z.; Li, J. Ozone and haze pollution weakens net primary productivity in China. Atmos. Chem. Phys. 2017, 17, 6073–6089. [Google Scholar] [CrossRef] [Green Version]
  6. Massey, S.W. The effects of ozone and NOx on the deterioration of calcareous stone. Sci. Total. Environ. 1999, 227, 109–121. [Google Scholar] [CrossRef]
  7. Cooper, O.R.; Gao, R.-S.; Tarasick, D.; Leblanc, T.; Sweeney, C. Long-term ozone trends at rural ozone monitoring sites across the United States, 1990-2010. J. Geophys. Res. Atmos. 2012, 117, 117. [Google Scholar] [CrossRef]
  8. Chang, K.-L.; Petropavlovskikh, I.; Cooper, O.R.; Schultz, M.G.; Wang, T.; Helmig, D.; Lewis, A. Regional trend analysis of surface ozone observations from monitoring networks in eastern North America, Europe and East Asia. Elem. Sci. Anthr. 2017, 5, 5. [Google Scholar] [CrossRef] [Green Version]
  9. Lu, X.; Zhang, L.; Wang, X.; Gao, M.; Li, K.; Zhang, Y.; Yue, X.; Zhang, Y. Rapid increases in warm-season surface ozone and resulting health impact in China Since 2013. Environ. Sci. Technol. Lett. 2020, 7, 240–247. [Google Scholar] [CrossRef]
  10. Lu, X.; Zhang, L.; Chen, Y.; Zhou, M.; Zheng, B.; Li, K.; Liu, Y.; Lin, J.; Fu, T.-M.; Zhang, Q. Exploring 2016–2017 surface ozone pollution over China: Source contributions and meteorological influences. Atmos. Chem. Phys. 2019, 19, 8339–8361. [Google Scholar] [CrossRef] [Green Version]
  11. Zhao, Q.; Bi, J.; Liu, Q.; Ling, Z.; Shen, G.; Chen, F.; Qiao, Y.; Li, C.; Ma, Z. Sources of volatile organic compounds and policy implications for regional ozone pollution control in an urban location of Nanjing, East China. Atmos. Chem. Phys. 2020, 20, 3905–3919. [Google Scholar] [CrossRef] [Green Version]
  12. Li, K.; Jacob, D.J.; Liao, H.; Shen, L.; Zhang, Q.; Bates, K.H. Anthropogenic drivers of 2013-2017 trends in summer surface ozone in China. Proc. Natl. Acad. Sci. USA 2019, 116, 422–427. [Google Scholar] [CrossRef] [Green Version]
  13. Wang, T.; Xue, L.; Brimblecombe, P.; Lam, Y.F.; Li, L.; Zhang, L. Ozone pollution in China: A review of concentrations, meteorological influences, chemical precursors, and effects. Sci. Total. Environ. 2017, 575, 1582–1596. [Google Scholar] [CrossRef]
  14. Lu, X.; Ye, X.; Zhou, M.; Zhao, Y.; Weng, H.; Kong, H.; Li, K.; Gao, M.; Zheng, B.; Lin, J.; et al. The underappreciated role of agricultural soil nitrogen oxide emissions in ozone pollution regulation in North China. Nat. Commun. 2021, 12, 5021. [Google Scholar] [CrossRef] [PubMed]
  15. Yang, X.; Wu, K.; Wang, H.; Liu, Y.; Gu, S.; Lu, Y.; Zhang, X.; Hu, Y.; Ou, Y.; Wang, S.; et al. Summertime ozone pollution in Sichuan Basin, China: Meteorological conditions, sources and process analysis. Atmos. Environ. 2020, 226, 117392. [Google Scholar] [CrossRef]
  16. Lu, N.; Zhang, X.; Kang, P.; Hua, M.; Du, Y.; Chen, J.; Xiang, W.; Lei, Y.; Ou, Y. Objective weather classification and typical process analysis of ozone polltion during spring in Chengdu Plain urban agglomeration. Acta Sci. Circumstantiae 2021, 41, 1610–1627. [Google Scholar]
  17. Zhan, C.-C.; Xie, M.; Fang, D.-X.; Wang, T.-J.; Wu, Z.; Lu, H.; Li, M.-M.; Chen, P.-L.; Zhuang, B.-L.; Li, S.; et al. Synoptic weather patterns and their impacts on regional particle pollution in the city cluster of the Sichuan Basin, China. Atmos. Environ. 2019, 208, 34–47. [Google Scholar] [CrossRef]
  18. Wu, K.; Kang, P.; Wang, Z.; Gu, S.; Tie, X.; Zhang, Y.; Wen, X.; Wang, S.; Chen, Y.; Wang, Y.; et al. Ozone temporal variation and its meteorological factors over Chengdu City. Acta Sci. Circumstantiae 2017, 37, 4241–4252. [Google Scholar]
  19. Chengdu Daily, Chengdu Issues First Emergency Plan for Severely Polluted Ozone Weather in China. 2021. Available online: http://www.sc.xinhuanet.com/content/2021-07/07/c_1127630509.htm (accessed on 7 July 2021).
  20. Lu, X.; Zhang, L.; Shen, L. Meteorology and climate influences on tropospheric ozone: A review of natural sources, chemistry, and transport patterns. Curr. Pollut. Rep. 2019, 5, 238–260. [Google Scholar] [CrossRef] [Green Version]
  21. Liang, Z.; Gu, T.; Yang, X.; Du, R.; Zhong, H.; Qi, B. Study on circulation classification based surface ozone concentration prediction model. China Environ. Sci. 2017, 37, 4469–4479. [Google Scholar]
  22. Kim, H.C.; Lee, D.; Ngan, F.; Kim, B.-U.; Kim, S.; Bae, C.; Yoon, J.-H. Synoptic weather and surface ozone concentration in South Korea. Atmos. Environ. 2021, 244, 117985. [Google Scholar] [CrossRef]
  23. Li, P.; Xiao, T. The diffusion and transport of PM2.5 under the polluted weather conditions during autumn and winter seasons in Chengdu. China Environ. Sci. 2020, 40, 63–75. [Google Scholar]
  24. Zhang, Y.; Wang, S.; Ni, C.; Zhang, X.; Jia, X.; Feng, X. Study on an objective synoptic typing method for air pollution weather in Chengdu during winter. Environ. Sci. Technol. 2020, 43, 139–144. [Google Scholar]
  25. Xu, J.; Chang, L.; Ma, J.; Mao, Z.; Chen, L.; Cao, Y. Objective synoptic weather classification on PM2.5 pollution during autumn and winter season in Shanghai. Acta Sci. Circumstantiae 2016, 36, 4303–4314. [Google Scholar]
  26. Zhang, Y.; Wang, S.; Jia, X.; Lian, J.; Zhang, X.; Yang, X. Study on an objective synoptic typing method for air pollution weather in North China during winter half year. Acta Sci. Circumstantiae 2018, 38, 3826–3833. [Google Scholar]
  27. Yang, X.; Zhang, X.; Kang, Y.; Zhang, Y.; Wang, S.; Li, Z.; Li, H. Circulation weather type classification for air pollution over the Beijing-Tianjin-Hebei region during winter. China Environ. Sci. 2017, 37, 3201–3209. [Google Scholar]
  28. Zhao, J.; Wang, C. Objective synoptic weather classification on air pollution during winter seasons in Hangzhou. J. Atmos. Sci. Res. 2021, 4, 4. [Google Scholar] [CrossRef]
  29. Shen, L.; Mickley, L.J.; Tai, A.P.K. Influence of synoptic patterns on surface ozone variability over the eastern United States from 1980 to 2012. Atmos. Chem. Phys. 2015, 15, 10925–10938. [Google Scholar] [CrossRef] [Green Version]
  30. Ning, G.; Yim, S.H.L.; Yang, Y.; Gu, Y.; Dong, G. Modulations of synoptic and climatic changes on ozone pollution and its health risks in mountain-basin areas. Atmos. Environ. 2020, 240, 117808. [Google Scholar] [CrossRef]
  31. Shen, H.; Sun, Z.; Chen, Y.; Russell, A.G.; Hu, Y.; Odman, M.T.; Qian, Y.; Archibald, A.T.; Tao, S. Novel method for ozone isopleth construction and diagnosis for the ozone control strategy of Chinese cities. Environ. Sci. Technol. 2021. [Google Scholar] [CrossRef]
  32. Jin, X.; Holloway, T. Spatial and temporal variability of ozone sensitivity over China observed from the Ozone Monitoring Instrument. J. Geophys. Res. Atmos. 2015, 120, 7229–7246. [Google Scholar] [CrossRef]
  33. Li, Q.; Zhang, L.; Wang, T.; Wang, Z.; Fu, X.; Zhang, Q. “New” reactive nitrogen chemistry reshapes the relationship of ozone to Its precursors. Environ. Sci. Technol. 2018, 52, 2810–2818. [Google Scholar] [CrossRef]
  34. Xue, T.; Zhu, T.; Zheng, Y.; Liu, J.; Li, X.; Zhang, Q. Changes in the number of PM2.5-attributed deaths in China from 2000 to 2010: Comparison between estimations from census-based epidemiology and pre-established exposure-response functions. Environ. Int. 2019, 129, 430–437. [Google Scholar] [CrossRef] [PubMed]
  35. Geng, G.; Xiao, Q.; Liu, S.; Liu, X.; Cheng, J.; Zheng, Y.; Xue, T.; Tong, D.; Zheng, B.; Peng, Y.; et al. Tracking air pollution in China: Near real-time PM2.5 retrievals from multisource data fusion. Environ. Sci. Technol. 2021, 55, 12106–12115. [Google Scholar] [CrossRef]
  36. Xue, T.; Zheng, Y.; Geng, G.; Xiao, Q.; Meng, X.; Wang, M.; Li, X.; Wu, N.; Zhang, Q.; Zhu, T. Estimating spatiotemporal variation in ambient ozone exposure during 2013-2017 using a data-fusion model. Environ. Sci. Technol. 2020, 54, 14877–14888. [Google Scholar] [CrossRef]
  37. Xiao, Q.; Zheng, Y.; Geng, G.; Chen, C.; Huang, X.; Che, H.; Zhang, X.; He, K.; Zhang, Q. Separating emission and meteorological contributions to long-term PM2.5 trends over eastern China during 2000–2018. Atmos. Chem. Phys. 2021, 21, 9475–9496. [Google Scholar] [CrossRef]
  38. Xiao, Q.; Geng, G.; Liang, F.; Wang, X.; Lv, Z.; Lei, Y.; Huang, X.; Zhang, Q.; Liu, Y.; He, K. Changes in spatial patterns of PM2.5 pollution in China 2000-2018: Impact of clean air policies. Environ. Int. 2020, 141, 105776. [Google Scholar] [CrossRef]
  39. Geng, G.; Zhang, Q.; Tong, D.; Li, M.; Zheng, Y.; Wang, S.; He, K. Chemical composition of ambient PM2.5 over China and relationship to precursor emissions during 2005–2012. Atmos. Chem. Phys. 2017, 17, 9187–9203. [Google Scholar] [CrossRef] [Green Version]
  40. Yang, X.; Lv, Y.; Wang, Y.; Qiao, Y.; Zhang, G.; Wang, S.; Zhang, X.; Liu, Z.; Liu, Y.; Zhu, X. Impact of synoptic patterns on regional ozone pollution in Sichuan Basin. China Environ. Sci. 2021, 41, 2526–2539. [Google Scholar]
  41. Couto, A.; Costa, P.; Simões, T. Identification of extreme wind events using a weather type classification. Energies 2021, 14, 3944. [Google Scholar] [CrossRef]
  42. Du, X.; Yang, J.; Zhao, X.; Cheng, X.; Zhu, M. Analysis on correlations between weather classification and air quality during autumn and winter in Chengdu. Environ. Sci. Manag. 2021, 46, 58–62. [Google Scholar]
  43. Hsu, C.-H.; Cheng, F.-Y. Synoptic weather patterns and associated air pollution in Taiwan. Aerosol Air Qual. Res. 2019, 19, 1139–1151. [Google Scholar] [CrossRef] [Green Version]
  44. Kidson, J.W. An analysis of New Zealand synoptic types and their use in defining weather regimes. Int. J. Climatol. 2000, 20, 299–316. [Google Scholar] [CrossRef]
  45. Compagnucci, R.H.; Richman, M.B. Can principal component analysis provide atmospheric circulation or teleconnection patterns? Int. J. Climatol. 2008, 28, 703–726. [Google Scholar] [CrossRef]
  46. Huth, R.; Beck, C.; Philipp, A.; Demuzere, M.; Ustrnul, Z.; Cahynova, M.; Kysely, J.; Tveito, O.E. Classifications of atmospheric circulation patterns: Recent advances and applications. Ann. N. Y. Acad. Sci. 2008, 1146, 105–152. [Google Scholar] [CrossRef] [PubMed]
  47. El-Kadi, A.K.A.; Smithson, P.A. Atmospheric classification and synoptic climatology. Prog. Phys. Geogr. 1992, 16, 432–455. [Google Scholar] [CrossRef]
  48. Huth, R. An intercomparison of computer-assisted circulation classification methods. Int. J. Climatol. 1996, 16, 893–922. [Google Scholar] [CrossRef]
  49. Huth, R. A circulation classification scheme applicable in GCM studies. Theor. Appl. Climatol. 2000, 67, 1–18. [Google Scholar] [CrossRef]
  50. Paschalidou, A.K.; Kassomenos, P.A. What are the most fire-dangerous atmospheric circulations in the Eastern-Mediterranean? Analysis of the synoptic wildfire climatology. Sci. Total. Environ. 2016, 539, 536–545. [Google Scholar] [CrossRef]
  51. Du, Y.; Huang, R.; Wang, X.; Qin, M.; Zhang, W.; Zhang, Y.; Yang, Y.; Zhang, W.; Luo, B.; Hu, Y.; et al. Implementing reduced formed model to construct ozone isopleths and its application. Acta Sci. Nat. Univ. Pekin. 2021, 57, 311–321. [Google Scholar]
  52. Cohan, D.S.; Hakami, A.; Hu, Y.; Russell, A.G. Nolinear response of ozone to emissions: Source apportionment and sensitivity analysis. Environ. Sci. Technol. 2005, 39, 6739–6748. [Google Scholar] [CrossRef] [PubMed] [Green Version]
  53. Napelenok, S.; Cohan, D.; Hu, Y.; Russell, A. Decoupled direct 3D sensitivity analysis for particulate matter (DDM-3D/PM). Atmos. Environ. 2006, 40, 6112–6121. [Google Scholar] [CrossRef]
  54. Byun, D.; Schere, K.L. Review of the governing equations, computational algorithms, and other components of the Models-3 Community Multiscale Air Quality (CMAQ) modeling system. Appl. Mech. Rev. 2006, 59, 51–77. [Google Scholar] [CrossRef]
  55. Hakami, A.; Odman, M.T.; Russell, A.G. High-order, direct sensitivity analysisi of multidimensional air quality models. Environ. Sci. Technol. 2003, 37, 2442–2452. [Google Scholar] [CrossRef] [PubMed]
  56. Yang, Y.-J.; Wilkinson, J.G.; Russell, A.G. Fast, direct sensitivity analysis of multidimensional photochemical models. Environ. Sci. Technol. 1997, 31, 2859–2868. [Google Scholar] [CrossRef]
  57. Pinder, R.W.; Gilliam, R.C.; Appel, K.W.; Napelenok, S.L.; Foley, K.M.; Gilliland, A.B. Efficient probabilistic estimates of surface ozone concentration using an ensemble of model configurations and direct sensitivity calculations. Environ. Sci. Technol. 2009, 43, 2388–2393. [Google Scholar] [CrossRef]
  58. Zhang, W.; Trail, M.A.; Hu, Y.; Nenes, A.; Russell, A.G. Use of high-order sensitivity analysis and reduced-form modeling to quantify uncertainty in particulate matter simulations in the presence of uncertain emissions rates: A case study in Houston. Atmos. Environ. 2015, 122, 103–113. [Google Scholar] [CrossRef]
  59. Jerrett, M.; Burnett, R.T.; III, C.A.P.; Ito, K.; Thurston, G.; Krewski, D.; Shi, Y.; Calle, E.; Thun, M. Long-term ozone exposure and mortality. N. Engl. J. Med. 2009, 360, 1085–1095. [Google Scholar] [CrossRef] [Green Version]
  60. Turner, M.C.; Jerrett, M.; Pope, C.A., 3rd; Krewski, D.; Gapstur, S.M.; Diver, W.R.; Beckerman, B.S.; Marshall, J.D.; Su, J.; Crouse, D.L.; et al. Long-term ozone exposure and mortality in a large prospective study. Am. J. Respir. Crit. Care Med. 2016, 193, 1134–1142. [Google Scholar] [CrossRef] [PubMed] [Green Version]
  61. 2-min Gridded Global Relief Data (ETOPO2) v2c. National Centers for Environmental Information, National Oceanic and Atmospheric Administration. 2006. Available online: http://www.ngdc.noaa.gov/mgg/fliers/06mgg01.html (accessed on 22 July 2021).
  62. Zhao, P.; Liu, J.; Luo, Y.; Wang, X.; Li, B.; Xiao, H.; Zhou, Y. Comparative analysis of long-term variation characteristics of SO2, NO2, and O3 in the ecological and economic zones of the western Sichuan Plateau, Southwest China. Int. J. Environ. Res. Public Health 2019, 16, 3265. [Google Scholar] [CrossRef] [Green Version]
  63. Qi, D.; Li, Y.; Liu, K. Relationship between the drought and flood intensity in Sichuan area in summer and west pacific subtropical high. Plateau Mt. Meteorol. Res. 2012, 32, 41–46. [Google Scholar]
  64. Wang, X.; Fu, T.M.; Zhang, L.; Cao, H.; Zhang, Q.; Ma, H.; Shen, L.; Evans, M.J.; Ivatt, P.D.; Lu, X.; et al. Sensitivities of ozone air pollution in the Beijing-Tianjin-Hebei area to local and upwind precursor emissions using adjoint modeling. Environ. Sci. Technol. 2021, 55, 5752–5762. [Google Scholar] [CrossRef] [PubMed]
  65. Gridded Population of the World, Version 4 (GPWv4): Population Count, Revision 11, Center for International Earth Science Information Network (CIESIN) Columbia University 2018. Available online: https://sedac.ciesin.columbia.edu/data/set/gpw-v4-population-count-rev11 (accessed on 22 July 2021).
Figure 1. Time series of the average (black dots) and anomaly (red circles) for (a) MDA8 and (b) MDA1 ozone in the warm season over 30 sites in Sichuan from 2014 to 2020. Gray shading indicates the range of mean values ± 50% of the standard deviation over 30 sites for each month. The red dash line represents the linear fitted curve. The inset numbers in the upper part of the plot show the linear trend in absolute values (ppb year−1) and percentages (% year−1, calculated as the linear trend divided by the mean values in the year 2014). The inset numbers in the lower part above the x-axis denote the warm-season average values. (c) The annual trend for 8 ozone metrics in Sichuan from 2014 to 2020.
Atmosphere 12 01557 g001
Figure 2. Monthly mean MDA8 ozone (black lines) from 2013 to 2020 and warm-season averaged MDA8 ozone (blue lines) from TAP during 2014–2020 for 21 cities in Sichuan Province. The monthly mean values for April, May, June, July, and August are shown in orange, grey, yellow, red, and green dots, respectively. The dashed blue lines represent the linear fitted curve for the warm-season mean over 2014–2020. The slopes and p-values for the fitted curves (right bottom corner), the warm-season mean MDA8 and mean altitude [61] (left upper corner) for each city over 2013–2020 are also shown inset.
Atmosphere 12 01557 g002
Figure 3. Circulation of the six predominant synoptic patterns in the warm season over Sichuan from 2013 to 2020 classified by the mean sea-level pressures. The top two rows show the mean sea level pressure (contour) and 10-m wind fields (vector) in the warm season over Sichuan Province and its surroundings. The occurrence frequency of each synoptic type is shown inset. The bottom two rows show the anomalies of geopotential height (contour) and wind fields (vector) at 500 hPa.
Atmosphere 12 01557 g003
Figure 4. The occurrence frequency of the six predominant synoptic patterns in each month of the warm season during the time period 2013–2020 in Sichuan.
Atmosphere 12 01557 g004
Figure 5. The anomaly of classified six types of synoptic patterns of total cloud cover, surface downward solar radiation, 2-m temperature, 2-m relative humidity, and MDA8 ozone from TAP (contour) and CNEMC (dots) in warm-season over 2013–2020. The mean values over 17 basin cities are shown inset. The number of days that MDA8 ozone over 160 μg m−3 among 21 cities in Sichuan are inset at the right corner.
Atmosphere 12 01557 g005
Figure 6. The annual occurrence of six synoptic types in Sichuan Province over 2013 to 2020.
Atmosphere 12 01557 g006
Figure 7. EKMA curves for Chengdu, Neijiang, and Suining in days with heavy ozone pollution, light ozone pollution, and clean air.
Atmosphere 12 01557 g007
Table 1. The occurrence frequency of ozone formation regimes during 11–31 August 2019 for 9 cities in Sichuan Province.
O3 Formation RegimesCDDYMYLSNJSNYAZYMS
NOx-limited27.3 81.8 76.2 77.3 85.7 90.5 95.5 90.9 90.5
Transition 31.8 4.5 14.3 13.6 4.8 4.8 0.0 4.5 9.5
VOC-limited40.9 13.6 9.5 9.1 9.5 4.8 4.5 4.5 0.0
CD: Chengdu, DY: Deyang, MY: Mianyang, LS: Leshan, NJ: Neijiang, SN: Suining, YA: Yaan, ZY: Ziyang, MS: Meishan.
Publisher’s Note: MDPI stays neutral with regard to jurisdictional claims in published maps and institutional affiliations.

