Article

Online Chemical Characterization and Sources of Submicron Aerosol in the Major Mediterranean Port City of Piraeus, Greece

by
Iasonas Stavroulas
1,2,
Georgios Grivas
2,*,
Eleni Liakakou
2,
Panayiotis Kalkavouras
1,2,
Aikaterini Bougiatioti
2,
Dimitris G. Kaskaoutis
1,2,
Maria Lianou
2,
Kyriaki Papoutsidaki
1,
Maria Tsagkaraki
1,
Pavlos Zarmpas
1,
Evangelos Gerasopoulos
2 and
Nikolaos Mihalopoulos
1,2,*
1
Environmental Chemical Processes Laboratory, Department of Chemistry, University of Crete, 70013 Heraklion, Greece
2
Institute for Environmental Research and Sustainable Development, National Observatory of Athens, 15236 Athens, Greece
*
Authors to whom correspondence should be addressed.
Atmosphere 2021, 12(12), 1686; https://doi.org/10.3390/atmos12121686
Submission received: 3 November 2021 / Revised: 26 November 2021 / Accepted: 10 December 2021 / Published: 16 December 2021
(This article belongs to the Special Issue Air Quality in Greece)

Abstract

:
Port cities are affected by a wide array of emissions, including those from the shipping, road transport, and residential sectors; therefore, the characterization and apportionment of such sources in a high temporal resolution is crucial. This study presents measurements of fine aerosol chemical composition in Piraeus, one of the largest European ports, during two monthly periods (winter vs. summer) in 2018–2019, using online instrumentation (Aerosol Chemical Speciation Monitor—ACSM, 7-λ aethalometer). PMF source apportionment was performed on the ACSM mass spectra to quantify organic aerosol (OA) components, while equivalent black carbon (BC) was decomposed to its fossil fuel combustion and biomass burning (BB) fractions. The combined traffic, shipping and, especially, residential emissions led to considerably elevated submicron aerosol levels (22.8 μg m−3) in winter, which frequently became episodic late at night under stagnant conditions. Carbonaceous compounds comprised the major portion of this submicron aerosol in winter, with mean OA and BC contributions of 61% (13.9 μg m−3) and 16% (3.7 μg m−3), respectively. The contribution of BB to BC concentrations was considerable and spatially uniform. OA related to BB emissions (fresh and processed) and hydrocarbon-like OA (from vehicular traffic and port-related fossil fuel emissions including shipping) accounted for 37% and 30% of OA, respectively. In summer, the average PM1 concentration was significantly lower (14.8 μg m−3) and less variable, especially for the components associated with secondary aerosols (such as OA and sulfate). The effect of the port sector was evident in summer and maintained BC concentrations at high levels (2.8 μg m−3), despite the absence of BB and improved atmospheric dispersion. Oxygenated components yielded over 70% of OA in summer, with the more oxidized secondary component of regional origin being dominant (41%) despite the intensity of local sources, in the Piraeus environment. In general, with respect to local sources that can be the target of mitigation policies, this work highlights the importance of port-related activities but also reveals the extensive wintertime impact of residential wood burning. While a separation of the BB source is feasible, more research is needed on how to disentangle the short-term effects of different fossil-fuel combustion sources.

1. Introduction

Health studies in recent years definitively implicated fine aerosols in a causal relationship with mortality and cardiovascular effects, both for long-term and short-term exposures [1,2]. The EU addressed the long-term exposure concern in the 2008/50/EC EU directive on air quality and cleaner air for Europe, enforcing an annual PM2.5 limit value. A decade later, while PM2.5 is recognized as the regulatory pollutant with the strongest link to premature mortality (379,000 excess cases in EU-28 during 2018) [3], its annual mean levels in Europe are on the decline due to wide-ranging legislative action to curb emissions of particulate matter (PM) and its precursors [4]. However, EU air quality standards do not consider the issue of short-term exposure to fine PM, thus they are not aligned with existing scientific knowledge, and hamper the ability of air quality management authorities to implement direct action plans targeted at local sources. In this framework, it is clear that reliable solutions are needed to monitor and characterize on a continuous short-term basis, not only the levels, but also the chemical composition and sources of fine aerosols. There is mounting evidence that their chemical components (e.g., black carbon—BC, organic aerosol—OA, and sulfate), as well as their sources, are explicitly linked to short-term effects (mortality, cardiovascular hospital admissions and emergency department visits) [5,6,7,8]. Therefore, information provided by online instruments for the chemical characterization and source apportionment of fine aerosols, such as the Aerosol Chemical Speciation Monitor (ACSM), is invaluable.
Notwithstanding the aforesaid improvement in urban air quality in the EU, particle pollution remains a serious issue in areas that confront strong socio-economic challenges, being disproportionately burdened by local emissions [9,10]. Port cities are a good example of this [11,12], since they gather PM-emitting activities from diverse sectors (e.g., passenger and commercial shipping, the vehicular sector including goods transport, drayage and cargo handling, the residential and tourism sectors). Moreover, port areas frequently neighbor industrial zones, and also tend to be inhabited by lower-income citizens [13,14].
Port-related sources, including shipping and the associated road and commercial activity, directly affect air quality in port cities [15,16,17]. The deterioration of air quality and effects on health and welfare are sustained in these areas and beyond, since operations of a large port can have an impact at a distance of many kilometers [18]. In recent years, there was targeted action by international organizations (IMO, USEPA, EU) to reduce maritime emissions and control air pollution in coastal areas. Coordinated EU policies, including the reduction in the sulfur content in marine fuels (Sulfur Directive 2012/33/EU) and the adoption of emission control zones (North and Baltic Sea, but not yet the Mediterranean), have led to reductions in SO2 concentrations in European coastal cities [19,20], and there are plans for expanding the strategy to also consider PM. In this context, port cities are focal points for the development of air quality management plans that require detailed knowledge on the variability, composition and sources of pollutants. According to the European Sea Ports Organization (ESPO), air quality is the top environmental priority in two thirds of 97 major EU ports [21].
Piraeus, a port city in the Eastern Mediterranean, can be seen as a characteristic case where air quality is a pressing issue for the protection of residents, commuters and tourists [22]. Piraeus has been the busiest commercial port in Europe for over 10 years. Furthermore, during the last decade, Piraeus has evolved into the second busiest container port in the Mediterranean [23]. The central Piraeus area, where shipping and commercial activities are concentrated, is traversed by high-traffic roads [24]. Moreover, the population density in Piraeus is one of the highest in the Greater Area of Athens (GAA), resulting in additional emissions from residential heating. More specifically, residential wood burning (RWB) has emerged as a major environmental pressure in the GAA during the last decade [25,26] and Piraeus is not an exception, with recent research reporting excessive nighttime aerosol levels in winter [23]. Several studies examined the variability of regulatory pollutants in Piraeus over the years, recognizing the area as one of the most heavily impacted by particle pollution in the GAA [24,27,28]. However, information on the chemical composition and aerosol sources in Piraeus is very limited and outdated [29,30].
In general, there are numerous studies on the chemical characterization and source apportionment of fine aerosols in port areas using offline filter sampling [31,32,33]. Their results are useful for determining aerosol types and source contributions on a long-term basis, but do not often provide detailed information on emission patterns of sources that induce short-term variations, and this limits their applicability in designing intervention policies. Online chemical composition measurements (coupled with source apportionment in high resolution) can address this need, but such results are not abundant in the case of port cities, especially in the Mediterranean [34,35]. Various studies using aerosol mass spectrometry near major ports noted the potential effect of shipping emissions. Lu et al. [36] used an aerosol mass spectrometer (AMS) in the port of Vancouver to identify and characterize the effect of ship plumes, indicating similarities between mass spectra recorded inland and reference ship stack-exhaust spectra. On the contrary, the source apportionment study of Dall’Osto et al. [37], near the shipping berths of the port of Cork, Ireland, by combining data from aerosol time-of-flight mass spectrometry and high-resolution AMS, reported shipping emissions to be associated with a processed OA component. Schulze et al. [38] likewise showed that offshore shipping emissions were sensed as oxidized OA at a receptor site in the Texas Gulf Coast Area near Houston. However, Al Naiema et al. [39], with the use of high-resolution measurements at the Houston Ship Channel and various receptor modelling methods, highlighted the diversity of local sources that contributed to fine aerosols in a major port city, with shipping emissions accounting for a relatively small OA fraction. In order to discern between fine aerosol impacts from various activities in a port city, Shah et al. [40] performed mobile AMS measurements in Oakland, verifying significant source-related diurnal and spatial patterns and highlighting the impact of port-related vehicle emissions. Overall, it appears that unravelling the contributions of shipping emissions from those of general fossil-fuel combustion sources is a strenuous task, and more data from field studies are needed in order to better understand these constraints.
The present study attempts to address the identified knowledge gaps and provides insights in the temporal variability—at various scales—of major fine aerosol components and contributions of carbonaceous aerosol sources. Online instrumentation (ACSM and 7-λ aethalometer) was installed at a central site, close to the passenger–port terminals, monitoring during two distinct sampling periods in 2018–2019 (winter—strong residential heating emissions; summer—increased passenger–port activity). The temporal variability of the major aerosol components was statistically assessed, also against external tracers and meteorological parameters. PMF source apportionment was performed on the ACSM organic spectra to quantify OA components (primary and oxidized). Their temporal patterns along with those of source-specific BC components were examined and supplemented with wind and air-mass back-trajectory analysis for the identification of source areas. This is one of the first studies utilizing aerosol mass spectrometry data for source apportionment in a major Mediterranean port city. Apart from the results that can guide air quality management and mitigation scenarios in Piraeus and other port cities in the Mediterranean, the analysis reveals the complexity and challenges of aerosol chemical characterization and source apportionment in port areas, and advocates for specialized research on the topic.

2. Study Area and Methods

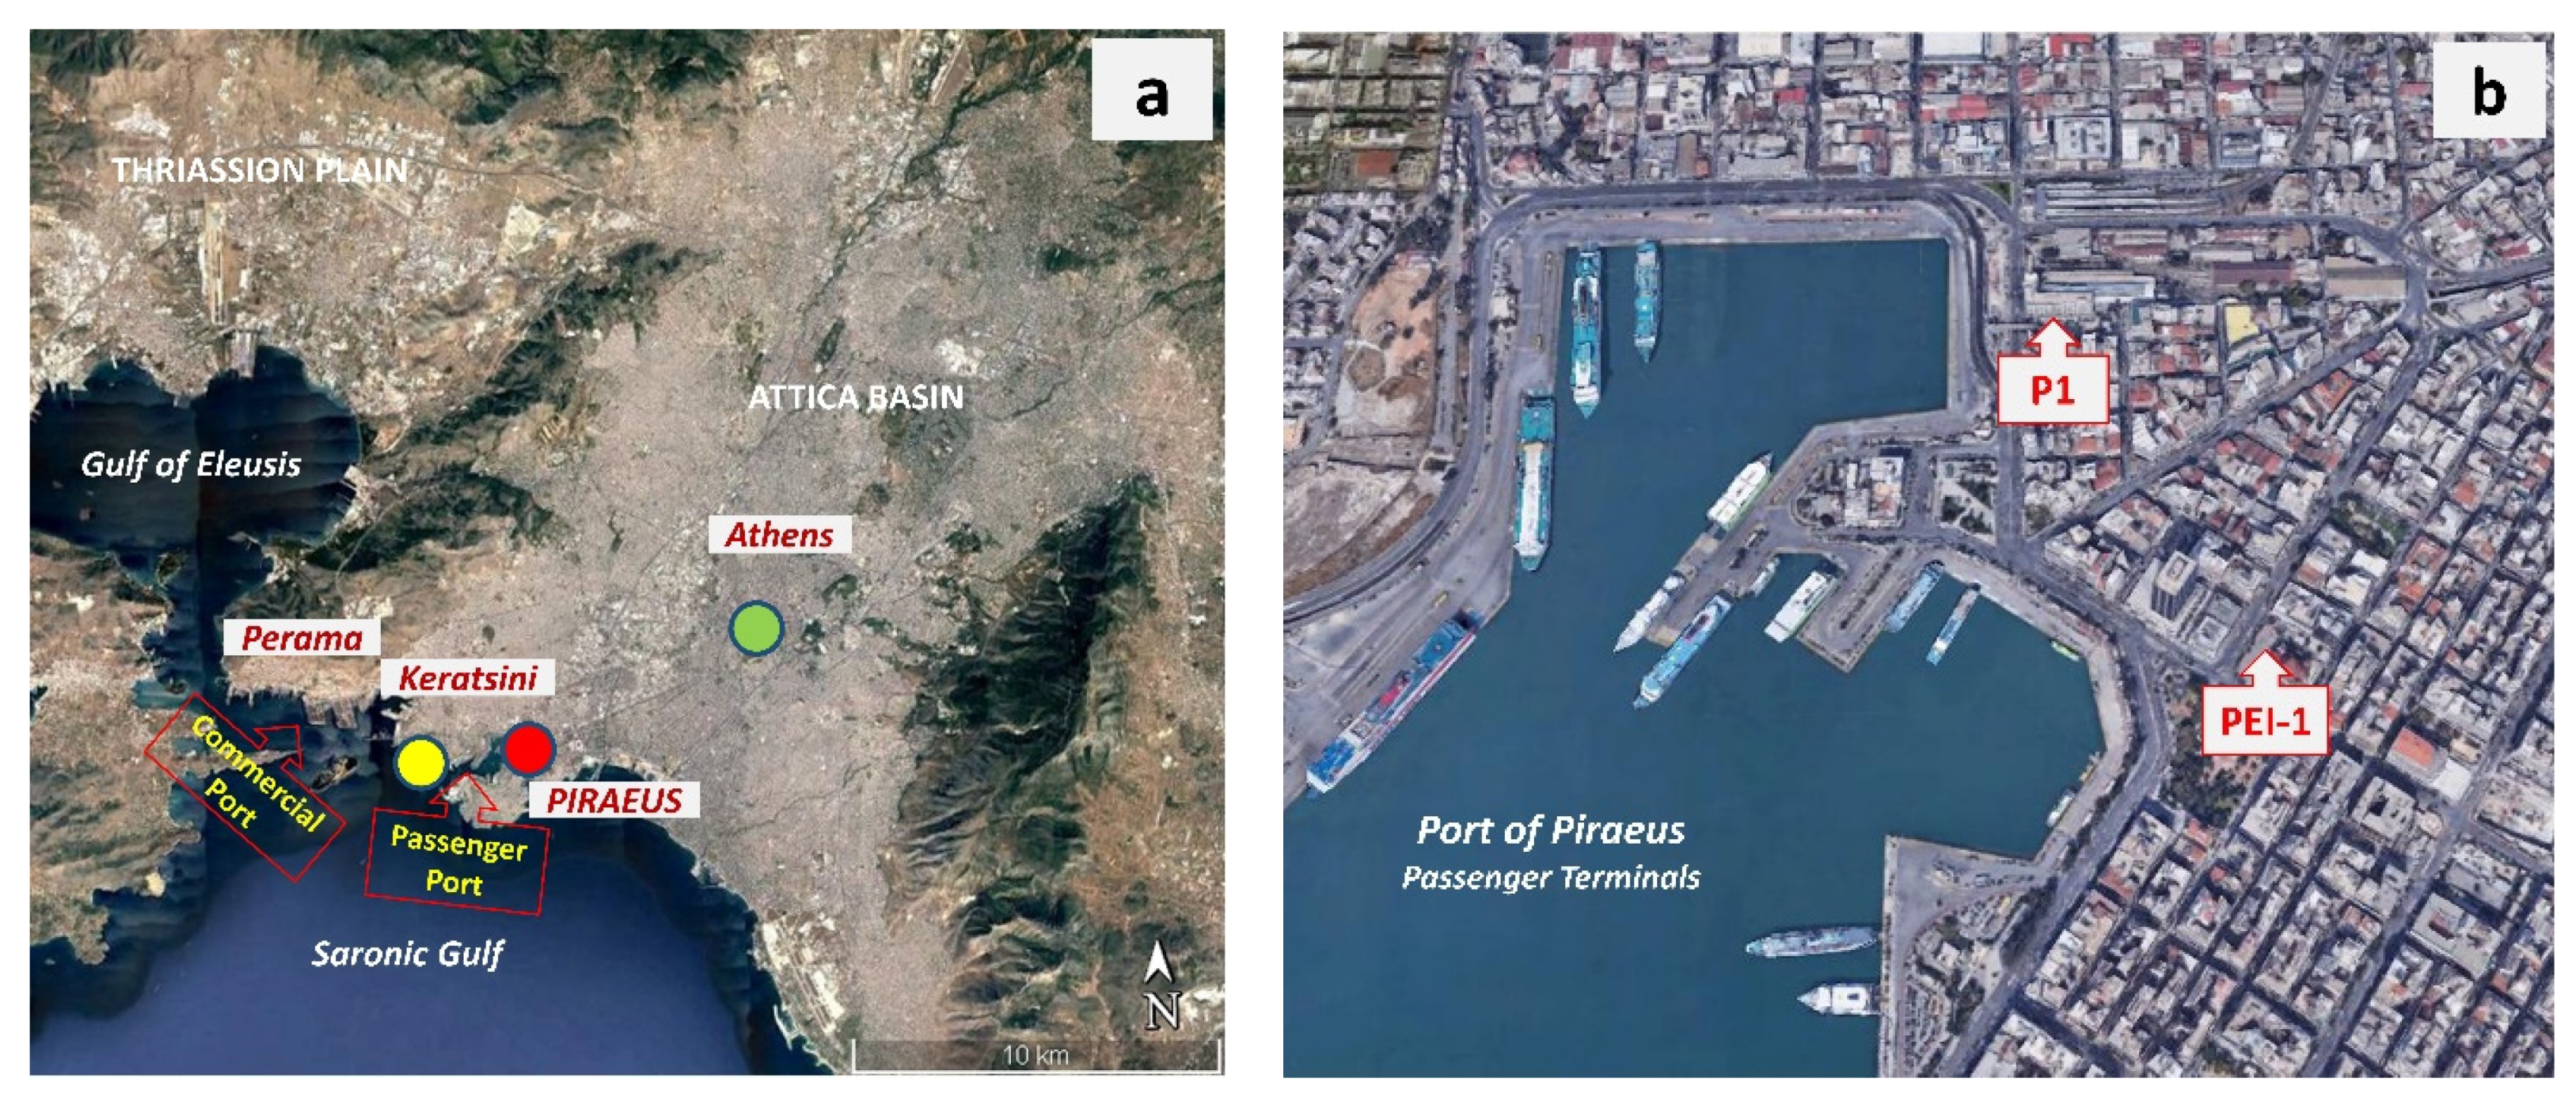
2.1. Study Area and Measurement Site

The port area of Piraeus (Figure 1a) is found in the southwestern part of the GAA, on the shore of the Saronic Gulf (Aegean Sea in the Eastern Mediterranean). The area is bounded to the northwest by Mt. Aegaleo, which separates the Attica basin from the Thriassion plain. The municipality of Piraeus has a population of 164,000 (~15,000 per km2), while the Regional Unit of Piraeus, which includes 4 surrounding municipalities, hosts 450,000 inhabitants (~9000 km−2).
The central Piraeus area is developed around the passenger port that serves over 12 million people per annum travelling on coastal and cruise liners. The commercial port activities are concentrated to the west, mostly around three large container terminals in the area of Keratsini. A large part of the HDV (heavy-duty vehicles) traffic, carrying freight between the port and the E75 international roadway that reaches Piraeus to the east, traverses the city center, and aggravates the already heavy local traffic. Several dockyards are located further to the west in the area of Perama, while oil tanker traffic is mostly routed to the Gulf of Eleusis to the northwest, where two large refineries operate. There are no major industries in the area of Piraeus but a few secondary industrial installations across the coast (mainly tank farms) and to the northwest (industrial area of Rentis) [30]. On the contrary, most of the industrial activity in the GAA is concentrated in the Thriassion Plain, 10–20 km to the northwest of Piraeus [41].
The area is characterized by a typical Mediterranean climate (mild winters, warm dry summers), moderated by the coastal environment. The effect of the sea/land breeze system from the Saronic Gulf cell is present throughout the year, but is far more prevalent in the summer, with strong onshore flows observed during the day (typically exceeding 6 m s−1 around noon), also exhibiting a large vertical extent. This daytime pattern is typically combined with weak northerlies or calms during the night [42,43]. Strong synoptic-scale N-NE advections are most frequent during winter over the GAA and blow over day and night, while in summer, the northern Etesian wind regime often prevails in the daytime. These northern winds usually contribute to atmospheric clearance and the improvement of air quality [44], but it is possible that they also transport pollutants to Piraeus from inland (Attica Basin).
Measurements at the central site in Piraeus (P1, Figure 1b) were conducted during two season-specific monthly periods: winter (10 December 2018–16 January 2019) and summer (11 June 2019–9 July 2019). The average temperatures during the two periods were 9.8 and 28.6 °C, respectively, indicating characteristic winter and summer conditions in the GAA. Online instruments (ACSM and 7-λ aethalometer) were placed at the building (1st floor) of the Athens Metro (Urban Rail Transport S.A., Athens, Greece) terminal station (Figure 1b; 37.9479° N, 23.6429° E, 10 m a.s.l.).
The sampling height was approximately 9 m above ground and the sampling manifold was at a distance of 1 m from the building façade. A sampler used for collection of 24 h filters was placed on the rooftop of the building (~20 m above ground). The site was expected to be influenced by traffic emissions, being at a distance of 70 m from the coastal avenue, which is adjacent to the ferry berths. Moreover, due to its central placement at a shipping and rail transportation hub, the site is also characterized by intense human and commercial activity.

2.2. Online Measurements

An aerosol chemical speciation monitor (ACSM, Aerodyne Inc., Billerica, MA, USA) was used to obtain near-real time (30 min resolution) data on the chemical composition of non-refractory submicron aerosols (NR-PM1). The instrument sampled at a flow rate of 3.0 L min−1, through a PM1 sharp-cut cyclone (SCC 1.109, BGI Inc., Waltham, MA, USA). The incoming air flow was dried using a Nafion membrane dryer placed upstream. The dryer was operated in purge vacuum mode, where the space between the outer wall of the Nafion membrane and the dryer enclosure was kept at a pressure below 0.4 atm using a vacuum pump, drawing already dried air from the ACSM’s auxiliary flow exhaust. The ACSM measures concentrations of OA, sulfate, ammonium, nitrate, and chloride, by obtaining aerosol mass spectra with a quadrupole mass spectrometer, following flash vaporization and electron impact ionization of aerosol sampled through an aerodynamic focusing lens (effective particle size range: 40–700 nm) [45]. Concentrations were determined using a collection efficiency dependent on chemical composition but independent of RH as the inflow was dried to <60% [46]. The mean CE (dry) was 0.604 ± 0.150% and 0.499 ± 0.102% in winter and summer, respectively. Since the CE correction in a dried airstream depends on the ammonium nitrate fraction, the observed seasonal contrast is reasonable in view of the very low ammonium nitrate levels in summer due to volatilization. The instrument participated successfully in the second ACTRIS inter-comparison campaign and was found well within the threshold for satisfactory performance [47]. Further details on the methodology, operating procedures, maintenance, calibration and data validation can be found in Ng et al. [48] and Stavroulas et al. [49], the latter specifically for ACSM measurements in the GAA during 2013–2017. ACSM concentration outputs were averaged on an hourly basis (866 hourly values in winter and 484 hourly values in summer, respectively; a lower data capture rate in summer was due to some interruptions in the power supply of the instrument).
Black carbon (BC) concentrations were measured at a 1 min resolution using a 7-λ aethalometer (AE33, Magee Scientific, Berkeley, CA, USA) that sampled at an airflow of 5 L min−1. The AE33 records light absorption coefficients at seven wavelengths in 370–950 nm, by measuring the light attenuation through particles deposited on a PTFE-coated glass-fiber filter tape (Part No. 8060). BC concentrations are calculated at each wavelength (including at 880 nm for the equivalent concentration referred to as BC) using reference mass absorption efficiencies (MAE). A dual-spot measurement approach is followed by the AE33 to compensate internally for the “filter loading” effect [50], while a correction for multiple scattering, specific for the filter tape material, is also applied [51]. The aethalometer inflow was not dried, but due to the short tubing used (<1 m indoors) and the PTFE-coated glass-fiber filter tape that has a low affinity for water vapor, relative humidity (Figure S1) artifacts were expected to be insignificant [52]. Absorption Ångström Exponents (AAE) were calculated in the 370–950 nm range (AAE370–950). Furthermore, through the implementation of the “Aethalometer model”, the source-specific BC fractions attributed to fossil fuel combustion (BCff) and biomass burning (BCbb) were calculated automatically by the instrument, under the assumptions of constant AAE values for aerosols from fossil fuel combustion (AAEff = 1) and biomass burning (AAEbb = 2) [53]. Data records with AAE470–950 outside the 1-2 range were automatically truncated by the AE33 to 1 and 2, respectively. However, such data were very limited in our dataset (4 hourly values, 0.3% of BC data at P1 for the two periods combined). There are some uncertainties in considering spectrally independent AAEff and AAEbb of 1 and 2. While pure black carbon is considered to be approximated by AAEBC = 1, aging processes involving BC internal mixing (e.g., lensing effects in core–shell mixing) can lead to increased AAEff [54], while such an increase is also possible due to the presence of brown carbon particles from fossil fuel combustion [55]. There are also studies examining the stability of the AAEbb = 2 assumptions, with varying results [56]. While it is fairly common to present the AE33 BB% estimates “as is”, these uncertainties should be kept in mind (a detailed discussion can be found in [57]). All data deriving from aethalometer measurements were subsequently averaged hourly (887 and 652 values in winter and summer, respectively).

2.3. Offline Measurements and Auxiliary Data

Chemical composition measurements were performed, in parallel with online measurements, on PM2.5 quartz-fiber filters collected every day (midnight-to-midnight), using a reference-equivalent low-volume sampler (Derenda LVS-PNS-15; Comde-Derenda, Stahnsdorf, DE, USA). Organic and elemental carbon (OC and EC) were quantified from filter punches using a thermal/optical Sunset carbon analyzer (Sunset Laboratories Inc., Portland, OR, USA), according to the EUSAAR-II protocol [58]. Nanopure water extracts were analyzed using an ion chromatography system (Dionex DX-500, Thermo Fisher Scientific Inc., Waltham, MA, USA) for major cations and anions, including sulfate, nitrate, ammonium, and chloride [59]. The results from filter-based analyses were used to assess the quality of ACSM measurements for OA and major ions. The covariance between EC and BC was also explored.
Additional data on hourly concentrations of regulatory pollutants (nitrogen oxides, sulfur dioxide, benzene, ozone, PM2.5, as well as CO that was available only in the summer period) were obtained from a monitoring site (PEI-1) of the National Air Pollution Monitoring Network, 400 m to the southeast (37.9447° N, 23.6452° E, 4 m a.s.l.). This roadside traffic site is known to have recorded some of the highest levels of traffic-related pollutants in the GAA over the years [27]. Meteorological data (temperature, relative humidity, wind speed-direction) were also monitored at a nearby station (2 km to the south) in central Piraeus.
AE33 measurements (including BCff, BCbb estimates) were also available for the same periods at the National Observatory of Athens (NOA) Thissio urban background monitoring site (THI, green marker in Figure 1a) in central Athens (37.9732° N, 23.7180° E, 105 m a.s.l.), and were used to assess the spatial homogeneity of levels. Details on AE33 long-term measurements at THI can be found elsewhere [26,57]. Moreover, BC concentrations were measured at a secondary background location in the area of Piraeus (P2, yellow marker in Figure 1a) using a Multi-Angle Absorption Photometer (MAAP, Thermo Fisher Scientific Inc., Waltham, MA, USA), installed in the NOA mobile air quality monitoring station. The station’s location was 2.1 km to the west of P1 (37.9461° N, 23.6191° E, 21 m a.s.l.) and can be considered representative of background conditions in the port area, as it is at least 200 m away from major roads and residential blocks, and also upwind of passenger-port emissions. The MAAP sampled at 16.7 L min−1 through a PM2.5 inlet (at a sampling height of 5 m), determining equivalent BC concentrations at 637 nm. The agreement of MAAP measurements (637 nm) with those of a collocated AE33 (at the nearest wavelength: 660 nm) was demonstrated previously at THI, with r2 > 0.75 and slope close to unity (1.15) [26]. Such differences in BC estimates from the MAAP and multi-wavelength aethalometers were occasionally reported [60], mainly due to the different way of multiple scattering compensation (by measurement in the MAAP and using a C coefficient in aethalometers) and also because there is no correction for filter loading in MAAP data. These differences tend to become significant for high BC concentrations (e.g., >9 μg m−3) where the MAAP response is no longer linear [61]. In view of this, we excluded MAAP values higher than 9 μg m−3 from our analysis (36 hourly values in total, observed only in winter). The MAAP measurements at P2 were compared with those at P1 (BC660nm) to establish the “urban” enhancement of BC concentrations in Piraeus (ΔBCu). It should be noted that in case of an AE33/MAAP slope of 1.15 as mentioned above, mean ΔBCu calculations could have an uncertainty in the area of 20% in both winter and summer periods.
The impact of wind circulation and transport from sources at the local/medium spatial scale was assessed using bivariate polar and annular (assessment of the diurnal variability) wind plots, as well as wind plots for the conditional probability function (CPF) that a fractional source contribution associated with specific wind vectors would exceed a predefined percentile threshold [62,63]. To assess the impact of remote sources and long-range transport, five-day air mass back-trajectories, arriving in Piraeus at 750 m every one hour, were computed using the Hybrid Single Particle Lagrangian Integrated Trajectory (HYSPLIT) model [64] and GDAS (Global Data Assimilation System) meteorological data fields at a 1° resolution. The PSCF (Potential Source Contribution Function) [65] technique was implemented to assess the origins of chemical components and source contributions for which a regional influence was expected, using the Zefir software [66] developed for the Igor Pro data analysis suite (Wavemetrics Inc, Portland, OR, USA).

2.4. Source Apportionment of Organic Aerosol

The mass spectra acquired by the ACSM for the organic fraction of submicron aerosol were analyzed in order to distinguish between different OA sources and formation processes, using Positive Matrix Factorization (PMF). In this context, the multilinear engine algorithm (ME-2) [67] was used, as implemented in the SoFi 6.1 (Datalystica Ltd., Villigen, Switzerland) package [68] that runs within Igor Pro. The PMF bilinear model is a factor-analytic, data reduction approach that also includes non-negativity constrains in its matrices and utilizes measurement uncertainties in its solution. Through PMF, the measured OA time series can be represented as a linear combination of static mass spectra (factor profiles—FPs) and time series of respective factor contributions. A more detailed theoretical overview of the PMF model can be found in Section S1.1 in the Supplementary Materials. Variables up to m/z = 125 were retained in the PMF analysis. Variables with a low signal-to-noise ratio or duplicates due to the fragmentation table settings [69] and their respective errors were treated to downweigh their contribution to the PMF solutions [70].
In this study, an OA source apportionment strategy similar to the one described by Stavroulas et al. [49] was adopted, based on the guidelines proposed in previous studies [71] and adapted accordingly to the specifics of the examined site. In brief, PMF was initially performed for a range of 3 to 8 factors without any constrains to the factor profiles (FP), thus acquiring a first estimate on the number of primary and secondary factors potentially present in the dataset. Subsequently, constrains were introduced, implementing the a-value approach [68] to the primary organic aerosol (POA) factors. A detailed description of the applied PMF strategy can be found in Section S1.2 (Figures S2–S5, Table S1) in the Supplementary Materials. In brief, first the traffic-related hydrocarbon-like organic aerosol (HOA) factor was constrained tightly (0.02 < a < 0.2). Since no evidence of a cooking organic aerosol (COA) factor could be identified (see scatterplot of f55 vs. f57 and discussion in Figure S3), only a biomass-burning organic aerosol (BBOA) factor was constrained as a next step for the winter dataset, applying less strict a-values (0.2 < a < 0.6). For the summer dataset, a constrain was applied only for the HOA factor. No BBOA factor was identified in summer since the f60 contribution was mostly below 0.3% [72], with the few points above this threshold mostly associated with signal-to-noise ratios below 2. The rest of resulting factors in both seasons, including secondary organic aerosol (SOA), were left unconstrained. All abbreviations used in the text are gathered in Table S2 at the end of the Supplementary Materials.
The quality of model outputs (FPs and respective time series) was assessed by exploring performance metrics, e.g., solutions minimizing the Q/Qexp ratio while limiting the magnitude and/or temporal structures in model residuals. Environmentally sound model solutions were determined by comparing resulting FPs to spectra found in the literature [71,73,74,75]. The optimum combination of a-values applied, was determined by investigating the correlation between factor contributions and other source-specific tracers [76].

3. Results and Discussion

3.1. Comparison of ACSM Data with Filter-Based Analyses

Scatterplots between daily-averaged online and offline measurements (and also the respective daily time series), for the two campaigns combined, are presented in Figure S6. The results displayed a very good agreement for sulfate and nitrate (r2: 0.84 and 0.80, respectively) between the two methods (this was also valid for ammonium ions, but not for chloride due to the differences between the very fine non-refractory ammonium chloride measured by the ACSM and the coarser sodium chloride that participated in the PM2.5 fraction). A very good correlation (r2 = 0.80) was also found between OA and OC, with a slope of 1.63. It is expected that the actual OA concentrations in PM2.5 would be slightly higher than those measured by the ACSM due to the small amount of organic particles concentrated in the intermodal range [77]. However, the obtained slope is rather indicative for OA/OC ratios (1.4–1.8), being reported for traffic-impacted urban sites [78]. Black and elemental carbon daily average concentrations at P1 also correlated strongly (r2 = 0.79), although BC recorded higher concentrations, possibly due to a contribution of non-EC light-absorbing particles, inadequate compensation for multi-scattering effects and a somewhat different mass absorption cross-section for aerosols in Piraeus compared to the default value used by the aethalometer [26,79].

3.2. Composition of Submicron Aerosol and Black Carbon

3.2.1. Winter Period

Descriptive statistics for the main species are presented in Table 1. Mean diurnal cycles and time series of hourly concentration values are shown in Figure 2 and Figure 3, respectively. The mean wintertime PM1 concentration, calculated as the sum of ACSM components plus BC [80], was 22.8 μg m−3. These concentrations were comparable and well-correlated with PM2.5 measured concurrently at the PEI-1 traffic site (21.6 μg m−3, r2 = 0.88), indicating that local anthropogenic sources drove a substantial part of the variability at P1. Daily mean concentrations exceeded 25 μg m−3 (the WHO short-term guideline for fine particles) on 39% of the days in winter, with a maximum of 47 μg m−3 (including a nighttime 130 μg m−3 hourly value), highlighting the severity of short-term exposure in the center of Piraeus.
OA was the dominant component in wintertime, averaging 13.9 μg m−3 and contributing 61% to the estimated PM1 mass. The mean contribution was comparable to those reported for successive winter periods during 2013–2017 at the urban background THI site (from 65% in winter 2013–2014 to 56% in winter 2016–2017) [49], implying that it is not only vehicular traffic and port activity that regulates the excessive wintertime OA concentrations in Piraeus (reaching 90 μg m−3 on an hourly basis).
It is evident from the diurnal cycle of OA (Figure 2a) that its nocturnal levels were greatly enhanced, with peak hourly mean values recorded in the 23:00–3:00 timeframe. This is attributed to residential heating emissions coupled with the shallow wintertime boundary layer and low-wind conditions. The high wintertime levels of OA in Piraeus definitely exceed those reported at European and North American urban sites (e.g., Helsinki and Atlanta) [81,82], even where biomass burning was recognized as a major source [83]. Although period mean concentrations are lower compared to Chinese megacities such as Beijing and Nanjing [84,85], their observed peaks during extreme haze episodes are in the same order of magnitude as the maxima in Piraeus.
The diurnal cycle of OA was bimodal, which is not commonly observed even at urban sites, and differed from the unimodal cycle (nighttime maxima) recorded at the urban background THI site in past winters [49]. However, a similar bimodal cycle was observed for online OC measurements during the cold period at a traffic site in central Athens [86]. Comparing the OA diurnal profile to those of source-specific ΒC components (Figure 2a), it can be seen that BCbb also reached a maximum in the same evening timeframe, highlighting the impact of RWB emissions on OA levels. For the verification, OA was excellently correlated (correlation matrices provided in Figures S7–S9) with BCbb (r2 = 0.91, slope: 6.20) during the night hours (18:00–6:00). It is noteworthy that very increased short-term OA levels with peak concentrations exceeding 50 μg m−3 were seen on six occasions, all nighttime episodes characterized by high BCbb contributions (Figure 3a).
Conversely, BCff presented a typical traffic-related bimodal cycle, with levels peaking during morning and evening rush-hours. The latter peak was observed at 20:00, with concentrations decreasing afterwards [87], probably negating a significant impact from the residential use of heating oil. The BCff morning traffic peak was registered at 8:00, with levels starting to escalate from 5:00, indicative of commercial HDV traffic activity [88] in the port area. While OA also presented a daytime maximum, its time of appearance was less consistent on a day-to-day basis, depending on the intensity of local sources [89] and suggested that the daytime OA source attribution should be more complex.
BC was a significant contributor to PM1 mass in winter (16%) as it originated from a combination of car traffic, port-related and RWB sources, with its levels largely enhanced (51%) during the night hours (18:00–6:00). The wintertime BC contribution to fine aerosol was higher than that observed at THI in Athens (11%) [26] and comparable to values reported for polluted Asian megacities, such as Delhi (15% for BC/PM2.5) [90]. The observed levels, with a mean of 3.7 μg m−3 and hourly maxima approaching 30 μg m−3 were among the highest observed in European cities [91,92]. The mean concentration was significantly higher (33%, p < 0.01) than at THI (2.8 μg m−3). The average BB% fraction (BCbb/BC) was 34% and comparable with findings at other urban sites affected by RWB [93]. Most of the peak BC hourly values exceeding 15 μg m−3 were associated with high BCbb (Figure 3a). The average BC fractionation presented similarities with results from AE33 measurements (mean BB%: 32%) in successive winters at THI [26], although nighttime mean BB% contributions were relatively lower at P1. Despite being comparable to the THI BCbb levels, the points in the diurnal cycle of the BB% fraction at P1 did not exceed 45% at nighttime, in contrast to Athens, thus denoting a substantial BCff contribution throughout the day in Piraeus.
The effect of different BC sources was reflected by the diurnal cycles of the source-specific BC components but also by their wind-dependence (polar and annular plots in Figures S10 and S11). BCbb concentrations maximized during the night, under stagnant conditions or low winds [18,25,49] from the urban area inland, indicating the impact of local nighttime emissions. While this pattern was repeated to a certain extent for BCff, there was also an enhancement for winds from the port sector, related to vehicular and shipping emissions. This pattern can be more readily understood by the comparison with wind plots of NOx (enhancement for low winds of the northeast sector, twice a day) and SO2 (an indicator of shipping emissions, presenting large enhancements for flows from the port sector to the west, which intensify around midday [94]). The patterns observed for BCff and NOx, with wind-dependence indicative of traffic, port activity and residential heating, were reproduced also by OA [35].
BC concentrations at P1 were compared to those concurrently measured at the background location P2 to provide an estimate of the urban enhancement in Piraeus (ΔBCu), which was expected to be mainly related with traffic and emissions around the passenger port [95]. Indeed, the calculated ΔBCu parameter (BC660nm at P1 minus BC637nm at P2) was strongly correlated with BCff at P1 (r2 = 0.77), which in turn was directly associated with NOx (r2 = 0.74). The average ΔBCu enhancement was substantial (1.7 μg m−3, 45% of mean BC at P1) but, at the same time, indicative of a strong BC background, most likely driven by residential and shipping emissions in the wider area of Piraeus, including the commercial port sector. The BCbb component was less strongly correlated with ΔBCu (r2 = 0.50), but, on the contrary, presented a high correlation (r2 = 0.79) and similar mean levels (~1.3 μg m−3) with BCbb recorded concurrently at THI in central Athens. This result is markedly different from the findings of studies in Europe and North America, which, when assessing the spatial variability of BCbb, tended to report much higher BCbb concentrations at background sites, as opposed to downtown urban locations [96,97]. This spatial uniformity observed between different parts of the GAA indicates the magnitude of the wintertime RWB issue and carries important implications for population exposure [98]. Moreover, these intense residential emissions enhance the importance of BC as a parameter of climatic relevance due to atmospheric heating [99]. The mean winter AAE370–950 at P1 was 1.43 (ranging in 0.85–2.08) with a characteristic day/night pattern, as it increased from 1.35 in daytime to 1.52 in nighttime due to the abundance of aerosols produced by biomass burning (black and brown carbon), which absorb strongly at shorter wavelengths [57].
Regarding the major inorganic species, SO42− contributed 11% to PM1, NO3 6%, NH4+ 4% and Cl also had a minor contribution (1%). The diurnal cycle of sulfate displayed minimal variability (2.1–2.9 μg m−3), in agreement with its regional character, which was extensively documented in the GAA [18,77,100]. The mean sulfate concentration at P1 (2.5 μg m−3) was similar to mean values recorded in previous winters at THI (2.2–2.6 μg m−3) [49]. Apart from the expected association with the ammonium ion (r2 = 0.72), its correlation with other aerosols and gaseous parameters was moderate-to-low, irrespective of source-related wind sectors, indicating a minor impact from local sources. Sulfate concentrations were unrelated to SO2 measured at PEI-1, and while the NOx/SO2 ratio at PEI-1 decreased significantly when examining data for winds of the S-W sector (port), a fact indicative of shipping emissions of sulfur oxides, sulfate levels did not present an analogous increase but instead decreased by 24%, respective to the mean. Moreover, there were no correlation patterns with relative humidity, which have been reported as indicative of the local-scale formation of sulfate in port-industrial areas through short-term heterogeneous processes [101]. Overall, the present observations are indicative of sulfate in the cold period of the year being mainly associated with northern synoptic scale winds that transport aerosols from continental Greece, the Balkans and Eastern Europe [100], as can be observed in the PSCF plot of Figure S12a. Accordingly, the wind plots of Figures S10 and S11 show a dispersal of mid-to-high levels of sulfate for winds from the northern sector. A characteristic buildup of sulfate levels can be seen during 19–21 December (80% higher compared to the winter mean), a period when moderate, constant winds from N-NE directions were observed (Figure 3a). As SO2 levels did not record any increase during this time, this pattern can indicate the transport of rather processed aerosols.
In contrast to sulfate, nitrate produced a bimodal diurnal cycle in winter [85,102]. While the nighttime peak is known to be related to the fast processing of BB emissions [25,49], the morning peak trailed that of BCff by two hours and was much more distinct than the small morning hump observed at THI in the past [49]. This provides an indication of local nitrate production through the fast atmospheric conversion of NOx emissions, most likely co-emitted with ammonia by vehicles [35], in the cool winter conditions that prevent evaporative losses [103]. Nitrate was correlated well with the ammonium ion (r2 = 0.62), with BCbb especially in nighttime (r2 = 0.69; Figure S8b) and more modestly with BCff and NOx during the daytime (r2: 0.36, 0.37, respectively; Figure S8a). In contrast to what was observed for OA and sulfate, nitrate mean levels in Piraeus were similar or lower compared to urban sites in Central/Northern Europe, probably due to the lower temperatures and the more abundant ammonia emissions facilitating the neutralization of nitric acid, in the latter case [104]. Chloride levels were low in terms of median value (0.1 μg m−3), but were inflated as an average (0.2 μg m−3) by the presence of some conspicuous nocturnal events, associated with intense BB and stagnant conditions or weak winds from NE directions. Hence, chloride presented a substantial correlation (r2 = 0.43) with BCbb. The correlation with ammonium (r2 = 0.51), mostly driven by late-night to early-morning peaks for both species, as also indicated by the maxima in their diurnal variation (Figure 2a), points to NH4Cl condensing to the particulate phase [105], favored by elevated RH and decreased acidity during the night [106]. As can be seen in Figure 3a, all of these high ammonium and chloride values (observed mainly on 24 and 29 December, and 9 January) were present in the context of nighttime BB episodes that were prolonged for several hours until the early morning.

3.2.2. Summer Period

The estimated mean PM1 concentration in summer (14.8 μg m−3) was significantly reduced compared to winter (35% reduction, p < 0.01), with daily and hourly maxima of 26 and 34 μg m−3, respectively. These levels indicate an absence of important air quality events and generally improved conditions compared to winter, linked to the deactivation of the residential heating source and the enhanced summertime aerosol dispersion [107]. PM1 levels at P1 were significantly (p < 0.01) lower compared to PM2.5 at the PEI-1 roadside traffic site, where a mean of 17.4 μg m−3 was recorded.
OA remained the dominant PM1 component (48% on average), but was likewise characterized by a lower mean concentration compared to winter (7.1 μg m−3, 49% reduction) and limited short-term variability (with an hourly maximum of 16 μg m−3). However, these levels were substantially higher than those reported at the urban background THI site in Athens during past summers (5.4 μg m−3) [49], justifying a measurable input from local sources. The summertime diurnal cycle of OA (Figure 2b) was mostly flat [35,81], with hourly means varying between 6–8 μg m−3 and only a minor hump around the morning rush hour (this was also present in the mean weekday cycle, but not at weekends). This variability pattern is attributed to the combination of local sources with photochemically formed and regionally transported organic particles, since the summertime levels of the latter in the GAA are known to peak during midday and afternoon [108]. As a result, the OA correlation with BCff was weaker than in winter (r2 = 0.17, improving to 0.38 for daytime-only data; Figure S9a). A similar seasonal pattern between organic aerosols and primary elemental or black carbon is often observed due to the photochemical formation of secondary organics [109,110]. However, weekday OA levels here were still higher than at weekends (24%, p < 0.01), indicating the substantial effect of primary sources. On the other hand, OA was more closely associated with sulfate (r2 = 0.58), which supports the elevated baseline and limited variation in its diurnal cycle. The OA wind plots (Figures S13 and S14) were markedly different compared to winter, with enhanced concentrations linked to S-SW flows throughout the day, suggesting the influence of sea breeze circulation [111].
Mean BC levels, while contributing 19% to PM1, were reduced compared to winter (2.8 against 3.7 μg m−3, p < 0.01, 19% of PM1); however, this is attributed to the large decline in the BCbb component (72%, p < 0.01), which, in the absence of local RWB, registered an average of 0.4 μg m−3. Such low BCbb levels are comparable with regional background levels in the Eastern Mediterranean that are mostly related with long-range transported smoke from agricultural burning and wildfires [112]. Conversely, summertime BCff levels matched those in winter (2.4 μg m−3), in spite of improved dispersion conditions, highlighting the enhancement of port-related BC emissions (traffic and shipping). This comes in contrast to the seasonal pattern at THI, where BCff levels declined significantly (20%, p < 0.01). Such seasonal homogeneity is not frequently observed for BCff in European cities [113], but can be occasionally seen at traffic sites [114] and sites in port areas [35].
While the mean diurnal BCff cycle was unimodal, with a prominent morning traffic peak (a pattern present mostly during weekdays, when BCff increased by 51% on average), the baseline remained high during midday (2.1 μg m−3 in 10:00–18:00 against 1.9 μg m−3 in winter), notwithstanding the large development of the mixing layer in this timeframe. It is indicative that the mean BCff concentration was largely enhanced (4.0 μg m−3) for data corresponding to S–W wind directions (port sector). The wind plots (Figures S13 and S14) for BCff in summer show a much more distinct impact from the port area compared to winter, that intensified in the morning rush hour and persisted throughout the day. It can be argued that the activity in the port (including both shipping and vehicular emissions) is more important for defining BCff levels in summer, judging from the clear S–SW effect to SO2 (shipping emission indicator) and NOx (general combustion indicator, strongly related to diesel emissions), against the local roadside influence observed for CO (indicator mostly of gasoline vehicle emissions in summer [115]). A very similar BC wind-dependence, indicative of emissions from the port sector, was observed in Civitavecchia, Italy, another major passenger port in the Mediterranean [116]. On the contrary, a period of low BCff concentrations can be observed during 25 June–1 July (Figure S3b), when the Etesian wind regime prevailed, with strong (53% enhanced compared to the period mean) winds of the northern sector blowing throughout the day and sweeping port emissions away from the measurement site.
The inter-site BC correlation between the P1 (BC660nm) and the P2 background site in Piraeus (BC637nm) was greatly reduced (r2 = 0.29) compared to winter (r2 = 0.78) when RWB leveraged the spatial uniformity. Similarly, there was a decrease in the correlation of BC between P1 and THI (r2 = 0.30 vs. 0.63 in winter), reflecting the effect of local emissions around the port. The average enhancement at P1 compared to P2 (ΔBCu) was slightly lower in summer and correlated less strongly with BCff (r2 = 0.61), also suggesting the substantial impact of port activities at the background site. The absence of RWB emissions also led to lower mean AAE370–950 values in summer (1.22, ranging from 0.86 to 2.46) than in winter, with limited diurnal and weekend–weekday variability [117].
Sulfate doubled its average contribution to PM1 in summer (3.3 μg m−3, 22%). It correlated excellently with ammonium (r2 = 0.93), with a mean sulfate/ammonium ratio of 2.81, which suggested a high degree of neutralization similar to ammonium sulfate and, most likely, less acidic aerosol compared to winter (as indicated by the ACSM ion balance when examining NH4+ neutralization) [30,118]. The diurnal variation of sulfate presented the typical post-noon enhancement that extended to a plateau until the evening. While this pattern has been linked to the vertical mixing of regionally transported ammonium sulfate in parallel with the evolution of the mixing layer (this regional influence for the upper 25th percentile of concentrations can be seen in the PSCF plot of Figure S12b), the wind plots also displayed an increase for stronger winds from the SE-SW and NW sectors (Figures S13 and S14). This might provide an indication of converted primary SO2 from shipping emissions in the Saronic and Eleusis Gulfs. When calculating the particulate S to the total S ratio (Sp/S: sulfate to the sum of sulfate and SO2; concentrations in μgS m−3), a large increment compared to winter was observed (0.26 vs. 0.09), which can be thought of as indicative of the gas-to-particle conversion of SOx originating from heavy oil combustion [30,101]. The ratio increased for higher relative humidity values (0.35 for RH > 70%) and its diurnal cycle showed an enhancement in the afternoon to evening hours (16:00–20:00), which, compared to time of the wind-related enhancement of SO2 around noon, allows for several hours to facilitate the conversion. A period with elevated sulfate concentrations (by 61% compared to the summer mean) can be seen on 19–22 June (Figure S3b), with an increased Sp/S ratio of 0.37, under very low winds (mean speed <1 m s−1), mainly from the SE-SW.
Concentrations of nitrate and chloride were very low (averages of 0.46 and 0.03 μg m−3, respectively), consistent with their depletion under warm conditions [119]. Therefore, both ions recorded their highest levels in post-midnight and early morning hours. Nitrate levels showed an increase in 18–22 June (Figure S3b), a period when increased sulfate from local processing was also suspected, and may be related with oxidative conditions favorable for the production of secondary ions. This is also indicative of O3 concentrations at PEI-1 in this period that were elevated by 13% against the period mean, which, considering the type of the measurement site (roadside traffic), is substantial.

3.3. Sources of Organic Aerosol

3.3.1. Winter Period

A five factor solution was extracted from the PMF analysis on winter data. The five OA components were characterized as hydrocarbon-like OA (two components: HOA-1 and HOA-2), biomass-burning OA (BBOA), less-oxidized oxygenated OA (LO-OOA) and more-oxidized oxygenated OA (MO-OAA). The solution was repeatable, with a limited variability of factor profiles between different runs, while modeled OA (i.e., the sum of all deconvolved factors) correlated excellently with measured OA (Table S1). HOA-1 and BBOA were constrained factors while the remaining three emerged from the solution, presenting distinct spectral characteristics, degrees of oxidation and temporal patterns. The source profiles for winter are presented in Figure 4a (Figure 4b shows the source profiles for summer; see Section 3.3.2). Furthermore, diurnal cycles of OA components are shown in Figure 5, average contributions in Figure 6 and time series of contributions in Figure S15.
HOA-1: The source profile of HOA-1 was constrained according to the HOA profile determined by measurements and PMF analysis in Paris [73] and was dominated by fragments related to the non-oxygenated alkane/alkene series (m/z: 27, 29, 41, 43, 55, 57, …). The HOA-1 profile was excellently correlated with traffic-related HOA factors found previously in studies in the GAA and other cities (Figure S16a). The concentrations of HOA-1 correlated highly with BCff at P1 (r2 = 0.63) and also substantially with NOx (r2 = 0.43) (Figure S7a) and benzene (r2 = 0.42) at the PEI-1 roadside station, indicating its association with vehicular traffic. The absence of a significant weekday/weekend pattern is interesting (mean concentration higher by 4% on weekdays, p > 0.05) and possibly suggests the impact of local emissions in the vicinity of the site, which, being downtown, experiences substantial traffic even at weekends, and especially during the nights of the late-December holiday period. When examining this contrast separately for daytime/nighttime, it appears that in the daytime (06:00–18:00) HOA-1 concentrations were indeed higher during weekdays (36%, p < 0.01), while for nighttime data (18:00–6:00), HOA-1 weekend concentrations were higher (24%) but not significant (p > 0.05). This combined weekday/weekend and day/night variability pattern for HOA was also observed at an urban site in Beijing during winter [84]. The overall diurnal cycle of HOA-1 concentrations was bimodal (Figure 5a), with a morning rush hour peak at 10:00, similar to the one of BCff, and a nighttime plateau (21:00–02:00), the latter characteristic of evening traffic emissions in the stable nocturnal boundary layer. The CPF polar plot (Figure S18) for fractional contributions of HOA-1 (75th percentile) indicates a large enhancement for weak-to-moderate winds from the S–SW sector, representing the impact of traffic in the Piraeus central and coastal roads, as well as a possible input of shipping emissions at the passenger port. The factor contributed 12% (1.7 μg m−3) of the total OA in winter (Figure 6a), with a daily maximum of 4.6 μg m−3.
HOA-2: While the profiles of HOA-2 and HOA-1 had similar main features (i.e., primary hydrocarbon fragments), the former appears to be slightly more oxidized, with relatively enhanced contributions at m/z 44 and 18, most likely suggesting a longer atmospheric residence time compared to the more local HOA-1. Moreover, the contributions at m/z 55, 57, with respect to m/z 41, 43, were lower when compared to the HOA-1 profile, a feature that was related to container ship exhaust plumes [120]. Correlations with BCff and other primary gases for HOA-2 were lower than for HOA-1. However, HOA-2 was better correlated than HOA-1 with LO-OOA (r2: 0.64 vs. 0.46) during daytime, supporting a certain degree of processing. Its concentrations were significantly higher during daytime (110%, p < 0.01) and weekdays (43%, p < 0.01), still indicative of anthropogenic activity in the medium spatial scale. The morning maximum of HOA-2 concentrations trailed the respective cycle of HOA-1 by 2 h; however, there was no nighttime peak. It can be argued that this pattern is linked to local atmospheric circulation that transports aerosols from the wider port area to the center or Piraeus, as western onshore flows intensify at midday. Examining the CPF plot (Figure S18) of fractional HOA-2 contributions, the highest probabilities of exceeding the 75% percentile were associated with relatively strong winds from W-NW directions, implying an impact from the commercial sector of the port, as well as from shipping/industrial activity in the Gulf of Eleusis and the Thriassion Plain (Figure 1a) [24,121]. The mean contribution of HOA-2 to OA was 18% (2.5 μg m−3), with a daily peak concentration of 5.4 μg m−3, while its mean contribution was the highest among components for winds of the SW-NW sector (28%). The combined fraction of the two HOA components was 30% (Figure 6a), which is a large fossil fuel combustion contribution compared to other urban locations [122,123,124,125], but nevertheless reasonable, considering the central placement of the site in a particle pollution hotspot.
BBOA: The characterization of the BBOA component, that was constrained based on the respective profile from the meta-analysis of Ng et al. [74], was straightforward, with the mass spectrum being characterized by the presence of the fingerprint ions at m/z 60 and 73, which derive from the fragmentation of pyrolytical products of cellulose [126]. The factor profile of BBOA was quite similar to factors obtained for OA in the GAA in previous studies and elsewhere (Figure S16b), although not at the level observed for HOA-1, as expected by the differences in burning conditions, atmospheric residence time and proximity to the source. BBOA concentrations were excellently correlated with BCbb (r2 = 0.88); therefore, a similar diurnal cycle was presented, with a nocturnal enhancement of concentrations in 23:00–2:00 [68]. This factor was also correlated with nitrate (r2 = 0.69) and chloride (r2 = 0.57) (Figure S7a). Fresh BB smoke is known to produce compounds such as KCl and KNO3 [125] that can also interact with co-emitted ammonia to form the ammonium compounds detected by the ACSM [127]. Nighttime mean concentrations were more than three times higher (3.7 vs. 1.2 μg m−3) but the weekday–weekend variability was not significant (mean concentrations higher by 6% at weekends, p > 0.05), This most likely verifies the constant use of biomass for space heating, and not recreational purposes, at weekends, as reported in other cases [83,122]. The CPF plot in Figure S18 validates the association of the BB source with stagnant conditions or low-to-moderate N–NE winds that prevail during winter nights and promote either the accumulation of emissions produced locally or the local transport from residential areas upwind in the GAA [18,25]. BBOA accounted on average for 17% of OA (2.4 μg m−3) in Piraeus during winter (Figure 6a). Compared to the BBOA mean winter fractions estimated in past winters (2013–2017) at THI in central Athens (9–12%) [49], the mean contribution in Piraeus appeared enhanced. Again, this contrasts with other European metropolitan areas, where BBOA from residential heating is reportedly higher for urban and suburban background sites rather than for downtown locations [125]. Unlike HOA-1 and HOA-2, BBOA was more episodic in nature, registering daily and hourly maximum concentrations of 8.0 and 30.4 μg m−3, respectively. These values were recorded on 9 January 2019 (Figure S15a), with the hourly peak observed in the early hours of the day, under calm conditions and near-zero temperatures (~2–2.5 °C), in the aftermath of an uncommon snowstorm impacting the GAA and amplifying space heating demands.
LO-OOA: The profile of the processed LO-OOA component was characterized by enhancements in characteristic m/z fragments at 44 and 18, related with decarboxylation and dehydration of oxygenated ambient aerosols, respectively, while retaining the hydrocarbon peaks [74]. The source profile presented similarities with those reported for winter periods in central Athens for semi-volatile OOA linked to oxidized RWB emissions [49,75]. In fact, the LO-OOA factor correlated (r2 = 0.82) with an SV-OOA (semi-volatile OOA) factor identified for the winter period of 2016-17 at THI, and even more with the SV-OOA factor identified for the winter of 2015-16 (r2 = 0.94) [49]. The spectral characteristics and temporal variability of the component suggest that it was associated with rapid atmospheric formation processes. LO-OOA correlated with BCbb (r2: 0.77 for the full winter dataset, 0.82 for nighttime only) while traces of m/z 60, 73 were present in its spectrum, suggesting that the processing of fresh BB emissions leads to LO-OOA formation in winter [73,83,128]. The diurnal cycle starts escalating in the evening (18:00) and maximizes (0:00) concurrently with BBOA, likely indicating a very fast oxidation rate [129]. This process was also favored by the lower nighttime temperatures (Figure S1) that prevent the loss of semi-volatile compounds constituting LO-OOA [85]. Similar to BBOA, LO-OOA was well-correlated with nitrate and chloride (r2: 0.69 and 0.51, respectively). However, in contrast to BBOA, the diurnal cycle of LO-OOA also presented a notable midday peak [81], that was mostly due to data corresponding to weekdays and could be related with the conversion of fresh traffic- and port-related emissions. This dual character of LO-OOA could be traced in its CPF plot (Figure S18), with enhancements for calm and low winds from the NE and to a lesser extent for stronger winds from the W-NW. In fact, during daytime, LO-OOA recorded the highest correlation with HOA-2 among components (r2 = 0.64). The mean LO-OOA fraction (Figure 6a) was estimated at 30% (4.3 μg m−3), with daily and hourly maxima of 13.8 and 53.2 μg m−3, respectively, that were observed simultaneously with BBOA maxima on January 9. Under the hypothesis that all nighttime LO-OOA is attributed to processed BB emissions, it can be reasoned that the combined contribution of biomass burning, both directly (BBOA) and indirectly (nighttime LO-OOA), would rise to 37% of OA (up to 50% in winter nights), highlighting that, even in the port-city of Piraeus, RWB is the major source of organics in winter.
MO-OOA: The mass spectrum of the MO-OOA component, which corresponds to aged aerosols, was distinguished by the stronger fraction at m/z 44 and 18 and the near absence of the hydrocarbon series (m/z 41, 43…) yielding a high f44 to f43 ratio (4.8), compared to the one calculated for LO-OOA (0.89). The MO-OOA FP correlated excellently with FPs for OOA and LV-OOA (low-volatility OOA) factors from earlier studies in the GAA and elsewhere (Figure S17). Values ranging from 0.90 to 0.99 were found for r2 compared to the LV-OOA spectra for the winter seasons at THI [49], while r2 was 0.93 when compared to OOA at a regional background site in the Eastern Mediterranean [112]. An excellent correlation (r2 = 0.97) was also found when comparing with the average spectrum of LV-OOA factors derived from various sites across Europe [71], as well as the average profile of LV-OOA (r2 = 0.96) from an ensemble of sites in North America, Asia and Europe [74]. Consistent with a more regional origin, MO-OOA was the component most correlated with sulfate and ammonium, especially during the daytime (r2: 0.39 and 0.49, respectively). Compared to the other components, the diurnal variability of MO-OOA seems relatively flat [123,130], with mean hourly concentrations ranging from 2.7 to 4.0 μg m−3. Considering the nighttime boundary layer effect for the appearance of enhanced levels, it should be expected that MO-OOA inputs from regional transport intensified in the 10:00–14:00 timeframe, in spite of strong atmospheric mixing [131]. Supporting the hypothesis that MO-OOA represents a background aerosol category that is spatiotemporally uniform and mostly extraneous to local anthropogenic activity, the weekend/weekday and daytime/nighttime contrasts were not statistically significant at the 0.05 level [84,122]. The regional transport of aerosol in the GAA was consistently linked to advections from the northern sector under synoptic-scale circulation [18,49], and this was repeated in the CPF plot for MO-OOA (Figure S18), showing high probabilities of increased contributions for strong northern winds. This was also verified by the PSCF plot in (Figure S12c), which showed the spatial extent of transport to be confined within the Balkan Peninsula. The mean contribution (Figure 6a) of MO-OOA (23%, 3.2 μg m−3), combined with the concentration of ammonium sulfate, constitutes a substantial baseline of regional aerosol in PM1.

3.3.2. Summer Period

Four OA components (Figure 4b) were identified by PMF analysis in the summer dataset. Their source profiles presented similarities with those determined in winter; therefore, the components were named accordingly. The exception was BBOA, which could not be identified in the summer period, due to the absence of local biomass burning (Section S1).
HOA-1: HOA-1 in the summer dataset was constrained using the same anchor profile as in winter, albeit with a higher a-value (0.1 vs. 0.02 for winter), and the two resulting spectral profiles were very similar (r2 = 0.99). The component was again correlated with BCff (r2 = 0.34), but to a smaller degree than in winter, with correlations slightly enhanced for daytime data (r2 = 0.49; Figure S9a). This winter–summer correlation pattern can be supported when comparing it with cases where primary sources dominated (strong correlations) at urban sites, such as in Delhi [132], and where secondary sources became more important (weaker correlations), such as at an urban background site in Paris [133]. The diurnal cycle displayed a peak area between 07:00–10:00 that was consistent with morning traffic, but, in a fashion similar to BCff, HOA concentrations remained elevated until the afternoon, again signifying the importance of emissions from the passenger port and the city center under the influence of the sea breeze. Such persistence of HOA levels was mostly observed at urban sites that were affected by heavy traffic during the whole daytime [82,130]. The influence of the passenger port sector is clear in the CPF polar plot (Figure S19). The mean HOA-1 concentration in summer was significantly lower than in winter (38%, p < 0.01); nevertheless, its mean contribution to OA increased to 15% (Figure 6b).
HOA-2: The HOA-2 factor was constrained based on the profile of the respective factor in winter (a-value = 0.2). The two HOA-2 profiles were strongly correlated (r2 = 0.95). In summer, the HOA-2 time series was better correlated with HOA-1 (r2 = 0.67 vs. 0.36 in winter), a pattern created mostly by concurrent high concentration data pairs during winds from the passenger port sector. Excluding the impact of these data by examining the CPF wind plot for percentiles between 50–95°, a similar wind-dependence pattern as the one observed for HOA-2 in winter (Figure S18) could be revealed, indicating again an impact from the western sector (Figure S19). As in the winter period, the morning peak of HOA-2 trailed that of HOA-1 by two hours. While shipping and vehicular traffic data were not available in this study, it was reported in Oakland that HOA related to commercial port emissions tended to increase its concentrations and contributions in the late morning hours and beyond, partially due to a reported increase in drayage activity [40]. The mean contribution of HOA-2 to OA was 14% (Figure 6b). Therefore, the combined HOA components also retained a large contribution to OA (29%) in summer, in spite of improved atmospheric dispersion and the enhanced photochemical processing of primary hydrocarbons. While contributions of HOA in the order of 30% are in the upper echelon of values reported at urban sites in Europe and North America [71,134], they are comparable with the enhanced HOA contribution of 37% reported at the Houston Ship Channel, under the joint impact of vehicular and shipping emissions [39].
LO-OOA and MO-OOA: Both OOA components were obtained as unconstrained factors. The LO-OOA source profile in summer had some differences compared to the winter one (r2 = 0.83), specifically a higher degree of oxidation (higher m/z 44 compared to m/z 43) and the absence of BB-related fragments (m/z: 60, 73). The f44 to f43 ratio was higher in comparison to winter (2.0 vs. 0.9), reflecting a higher degree of oxidation. The retrieved LO-OOA profile showed similarities to the average SV-OOA profile (r2 = 0.9) from 25 European sites [71], as well as the mass spectrum of laboratory-simulated, photochemically oxidized diesel exhaust plumes [135]. While the diurnal cycle of LO-OOA presented a minor hump around noon that could be related to the photo-oxidation of HOA, its highest levels were observed in nighttime under lower temperatures (Figure S1), indicating that its variability could depend on the temperature-driven, gas-to-particle partitioning of oxidized species. Therefore, it is reasonable that LO-OOA presented its highest correlation among PM1 species with nitrate (r2 = 0.40). It is noted that the nighttime enhancement of LO-OOA was much less pronounced compared to that at THI in summer, even though the mean period levels were similar (1.8–1.9 μg m−3) [49].
In contrast to LO-OOA, the more oxidized MO-OOA component produced a profile highly comparable to the one in winter (r2 = 0.98). Its concentrations and especially its fractional contributions maximized during the post-noon hours, suggesting an input from photochemically oxidized organics [136], in a similar way to the results reported for the urban background THI site [49] and a suburban background site in the northeastern part of the Attica basin [108]. MO-OOA was not particularly well-correlated with sulfate (r2 = 0.24) or other ACSM compounds, recording its highest correlation with OA (r2 = 0.36) to which it was the most major contributor during summer. Sulfate was not outright correlated with either of the OOA components in summer, but, given its dual character discussed in Section 3.2.2 (regional transport and local conversion), it had a substantial correlation with the sum of the OOA components (r2 = 0.49). Both OOA components showed higher fractional contributions for moderate-to-strong winds from the north sector (Figure S19), although this was more apparent for MO-OOA. However, this regional impact (Figure S12d) during the study month did not appear related to the usually reported source origins in the Black Sea region [98] but rather to the western Balkans and the polluted Po Valley [137]. LO-OOA recorded significantly lower concentrations at weekends (20%, p < 0.01), similarly to the HOA components (42% and 36% reductions for HOA-1 and HOA-2, respectively). However, MO-OOA, consistent with its regional profile, did not display significant weekday–weekend variability (1% higher in weekends, p > 0.05).
The LO-OOA mean contribution to OA was comparable to the one in winter (27% vs. 30%), and in the absence of BB emissions for processing, showed a more subtle nighttime enhancement (Figure 6b). On the other hand, MO-OOA, that preserved its mean levels in summer (6% lower compared to winter, p > 0.05), almost doubled its mean contribution (44%). The combined fraction of OOA components (71%) reveals the importance of SOA during summer, even in the polluted environment of a port city like Piraeus.

4. Conclusions

The study analyzed seasonal measurements (monthly periods in winter and summer) from online instruments (ACSM and multi-wavelength aethalometer) for submicron aerosol speciation in Piraeus, a large Greek city in the Greater Area of Athens and a major European port.
In general, the concentrations of ACSM components were notably higher than those observed at urban sites in other Mediterranean cities [35,138,139], especially during winter. For OA, BC, nitrate and even submicron chloride, this difference in wintertime levels was mainly driven by residential wood burning (RWB). Although RWB emissions are a cause of concern all over Europe, Greek cities face a particularly serious problem, since wood-burning as a source escalated rapidly in the setting of the Greek recession and has been unregulated for almost a decade, despite the established scientific knowledge about its public health impacts [98,140]. Organic aerosol from biomass burning and the fast processing of its emissions can account for more than 35% of OA in winter and, consequently, more than 20% of non-refractory PM1. These can be considered substantial contributions, given the number and diversity of local sources, and point to an additional air pollution mitigation opportunity, in excess of cutbacks in port emissions (e.g., traffic routing, regulation of marine fuels, cold ironing, etc.). Considering the different diurnal pattern of biomass burning and fossil fuel combustion sources in winter (and also the fact that residential burning in stoves and fireplaces also aggravates indoor exposure), combined with the limited weekday-weekend variability, the respiratory function of residents in the entire area of Piraeus may come under constant pressure. This is highly important, taking into account the potential of pyrogenic species (e.g., water-soluble organics, polyaromatic compounds) to promote inflammation in the respiratory tract and induce short- and long-term toxicity. In view of these, and given the proof provided in this study that the biomass burning issue permeates the entire area of the Athens basin, measures for the regulation of biomass-burning fuel and emissions at the local scale appear imperative.
The impacts from overall port activities were clearly illustrated by the results, which showed a significant enhancement of carbonaceous aerosol concentrations related to fossil fuel combustion (mainly traffic and shipping), as compared to background sites in the GAA. This enhancement persists during the warm period of the year, in spite of improved atmospheric dispersion, as it coincides with increased activity in the passenger port and daytime onshore flows that transport aerosols from the passenger and commercial port areas. This leads again to constant exposure above an elevated baseline, which is propagated by the increased time spent outdoors in summer and the enhanced infiltration of aerosol in residences. The combined contributions of HOA factors to OA was approximately 30%, demonstrating a substantial year-round impact that should be addressed. While large-scale works to improve public transportation in Piraeus are expected to alleviate the pressure from traffic emissions in the future, elucidating the contribution of shipping, and if possible its various sectors, should be a necessary step before considering measures at the local scale for the mitigation of shipping emissions. Although a first quantification attempt was made in this study, it was found that the distinction between traffic and shipping short-term contributions using only aerosol mass spectrometry could be very difficult. Additional advanced instrumentation, including online trace metal analyzers, VOC monitors and particle sizers, combined with actual information on shipping traffic, would enable a better characterization of marine combustion and ship plumes. In this context, the comparative evaluation of findings from both online and offline source apportionment (filter-based analyses with shipping tracers) could also be valuable.
Processed aerosols were recognized as an important factor in the area, especially in summer when they comprised over 70% of OA. Less-oxidized organics appeared to be associated with the conversion of local emissions from traffic and port activities and also from RWB in winter. Additional measurements of gas-phase condensable organics would be needed in order to further characterize the transformation processes at the local scale and the atmospheric properties that promote them. Furthermore, there was a substantial fraction of more-oxidized OA, unrelated to local emissions and with large contributions, especially in summer (over 40% of total OA). Sulfate was also considered to be mainly of regional origin, even though there were some indications of the rapid gas-to-particle conversion of shipping emissions. The contrast in sulfate levels between Piraeus and cities in the Western Mediterranean is remarkable and was documented also at the regional background site of Finokalia (Crete) against other coastal/rural background sites in the Western Mediterranean basin [76,141]. This pattern can be attributed to the reduction in emissions from coal- and oil-fired power plants in Western Europe as a result of European legislation [142,143], while in the Eastern Mediterranean, regionally transported air masses are still impacted by emissions in the Balkans, Eastern Europe and the Middle East, where the use of sulfur-rich fuels in stationary combustion remains common. In this framework, it is a concern that the ammonium sulfate contribution, combined with that of highly oxidized OA, form a solid background amounting to more than 5 μg m−3 of fine aerosols, which, due to their mostly transboundary character, will be hard to tackle in order to achieve compliance with the new WHO air quality guidelines and the foreseen revision of the EU air quality directive.

Supplementary Materials

The following are available online at https://www.mdpi.com/article/10.3390/atmos12121686/s1, Figure S1: Diurnal box-whisker plots of relative humidity and temperature for winter and summer periods; Figure S2: Factor profiles of winter unconstrained PMF solutions; Figure S3: Scatterplot of f55 vs. f57 for winter data in Piraeus; Figure S4: Diurnal variability of the PMF model residuals and the Q-value for the variable m/z 44; Figure S5: PMF run constraining an HOA factor for summer; Table S1: Brief overview of the constrains and model performance for the selected PMF solutions in the two periods; Figure S6: Comparison of daily average concentrations determined with the online and offline methods; Figure S7: Correlation plot for major species, source factors, BC constituents, NOx and SO2; Figure S8: Winter daytime and nighttime correlation plot for major species, source factors, BC constituents, NOx and SO2; Figure S9: Summer daytime and nighttime correlation plot for major species, source factors, BC constituents, NOx and SO2; Figure S10: Bivariate polar wind plots for the effects of wind direction and wind speed to concentrations during winter; Figure S11: Annular wind plots for the effects of wind direction per hour of the day during winter; Figure S12: Potential Source Contribution Function calculations for sulfate and MO-OOA; Figure S13: Bivariate polar wind plots for the effects of wind direction and wind speed to concentrations during summer; Figure S14: Annular wind plots for the effects of wind direction per hour of the day to concentrations during summer; Figure S15: Time series of the PMF factors, along with key ACSM and aethalometer measurements; Figure S16: Correlation plots for the two primary factor mass spectra obtained in Piraeus; Figure S17: Correlation plots for the two secondary factor mass spectra obtained in Piraeus; Figure S18: Bivariate polar plots for conditional probabilities of threshold exceedance of OA components during winter; Figure S19: Bivariate polar plots for conditional probabilities of threshold exceedance of OA components during summer; Table S2: Abbreviation Table.

Author Contributions

Conceptualization, I.S., G.G., E.G. and N.M.; methodology, I.S. and G.G.; formal analysis, I.S. and G.G.; in situ measurements, I.S., G.G., E.L., P.K., A.B., M.L.; laboratory analysis, K.P., M.T., P.Z.; data curation, I.S., G.G., E.L., D.G.K.; writing—original draft preparation, G.G. and I.S.; writing—review and editing, E.L., P.K., A.B., D.G.K., E.G., N.M.; visualization, I.S. and G.G.; supervision, N.M.; project administration, N.M.; funding acquisition, N.M. All authors have read and agreed to the published version of the manuscript.

Funding

This research is co-financed by Greece and the European Union (European Social Fund-ESF) through the Operational Program “Human Resources Development, Education and Lifelong Learning 2014–2020” in the context of the project “Long-term characterization, in high temporal resolution, of the chemical composition and sources of the atmospheric aerosol over the greater Athens area” (MIS 5047322).

Data Availability Statement

The data presented in this study are available upon request from the corresponding authors, pending on the permission of the funding source.

Acknowledgments

We acknowledge the Regional Authority of Attica for their full support in implementing the measurement campaigns, during which the data used in the present analysis were collected. We are grateful to Urban Rail Transport S.A. for hosting the instruments in its central building in Piraeus. The authors gratefully acknowledge the NOAA Air Resource Laboratory team for the provision of the HYSPLIT transport and dispersion model used in the current work.

Conflicts of Interest

The authors declare no conflict of interest.

References

  1. Atkinson, R.W.; Kang, S.; Anderson, H.R.; Mills, I.C.; Walton, H.A. Epidemiological time series studies of PM2.5 and daily mortality and hospital admissions: A systematic review and meta-analysis. Thorax 2014, 69, 660–665. [Google Scholar] [CrossRef] [Green Version]
  2. Di, Q.; Wang, Y.; Zanobetti, A.; Wang, Y.; Koutrakis, P.; Choirat, C.; Dominici, F.; Schwartz, J.D. Air pollution and mortality in the medicare population. N. Engl. J. Med. 2017, 376, 2513–2522. [Google Scholar] [CrossRef] [PubMed]
  3. European Environment Agency (EEA). Air Quality in Europe—2020 Report; Publications Office of the European Union: Luxemburg, 2020; ISBN 978-92-9480-292-7.
  4. Hammer, M.S.; Van Donkelaar, A.; Li, C.; Lyapustin, A.; Sayer, A.M.; Hsu, N.C.; Levy, R.C.; Garay, M.J.; Kalashnikova, O.V.; Kahn, R.A.; et al. Global Estimates and Long-Term Trends of Fine Particulate Matter Concentrations (1998–2018). Environ. Sci. Technol. 2020, 54, 7879–7890. [Google Scholar] [CrossRef] [PubMed]
  5. Lippmann, M.; Chen, L.C.; Gordon, T.; Ito, K.; Thurston, G. National Particle Component Toxicity (NPACT) Initiative: Integrated epidemiologic and toxicologic studies of the health effects of particulate matter components. Res. Rep. Health. Eff. Inst. 2013, 177, 5–13. [Google Scholar]
  6. Basagaña, X.; Jacquemin, B.; Karanasiou, A.; Ostro, B.; Querol, X.; Agis, D.; Alessandrini, E.; Alguacil, J.; Artiñano, B.; Catrambone, M.; et al. Short-term effects of particulate matter constituents on daily hospitalizations and mortality in five South-European cities: Results from the MED-PARTICLES project. Environ. Int. 2015, 75, 151–158. [Google Scholar] [CrossRef] [PubMed]
  7. Kim, S.-Y.; Dutton, S.J.; Sheppard, L.; Hannigan, M.P.; Miller, S.L.; Milford, J.B.; Peel, J.L.; Vedal, S. The short-term association of selected components of fine particulate matter and mortality in the Denver Aerosol Sources and Health (DASH) study. Environ. Health Glob. Access Sci. Source 2015, 14, 49. [Google Scholar] [CrossRef] [PubMed] [Green Version]
  8. Ostro, B.; Malig, B.; Hasheminassab, S.; Berger, K.; Chang, E.; Sioutas, C. Associations of Source-Specific Fine Particulate Matter with Emergency Department Visits in California. Am. J. Epidemiol. 2016, 184, 450–459. [Google Scholar] [CrossRef]
  9. Kheirbek, I.; Wheeler, K.; Walters, S.; Kass, D.; Matte, T. PM2.5 and ozone health impacts and disparities in New York City: Sensitivity to spatial and temporal resolution. Air Qual. Atmos. Health 2013, 6, 473–486. [Google Scholar] [CrossRef] [Green Version]
  10. Martenies, S.E.; Milando, C.W.; Williams, G.O.; Batterman, S.A. Disease and Health Inequalities Attributable to Air Pollutant Exposure in Detroit, Michigan. Int. J. Environ. Res. Public Health 2017, 14, 1243. [Google Scholar] [CrossRef] [Green Version]
  11. Burwell-Naney, K.; Wilson, S.M.; Tarver, S.L.; Svendsen, E.; Jiang, C.; Ogunsakin, O.A.; Zhang, H.; Campbell, D.; Fraser-Rahim, H. Baseline Air Quality Assessment of Goods Movement Activities before the Port of Charleston Expansion: A Community-University Collaborative. Environ. Justice 2017, 10, 1–10. [Google Scholar] [CrossRef] [Green Version]
  12. Rosenbaum, A.; Hartley, S.; Holder, C. Analysis of Diesel Particulate Matter Health Risk Disparities in Selected US Harbor Areas. Am. J. Public Health 2011, 101, S217–S223. [Google Scholar] [CrossRef] [PubMed]
  13. Houston, D.; Krudysz, M.; Winer, A. Diesel Truck Traffic in Low-Income and Minority Communities Adjacent to Ports: Environmental Justice Implications of Near-Roadway Land Use Conflicts. Transp. Res. Rec. 2008, 2067, 38–46. [Google Scholar] [CrossRef] [Green Version]
  14. Fredrickson, A. The California Coastal Act and Ports: The Unintended Environmental Justice Implications of Preserving California’s Coastline. Coast. Manage. 2013, 41, 258–271. [Google Scholar] [CrossRef]
  15. Viana, M.; Hammingh, P.; Colette, A.; Querol, X.; Degraeuwe, B.; Vlieger, I.D.; van Aardenne, J. Impact of maritime transport emissions on coastal air quality in Europe. Atmos. Environ. 2014, 90, 96–105. [Google Scholar] [CrossRef]
  16. Donateo, A.; Gregoris, E.; Gambaro, A.; Merico, E.; Giua, R.; Nocioni, A.; Contini, D. Contribution of harbour activities and ship traffic to PM2.5, particle number concentrations and PAHs in a port city of the Mediterranean Sea (Italy). Environ. Sci. Pollut. Res. 2014, 21, 9415–9429. [Google Scholar] [CrossRef]
  17. Merico, E.; Conte, M.; Grasso, F.M.; Cesari, D.; Gambaro, A.; Morabito, E.; Gregoris, E.; Orlando, S.; Alebić-Juretić, A.; Zubak, V.; et al. Comparison of the impact of ships to size-segregated particle concentrations in two harbour cities of northern Adriatic Sea. Environ. Pollut. 2020, 266, 115175. [Google Scholar] [CrossRef]
  18. Grivas, G.; Cheristanidis, S.; Chaloulakou, A.; Koutrakis, P.; Mihalopoulos, N. Elemental Composition and Source Apportionment of Fine and Coarse Particles at Traffic and Urban Background Locations in Athens, Greece. Aerosol Air Qual. Res. 2018, 18, 1642–1659. [Google Scholar] [CrossRef] [Green Version]
  19. Sorte, S.; Rodrigues, V.; Borrego, C.; Monteiro, A. Impact of harbour activities on local air quality: A review. Environ. Pollut. 2020, 257, 113542. [Google Scholar] [CrossRef] [PubMed]
  20. Merico, E.; Cesari, D.; Gregoris, E.; Gambaro, A.; Cordella, M.; Contini, D. Shipping and Air Quality in Italian Port Cities: State-of-the-Art Analysis of Available Results of Estimated Impacts. Atmosphere 2021, 12, 536. [Google Scholar] [CrossRef]
  21. Darbra, R.M.; Wooldridge, C.; Puig, M. ESPO Environmental Report 2020 EcoPortsinSights 2020; ESPO: Brussels, Belgium, 2020; Volume 4. [Google Scholar]
  22. Tzannatos, E. Ship emissions and their externalities for the port of Piraeus-Greece. Atmos. Environ. 2010, 44, 400–407. [Google Scholar] [CrossRef]
  23. Grivas, G.; Stavroulas, I.; Liakakou, E.; Kaskaoutis, D.G.; Bougiatioti, A.; Paraskevopoulou, D.; Gerasopoulos, E.; Mihalopoulos, N. Measuring the spatial variability of black carbon in Athens during wintertime. Air Qual. Atmos. Health 2019, 12, 1405–1417. [Google Scholar] [CrossRef]
  24. Kassomenos, P.A.; Vardoulakis, S.; Chaloulakou, A.; Paschalidou, A.K.; Grivas, G.; Borge, R.; Lumbreras, J. Study of PM10 and PM2.5 levels in three European cities: Analysis of intra and inter urban variations. Atmos. Environ. 2014, 87, 153–163. [Google Scholar] [CrossRef] [Green Version]
  25. Theodosi, C.; Tsagkaraki, M.; Zarmpas, P.; Grivas, G.; Liakakou, E.; Paraskevopoulou, D.; Lianou, M.; Gerasopoulos, E.; Mihalopoulos, N. Multi-year chemical composition of the fine-aerosol fraction in Athens, Greece, with emphasis on the contribution of residential heating in wintertime. Atmos. Chem. Phys. 2018, 18, 14371–14391. [Google Scholar] [CrossRef] [Green Version]
  26. Liakakou, E.; Stavroulas, I.; Kaskaoutis, D.G.; Grivas, G.; Paraskevopoulou, D.; Dumka, U.C.; Tsagkaraki, M.; Bougiatioti, A.; Oikonomou, K.; Sciare, J.; et al. Long-term variability, source apportionment and spectral properties of black carbon at an urban background site in Athens, Greece. Atmos. Environ. 2020, 222, 117137. [Google Scholar] [CrossRef]
  27. Grivas, G.; Chaloulakou, A.; Kassomenos, P. An overview of the PM10 pollution problem, in the Metropolitan Area of Athens, Greece. Assessment of controlling factors and potential impact of long range transport. Sci. Total Environ. 2008, 389, 165–177. [Google Scholar] [CrossRef]
  28. Kassomenos, P.; Vardoulakis, S.; Chaloulakou, A.; Grivas, G.; Borge, R.; Lumbreras, J. Levels, sources and seasonality of coarse particles (PM10–PM2.5) in three European capitals-Implications for particulate pollution control. Atmos. Environ. 2012, 54, 337–347. [Google Scholar] [CrossRef] [Green Version]
  29. Thomaidis, N.S.; Bakeas, E.B.; Siskos, P.A. Characterization of lead, cadmium, arsenic and nickel in PM2.5 particles in the Athens atmosphere, Greece. Chemosphere 2003, 52, 959–966. [Google Scholar] [CrossRef]
  30. Siskos, P.A.; Bakeas, E.B.; Lioli, I.; Smirnioudi, V.N.; Koutrakis, P. Chemical characterization of PM2.5 Aerosols in Athens-Greece. Environ. Technol. 2001, 22, 687–695. [Google Scholar] [CrossRef] [PubMed]
  31. Pandolfi, M.; Gonzalez-Castanedo, Y.; Alastuey, A.; de la Rosa, J.D.; Mantilla, E.; de la Campa, A.S.; Querol, X.; Pey, J.; Amato, F.; Moreno, T. Source apportionment of PM10 and PM2.5 at multiple sites in the strait of Gibraltar by PMF: Impact of shipping emissions. Environ. Sci. Pollut. Res. 2011, 18, 260–269. [Google Scholar] [CrossRef] [PubMed]
  32. Pérez, N.; Pey, J.; Reche, C.; Cortés, J.; Alastuey, A.; Querol, X. Impact of harbour emissions on ambient PM10 and PM2.5 in Barcelona (Spain): Evidences of secondary aerosol formation within the urban area. Sci. Total Environ. 2016, 571, 237–250. [Google Scholar] [CrossRef] [PubMed]
  33. Cesari, D.; Genga, A.; Ielpo, P.; Siciliano, M.; Mascolo, G.; Grasso, F.M.; Contini, D. Source apportionment of PM2.5 in the harbour–industrial area of Brindisi (Italy): Identification and estimation of the contribution of in-port ship emissions. Sci. Total Environ. 2014, 497–498, 392–400. [Google Scholar] [CrossRef]
  34. Mohr, C.; Decarlo, P.F.; Heringa, M.F.; Chirico, R.; Slowik, J.G.; Richter, R.; Reche, C.; Alastuey, A.; Querol, X.; Seco, R.; et al. Identification and quantification of organic aerosol from cooking and other sources in Barcelona using aerosol mass spectrometer data. Atmos. Chem. Phys. 2012, 12, 1649–1665. [Google Scholar] [CrossRef] [Green Version]
  35. Chazeau, B.; Temime-Roussel, B.; Gille, G.; Mesbah, B.; D’Anna, B.; Wortham, H.; Marchand, N. Measurement report: Fourteen months of real-time characterisation of the submicronic aerosol and its atmospheric dynamics at the Marseille-Longchamp supersite. Atmos. Chem. Phys. 2021, 21, 7293–7319. [Google Scholar] [CrossRef]
  36. Lu, G.; Brook, J.R.; Rami Alfarra, M.; Anlauf, K.; Richard Leaitch, W.; Sharma, S.; Wang, D.; Worsnop, D.R.; Phinney, L. Identification and characterization of inland ship plumes over Vancouver, BC. Atmos. Environ. 2006, 40, 2767–2782. [Google Scholar] [CrossRef]
  37. Dall’Osto, M.; Hellebust, S.; Healy, R.M.; Connor, I.P.; Kourtchev, I.; Sodeau, J.R.; Ovadnevaite, J.; Ceburnis, D.; O’Dowd, C.D.; Wenger, J.C. Apportionment of urban aerosol sources in Cork (Ireland) by synergistic measurement techniques. Sci. Total Environ. 2014, 493, 197–208. [Google Scholar] [CrossRef] [PubMed]
  38. Schulze, B.C.; Wallace, H.W.; Bui, A.T.; Flynn, J.H.; Erickson, M.H.; Alvarez, S.; Dai, Q.; Usenko, S.; Sheesley, R.J.; Griffin, R.J. The impacts of regional shipping emissions on the chemical characteristics of coastal submicron aerosols near Houston, TX. Atmos. Chem. Phys. 2018, 18, 14217–14241. [Google Scholar] [CrossRef] [Green Version]
  39. Al-Naiema, I.M.; Hettiyadura, A.P.S.; Wallace, H.W.; Sanchez, N.P.; Madler, C.J.; Karakurt Cevik, B.; Bui, A.A.T.; Kettler, J.; Griffin, R.J.; Stone, E.A. Source apportionment of fine particulate matter in Houston, Texas: Insights to secondary organic aerosols. Atmos. Chem. Phys. 2018, 18, 15601–15622. [Google Scholar] [CrossRef] [Green Version]
  40. Shah, R.U.; Robinson, E.S.; Gu, P.; Robinson, A.L.; Apte, J.S.; Presto, A.A. High-spatial-resolution mapping and source apportionment of aerosol composition in Oakland, California, using mobile aerosol mass spectrometry. Atmos. Chem. Phys. 2018, 18, 16325–16344. [Google Scholar] [CrossRef] [Green Version]
  41. Manalis, N.; Grivas, G.; Protonotarios, V.; Moutsatsou, A.; Samara, C.; Chaloulakou, A. Toxic metal content of particulate matter (PM10), within the Greater Area of Athens. Chemosphere 2005, 60, 557–566. [Google Scholar] [CrossRef] [PubMed]
  42. Kallos, G.; Kassomenos, P.; Pielke, R.A. Synoptic and mesoscale weather conditions during air pollution episodes in Athens, Greece. Bound. -Layer Meteorol. 1993, 62, 163–184. [Google Scholar] [CrossRef]
  43. Kassomenos, P.; Flocas, H.A.; Lykoudis, S.; Petrakis, M. Analysis of Mesoscale Patterns in Relation to Synoptic Conditionsover an Urban Mediterranean Basin. Theor. Appl. Climatol. 1998, 59, 215–229. [Google Scholar] [CrossRef]
  44. Pateraki, S.; Asimakopoulos, D.N.; Maggos, T.; Vasilakos, C. Particulate matter levels in a suburban Mediterranean area: Analysis of a 53-month long experimental campaign. J. Hazard. Mater. 2010, 182, 801–811. [Google Scholar] [CrossRef] [PubMed]
  45. Liu, P.S.K.; Deng, R.; Smith, K.A.; Williams, L.R.; Jayne, J.T.; Canagaratna, M.R.; Moore, K.; Onasch, T.B.; Worsnop, D.R.; Deshler, T. Transmission Efficiency of an Aerodynamic Focusing Lens System: Comparison of Model Calculations and Laboratory Measurements for the Aerodyne Aerosol Mass Spectrometer. Aerosol Sci. Technol. 2007, 41, 721–733. [Google Scholar] [CrossRef]
  46. Middlebrook, A.M.; Bahreini, R.; Jimenez, J.L.; Canagaratna, M.R. Evaluation of Composition-Dependent Collection Efficiencies for the Aerodyne Aerosol Mass Spectrometer using Field Data. Aerosol Sci. Technol. 2011, 46, 258–271. [Google Scholar] [CrossRef]
  47. Freney, E.; Zhang, Y.; Croteau, P.; Amodeo, T.; Williams, L.; Truong, F.; Petit, J.-E.; Sciare, J.; Sarda-Esteve, R.; Bonnaire, N.; et al. The second ACTRIS inter-comparison (2016) for Aerosol Chemical Speciation Monitors (ACSM): Calibration protocols and instrument performance evaluations. Aerosol Sci. Technol. 2019, 53, 830–842. [Google Scholar] [CrossRef]
  48. Ng, N.L.; Herndon, S.C.; Trimborn, A.; Canagaratna, M.R.; Croteau, P.L.; Onasch, T.B.; Sueper, D.; Worsnop, D.R.; Zhang, Q.; Sun, Y.L.; et al. An Aerosol Chemical Speciation Monitor (ACSM) for Routine Monitoring of the Composition and Mass Concentrations of Ambient Aerosol. Aerosol Sci. Technol. 2011, 45, 780–794. [Google Scholar] [CrossRef]
  49. Stavroulas, I.; Bougiatioti, A.; Grivas, G.; Paraskevopoulou, D.; Tsagkaraki, M.; Zarmpas, P.; Liakakou, E.; Gerasopoulos, E.; Mihalopoulos, N. Sources and processes that control the submicron organic aerosol composition in an urban Mediterranean environment (Athens): A high temporal-resolution chemical composition measurement study. Atmos. Chem. Phys. 2019, 19, 901–919. [Google Scholar] [CrossRef] [Green Version]
  50. Drinovec, L.; Močnik, G.; Zotter, P.; Prévôt, A.S.H.; Ruckstuhl, C.; Coz, E.; Rupakheti, M.; Sciare, J.; Müller, T.; Wiedensohler, A.; et al. The “dual-spot” Aethalometer: An improved measurement of aerosol black carbon with real-time loading compensation. Atmos. Meas. Tech. 2015, 8, 1965–1979. [Google Scholar] [CrossRef] [Green Version]
  51. Weingartner, E.; Saathoff, H.; Schnaiter, M.; Streit, N.; Bitnar, B.; Baltensperger, U. Absorption of light by soot particles: Determination of the absorption coefficient by means of aethalometers. J. Aerosol Sci. 2003, 34, 1445–1463. [Google Scholar] [CrossRef]
  52. Laing, J.R.; Jaffe, D.A.; Sedlacek, A.J. Comparison of Filter-based Absorption Measurements of Biomass Burning Aerosol and Background Aerosol at the Mt. Bachelor Observatory. Aerosol Air Qual. Res. 2020, 20, 663–678. [Google Scholar] [CrossRef]
  53. Sandradewi, J.; Prévôt, A.S.H.; Szidat, S.; Perron, N.; Alfarra, M.R.; Lanz, V.A.; Weingartner, E.; Baltensperger, U. Using Aerosol Light Absorption Measurements for the Quantitative Determination of Wood Burning and Traffic Emission Contributions to Particulate Matter. Environ. Sci. Technol. 2008, 42, 3316–3323. [Google Scholar] [CrossRef]
  54. Lack, D.A.; Cappa, C.D. Impact of brown and clear carbon on light absorption enhancement, single scatter albedo and absorption wavelength dependence of black carbon. Atmos. Chem. Phys. 2010, 10, 4207–4220. [Google Scholar] [CrossRef] [Green Version]
  55. Yuan, W.; Huang, R.J.; Yang, L.; Guo, J.; Chen, Z.; Duan, J.; Wang, T.; Ni, H.; Han, Y.; Li, Y.; et al. Characterization of the light-Absorbing properties, chromophore composition and sources of brown carbon aerosol in Xi’an, northwestern China. Atmos. Chem. Phys. 2020, 20, 5129–5144. [Google Scholar] [CrossRef]
  56. Rajesh, T.A.; Ramachandran, S.; Dhaker, V.K. Black carbon aerosols: Relative source strengths of vehicular emissions and residential/open wood burning over an urban and a semi-urban environment. Atmos. Pollut. Res. 2021, 12, 101060. [Google Scholar] [CrossRef]
  57. Kaskaoutis, D.G.; Grivas, G.; Stavroulas, I.; Bougiatioti, A.; Liakakou, E.; Dumka, U.C.; Gerasopoulos, E.; Mihalopoulos, N. Apportionment of black and brown carbon spectral absorption sources in the urban environment of Athens, Greece, during winter. Sci. Total Environ. 2021, 801, 149739. [Google Scholar] [CrossRef]
  58. Cavalli, F.; Viana, M.; Yttri, K.E.; Genberg, J.; Putaud, J.P. Toward a standardised thermal-optical protocol for measuring atmospheric organic and elemental carbon: The EUSAAR protocol. Atmos. Meas. Tech. 2010, 3, 79–89. [Google Scholar] [CrossRef] [Green Version]
  59. Paraskevopoulou, D.; Liakakou, E.; Gerasopoulos, E.; Theodosi, C.; Mihalopoulos, N. Long-term characterization of organic and elemental carbon in the PM2.5 fraction: The case of Athens, Greece. Atmos. Chem. Phys. 2014, 14, 13313–13325. [Google Scholar] [CrossRef] [Green Version]
  60. Chow, J.C.; Watson, J.G.; Doraiswamy, P.; Chen, L.-W.A.; Sodeman, D.A.; Lowenthal, D.H.; Park, K.; Arnott, W.P.; Motallebi, N. Aerosol light absorption, black carbon, and elemental carbon at the Fresno Supersite, California. Atmos. Res. 2009, 93, 874–887. [Google Scholar] [CrossRef]
  61. Hyvärinen, A.-P.; Kolmonen, P.; Kerminen, V.-M.; Virkkula, A.; Leskinen, A.; Komppula, M.; Hatakka, J.; Burkhart, J.; Stohl, A.; Aalto, P.; et al. Aerosol black carbon at five background measurement sites over Finland, a gateway to the Arctic. Atmos. Meas. Tech. 2013, 6, 81–90. [Google Scholar] [CrossRef] [Green Version]
  62. Petit, J.E.; Favez, O.; Sciare, J.; Crenn, V.; Sarda-Estève, R.; Bonnaire, N.; Močnik, G.; Dupont, J.C.; Haeffelin, M.; Leoz-Garziandia, E. Two years of near real-time chemical composition of submicron aerosols in the region of Paris using an Aerosol Chemical Speciation Monitor (ACSM) and a multi-wavelength Aethalometer. Atmos. Chem. Phys. 2015, 15, 2985–3005. [Google Scholar] [CrossRef] [Green Version]
  63. Uria-Tellaetxe, I.; Carslaw, D.C. Conditional bivariate probability function for source identification. Environ. Model. Softw. 2014, 59, 1–9. [Google Scholar] [CrossRef] [Green Version]
  64. Stein, A.F.; Draxler, R.R.; Rolph, G.D.; Stunder, B.J.B.; Cohen, M.D.; Ngan, F. NOAA’s HYSPLIT Atmospheric Transport and Dispersion Modeling System. Bull. Am. Meteorol. Soc. 2015, 96, 2059–2077. [Google Scholar] [CrossRef]
  65. Dimitriou, K.; Kassomenos, P. Aerosol contributions at an urban background site in Eastern Mediterranean–Potential source regions of PAHs in PM10 mass. Sci. Total Environ. 2017, 598, 563–571. [Google Scholar] [CrossRef] [PubMed]
  66. Petit, J.E.; Favez, O.; Albinet, A.; Canonaco, F. A user-friendly tool for comprehensive evaluation of the geographical origins of atmospheric pollution: Wind and trajectory analyses. Environ. Model. Softw. 2017, 88, 183–187. [Google Scholar] [CrossRef] [Green Version]
  67. Paatero, P. The Multilinear Engine—A Table-Driven, Least Squares Program for Solving Multilinear Problems, Including the n-Way Parallel Factor Analysis Model. J. Comput. Graph. Stat. 2012, 8, 854–888. [Google Scholar] [CrossRef]
  68. Canonaco, F.; Crippa, M.; Slowik, J.G.; Baltensperger, U.; Prévôt, A.S.H. SoFi, an IGOR-based interface for the efficient use of the generalized multilinear engine (ME-2) for the source apportionment: ME-2 application to aerosol mass spectrometer data. Atmos. Meas. Tech. 2013, 6, 3649–3661. [Google Scholar] [CrossRef] [Green Version]
  69. Allan, J.D.; Delia, A.E.; Coe, H.; Bower, K.N.; Alfarra, M.R.; Jimenez, J.L.; Middlebrook, A.M.; Drewnick, F.; Onasch, T.B.; Canagaratna, M.R.; et al. A generalised method for the extraction of chemically resolved mass spectra from Aerodyne aerosol mass spectrometer data. J. Aerosol Sci. 2004, 35, 909–922. [Google Scholar] [CrossRef]
  70. Ulbrich, I.M.; Canagaratna, M.R.; Zhang, Q.; Worsnop, D.R.; Jimenez, J.L. Interpretation of organic components from Positive Matrix Factorization of aerosol mass spectrometric data. Atmos. Chem. Phys. 2009, 9, 2891–2918. [Google Scholar] [CrossRef] [Green Version]
  71. Crippa, M.; Canonaco, F.; Lanz, V.A.; Äijälä, M.; Allan, J.D.; Carbone, S.; Capes, G.; Ceburnis, D.; Dall’Osto, M.; Day, D.A.; et al. Organic aerosol components derived from 25 AMS data sets across Europe using a consistent ME-2 based source apportionment approach. Atmos. Chem. Phys. 2014, 14, 6159–6176. [Google Scholar] [CrossRef] [Green Version]
  72. Cubison, M.J.; Ortega, A.M.; Hayes, P.L.; Farmer, D.K.; Day, D.; Lechner, M.J.; Brune, W.H.; Apel, E.; Diskin, G.S.; Fisher, J.A.; et al. Effects of aging on organic aerosol from open biomass burning smoke in aircraft and laboratory studies. Atmos. Chem. Phys. 2011, 11, 12049–12064. [Google Scholar] [CrossRef] [Green Version]
  73. Crippa, M.; El Haddad, I.; Slowik, J.G.; DeCarlo, P.F.; Mohr, C.; Heringa, M.F.; Chirico, R.; Marchand, N.; Sciare, J.; Baltensperger, U.; et al. Identification of marine and continental aerosol sources in Paris using high resolution aerosol mass spectrometry. J. Geophys. Res. Atmos. 2013, 118, 1950–1963. [Google Scholar] [CrossRef] [Green Version]
  74. Ng, N.L.; Canagaratna, M.R.; Jimenez, J.L.; Zhang, Q.; Ulbrich, I.M.; Worsnop, D.R. Real-time methods for estimating organic component mass concentrations from aerosol mass spectrometer data. Environ. Sci. Technol. 2011, 45, 910–916. [Google Scholar] [CrossRef] [PubMed]
  75. Florou, K.; Papanastasiou, D.K.; Pikridas, M.; Kaltsonoudis, C.; Louvaris, E.; Gkatzelis, G.I.; Patoulias, D.; Mihalopoulos, N.; Pandis, S.N. The contribution of wood burning and other pollution sources to wintertime organic aerosol levels in two Greek cities. Atmos. Chem. Phys. 2017, 17, 3145–3163. [Google Scholar] [CrossRef] [Green Version]
  76. Fröhlich, R.; Crenn, V.; Setyan, A.; Belis, C.A.; Canonaco, F.; Favez, O.; Riffault, V.; Slowik, J.G.; Aas, W.; Aijälä, M.; et al. ACTRIS ACSM intercomparison-Part 2: Intercomparison of ME-2 organic source apportionment results from 15 individual, co-located aerosol mass spectrometers. Atmos. Meas. Tech. 2015, 8, 2555–2576. [Google Scholar] [CrossRef] [Green Version]
  77. Pateraki, S.; Assimakopoulos, V.D.; Bougiatioti, A.; Kouvarakis, G.; Mihalopoulos, N.; Vasilakos, C. Carbonaceous and ionic compositional patterns of fine particles over an urban Mediterranean area. Sci. Total Environ. 2012, 424, 251–263. [Google Scholar] [CrossRef]
  78. Chow, J.C.; Lowenthal, D.H.; Chen, L.-W.A.; Wang, X.; Watson, J.G. Mass reconstruction methods for PM2.5: A review. Air Qual. Atmos. Health 2015, 8, 243–263. [Google Scholar] [CrossRef] [Green Version]
  79. Zanatta, M.; Gysel, M.; Bukowiecki, N.; Müller, T.; Weingartner, E.; Areskoug, H.; Fiebig, M.; Yttri, K.E.; Mihalopoulos, N.; Kouvarakis, G.; et al. A European aerosol phenomenology-5: Climatology of black carbon optical properties at 9 regional background sites across Europe. Atmos. Environ. 2016, 145, 346–364. [Google Scholar] [CrossRef]
  80. Sun, Y.; Jiang, Q.; Wang, Z.; Fu, P.; Li, J.; Yang, T.; Yin, Y. Investigation of the sources and evolution processes of severe haze pollution in Beijing in January 2013. J. Geophys. Res. 2014, 119, 4380–4398. [Google Scholar] [CrossRef]
  81. Xu, L.; Suresh, S.; Guo, H.; Weber, R.J.; Ng, N.L. Aerosol characterization over the southeastern United States using high-resolution aerosol mass spectrometry: Spatial and seasonal variation of aerosol composition and sources with a focus on organic nitrates. Atmos. Chem. Phys. 2015, 15, 7307–7336. [Google Scholar] [CrossRef] [Green Version]
  82. Barreira, L.M.F.; Helin, A.; Aurela, M.; Teinila, K.; Friman, M.; Kangas, L.; Niemi, J.V.; Portin, H.; Kousa, A.; Pirjola, L.; et al. In-depth characterization of submicron particulate matter inter-annual variations at a street canyon site in northern Europe. Atmos. Chem. Phys. 2021, 21, 6297–6314. [Google Scholar] [CrossRef]
  83. Zhang, Y.; Favez, O.; Petit, J.E.; Canonaco, F.; Truong, F.; Bonnaire, N.; Crenn, V.; Amodeo, T.; Prévôt, A.S.H.; Sciare, J.; et al. Six-year source apportionment of submicron organic aerosols from near-continuous highly time-resolved measurements at SIRTA (Paris area, France). Atmos. Chem. Phys. 2019, 19, 14755–14776. [Google Scholar] [CrossRef] [Green Version]
  84. Sun, Y.L.; Wang, Z.F.; Fu, P.Q.; Yang, T.; Jiang, Q.; Dong, H.B.; Li, J.; Jia, J.J. Aerosol composition, sources and processes during wintertime in Beijing, China. Atmos. Chem. Phys. 2013, 13, 4577–4592. [Google Scholar] [CrossRef] [Green Version]
  85. Zhang, Y.; Tang, L.; Yu, H.; Wang, Z.; Sun, Y.; Qin, W.; Chen, W.; Chen, C.; Ding, A.; Wu, J.; et al. Chemical composition, sources and evolution processes of aerosol at an urban site in Yangtze River Delta, China during wintertime. Atmos. Environ. 2015, 123, 339–349. [Google Scholar] [CrossRef]
  86. Grivas, G.; Cheristanidis, S.; Chaloulakou, A. Elemental and organic carbon in the urban environment of Athens. Seasonal and diurnal variations and estimates of secondary organic carbon. Sci. Total Environ. 2012, 414, 535–545. [Google Scholar] [CrossRef]
  87. Mousavi, A.; Sowlat, M.H.; Lovett, C.; Rauber, M.; Szidat, S.; Boffi, R.; Borgini, A.; De Marco, C.; Ruprecht, A.A.; Sioutas, C. Source apportionment of black carbon (BC) from fossil fuel and biomass burning in metropolitan Milan, Italy. Atmos. Environ. 2019, 203, 252–261. [Google Scholar] [CrossRef]
  88. Kimbrough, S.; Hanley, T.; Hagler, G.; Baldauf, R.; Snyder, M.; Brantley, H. Influential factors affecting black carbon trends at four sites of differing distance from a major highway in Las Vegas. Air Qual. Atmos. Health 2018, 11, 181–196. [Google Scholar] [CrossRef] [PubMed]
  89. Minguillón, M.C.; Pérez, N.; Marchand, N.; Bertrand, A.; Temime-Roussel, B.; Agrios, K.; Szidat, S.; Van Drooge, B.; Sylvestre, A.; Alastuey, A.; et al. Secondary organic aerosol origin in an urban environment: Influence of biogenic and fuel combustion precursors. Faraday Discuss. 2016, 189, 337–359. [Google Scholar] [CrossRef] [Green Version]
  90. Dumka, U.C.; Tiwari, S.; Kaskaoutis, D.G.; Soni, V.K.; Safai, P.D.; Attri, S.D. Aerosol and pollutant characteristics in Delhi during a winter research campaign. Environ. Sci. Pollut. Res. 2018, 26, 3771–3794. [Google Scholar] [CrossRef]
  91. Crilley, L.R.; Bloss, W.J.; Yin, J.; Beddows, D.C.S.; Harrison, R.M.; Allan, J.D.; Young, D.E.; Flynn, M.; Williams, P.; Zotter, P.; et al. Sources and contributions of wood smoke during winter in London: Assessing local and regional influences. Atmos. Chem. Phys. 2015, 15, 3149–3171. [Google Scholar] [CrossRef] [Green Version]
  92. Costabile, F.; Alas, H.; Aufderheide, M.; Avino, P.; Amato, F.; Argentini, S.; Barnaba, F.; Berico, M.; Bernardoni, V.; Biondi, R.; et al. First Results of the “Carbonaceous Aerosol in Rome and Environs (CARE)” Experiment: Beyond Current Standards for PM10. Atmosphere 2017, 8, 249. [Google Scholar] [CrossRef] [Green Version]
  93. Briggs, N.L.; Long, C.M. Critical review of black carbon and elemental carbon source apportionment in Europe and the United States. Atmos. Environ. 2016, 144, 409–427. [Google Scholar] [CrossRef]
  94. Progiou, A.G.; Bakeas, E.; Evangelidou, E.; Kontogiorgi, C.; Lagkadinou, E.; Sebos, I. Air pollutant emissions from Piraeus port: External costs and air quality levels. Transp. Res. Part D Transp. Environ. 2021, 91, 102586. [Google Scholar] [CrossRef]
  95. Lin, C.; Ceburnis, D.; Xu, W.; Heffernan, E.; Hellebust, S.; Gallagher, J.; Huang, R.J.; O’Dowd, C.; Ovadnevaite, J. The impact of traffic on air quality in Ireland: Insights from the simultaneous kerbside and suburban monitoring of submicron aerosols. Atmos. Chem. Phys. 2020, 20, 10513–10529. [Google Scholar] [CrossRef]
  96. Titos, G.; del Águila, A.; Cazorla, A.; Lyamani, H.; Casquero-Vera, J.A.; Colombi, C.; Cuccia, E.; Gianelle, V.; Močnik, G.; Alastuey, A.; et al. Spatial and temporal variability of carbonaceous aerosols: Assessing the impact of biomass burning in the urban environment. Sci. Total Environ. 2017, 578, 613–625. [Google Scholar] [CrossRef] [Green Version]
  97. Healy, R.M.; Sofowote, U.; Su, Y.; Debosz, J.; Noble, M.; Jeong, C.H.; Wang, J.M.; Hilker, N.; Evans, G.J.; Doerksen, G.; et al. Ambient measurements and source apportionment of fossil fuel and biomass burning black carbon in Ontario. Atmos. Environ. 2017, 161, 34–47. [Google Scholar] [CrossRef]
  98. Tsiodra, I.; Grivas, G.; Tavernaraki, K.; Bougiatioti, A.; Apostolaki, M.; Paraskevopoulou, D.; Gogou, A.; Parinos, C.; Oikonomou, K.; Tsagkaraki, M.; et al. Annual exposure to PAHs in urban environments linked to wintertime wood-burning episodes. Atmos. Chem. Phys. 2021, 21, 17865–17883. [Google Scholar] [CrossRef]
  99. Athanasopoulou, E.; Speyer, O.; Brunner, D.; Vogel, H.; Vogel, B.; Mihalopoulos, N.; Gerasopoulos, E. Changes in domestic heating fuel use in Greece: Effects on atmospheric chemistry and radiation. Atmos. Chem. Phys. 2017, 17, 10597–10618. [Google Scholar] [CrossRef] [Green Version]
  100. Theodosi, C.; Grivas, G.; Zarmpas, P.; Chaloulakou, A.; Mihalopoulos, N. Mass and chemical composition of size-segregated aerosols (PM1, PM2.5, PM10) over Athens, Greece: Local versus regional sources. Atmos. Chem. Phys. 2011, 11, 11895–11911. [Google Scholar] [CrossRef] [Green Version]
  101. Zhang, S.; Tison, E.; Dusanter, S.; Beaugard, C.; Gengembre, C.; Augustin, P.; Fourmentin, M.; Delbarre, H.; Riffault, V. Near real-time PM1 chemical composition measurements at a French urban background and coastal site under industrial influence over more than a year: Temporal variability and assessment of sulfur-containing emissions. Atmos. Environ. 2021, 244, 117960. [Google Scholar] [CrossRef]
  102. Budisulistiorini, S.H.; Baumann, K.; Edgerton, E.S.; Bairai, S.T.; Mueller, S.; Shaw, S.L.; Knipping, E.M.; Gold, A.; Surratt, J.D. Seasonal characterization of submicron aerosol chemical composition and organic aerosol sources in the southeastern United States: Atlanta, Georgia, and Look Rock, Tennessee. Atmos. Chem. Phys. 2016, 16, 5171–5189. [Google Scholar] [CrossRef] [Green Version]
  103. Sun, Y.; Wang, Z.; Dong, H.; Yang, T.; Li, J.; Pan, X.; Chen, P.; Jayne, J.T. Characterization of summer organic and inorganic aerosols in Beijing, China with an Aerosol Chemical Speciation Monitor. Atmos. Environ. 2012, 51, 250–259. [Google Scholar] [CrossRef]
  104. Bressi, M.; Cavalli, F.; Putaud, J.P.; Fröhlich, R.; Petit, J.E.; Aas, W.; Äijälä, M.; Alastuey, A.; Allan, J.D.; Aurela, M.; et al. A European aerosol phenomenology-7: High-time resolution chemical characteristics of submicron particulate matter across Europe. Atmos. Environ. X 2021, 10, 100108. [Google Scholar] [CrossRef]
  105. Han, L.; Yan, H.; Xiang, X.; Liu, X.; Shi, R.; Wang, H.; Cheng, S.; Wang, H. Characteristics, evolution, and potential source regions of submicron aerosol in Beijing, China. Atmos. Environ. 2021, 246, 118061. [Google Scholar] [CrossRef]
  106. Bougiatioti, A.; Paraskevopoulou, D.; Stavroulas, I.; Weber, R.; Nenes, A.; Kanakidou, M.; Mihalopoulos, N. The effects of biomass burning on fine aerosol acidity, liquid water content and nitrogen partitioning. In Proceedings of the 2017 European Aerosol Conference, Zurich, Switzerland, 27 August–1 September 2017; p. T209N57B. [Google Scholar]
  107. Kassomenos, P.; Kotroni, V.; Kallos, G. Analysis of climatological and air quality observations from Greater Athens Area. Atmos. Environ. 1995, 29, 3671–3688. [Google Scholar] [CrossRef]
  108. Kostenidou, E.; Florou, K.; Kaltsonoudis, C.; Tsiflikiotou, M.; Vratolis, S.; Eleftheriadis, K.; Pandis, S.N. Sources and chemical characterization of organic aerosol during the summer in the eastern Mediterranean. Atmos. Chem. Phys. 2015, 15, 11355–11371. [Google Scholar] [CrossRef] [Green Version]
  109. Na, K.; Sawant, A.A.; Song, C.; Cocker, D.R., III. Primary and secondary carbonaceous species in the atmosphere of Western Riverside County, California. Atmos. Environ. 2004, 38, 1345–1355. [Google Scholar] [CrossRef]
  110. Plaza, J.; Gómez-Moreno, F.J.; Núñez, L.; Pujadas, M.; Artíñano, B. Estimation of secondary organic aerosol formation from semi-continuous OC-EC measurements in a Madrid suburban area. Atmos. Environ. 2006, 40, 1134–1147. [Google Scholar] [CrossRef]
  111. Rivellini, L.H.; Adam, M.G.; Kasthuriarachchi, N.; Lee, A.K.Y. Characterization of carbonaceous aerosols in Singapore: Insight from black carbon fragments and trace metal ions detected by a soot particle aerosol mass spectrometer. Atmos. Chem. Phys. 2020, 20, 5977–5993. [Google Scholar] [CrossRef]
  112. Bougiatioti, A.; Stavroulas, I.; Kostenidou, E.; Zarmpas, P.; Theodosi, C.; Kouvarakis, G.; Canonaco, F.; Prévôt, A.S.H.; Nenes, A.; Pandis, S.N.; et al. Processing of biomass-burning aerosol in the eastern Mediterranean during summertime. Atmos. Chem. Phys. 2014, 14, 4793–4807. [Google Scholar] [CrossRef] [Green Version]
  113. Becerril-Valle, M.; Coz, E.; Prévôt, A.S.H.; Močnik, G.; Pandis, S.N.; Sánchez de la Campa, A.M.; Alastuey, A.; Díaz, E.; Pérez, R.M.; Artíñano, B. Characterization of atmospheric black carbon and co-pollutants in urban and rural areas of Spain. Atmos. Environ. 2017, 169, 36–53. [Google Scholar] [CrossRef]
  114. Helin, A.; Niemi, J.V.; Virkkula, A.; Pirjola, L.; Teinilä, K.; Backman, J.; Aurela, M.; Saarikoski, S.; Rönkkö, T.; Asmi, E.; et al. Characteristics and source apportionment of black carbon in the Helsinki metropolitan area, Finland. Atmos. Environ. 2018, 190, 87–98. [Google Scholar] [CrossRef]
  115. Fameli, K.M.; Assimakopoulos, V.D. Development of a road transport emission inventory for Greece and the Greater Athens Area: Effects of important parameters. Sci. Total Environ. 2015, 505, 770–786. [Google Scholar] [CrossRef] [PubMed] [Green Version]
  116. Gobbi, G.P.; Di Liberto, L.; Barnaba, F. Impact of port emissions on EU-regulated and non-regulated air quality indicators: The case of Civitavecchia (Italy). Sci. Total Environ. 2020, 719, 134984. [Google Scholar] [CrossRef] [PubMed]
  117. Yin Sun, J.; Wu, C.; Wu, D.; Cheng, C.; Li, M.; Li, L.; Deng, T.; Yu, J.Z.; Li, Y.J.; Zhou, Q.; et al. Amplification of black carbon light absorption induced by atmospheric aging: Temporal variation at seasonal and diel scales in urban Guangzhou. Atmos. Chem. Phys. 2020, 20, 2445–2470. [Google Scholar] [CrossRef] [Green Version]
  118. Zhang, Q.; Jimenez, J.L.; Worsnop, D.R.; Canagaratna, M. A case study of urban particle acidity and its influence on secondary organic aerosol. Environ. Sci. Technol. 2007, 41, 3213–3219. [Google Scholar] [CrossRef]
  119. Jiang, Q.; Wang, F.; Sun, Y. Analysis of Chemical Composition, Source and Processing Characteristics of Submicron Aerosol during the Summer in Beijing, China. Aerosol Air Qual. Res. 2019, 19, 1450–1462. [Google Scholar] [CrossRef] [Green Version]
  120. Murphy, S.; Agrawal, H.; Sorooshian, A.; Padró, L.T.; Gates, H.; Hersey, S.; Welch, W.A.; Jung, H.; Miller, J.W.; Cocker, D.R., III; et al. Comprehensive simultaneous shipboard and airborne characterization of exhaust from a modern container ship at sea. Environ. Sci. Technol. 2009, 43, 4626–4640. [Google Scholar] [CrossRef] [Green Version]
  121. Kanellopoulos, P.G.; Verouti, E.; Chrysochou, E.; Koukoulakis, K.; Bakeas, E. Primary and secondary organic aerosol in an urban/industrial site: Sources, health implications and the role of plastic enriched waste burning. J. Environ. Sci. 2021, 99, 222–238. [Google Scholar] [CrossRef]
  122. Rattanavaraha, W.; Canagaratna, M.R.; Budisulistiorini, S.H.; Croteau, P.L.; Baumann, K.; Canonaco, F.; Prevot, A.S.H.; Edgerton, E.S.; Zhang, Z.; Jayne, J.T.; et al. Source apportionment of submicron organic aerosol collected from Atlanta, Georgia, during 2014–2015 using the aerosol chemical speciation monitor (ACSM). Atmos. Environ. 2017, 167, 389–402. [Google Scholar] [CrossRef]
  123. Guo, J.; Zhou, S.; Cai, M.; Zhao, J.; Song, W.; Zhao, W.; Hu, W.; Sun, Y.; He, Y.; Yang, C.; et al. Characterization of submicron particles by time-of-flight aerosol chemical speciation monitor (ToF-ACSM) during wintertime: Aerosol composition, sources, and chemical processes in Guangzhou, China. Atmos. Chem. Phys. 2020, 20, 7595–7615. [Google Scholar] [CrossRef]
  124. Salcedo, D.; Alvarez-Ospina, H.; Peralta, O.; Castro, T. PM1 Chemical Characterization during the ACU15 Campaign, South of Mexico City. Atmosphere 2018, 9, 232. [Google Scholar] [CrossRef] [Green Version]
  125. Aurela, M.; Saarikoski, S.; Niemi, J.V.; Canonaco, F.; Prevot, A.S.H.; Frey, A.; Carbone, S.; Kousa, A.; Hillamo, R. Chemical and Source Characterization of Submicron Particles at Residential and Traffic Sites in the Helsinki Metropolitan Area, Finland. Aerosol Air Qual. Res. 2015, 15, 1213–1226. [Google Scholar] [CrossRef] [Green Version]
  126. Alfarra, M.R.; Prevot, A.S.H.; Szidat, S.; Sandradewi, J.; Weimer, S.; Lanz, V.A.; Schreiber, D.; Mohr, M.; Baltensperger, U. Identification of the mass spectral signature of organic aerosols from wood burning emissions. Environ. Sci. Technol. 2007, 41, 5770–5777. [Google Scholar] [CrossRef] [PubMed]
  127. Zhou, Y.; Cheng, S.; Lang, J.; Chen, D.; Zhao, B.; Liu, C.; Xu, R.; Li, T. A comprehensive ammonia emission inventory with high-resolution and its evaluation in the Beijing-Tianjin-Hebei (BTH) region, China. Atmos. Environ. 2015, 106, 305–317. [Google Scholar] [CrossRef]
  128. Kodros, J.K.; Papanastasiou, D.K.; Paglione, M.; Masiol, M.; Squizzato, S.; Florou, K.; Skyllakou, K.; Kaltsonoudis, C.; Nenes, A.; Pandis, S.N. Rapid dark aging of biomass burning as an overlooked source of oxidized organic aerosol. Proc. Natl. Acad. Sci. USA 2020, 117, 33028–33033. [Google Scholar] [CrossRef]
  129. Jorga, S.D.; Florou, K.; Kaltsonoudis, C.; Kodros, J.K.; Vasilakopoulou, C.; Cirtog, M.; Fouqueau, A.; Picquet-Varrault, B.; Nenes, A.; Pandis, S.N. Nighttime chemistry of biomass burning emissions in urban areas: A dual mobile chamber study. Atmos. Chem. Phys. 2021, 21, 15337–15349. [Google Scholar] [CrossRef]
  130. Sun, C.; Lee, B.P.; Huang, D.; Li, Y.J.; Schurman, M.I.; Louie, P.K.K.; Luk, C.; Chan, C.K. Continuous measurements at the urban roadside in an Asian megacity by Aerosol Chemical Speciation Monitor (ACSM): Particulate matter characteristics during fall and winter seasons in Hong Kong. Atmos. Chem. Phys. 2016, 16, 1713–1728. [Google Scholar] [CrossRef] [Green Version]
  131. Kaskaoutis, D.G.; Grivas, G.; Stavroulas, I.; Liakakou, E.; Dumka, U.C.; Dimitriou, K.; Gerasopoulos, E.; Mihalopoulos, N. In situ identification of aerosol types in Athens, Greece, based on long-term optical and on online chemical characterization. Atmos. Environ. 2021, 246, 118070. [Google Scholar] [CrossRef]
  132. Patel, K.; Bhandari, S.; Gani, S.; Campmier, M.J.; Kumar, P.; Habib, G.; Apte, J.; Hildebrandt Ruiz, L. Sources and Dynamics of Submicron Aerosol during the Autumn Onset of the Air Pollution Season in Delhi, India. ACS Earth Sp. Chem. 2021, 5, 118–128. [Google Scholar] [CrossRef]
  133. Srivastava, D.; Favez, O.; Petit, J.-E.; Zhang, Y.; Sofowote, U.M.; Hopke, P.K.; Bonnaire, N.; Perraudin, E.; Gros, V.; Villenave, E.; et al. Speciation of organic fractions does matter for aerosol source apportionment. Part 3: Combining off-line and on-line measurements. Sci. Total Environ. 2019, 690, 944–955. [Google Scholar] [CrossRef]
  134. Mallet, M.D.; D’Anna, B.; Même, A.; Chiara Bove, M.; Cassola, F.; Pace, G.; Desboeufs, K.; Di Biagio, C.; Doussin, J.F.; Maille, M.; et al. Summertime surface PM1 aerosol composition and size by source region at the Lampedusa island in the central Mediterranean Sea. Atmos. Chem. Phys. 2019, 19, 11123–11142. [Google Scholar] [CrossRef] [Green Version]
  135. Sage, A.M.; Weitkamp, E.A.; Robinson, A.L.; Donahue, N.M. Evolving mass spectra of the oxidized component of organic aerosol: Results from aerosol mass spectrometer analyses of aged diesel emissions. Atmos. Chem. Phys. 2008, 8, 1139–1152. [Google Scholar] [CrossRef] [Green Version]
  136. Carbone, S.; Saarikoski, S.; Frey, A.; Reyes, F.; Reyes, P.; Castillo, M.; Gramsch, E.; Oyola, P.; Jayne, J.; Worsnop, D.R.; et al. Chemical Characterization of Submicron Aerosol Particles in Santiago de Chile. Aerosol Air Qual. Res. 2013, 13, 462–473. [Google Scholar] [CrossRef] [Green Version]
  137. Gerasopoulos, E.; Amiridis, V.; Kazadzis, S.; Kokkalis, P.; Eleftheratos, K.; Andreae, M.O.; Andreae, T.W.; El-Askary, H.; Zerefos, C.S. Three-year ground based measurements of aerosol optical depth over the Eastern Mediterranean: The urban environment of Athens. Atmos. Chem. Phys. 2011, 11, 2145–2159. [Google Scholar] [CrossRef] [Green Version]
  138. Via, M.; Minguillón, M.C.; Reche, C.; Querol, X.; Alastuey, A. Increase in secondary organic aerosol in an urban environment. Atmos. Chem. Phys. 2021, 21, 8323–8339. [Google Scholar] [CrossRef]
  139. Struckmeier, C.; Drewnick, F.; Fachinger, F.; Paolo Gobbi, G.; Borrmann, S. Atmospheric aerosols in Rome, Italy: Sources, dynamics and spatial variations during two seasons. Atmos. Chem. Phys. 2016, 16, 15277–15299. [Google Scholar] [CrossRef] [Green Version]
  140. Paraskevopoulou, D.; Bougiatioti, A.; Stavroulas, I.; Fang, T.; Lianou, M.; Liakakou, E.; Gerasopoulos, E.; Weber, R.; Nenes, A.; Mihalopoulos, N. Yearlong variability of oxidative potential of particulate matter in an urban Mediterranean environment. Atmos. Environ. 2019, 206, 183–196. [Google Scholar] [CrossRef]
  141. Minguillón, M.C.; Ripoll, A.; Pérez, N.; Prévôt, A.S.H.; Canonaco, F.; Querol, X.; Alastuey, A. Chemical characterization of submicron regional background aerosols in the western Mediterranean using an Aerosol Chemical Speciation Monitor. Atmos. Chem. Phys. 2015, 15, 6379–6391. [Google Scholar] [CrossRef] [Green Version]
  142. Querol, X.; Alastuey, A.; Pey, J.; Cusack, M.; Pérez, N.; Mihalopoulos, N.; Theodosi, C.; Gerasopoulos, E.; Kubilay, N.; Koçak, M. Variability in regional background aerosols within the Mediterranean. Atmos. Chem. Phys. 2009, 9, 4575–4591. [Google Scholar] [CrossRef] [Green Version]
  143. Pandolfi, M.; Alastuey, A.; Pérez, N.; Reche, C.; Castro, I.; Shatalov, V.; Querol, X. Trends analysis of PM source contributions and chemical tracers in NE Spain during 2004–2014: A multi-exponential approach. Atmos. Chem. Phys. 2016, 16, 11787–11805. [Google Scholar] [CrossRef] [Green Version]
Figure 1. Overview of the Greater Area of Athens (GAA), highlighting the Piraeus port area and also the ancillary background measurement sites P2 (yellow circle) and THI (green circle) (a); measurement locations (P1—main site, PEI-1—roadside traffic site) in the center of Piraeus, near the passenger port (b). Source: Google Earth, 6 October 2021.
Atmosphere 12 01686 g001
Figure 2. Mean diurnal cycles of the major submicron aerosol components (OA and ions from the ACSM, BCff and BCbb from the aethalometer) for the winter (a) and summer (b) measurement periods.
Atmosphere 12 01686 g002
Figure 3. Time series of hourly ACSM (non-refractory OA and major inorganic ions) and AE-33 (BC components) measurements for the winter (a) and summer (b) periods.
Atmosphere 12 01686 g003
Figure 4. Mass spectra of PMF factors (FP: factor profiles) resolved from (a) winter (December-January) and (b) summer (June-July) OA measurements in Piraeus.
Atmosphere 12 01686 g004
Figure 5. Average diurnal cycles and respective hourly average fractional contributions, identified by PMF analysis for OA components in Piraeus in the winter (a) and summer (b) periods.
Atmosphere 12 01686 g005
Figure 6. PMF-resolved mass concentrations and fractions for the OA components during the winter (a) and summer (b) periods in Piraeus.
Atmosphere 12 01686 g006
Table 1. Descriptive statistics (arithmetic mean and min.-max. range in parentheses) for concentrations of ACSM non-refractory species, BC and its source-specific components, and PM1, in Piraeus. All values in μg m−3. Day and night periods were defined as 06:00–18:00 and 18:00–06:00, respectively. The winter and summer measurement periods were 10 December 2018–16 January 2019 and 11 June–9 July 2019, respectively.
TotalDayNightWeekdayWeekend
Winter
OM13.88 (0.41–89.56)12.21 (1.10–58.90)15.57 (0.41–89.56)14.30 (0.41–89.56)12.80 (1.10–88.03)
SO42−2.48 (0.01–9.19)2.33 (0.01–7.14)2.63 (0.11–9.19)2.51 (0.01–9.19)2.40 (0.01–7.60)
NO31.40 (0.01–7.97)1.19 (0.01–5.92)1.62 (0.01–7.97)1.44 (0.01–7.97)1.31 (0.05–7.00)
NH4+0.92 (0.14–4.56)0.83 (0.14–3.74)1.02 (0.14–4.56)0.94 (0.14–4.46)0.88 (0.14–4.56)
Cl0.28 (0.01–6.13)0.21 (0.01–4.07)0.35 (0.01–6.13)0.29 (0.01–6.13)0.26 (0.01–4.49)
BC3.72 (0.17–28.52)2.96 (0.32–17.24)4.47 (0.17–28.52)3.73 (0.17–28.47)3.66 (0.34–28.52)
BCff2.43 (0.01–18.63)2.31 (0.22–13.92)2.56 (0.01–18.63)2.48 (0.16–18.63)2.30 (0.01–15.49)
BCbb1.28 (0.01–13.65)0.65 (0.04–3.56)1.91 (0.01–13.65)1.25 (0.01–13.38)1.36 (0.01–13.65)
PM122.75 (1.11–130.69)19.76 (2.28–78.51)25.76 (1.11–130.69)23.29 (1.11–126.19)21.33 (2.28–130.69)
Summer
OM7.14 (1.70–15.94)7.11 (1.70–15.94)7.16 (1.71–15.25)7.63 (1.70–15.94)6.15 (1.74–14.67)
SO42−3.32 (0.13–10.91)3.29 (0.13–10.91)3.35 (0.68–8.50)3.47 (0.13–10.91)2.95 (0.68–9.75)
NO30.46 (0.04–1.69)0.52 (0.04–1.69)0.41 (0.05–1.32)0.51 (0.04–1.69)0.33 (0.05–1.22)
NH4+1.20 (0.14–3.82)1.22 (0.14–3.82)1.18 (0.14–3.29)1.26 (0.14–3.82)1.04 (0.14–3.14)
Cl0.03 (0.01–0.21)0.04 (0.01–0.21)0.02 (0.01–0.10)0.03 (0.01–0.21)0.02 (0.01–0.06)
BC2.81 (0.28–11.82)2.88 (0.39–11.82)2.74 (0.28–11.71)3.10 (0.37–11.82)2.05 (0.28–11.71)
BCff2.45 (0.04–10.39)2.51 (0.04–10.39)2.39 (0.14–10.36)2.71 (0.04–10.39)1.79 (0.23–10.36)
BCbb0.36 (0.01–1.90)0.37 (0.01–1.90)0.35 (0.01–1.86)0.40 (0.01–1.90)0.26 (0.03–1.35)
PM114.78 (3.37–34.11)14.69 (3.37–34.11)14.84 (3.62–29.33)16.02 (3.72–34.11)12.26 (3.37–29.33)
Publisher’s Note: MDPI stays neutral with regard to jurisdictional claims in published maps and institutional affiliations.

