Article

Five Years of Spatially Resolved Ground-Based MAX-DOAS Measurements of Nitrogen Dioxide in the Urban Area of Athens: Synergies with In Situ Measurements and Model Simulations

by
Myrto Gratsea
1,2,*,
Eleni Athanasopoulou
1,
Anastasia Kakouri
1,
Andreas Richter
3,
Andre Seyler
3 and
Evangelos Gerasopoulos
1,*
1
Institute for Environmental Research and Sustainable Development, National Observatory of Athens, 11810 Athens, Greece
2
Environmental Chemical Processes Laboratory, Department of Chemistry, University of Crete, 71003 Heraklion, Greece
3
Institute of Environmental Physics and Remote Sensing, University of Bremen, 28359 Bremen, Germany
*
Authors to whom correspondence should be addressed.
Atmosphere 2021, 12(12), 1634; https://doi.org/10.3390/atmos12121634
Submission received: 8 November 2021 / Revised: 26 November 2021 / Accepted: 1 December 2021 / Published: 7 December 2021
(This article belongs to the Special Issue Air Quality in Greece)

Abstract

:
Long-term nitrogen dioxide (NO2) slant column density measurements using the MAX-DOAS (multi-axis differential optical absorption spectroscopy) technique were analyzed in order to demonstrate the temporal and horizontal variability of the trace gas in Athens for the period October 2012–July 2017. The synergy with in situ measurements and model simulations was exploited for verifying the MAX-DOAS technique and its ability to assess the spatiotemporal characteristics of NO2 pollution in the city. Tropospheric NO2 columns derived from ground-based MAX-DOAS observations in two horizontal and five vertical viewing directions were compared with in situ chemiluminescence measurements representative of urban, urban background and suburban conditions; a satisfactory correlation was found for the urban (r ≈ 0.55) and remote areas (r ≈ 0.40). Mean tropospheric slant columns retrieved from measurements at the lowest elevation over the urban area ranged from 0.1 to 32 × 1016 molec cm−2. The interannual variability showed a rate of increase of 0.3 × 10¹⁶ molec cm−2 per year since 2012 in the urban area, leading to a total increase of 20%. The retrieved annual cycles captured the seasonal variability with lower NO2 levels in summer, highly correlated (r ≈ 0.85) with the urban background and suburban in situ observations. The NO2 diurnal variation for different seasons exhibited varied patterns, indicating the different role of photochemistry and anthropogenic activities in the different seasons. Compared to in situ observations, the MAX-DOAS NO2 morning peak occurred with a one-hour delay and decayed less steeply in winter. Measurements at different elevation angles are shown as a primary indicator of the vertical distribution of NO2 at the urban environment; the vertical convection of the polluted air masses and the enhanced NO2 near-surface concentrations are demonstrated by this analysis. The inhomogeneity of the NO2 spatial distribution was shown using a relevant inhomogeneity index; greater variability was found during the summer period. Comparisons with city-scale model simulations demonstrated that the horizontal light path length of MAX-DOAS covered a distance of 15 km. An estimation of urban sources’ contribution was also made by applying two simple methodologies on the MAX-DOAS measurements. The results were compared to NO2 predictions from the high resolution air quality model to infer the importance of vehicle emissions for the urban NO2 levels; 20–35% of the urban NO2 was found to be associated with road transport.

1. Introduction

Nitrogen dioxide (NO2) constitutes an important tropospheric gaseous pollutant present in abundance in urban environments and affecting human health. NO2 plays a key role in tropospheric photochemistry by affecting the oxidizing capacity, ozone formation and radiative forcing of the atmosphere [1,2]. Fossil fuel and biomass combustion are the main NO2 emission sources in urban areas, which are, therefore, characterized by inhomogeneous spatial and temporal NO2 distribution. The largest proportion of NO2, however, is produced by the oxidation of the mainly emitted NO, rather than being directly emitted as NO2 [3].
The city of Athens ranks as the third worst among 25 European cities in terms of air pollution [4] and exceedances in NO2 are recorded regularly [5]. Athens also ranks 16th out of 858 European cities in terms of mortality linked to NO2 pollution [6]. The main air pollution sources in Athens are road transport, domestic heating, the industrial area on the southwest side of the city and the port located on the south of the city center [7,8]. In particular, road transport has been found to contribute to over 50% of NOx emissions in the urban environment of Athens [9]. The pollution levels are also affected by the special topography of the city, which is surrounded by four mountains and favors the accumulation of air pollutants under specific meteorological conditions. As NO2 is an important parameter of urban air quality, several studies based on in situ NO2 measurements have been carried out in Athens since 1980, e.g., [10,11,12], and recent studies have used ground-based remote sensing techniques, such as lidar and active long path DOAS, e.g., [13,14].
The multi-axis differential optical absorption spectroscopy (MAX-DOAS) is a technique used for the retrieval of the tropospheric column of NO2 from diffuse solar radiation measurements in UV/visible and has been gaining ground over recent years, e.g., [15,16,17]. The main advantage of this technique is the possibility of providing important information on the spatial and temporal variability of air quality to the scientific community and potentially to policy makers. This kind of information is important for the investigation of emission sources’ contribution and photochemical processes in the atmosphere. In addition, this technique is essential for the validation of satellite air quality products, e.g., [18]. MAX-DOAS has been widely used for the assessment of urban pollution, e.g., [17,18,19,20]. Continuous MAX-DOAS measurements in Greece are only being performed in Thessaloniki, e.g., [21,22], and Athens [23]. In this study, 5 years of NO2 MAX-DOAS measurements are presented and compared to in situ NO2 measurements as well as model simulations, exploiting the synergistic effects of multiple earth observation platforms towards exploring MAX-DOAS spatiotemporal benefits. NO2 MAX-DOAS measurements have recently been used to evaluate regional air quality predictions over Greece [24]. Although NO2 data from MAX-DOAS observations have been validated by in situ NO2 measurements in a few cities, e.g., [25,26], this is the first time that such an evaluation and analysis will be made for the Athens basin, which is following a recent study of the instrument’s ability to monitor aerosol profiles [27].
A description of the MAX-DOAS system and the data retrieval procedures are provided in Section 2 along with an introduction on the model simulations and a brief description of the in situ monitoring stations. In Section 3, the results of the temporal and spatial analysis are presented and compared with in situ measurements towards investigating the ability of MAX-DOAS to capture the spatiotemporal characteristics of urban air pollution. Moreover, an estimation of the contribution of urban sources is attempted, aided by model simulations. The main conclusions and a summary of the findings are provided in Section 4.

2. Methodology

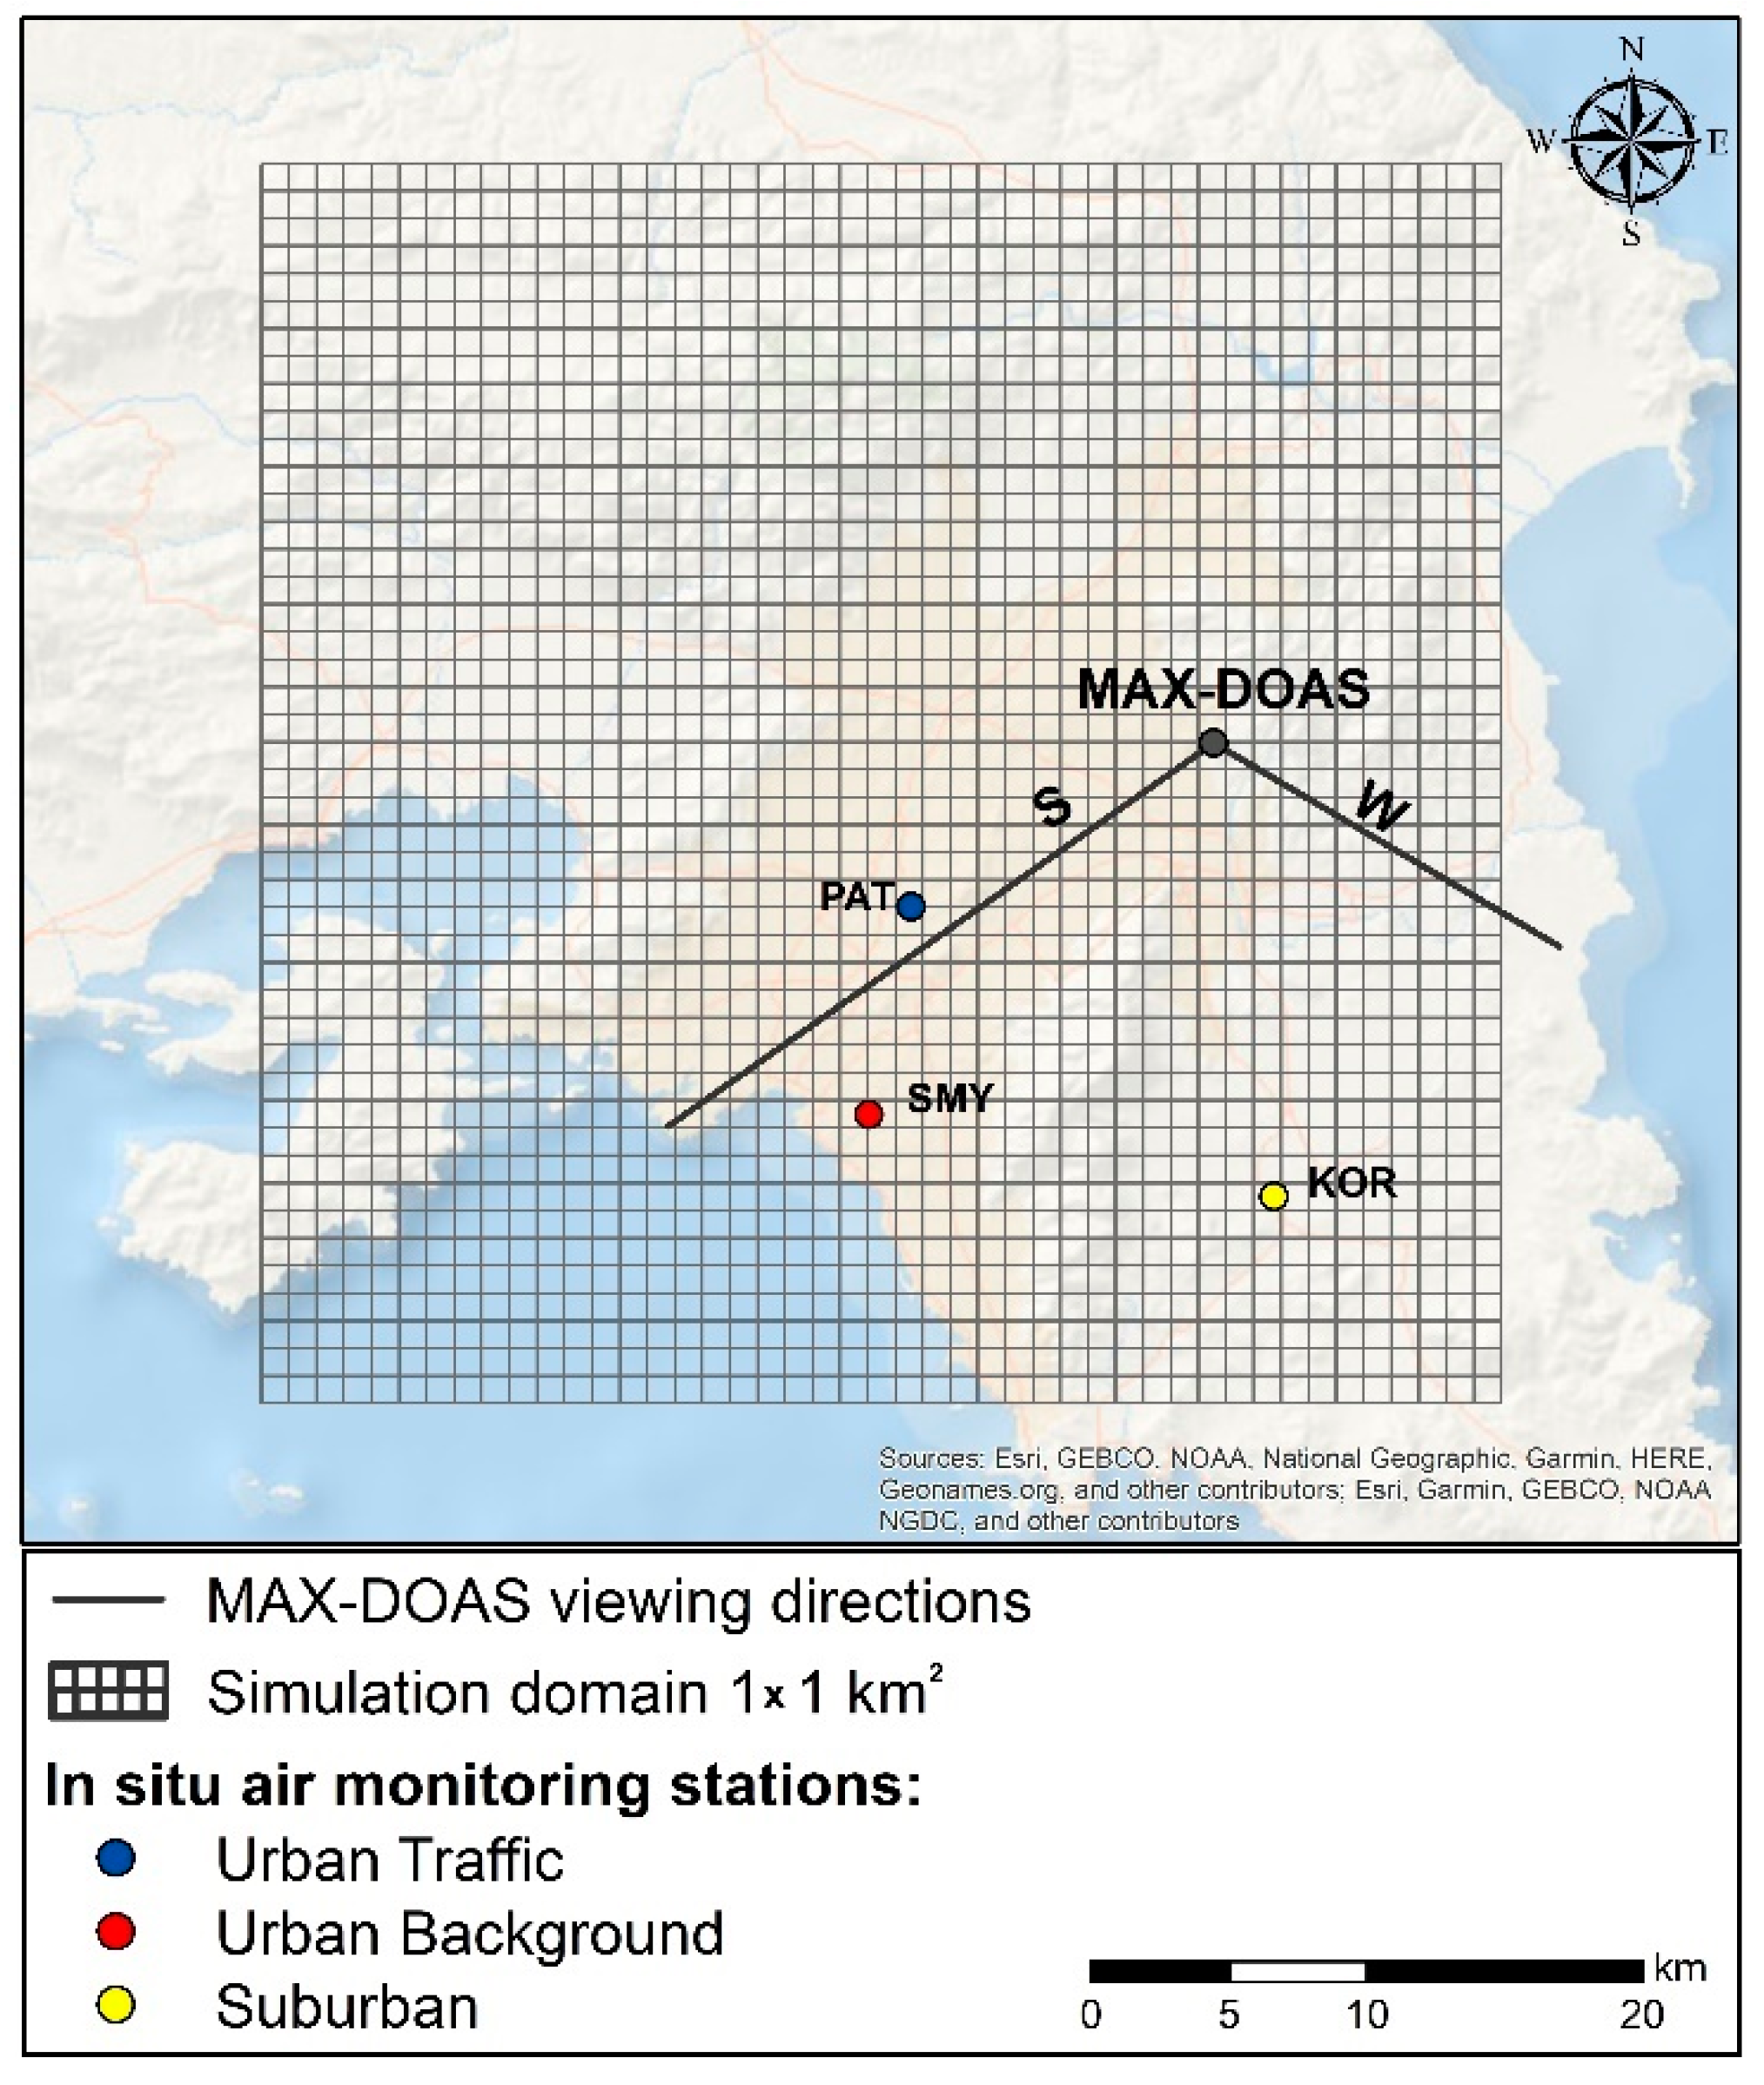
2.1. The MAX-DOAS System

Since October 2012, a MAX-DOAS instrument has been operating from the top of a hill at the premises of the National Observatory of Athens (38.05° N, 23.86° W, 527 m a.s.l.) This was developed by the University of Bremen and is part of the BREDOM network (Bremian DOAS Network for Atmospheric Measurements, http://www.iup.uni-bremen.de/doas/groundbased_data.htm, accessed on 1 November 2021). The location of the MAX-DOAS installation along with the three in situ monitoring stations—described in Section 2.3—is shown in Figure 1. The instrument monitors the entire Athens basin, however, it is not affected by direct emission sources because it is far away from the road network. The system performs spectral measurements in the 330–500 nm ultraviolet and visible wavelength range and comprises a charge-coupled device (CCD) detector (Andor, 2048 × 512 pixels), a grating spectrometer (LOT 260S) and a telescope unit, with 1o field of view, mounted on a pan-tilt head and connected to the spectrometer with fiber optics. In terms of accuracy due to calibration, the MAX-DOAS method excels when compared to other techniques (such as sun photometers or lidar) because it is based on differential absorption and does not require absolute radiometric calibration. A more detailed description of the instrument is provided by Wittrock et al. (2004) [15]. The MAX-DOAS system is based on the concept of observing several viewing geometries; for this study, measurements with a temporal resolution of 15 min at two azimuthal viewing directions and seven off-axis elevation angles (1°, 2°, 4°, 8°, 15°, 30°, 90°) were chosen. The different elevation angles provide insight into the vertical distribution; the measurements close to the horizon have high sensitivity to trace gases in the boundary layer, while the measurements at larger elevation angles are representative of the higher atmospheric layers and the zenith observations are used as background spectra to account for Fraunhofer absorption structures and stratospheric contribution. An issue, however, that arises from the elevated location of the instrument (527 m a.s.l.) is the possible absence of part of the NO2 that resides close to the surface in the measured absorption signal. The selected azimuthal directions point to 52.5° (S) and −60° (W) with respect to south, and are associated with urban and remote atmospheric conditions, respectively [23].
The measured sky radiance spectra were analyzed by means of the NLIN retrieval code [28,29] developed by the Institute of Environmental Physics and Remote Sensing (IUP—University of Bremen). For the DOAS fitting, a fourth degree polynomial was applied at the fitting window 425–490 nm and the NO2 cross-section at 298 K that was obtained from Vandaele et al. (1998) [30] was used. The tropospheric differential slant column densities (DSCDs), which are actually the integrated concentrations of the absorber along the light path, were derived by using concurrent zenith observations as a reference measurement that is subtracted from the off-axis observations. MAX-DOAS measurements at solar zenith angle (sza) >75° were excluded from the analyses in order to limit the possible impact of stratospheric absorption interferences on the measurements. The conversion of DSCDs into tropospheric vertical column density (VCDtrop), which does not depend on the elevation angle of the measurements, was obtained using a geometric approximation [31] (Equation (1)). The approach was based on the assumption of single scattering and that the scattering altitude is above the boundary layer height [32] and the NO2 layer resides below the scattering altitude.
V C D t r o p = S C D α S C D 90 ° s i n 1 ( a ) 1
The symbol α denotes the telescope elevation angle relative to the horizon. Although recent studies have shown that the 30° elevation angle is most appropriate for a geometric approach [26,33], in this case, where the instrument is performing measurements at an elevated site, the 15° elevation angle (also used in other studies, e.g., [34]) was selected as more appropriate because it has a longer light path within the atmosphere compared to the 30° elevation and still ensures that the last scattering altitude is above the boundary layer. However, the results from the 15° and 30° elevation angles were compared and only those retrievals that agreed within 20% were included in further analyses. In this way, measurements strongly affected by clouds or spatial inhomogeneities were excluded. The accuracy of the geometric approximation has been validated in certain cases with the use of radiative transfer simulations [16].
Differential slant and vertical NO2 column densities were produced for the 5-year period (October 2012–July 2017). Long-term analysis was therefore possible in order to investigate diurnal, weekly, seasonal and annual cycles. In order to investigate the influence of clouds on the long-term analysis, the days with large portions of cloud cover (cloud cover data provided by the National Observatory of Athens) were screened out. The effect of the screening on the seasonal analysis is shown in Section 3.2. The mean difference between the retrieved and the cloud screened data was 5% for both directions. The corresponding mean difference during the winter months with frequently cloudy conditions was 13%. Therefore, it can be deduced that the influence of clouds did not considerably interfere with the interpretation of the results. Similar results regarding the cloud effect on long-term measurements have been reported in other studies [16].

2.2. Model Simulations

The air quality fields over the urban area of Athens were simulated using TAPM V4 (The Air Pollution Model) [35]. TAPM is a prognostic meteorology-dispersion model capable of predicting the flows that are important to local-scale air pollution, utilizing a background of larger-scale meteorology provided by synoptic analyses (from ECMWF ERA5 reanalysis). The meteorological component of TAPM is an incompressible, non-hydrostatic, primitive equation model with a terrain-following vertical coordinate for three-dimensional simulations. The model configuration for the predictions of the meteorological component in the current study involved 4 domains centered at 38°2′ N, 23°43′ E, with a horizontal grid spacing of 12 km (parent domain), 4 km, 3 km and 1 km (innermost domain), and a common vertical structure of 30 terrain-following layers (first layer at 10 m, vertical top height at 8 km).
The air pollution component of TAPM uses the predicted meteorology and turbulence from the meteorological component and consists of the Eulerian Grid Module (EGM), the Lagrangian Particle Module (LPM) and the Plume Rise Module. The model includes a chemistry mode (used here) with sulfur and fine particle chemistry (PM10, NOX, NO2, O3, SO2, PM2.5), which is composed of gas-phase photochemical reactions based on the Generic Reaction Set and gas- and aqueous-phase chemical reactions for SO2 and particles. Wet and dry deposition are also simulated. For the purposes of the current study, the air pollution simulations were performed for the innermost urban area of Athens with a horizontal spatial resolution of 1 km (Figure 1) and following the vertical grid structure of the meteorological setup. High-resolution emissions are produced by the UrbEm method and tool [36], exploiting the regional emission inventory CAMS-REG. The model was applied for the period January–June 2016. A baseline scenario was implemented using conventional emissions followed by a scenario excluding vehicle emissions that was applied to identify the contribution of road transport on the urban levels of NO2. The hourly 2-D boundary concentrations were based on regional background in situ measurements at the EMEP site of Aliartos, Central Greece.
More details on TAPM—overview, equations, physic-chemical parameterizations and verification results—can be found in Hurley et al. (2003) [37], Lunar and Hurley (2003) [38] and Karl et al. (2020) [39], while the setup and configuration of the model for Athens is described well in Grivas et al. (2020) [40].

2.3. In Situ NO2 Monitors

The NO2 concentration measurements used in this study for comparison reasons were obtained from three in situ monitoring stations (Figure 1) that are part of the National Air Pollution Monitoring Network (NAPMN) (https://ypen.gov.gr/perivallon/poiotita-tis-atmosfairas, accessed on 1 September 2021). Nitrogen oxides are being monitored on a continuous basis with a sampling time of 1 min, using automatic analyzers based on chemiluminescence. As the in situ measurements were only used in order to show the consistency of the MAX-DOAS measurements, we chose only those stations that were closer to the viewing directions of the instrument. The three selected stations for this study, Patision (PAT), N.Smyrni (SMY) and Koropi (KOR), were representative of urban traffic, urban background and suburban conditions, respectively. The elevation of each station and their distance from the MAX-DOAS site were 105 m a.s.l./15 km, 50 m a.s.l./20 km, 140 m a.s.l./18 km for PAT, SMY and KOR stations, respectively. The urban station monitors the direct influence of vehicle traffic to air pollution and is expected to be particularly sensitive to local variations, while the urban background and suburban stations monitor the background concentrations of pollutants in the urban area and the pollution in remote areas with reduced emissions in the direct vicinity, respectively. Hourly averaged concentrations during the daylight hours when MAX-DOAS was also operating were used for the temporal analysis (diurnal and seasonal) presented in this study.

3. Results and Discussion

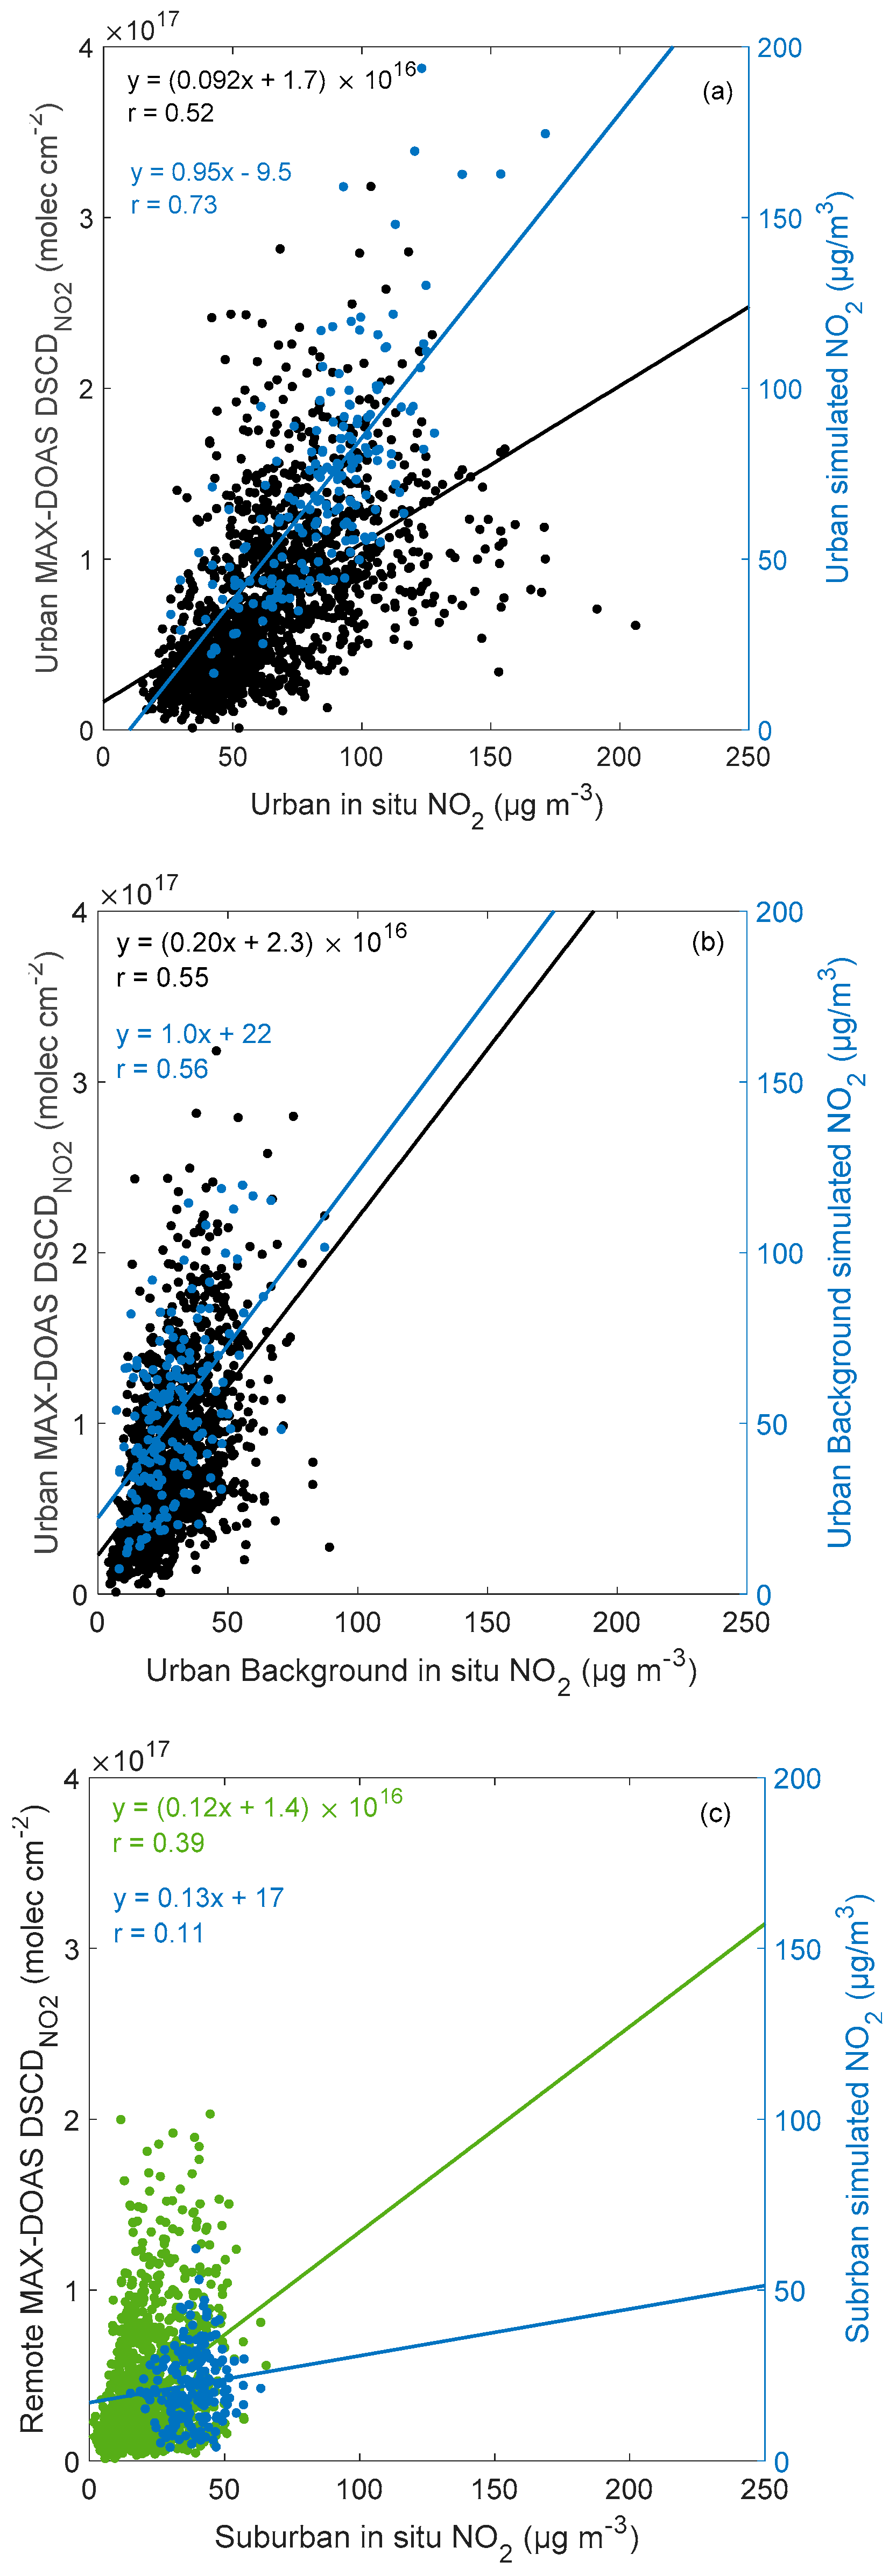
3.1. Comparisons with In Situ Observations

For the evaluation of the MAX-DOAS measurements, the retrieved data sets were compared to in situ observation data acquired from three in situ monitoring stations located in an urban, urban background and suburban sites (Figure 1). For the retrieval of the tropospheric NO2 slant columns, the +1° elevation angle—which yields the highest tropospheric sensitivity and largest horizontal extension of the absorption paths along the line of sight—was used. Although the two techniques cannot be directly compared as they refer to different measurement units (column densities vs. concentrations), if the tropospheric NO2 profile shape is assumed to not change, the measurement results are strongly related. Another issue arising when comparing ground-based remote sensing with in situ measurements is the different spatial representativeness (atmospheric column vs. point measurements). In areas with inhomogeneous spatial distribution of NO2, such as large urban areas, this may lead to differences between the two datasets in certain cases. Moreover, the in situ monitoring stations provide continuous measurements on an hourly basis, while MAX-DOAS performs measurements only during daylight. Therefore, in order to compare the measurements from the two different techniques, daily averages—to avoid short-term temporal variations—were calculated while only taking into account daylight measurements.
Mean tropospheric slant columns retrieved from the measurements at the lowest elevation over the urban area ranged from 0.1 to 32 × 1016 molec cm−2. Linear regression between daily DSCDs and in situ measurements obtained during the daylight hours is presented in Figure 2. The moderate correlation (r ≈ 0.55) calculated over the urban areas showed that pollution episodes are satisfactorily captured by MAX-DOAS. A similar correlation between MAX-DOAS and in situ measurements was found in a campaign conducted in a polluted area in the Netherlands [26]. A lower correlation (r = 0.39) was found over the remote area, and this can be explained by the fact that although the telescope’s viewing direction is towards the remote area, the light path is also probing emissions from sources that are closer to the instrument. In some cases, increased NO2 was recorded by the in situ instruments, while the MAX-DOAS values remained low. This is expected because the in situ measurements are close to the urban sources and highly affected by traffic emissions [41], while MAX-DOAS measures NO2 in the boundary layer. In order to investigate whether the NOx emissions from domestic heating affect the correlation between the two measurement techniques, the correlation between MAX-DOAS and in situ measurements was also calculated for the warm period (April–October) and cold period (November-March) separately; no difference was found. The effect of the wind direction on the correlation between MAX-DOAS and in situ measurements was also examined using available data for the period 2013–2015 from the meteorological database of the National Observatory of Athens. The results are shown in Table 1. It is evident that the wind direction does not greatly influence the correlation between the two techniques. Only the westerlies (88 days)—which contribute to the transport of polluted air masses towards the remote area—and the easterlies (34 days) were related to a weaker correlation in the remote and urban areas, respectively. The mean daily NO2 values for the two periods derived from MAX-DOAS and in situ measurements are shown in Table 2.
Mean daily tropospheric vertical columns retrieved from the MAX-DOAS measurements over the urban area ranged from 4.8 to 42 × 1015 molec cm−2; these values are comparable to the results of other studies conducted over urban or polluted areas, e.g., [16,42]. When tropospheric NO2 VCDs were used instead of DSCDs for the comparison, the correlation was found to be weaker by about 10% over both viewing directions. This suggests that the scatter in MAX-DOAS versus in situ measurements is to some degree dominated by spatial averaging effects. Although to our knowledge there is no other study comparing vertical and slant columns with in situ measurements simultaneously, our finding is supported by [43] who used in situ and MAX-DOAS NO2 measurements to evaluate an atmospheric chemistry model. They showed that slant columns are more suitable for such a comparison because they account for the horizontal heterogeneity in the viewing direction in contrast to vertical columns, the retrievals of which involve more uncertainties and complexity. In addition, the measurements at lower elevations angles—as used in our study—are averaging over a much greater volume and in case of horizontal heterogeneity the results largely differ from the measurements at higher elevations used for the slant to vertical column conversion [44]. Overall, given the distance between the MAX-DOAS and the in situ monitors and the different spatial sampling, with MAX-DOAS measuring more dispersed air masses, the agreement between the two techniques can be considered as satisfactory.
Model results complement MAX-DOAS findings on the investigation of NO2 origins (Section 3.4), thus they were evaluated against in situ measurements similarly to the above comparisons (Figure 2, Table 2). TAPM performs well for NO2 based on daily values, with a fraction of predictions within a factor of 2 greater than 50% for all stations and a correlation of 0.65 (average of all stations, 544 prediction-observation pairs). The average performance at the urban site (r = 0.7, FAC2 = 97%, MB = −13.6 μg m3) was better than for the other stations. A large positive bias was exceptionally found for the urban background site. The temporal correlation among measurements and predictions was very high for the urban sites (with r ranging between 0.56 and 0.73) and low (r = 0.11) for the remote site. This performance is regarded as satisfactory—especially within the urban core of the city—given the fact that the model is used as a complementary tool for (the spatial patterns of) source identification, rather than the estimation of absolute NO2 values.

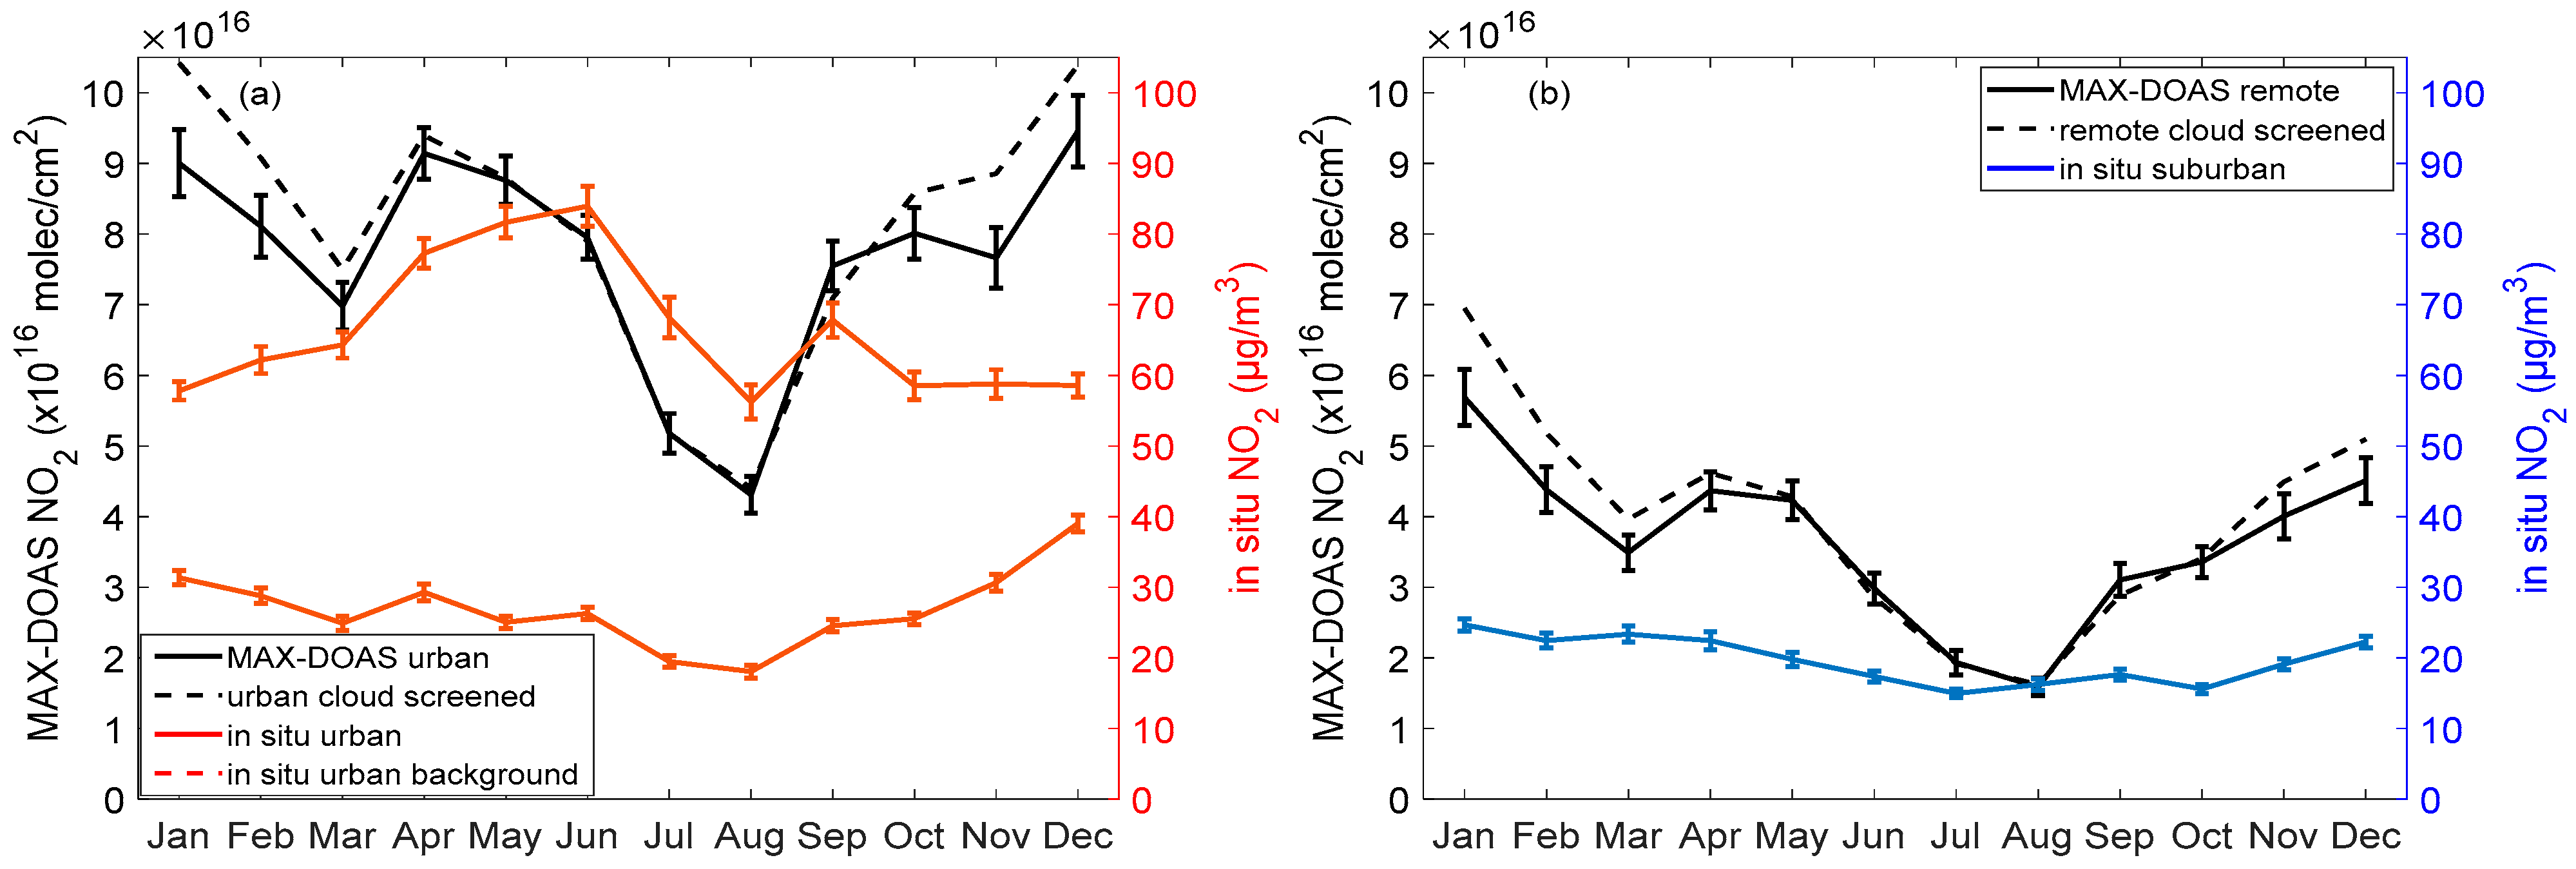
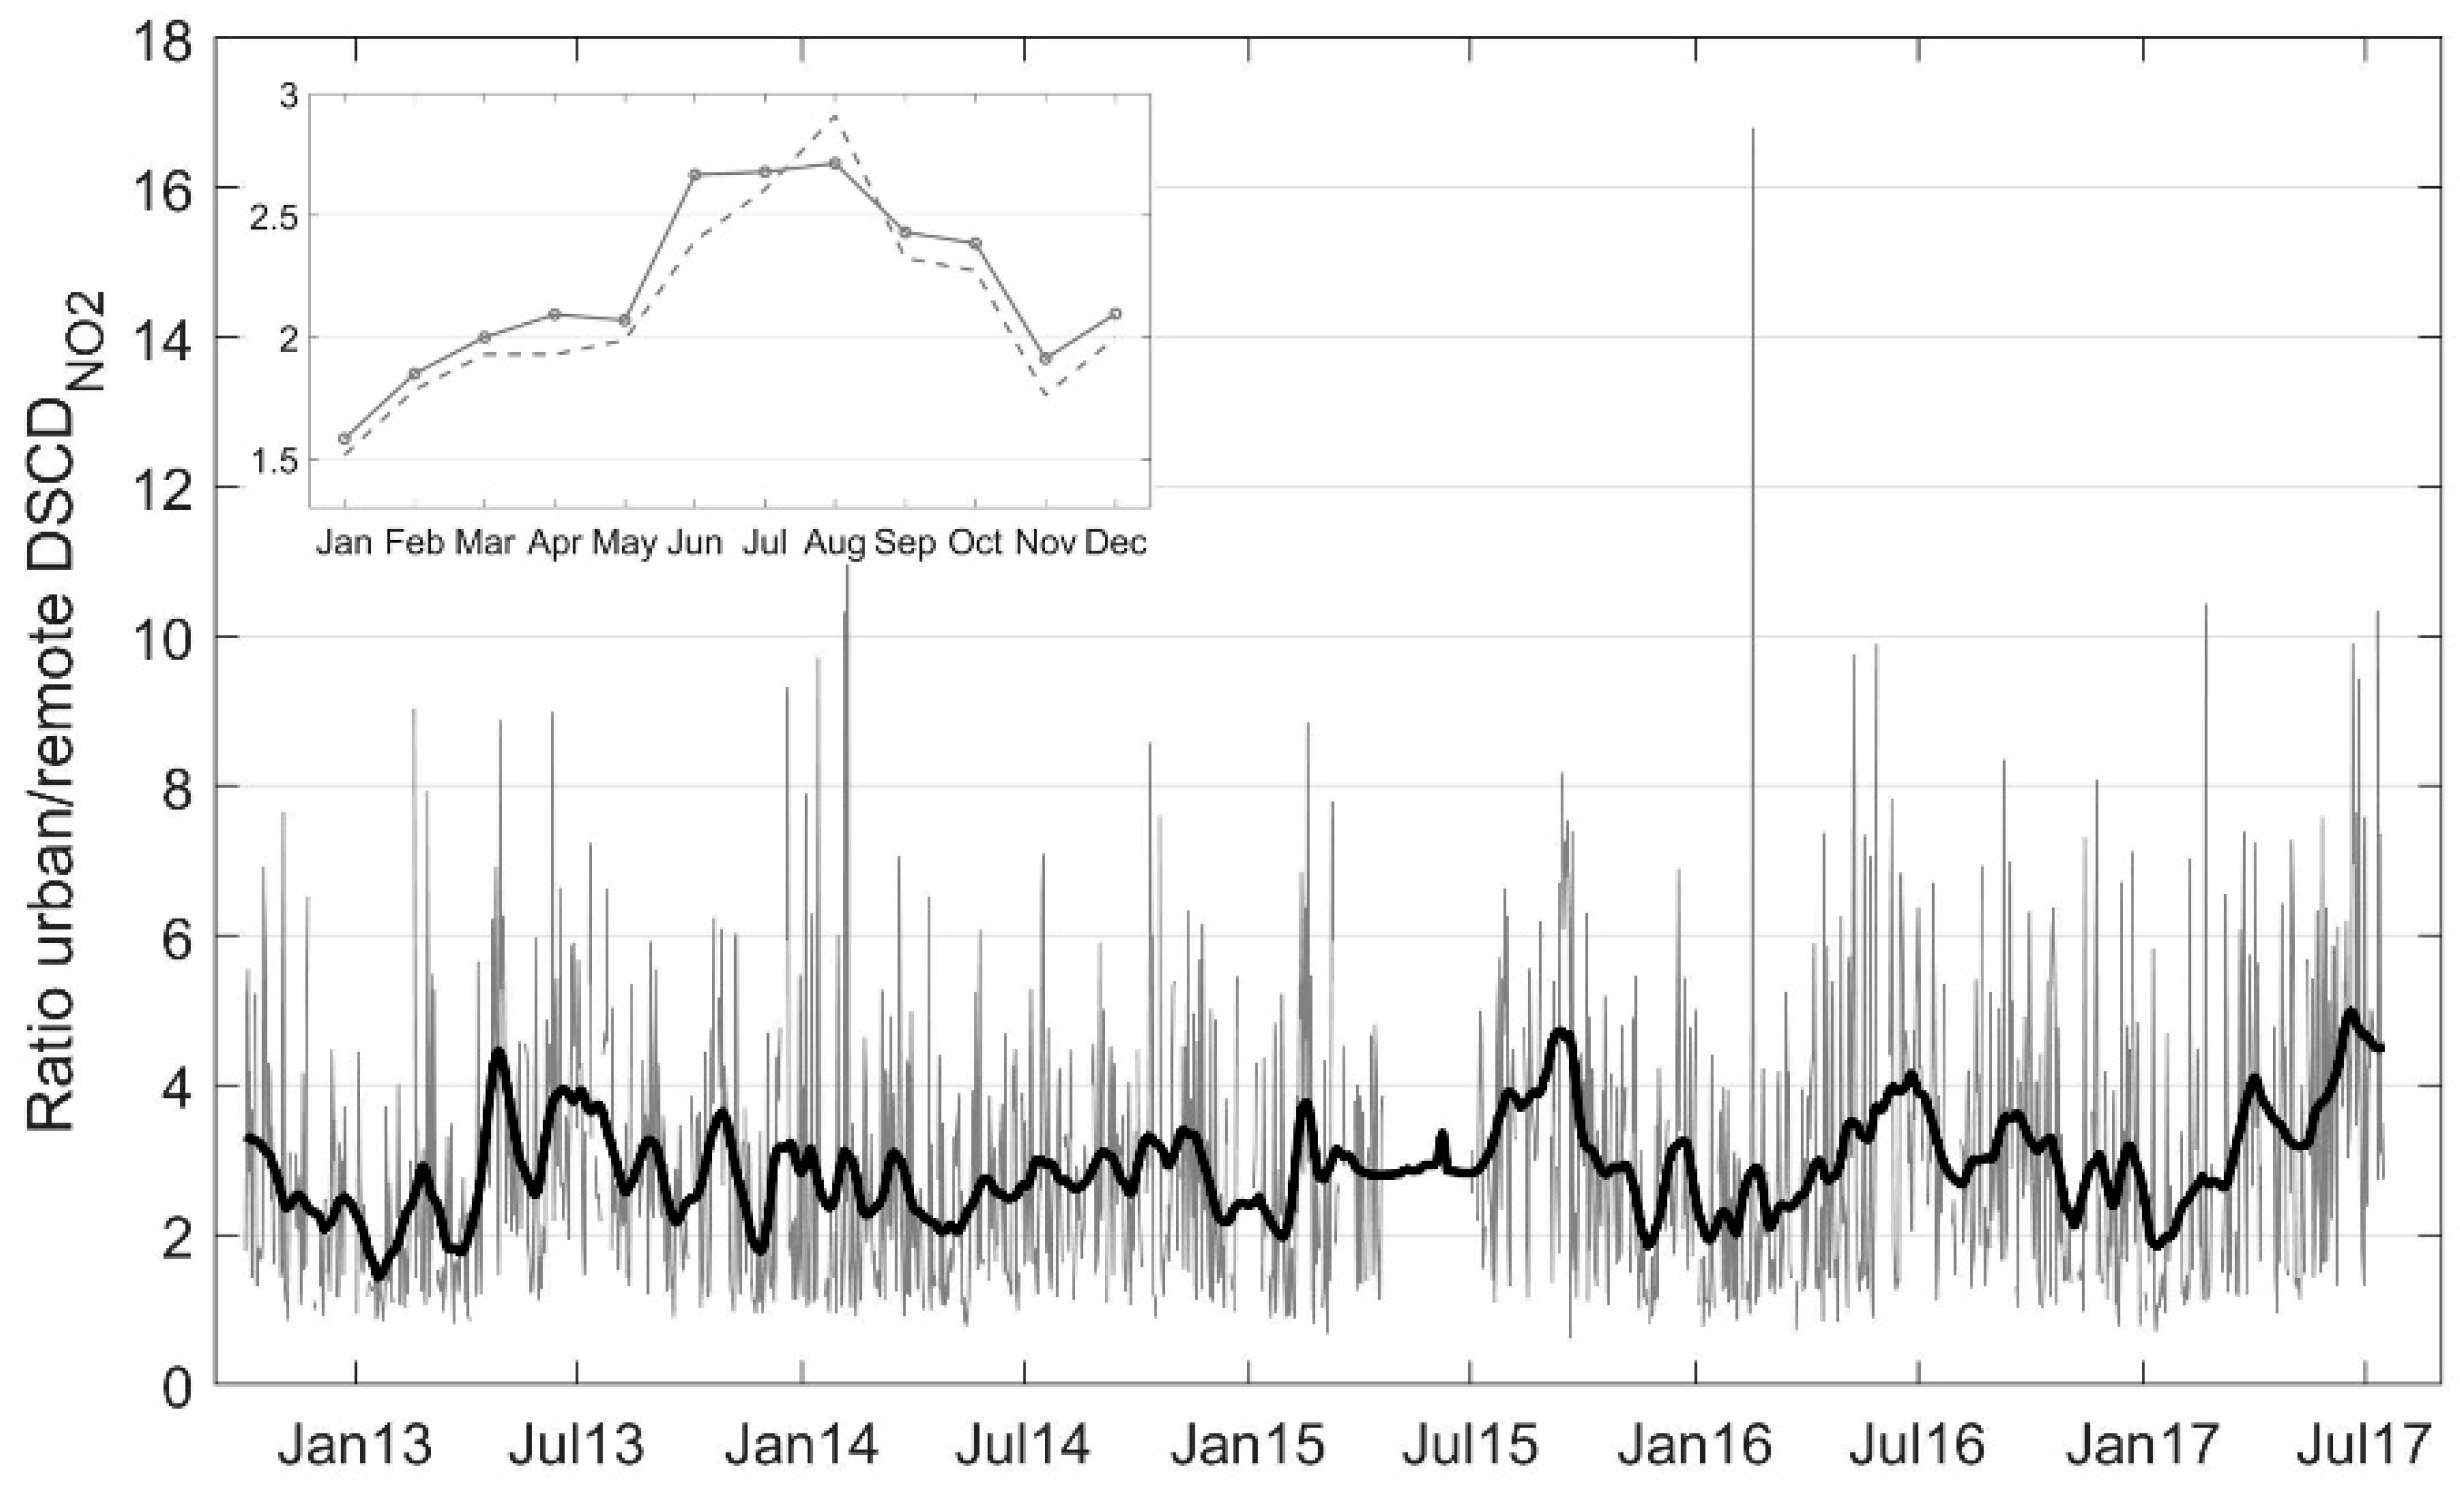
3.2. Annual Cycles and Spatial Variability

Monthly averages of tropospheric NO2 slant columns and in situ concentrations are shown in Figure 3; the annual cycles derived from the urban and remote viewing directions of MAX-DOAS are compared with those from the corresponding urban, urban background and suburban in situ measurements. The expected seasonal variability, with enhanced NO2 levels in winter—due to increased emissions (for heating purposes and traffic)—and low levels in summer—owing to the high photolysis rate in conjunction with reduced emissions—is evident. The same seasonal variability has been reported in studies for Athens (e.g., [5,45]) and other big cities (e.g., [18,19]). Recent satellite measurements for Athens also capture the NO2 seasonality with winter/summer maxima/minima, however, they exhibit a slightly different pattern (e.g., [46]). The MAX-DOAS measurements towards the urban direction were consistent and highly correlated (r = 0.83) with the urban background in situ monitor. The discrepancy seen from January to March between urban in situ and the other two measurements (MAX-DOAS and urban background) could be attributed to the fact that the urban station is dominated by local traffic emissions, while the urban background and the MAX-DOAS measurements are more representative of the overall atmospheric conditions. Moreover, it is important to notice that the NO2 formation/decomposition is also related to other pollutants (such as O3 and VOCs) and to a complex, non-linear photochemistry.
The ratio of winter-summer was 1.5 for the urban viewing direction of MAX-DOAS and 0.85 for the urban in situ concentrations, showing that the in situ measurements overestimated the NO2 levels in summer, possibly owing to the enhanced secondary pollutants due to photochemistry, which can interfere with the molybdenum converters of the chemiluminescence analyzers. Similar conclusions have been reported by Steinbacher et al. (2007) [47].
The measurements for the remote area exhibited lower NO2 levels by almost 50% and the seasonal variability analysis reproduced the characteristic annual cycle for NO2. A very high correlation (r = 0.83) was also found in this case between in situ and MAX-DOAS techniques. A higher winter-summer ratio (2.2) was found for the MAX-DOAS measurements and the corresponding ratio for the suburban in situ measurements was 1.4.
The horizontal distribution of the pollutants in the extended area of the Athens basin, yielding different air samplings on a spatial scale, can strongly affect comparisons in some cases. A brief insight into the horizontal inhomogeneity of the tropospheric NO2 field was provided by the MAX-DOAS measurements based on the observed differences between the two azimuthal viewing directions, representative of different types of areas, thus, different air pollution conditions. For the estimation of the horizontal heterogeneity, the ratio of the MAX-DOAS measurements at the +1° elevation angle towards the urban and remote areas was used. Assuming a homogeneously distributed NO2, this ratio would be unity. Conversely, in the case of large horizontal NO2 gradients, the ratio would strongly deviate from unity accordingly. The results for the whole period of this study are presented in Figure 4; a 30-day moving average was applied to the data to better recognize the main features. The median heterogeneity ratio was around 2.5, which is expected given the different degree of urbanization (grey curves in Figure 5). The higher ratios calculated during summer can be explained by the shorter lifetime of NO2, which in turn prevents the dispersion of the trace gas over large distances. Due to the special topography of Athens, which is surrounded by mountains, southern winds favor the accumulation of pollutants in the basin. In this case, a more homogeneous distribution of the pollutants would be expected. To further investigate this, the seasonal variation of the heterogeneity ratio was only calculated for the days when winds from southern directions (130–210°) were prevailing. The differences were small, however, the results corroborate the expected higher homogeneity (Figure 4, internal panel).
The spatial representativeness of each of the MAX-DOAS viewing directions, introduced in Section 3.1, can be further supported by the daily correlation (when statistically significant at the 95% significance level) of retrievals with the outputs of the surface mean daytime NO2 model predictions (Figure 5). The 6-month mean correlation coefficient (r) values intersecting the viewing angles are elevated (above 0.5) over distances of up to 15 km (urban direction). For MAX-DOAS measurements from a mountain station (which is the case of this study), observations can reach such long distances as there are no obstructions, which was indeed already found for the case of Athens [48]. When focusing on the remote (W) direction, MAX-DOAS measurements correlated very well with model predictions (r ranged from 0.6 to 0.8). This can be explained by the consistently low (<50%) urban density along the line of sight of the instrument, thus a low variability of air pollution that results in a good spatial representativeness of this viewing direction, especially in the first 5 km of the path. However, the urban (S) retrieval contained a signal of approximately 5 km from less urbanized areas (the foothills and downhill on the mountainous site), which is averaged with the air pollution maxima at the urban core of the Greek capital. This most probably explains the lower values of the mean correlation between the slant column and the high-resolution fields when compared to the remote direction.
To provide insight into the long-term trend of NO2 in Athens, the interannual variability from the MAX-DOAS observations is also presented (Figure 6). The economic recession since 2008 and the subsequent reduction in fossil fuel consumption have had great impact on air quality in Europe (e.g., [49,50]). For Athens in particular, satellite observations have revealed a 30–40% reduction in tropospheric NO2 columns since 2008 [51] and a stabilization of the decreased NO2 levels since 2011 [52]. The MAX-DOAS measurements towards the remote area reinforce the stabilization that has been found from the satellite observations. However, the measurements towards the urban center show an interesting rate of increase of 0.3 × 10¹⁶ molec cm−2/per year since 2012, leading to a 20% increase over the last five years.

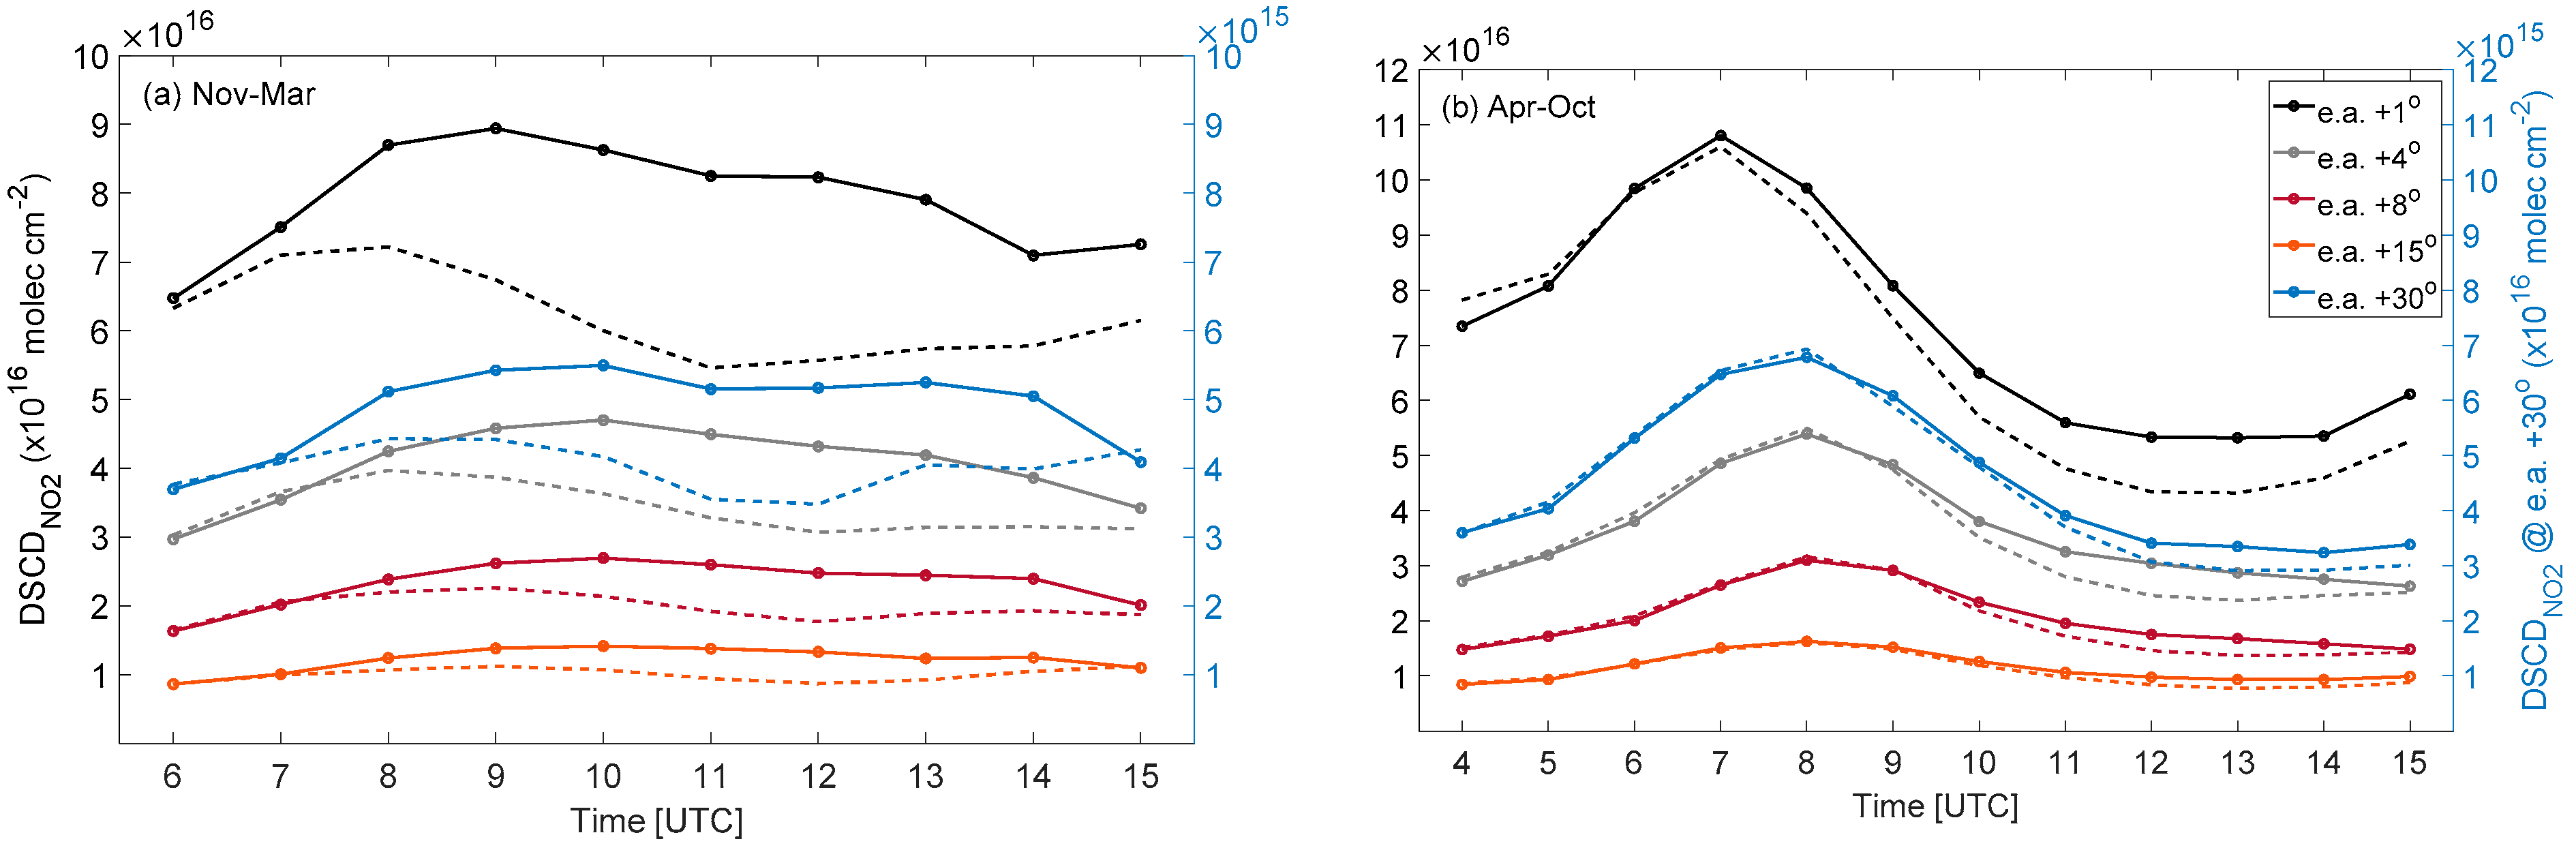
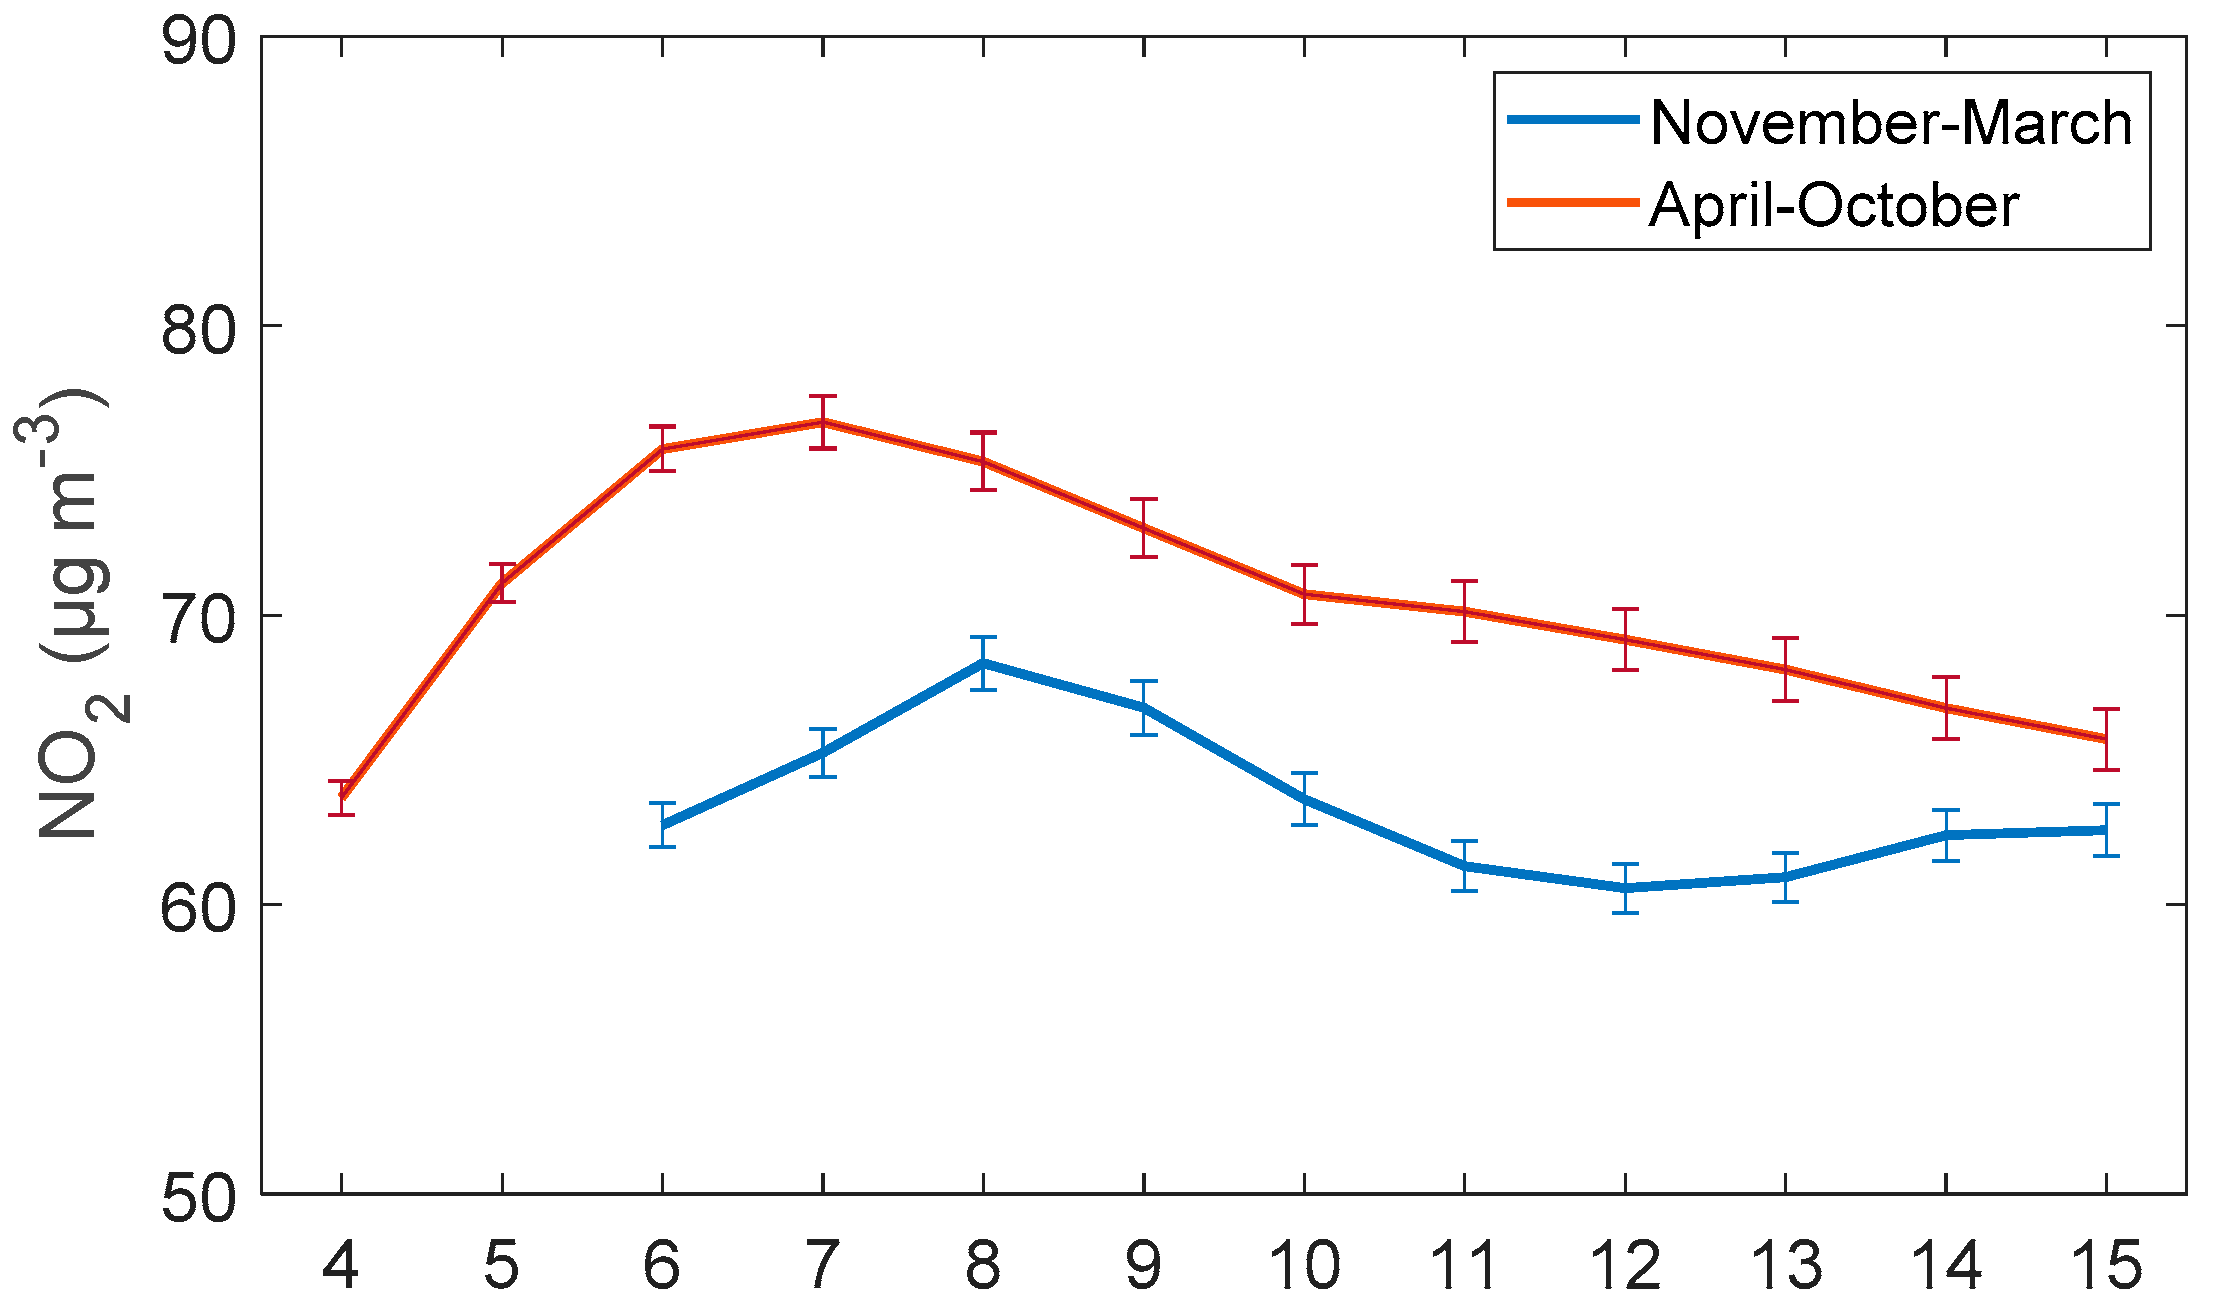
3.3. Vertical Changes in Diurnal Variation

In addition to the column values, the vertical distribution of the NO2 was investigated as well. One-hour binned urban MAX-DOAS measurements at five elevation angles, averaged on a daily basis for the whole 5-year period, are shown in Figure 7 for the warm period (April-October) and the cold period (November-March) separately. The reproduction of the diurnal variation pattern from the low elevations provided evidence that the MAX-DOAS method is able to measure the NO2 variability in the urban environment of Athens. Morning rush hours, indicative of increased anthropogenic activity, were evident in the retrieved diurnal patterns, with peaks at around 07:00UTC (10:00LT) and 09:00UTC (11:00LT) during the warm and the cold period, respectively. These findings are in consistency with other studies for the area of Athens, showing that the traffic peaks between 8:00 and 11:00LT [53,54]. However, an apparent seasonal variability in the diurnal cycles was present. During summer, the morning strong peak of the anthropogenic emissions is soon decomposed by the daytime photochemical loss of NO2 at around local noon (10:00UTC) due to the intense photochemistry [55]. Conversely, in winter, the NO2 lifetime is longer, and although a slight decrease can be seen around local noon, NO2 levels remain high throughout the day. A similar seasonality in the NO2 diurnal cycle in Athens has also been reported in an earlier study for Athens [45].
As expected, decreased DSCDNO2 was observed with increasing elevation angles. The large difference in the measured levels of NO2 between the lowest and the rest of the elevation angles is indicative of the fact that most of the NO2 resides close to the surface over highly polluted areas, as also shown in several studies (e.g., [26,56]). However, although the patterns of the diurnal variation at different viewing angles were quite similar, the morning peaks were observed one hour later at higher elevations compared to the +1° angle. This finding proves the vertical convection of the polluted air masses, which are sampled later, at higher altitudes. The effect of the wind speed on the diurnal patterns at different elevations was also investigated; the hourly averaged slant columns were recalculated only for days with wind speed >3 m/s (wind data analyses refer to the period 2013–2015). In the case of moderate or high wind speed, more efficient dispersion of the pollutants and vertical mixing of the atmosphere were expected, and in our analysis this was evident in the diurnal patterns of the cold period (Figure 7a). Although at the beginning of the day the NO2 levels were similar regardless of wind speed, as the day proceeded, the levels were reduced by almost 25% in all elevations. However, during the warm period the photochemistry seemed to be dominant in the NO2 cycle.
For comparative reasons, the diurnal cycle was also calculated for the urban in situ monitoring station for the cold and the warm period (Figure 8). The near-surface measurements also demonstrated the expected NO2 concentration peaks in the morning, coinciding with the local rush hours. Similar results have been reported in previous studies for Athens (e.g., [5]). However, a divergence between surface and MAX-DOAS measurements was observed in winter, with the morning peak appearing one hour later in the MAX-DOAS measurements and a more distinct decay during local noon in the in situ data. The steeper peak decay and the early morning peak in the surface observations could be attributed to the variation in the PBL height throughout the day; the column density measurements were less affected by the PBL variation than the surface volume mixing concentrations. Overall, the comparison of tropospheric NO2 columns with near-surface concentrations in urban areas wherein the pollution was not homogeneously distributed was usually poor due to the different measurement methods.

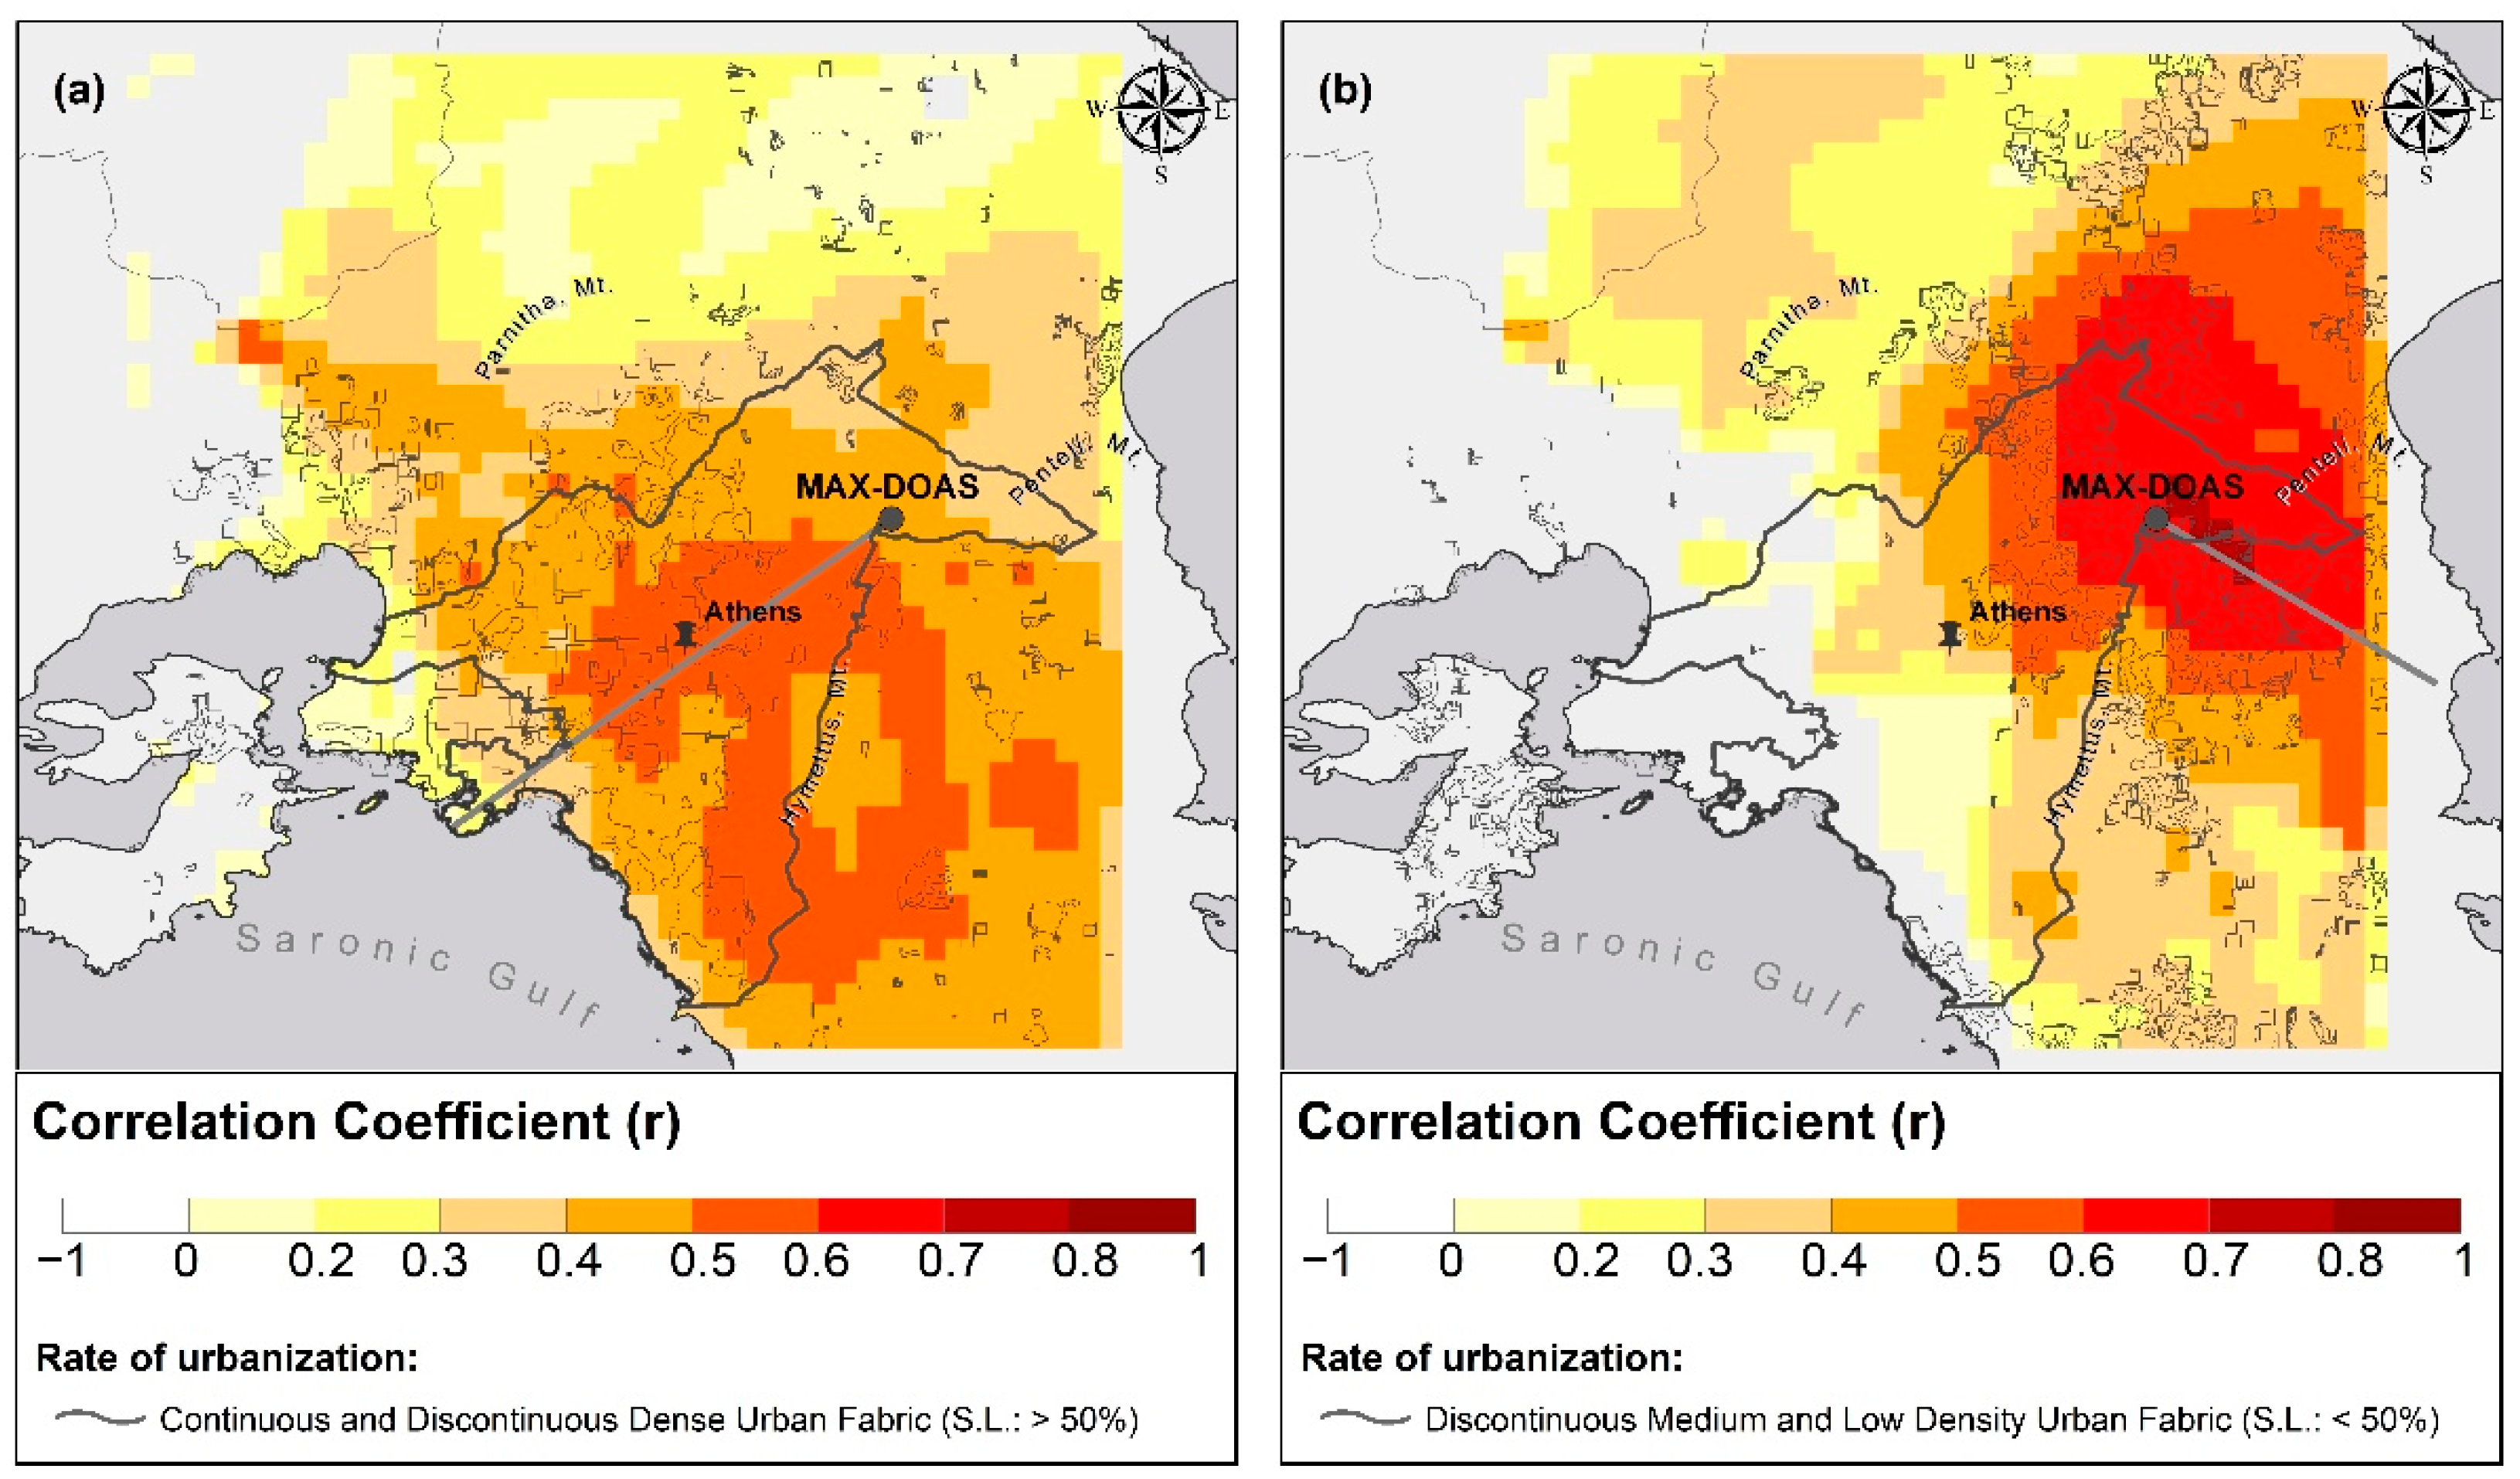
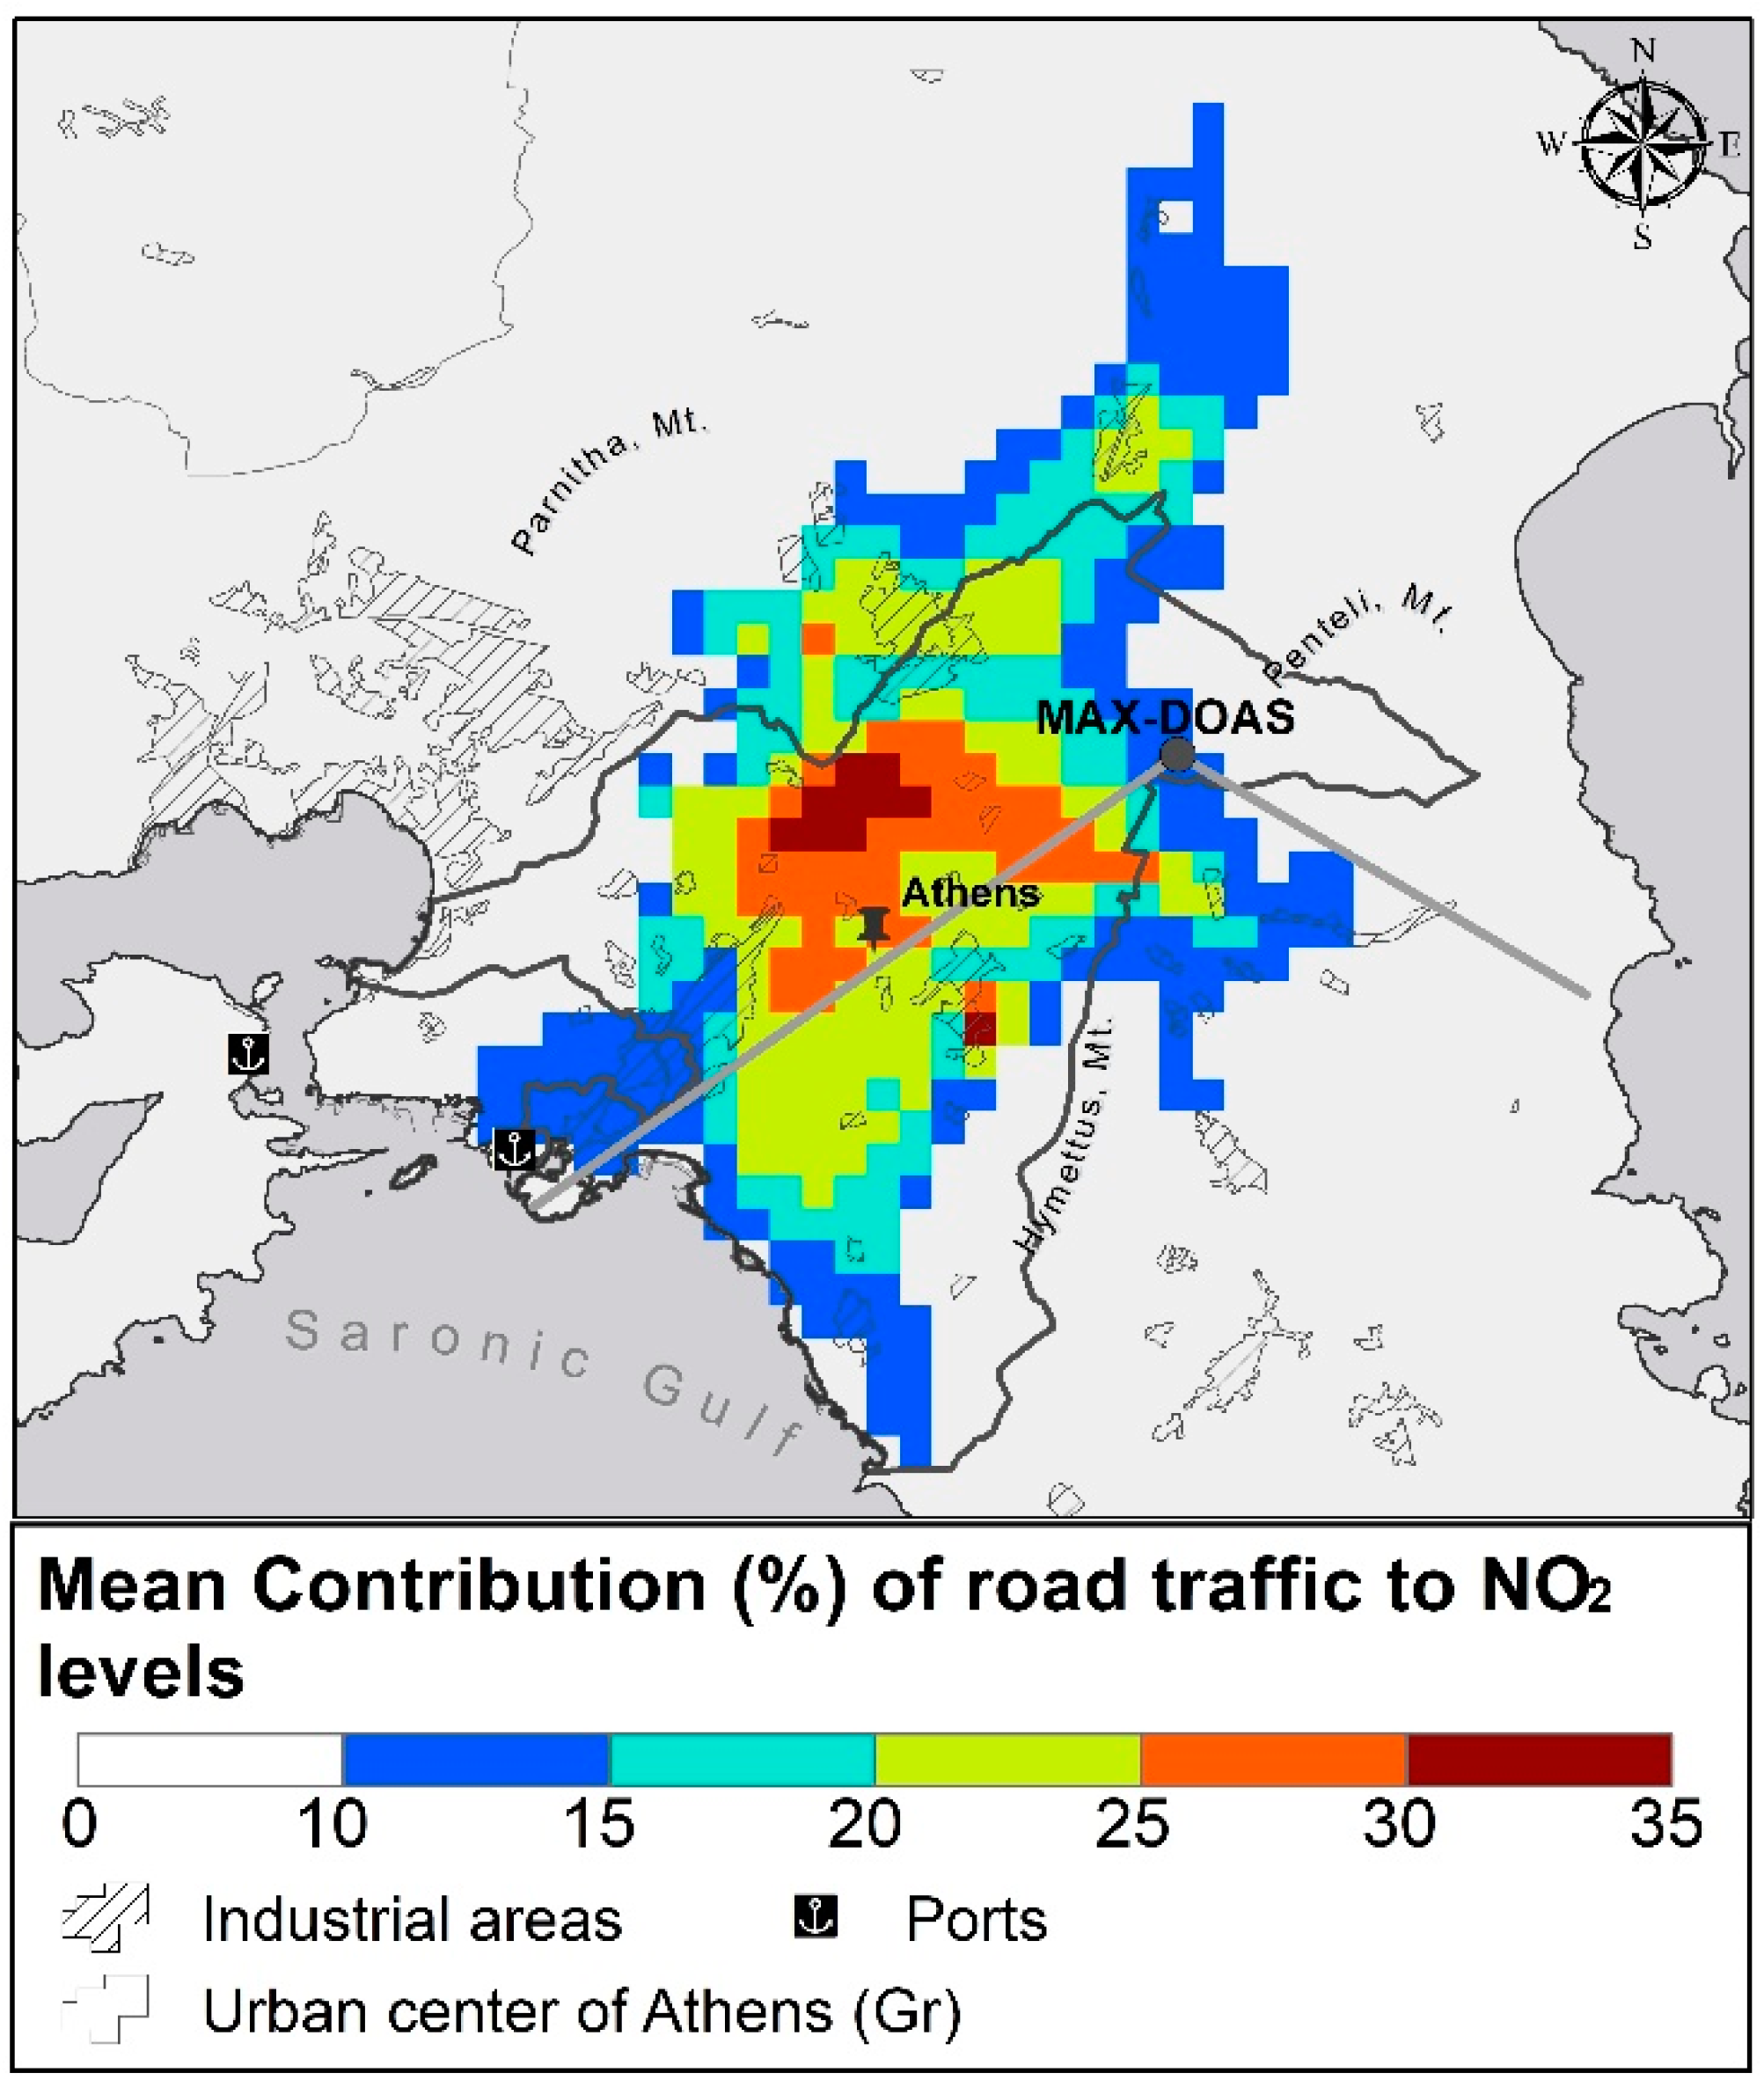
3.4. Contribution of Urban Sources

As a further insight into the ability of MAX-DOAS to estimate the contribution of urban sources to the NO2 levels, the DSCDNO2 levels over the remote area, which are generally less affected by anthropogenic emissions, were subtracted from the measurements towards the urban center. This was performed for two months; one characteristic of winter (16 January) and one of summer conditions (16 June). The contribution of the urban sources to urban pollution was found to be 35% and 65% for January and June, respectively. This difference was expected due to high temperatures and intense photochemistry during summer; in the presence of high NO emissions, the photochemically produced ozone leads to more intense conversion of emitted NO to NO2. The simulations of the city-scale model help identify the fraction of traffic-induced NO2 levels. The comparison between the two applied scenarios showed that 20% (over peri-urban areas) to 35% (over the urban center) of the NO2 levels over the Athens basin was due to road transport (Figure 9), regardless of the season. This is in line with the dependence of the summer increase on atmospheric chemistry phenomena in the urban landscape rather than on an increase in primary emission levels.
Given the above model findings, a complementary analysis was conducted so as to inspect whether MAX-DOAS measurements can reproduce the road transport component of the urban NO2 levels. Towards this end, spatially resolved, daily averaged DSCDNO2 values were retrieved separately for weekdays (Monday to Friday) and Sundays for two characteristic seasons, winter (December–February) and summer (June–August). The weekly cycles of the MAX-DOAS and the in situ observations for the whole 5-year period are also shown (Figure 10). An apparent decrease in NO2 levels was observed on Sundays compared to the mean weekday level (Table 3), in consistency with previous studies over all large European cities (e.g., [57]). This is largely attributed to the missing component of commuting to and from work from the anthropogenic activity. Through this analysis, it was deduced that traffic emissions contribute 23% (summertime) to 26% (wintertime) to the NO2 levels over the urban areas of Athens, which seem to be the prevailing values predicted by the model along the urban viewing angle (yellow and orange colors in Figure 9). Similar results have been reported in other studies conducted for Athens in the past; a reduction of about 20% in traffic related NO2 on Sundays has been found during summer [14], while another study reported a 50% contribution of road transport to urban NOx [58].

4. Summary and Conclusions

In this study, tropospheric slant column densities of NO2 from MAX-DOAS measurements for the period October 2012 to July 2017 over Athens, Greece, were retrieved in order to be compared to near-surface NO2 measurements from chemiluminescence monitors. This is a very important step towards understanding the nature of information provided by long-term MAX-DOAS measurements that can be used for the assessment of the urban pollution. It is the first time that MAX-DOAS measurements have been validated with the use of in situ measurements in Athens. However, it should be noted that the comparison was only made on a qualitative basis due to the different principles of these two measurement techniques and their different spatial representativeness. The in situ monitoring stations were representative of three different locations: urban, urban background and suburban. The results of the comparison between the most sensitive +1o elevation angle and the in situ data for the 5-year period showed a moderate correlation, with correlation coefficients r ≈ 0.55 and r ≈ 40 for the urban and the remote area, respectively. This should be expected, and the agreement is promising when considering that the monitoring stations perform point measurements close to the surface while the MAX-DOAS technique is sensitive to a wider horizontal and vertical field and measurements are conducted from an elevated station. The wind direction was found to have a weak influence on the correlation; only western and eastern winds were related to weaker correlation in the remote and the urban area, respectively. During the experiment, the mean tropospheric slant columns on a daily basis retrieved from measurements at the lowest elevation over the urban area varied between 0.1 and 32 × 1016 molec cm−2, with an average of 7.7 × 10¹⁶ molec cm−2. Additionally, a comparison between MAX-DOAS and model simulations for the whole Athens basin revealed a very good spatial representativity of the MAX-DOAS observations, especially for the remote area, with the light path length reaching 15 km.
The spatial homogeneity, the vertical distribution and the temporal variations of NO2 were also investigated. The annual cycles retrieved from both techniques captured the expected NO2 characteristics, with lower mean levels during summer. The characteristics of the seasonal cycle for the urban area were reproduced for the remote area, only differing in the pollutants’ levels; the levels of the remote area were decreased by 50%. The MAX-DOAS measurements, which represent regional rather than local atmospheric conditions, were better correlated (r ≈ 0.85) with the urban background and suburban in situ observations, which were not directly affected by local traffic emissions. Furthermore, by comparing the winter-summer ratios of the two techniques, an indication was found that the in situ measurements probably overestimated the NO2 levels in the case of intense photochemistry.
A homogeneity index, defined as the ratio between the different MAX-DOAS azimuthal directions, showed that the NO2 columns from different viewing directions varied significantly in some cases. Greater horizontal inhomogeneity was found during summer, and this can be attributed to the strong photochemistry and the subsequent short lifetime of NO2, which prevents the dispersion of the pollutants. The horizontal gradient with respect to wind circulation was also investigated and it was found that southern winds, which favor the accumulation of the pollutants in the basin, resulted in lower heterogeneity.
An interesting rate of increase of 0.3 × 10¹⁶ molec cm−2/per year since 2012 in the slant column measurements towards the urban area was found from the long-term analysis of the MAX-DOAS observations. The total increase over the 5-year period was found to be 20%. Over the remote area, the NO2 levels were stable.
Distinct diurnal variation patterns with greater differences during the afternoon hours were found for the cold and the warm period due to different emissions and NO2 lifetimes that occur in each season. The morning NO2 peaks occurred around 11:00LT during winter and 10:00LT during summer and coincided with the local rush hours. However, the morning peak was rapidly decomposed in the summer due to intense photochemistry. Moreover, the morning peak in both seasons was observed one hour later at higher elevations, indicating the vertical convection of the polluted air mass. A delay of one hour between in situ and MAX-DOAS measurements at the lowest elevation was found in winter; the variation of the urban boundary layer, which largely affects the near-surface measurements, may account for this deviation. Nevertheless, the reproduction of the diurnal variation, which identifies short-term features, provides evidence that the MAX-DOAS technique is able to satisfactorily detect the NO2 in the polluted boundary layer. The presence of moderate to high wind speeds (>3 m/s) was found to affect the diurnal patterns during winter, while during the warm period photochemistry was found to be dominant and the diurnal cycles were not greatly affected.
An estimation of the impact of local urban sources on the NO2 levels over the basin was also made by studying the differences between retrievals from the urban and the remote viewing directions and between weekdays and Sundays. The urban component, by applying the first approach, was estimated to be around 35% and 65% during winter and summer, respectively. The second approach reflects the role of road network emissions rather than of the total anthropogenic activity at the urban core, which was estimated at 20% (winter) and 25% (summer). The strength of this source and its seasonal independence were both confirmed by the model scenario analysis, which showed a mean contribution of road traffic to the NO2 levels from 20% to 30% across the urban viewing direction of the instrument on both seasons. The spatial distribution of the fraction estimated by the model confirms the representativeness of the viewing directions, given that this range is predicted over most of Athens’ urban core.
Through a comparison with in situ monitors, this work has shown the ability of MAX-DOAS measurements to retrieve information on NO2 temporal and spatial variability over the urban area of Athens; the integrated NO2 concentrations along distinct paths over the city provide useful insight into the overall NO2 distribution. Therefore, the MAX-DOAS measurements from an elevated site on the northern part of the city can be used for the assessment of the urban NO2 pollution in Athens, and the utility of the MAX-DOAS system as part of an air quality monitoring system on a city-wide scale was demonstrated.

Author Contributions

Conceptualization, E.G. and M.G.; methodology, A.R. and E.A.; software, A.R. and E.A.; validation, M.G., E.A. and A.K.; formal analysis, M.G. and A.K.; investigation, M.G.; resources, A.R. and A.S.; data curation, A.R., A.S. and M.G.; writing—original draft preparation, M.G.; writing—review and editing, M.G., E.A., A.R. and E.G.; visualization, M.G. and A.K.; supervision, E.G. and A.R.; project administration, E.G.; funding acquisition, M.G., E.G. and E.A. All authors have read and agreed to the published version of the manuscript.

Funding

This research was funded by Greece and the European Union (European Social Fund- ESF) through the Operational Programme “Human Resources Development, Education and Lifelong Learning 2014–2020” in the context of the project “Three-dimensional distribution of NO2 (nitrogen dioxide) in the urban environment of Athens, using the MAX-DOAS passive remote sensing technique” (MIS 5049920).

Data Availability Statement

All data sets used and produced for the purposes of this work are freely available and can be requested from the corresponding author.

Acknowledgments

The authors acknowledge the Hellenic Ministry of the Environment and Energy, Department of Air Quality, for the provision of datasets used in this study.

Conflicts of Interest

The authors declare no conflict of interest.

References

  1. Seinfeld, J.H.; Pandis, S.N. Atmospheric Chemistry and Physics: From Air Pollution to Climate Change. Environ. Sci. Policy Sustain. Dev. 1998, 40, 26. [Google Scholar] [CrossRef]
  2. Solomon, S.; Portmann, R.W.; Sanders, R.W.; Daniel, J.S.; Madsen, W.; Bartram, B.; Dutton, E.G. On the role of nitrogen dioxide in the absorption of solar radiation. J. Geophys. Res. 1999, 104, 12047–12058. [Google Scholar] [CrossRef]
  3. Hewitt, C.N.; Jackson, A.V. Atmospheric Science for Environmental Scientists; Wiley-Blackwell: Chichester, UK, 2009. [Google Scholar]
  4. Pascal, M.; Corso, M.; Chanel, O.; Declerq, C.; Bandaloni, C.; Cesaroni, G.; Henschel, S.; Meister, K.; Haluza, D.; Martin-Olmedo, P.; et al. Assessing the public health impacts of urban air pollution in 25 European cities: Results of the Aphekom project. Sci. Total Environ. 2013, 449, 390–400. [Google Scholar] [CrossRef] [PubMed]
  5. Mavroidis, I.; Ilia, M. Trends of NOX, NO2 and O3 concentrations at three different types of air quality monitoring stations in Athens, Greece. Atmos. Chem. Phys. 2012, 63, 135–147. [Google Scholar] [CrossRef]
  6. Khomenko, S.; Cirach, M.; Pereira-Barboza, E.; Mueller, N.; Barrera-Gómez, J.; Rojas-Rueda, D.; de Hoogh, K.; Hoek, G.; Nieuwenhuijsen, M. Premature mortality due to air pollution in European cities; an Urban Burden of Disease Assessment. Lancet Planet. Health 2021, 5, e121–e134. [Google Scholar] [CrossRef]
  7. Lalas, D.P.; Veirs, V.R.; Karras, G.; Kallos, G. An analysis of the SO2 concentration levels in Athens, Greece. Atmos. Environ. 1982, 16, 531–544. [Google Scholar] [CrossRef]
  8. Kassomenos, P.; Kotroni, V.; Kallos, G. Analysis of climatological and air quality observations from greater Athens area. Atmos. Environ. 1995, 29, 3671–3688. [Google Scholar] [CrossRef]
  9. Markakis, K.; Poupkou, A.; Melas, D.; Tzoumaka, P.; Petrakakis, M. A computational approach based on GIS technology for the development of an anthropogenic emission inventory for air quality applications in Greece. Water Air Soil Pollut. 2010, 207, 157–180. [Google Scholar] [CrossRef]
  10. Lalas, D.; Assimakopoulos, D.; Deligiorgi, D.; Helmis, C. Sea breeze circulation and photochemical pollution in Athens, Greece. Atmos. Environ. 1983, 17, 1621–1632. [Google Scholar] [CrossRef]
  11. Viras, L.; Siskos, P. Air pollution by gaseous pollutants in Athens, Greece. In Gaseous Pollutants: Characterization and Cycling; Nriagu, J.O., Ed.; Wiley-Interscience: Hoboken, NJ, USA, 1992; pp. 271–305. [Google Scholar]
  12. Kalabokas, P.; Viras, L.; Repapis, C. Analysis of the 11-year record (1987–1997) of air pollution measurements in Athens, Greece. Part I: Primary air pollutants. Glob. Nest Int. J. 1999, 1, 157–167. [Google Scholar]
  13. Kalabokas, P.D.; Papayannis, A.D.; Tsaknakis, G.; Ziomas, I. Study on the atmospheric concentrations of primary and secondary air pollutants in the Athens basin performed by DOAS and DIAL measuring techniques. Sci. Total Environ. 2012, 414, 556–563. [Google Scholar] [CrossRef] [PubMed]
  14. Psiloglou, B.; Larissi, I.; Petrakis, M.; Paliatsos, A.; Antoniou, A.; Viras, L. Case studies on summertime measurements of O3, NO2 and SO2 with a DOAS system in an urban semi-industrial region in Athens, Greece. Environ. Monit. Assess. 2013, 185, 7763–7774. [Google Scholar] [CrossRef] [PubMed]
  15. Wittrock, F.; Oetjen, H.; Richter, A.; Fietkau, S.; Medeke, T.; Rozanov, A.; Burrows, J.P. MAX-DOAS measurements of atmospheric trace gases in Ny-Alesund. Atmos. Chem. Phys. 2004, 4, 955–966. [Google Scholar] [CrossRef] [Green Version]
  16. Ma, J.Z.; Beirle, S.; Jin, J.L.; Shaiganfar, R.; Yan, P.; Wagner, T. Tropospheric NO2 vertical column densities over Beijing: Results of the first three years of ground-based MAX-DOAS measurements (2008–2011) and satellite validation. Atmos. Chem. Phys. 2013, 13, 1547–1567. [Google Scholar] [CrossRef] [Green Version]
  17. Schreier, S.F.; Richter, A.; Peters, E.; Ostendorf, M.; Schmalwieser, A.W.; Weihs, P.; Burrows, J.P. Dual ground-based MAX-DOAS observations in Vienna, Austria: Evaluation of horizontal and temporal NO2, HCHO and CHOCHO distributions and comparison with independent data sets. Atmos. Environ. X 2020, 5, 100059. [Google Scholar] [CrossRef]
  18. Kramer, L.; Leigh, R.; Remedios, J.; Monks, P. Comparison of OMI and ground-based in situ and MAX-DOAS measurements of tropospheric nitrogen dioxide in an urban area. J. Geophys. Res. Atmos. 2008, 113, D16. [Google Scholar] [CrossRef]
  19. Hendrick, F.; Müller, J.F.; Clémer, K.; Wang, P.; De Mazière, M.; Fayt, C.; Gielen, C.; Hermans, C.; Ma, J.Z.; Pinardi, G.; et al. Four years of ground-based MAX-DOAS observations of HONO and NO2 in the Beijing area. Atmos. Chem. Phys. 2014, 14, 765–781. [Google Scholar] [CrossRef] [Green Version]
  20. Arellano, J.; Kruger, A.; Rivera, C.; Stremme, W.; Friedrich, M.; Bezanilla, A.; Grutter, M. The MAX-DOAS Network in Mexico City to Measure Atmospheric Pollutants; Centro de Ciencias de la Atmosfera, Universidad Nacional Autonoma de Mexico, Circuito Exterior, Ciudad Universitaria: Ciudad de Mexico, Mexico, 2016; ISSN 0187-6236. [Google Scholar]
  21. Drosoglou, T.; Bais, A.F.; Zyrichidou, I.; Kouremeti, N.; Poupkou, A.; Liora, N.; Giannaros, C.; Koukouli, M.E.; Balis, D.; Melas, D. Comparisons of ground-based tropospheric NO2 MAX-DOAS measurements to satellite observations with the aid of an air quality model over the Thessaloniki area, Greece. Atmos. Chem. Phys. 2017, 17, 5829–5849. [Google Scholar] [CrossRef] [Green Version]
  22. Karagkiozidis, D.; Friedrich, M.M.; Beirle, S.; Bais, A.; Hendrick, F.; Voudouri, K.A.; Fountoulakis, I.; Karanikolas, A.; Tzoumaka, P.; Van Roozendael, M.; et al. Retrieval of tropospheric aerosol, NO2 and HCHO vertical profiles from MAX-DOAS observations over Thessaloniki, Greece. Atmos. Meas. Tech. Discuss. 2021. [Google Scholar] [CrossRef]
  23. Gratsea, M.; Vrekoussis, M.; Richter, A.; Wittrock, F.; Schonhardt, A.; Burrows, J.; Kazadzis, S.; Mihalopoulos, N.; Gerasopoulos, E. Slant column MAX-DOAS measurements of nitrogen dioxide, formaldehyde, glyoxal and oxygen dimer in the urban environment of Athens. Atmos. Environ. 2016, 135, 118–131. [Google Scholar] [CrossRef]
  24. Skoulidou, I.; Koukouli, M.E.; Manders, A.; Segers, A.; Karagkiozidis, D.; Gratsea, M.; Balis, D.; Bais, A.; Gerasopoulos, E.; Stavrakou, T.; et al. Evaluation of the LOTOS-EUROS NO2 simulations using ground-based measurements and S5P/TROPOMI observations over Greece. Atmos. Chem. Phys. 2021, 21, 5269–5288. [Google Scholar] [CrossRef]
  25. Leigh, R.J.; Corlett, G.K.; Frieb, U.; Monks, P.S. Spatially resolved measurements of nitrogen dioxide in an urban environment using concurrent multi-axis differential optical absorption spectroscopy. Atmos. Chem. Phys. 2007, 7, 4751–4762. [Google Scholar] [CrossRef] [Green Version]
  26. Brinksma, E.J.; Pinardi, G.; Volten, H.; Braak, R.; Richter, A.; Schonhardt, A.; van Roozendael, M.; Fayt, C.; Hermans, C.; Dirksen, R.J.; et al. The 2005 and 2006 DANDELIONS NO2 and aerosol intercomparison campaigns. J. Geophys. Res. 2008, 113, D16S46. [Google Scholar] [CrossRef] [Green Version]
  27. Gratsea, M.; Bosch, T.; Kokkalis, P.; Richter, A.; Vrekoussis, M.; Kazadzis, S.; Tsekeri, A.; Papayannis, A.; Mylonaki, M.; Amiridis, V.; et al. Retrieval and evaluation of tropospheric aerosol extinction profiles using multi-axis differential absorption spectroscopy (MAX-DOAS) measurements over Athens, Greece. Atmos. Meas. Tech. 2021, 14, 749–767. [Google Scholar] [CrossRef]
  28. Richter, A. Absorptionsspektroskopische Messungen Stratosphaerischer Spurengase Ueber Bremen 53 N. Ph.D. Thesis, University of Bremen, Bremen, Germany, 1997. [Google Scholar]
  29. Peters, E.; Pinardi, G.; Seyler, A.; Richter, A.; Wittrock, F.; Bosch, T.; Van Roozendael, M.; Hendrick, F.; Drosoglou, T.; Bais, A.F.; et al. Investigating differences in DOAS retrieval codes using MAD-CAT campaign data. Atmos. Meas. Tech. 2017, 10, 955–978. [Google Scholar] [CrossRef] [Green Version]
  30. Vandaele, A.C.; Hermans, C.; Simon, P.C.; Carleer, M.; Colin, R.; Fally, S.; Merienne, M.F.; Jenouvrier, A.; Coquart, B. Measurements of the NO2 absorption cross section from 42,000 cm−1 to 10,000 cm−1 (238–1000 nm) at 220 K and 294 K. J. Quant. Spectrosc. Radiat. Transf. 1998, 52, 171–184. [Google Scholar] [CrossRef] [Green Version]
  31. Honninger, G.; von Friedeburg, C.; Platt, U. Multi axis differential optical absorption spectroscopy (MAX-DOAS). Atmos. Chem. Phys. 2004, 4, 231–254. [Google Scholar] [CrossRef] [Green Version]
  32. Leser, H.; Honninger, G.; Platt, U. MAX-DOAS measurements of BrO and NO2 in the marine boundary layer. Geophys. Res. Lett. 2003, 30, 1537. [Google Scholar] [CrossRef]
  33. Halla, J.D.; Wagner, T.; Beirle, S.; Brook, J.R.; Hayden, K.L.; O’Brien, J.M.; Ng, A.; Majonis, D.; Wenig, M.O.; McLaren, R. Determination of tropospheric vertical columns of NO2 and aerosol optical properties in a rural setting using MAX-DOAS. Atmos. Chem. Phys. 2011, 11, 12475–12498. [Google Scholar] [CrossRef] [Green Version]
  34. Schreier, S.F.; Peters, E.; Richter, A.; Lampel, J.; Wittrock, F.; Burrows, J.P. Ship-based MAX-DOAS measurements of tropospheric NO2 and SO2 in the South China and Sulu Sea. Atmos. Environ. 2015, 102, 331–343. [Google Scholar] [CrossRef]
  35. Hurley, P.; Physick, W.; Luhar, A. TAPM—A practical approach to prognostic meteorological and air pollution modelling. Environ. Modell. Softw. 2005, 20, 737–752. [Google Scholar] [CrossRef]
  36. Ramacher, M.O.P.; Kakouri, A.; Speyer, O.; Feldner, J.; Karl, M.; Timmermans, R.; Denier van der Gon, H.; Kuenen, J.; Gerasopoulos, E.; Athanasopoulou, E. The UrbEm Hybrid Method to Derive High-Resolution Emissions for City-Scale Air Quality Modeling. Atmosphere 2021, 12, 1404. [Google Scholar] [CrossRef]
  37. Hurley, P.; Manins, P.; Lee, S.; Boyle, R.; Ng, Y.L.; Dewundege, P. Year-long, high-resolution, urban airshed modelling: Verification of TAPM predictions of smog and particles in Melbourne, Australia. Atmos. Environ. 2003, 37, 1899–1910. [Google Scholar] [CrossRef]
  38. Luhar, A.K.; Hurley, P.J. Evaluation of TAPM, a prognostic meteorological and air pollution model, using urban and rural point-source data. Atmos. Environ. 2003, 37, 2795–2810. [Google Scholar] [CrossRef]
  39. Karl, M.; Walker, S.-E.; Solberg, S.; Ramacher, M.O.P. The Eulerian urban dispersion model EPISODE—Part 2: Extensions to the source dispersion and photochemistry for EPISODE—CityChem v1.2 and its application to the city of Hamburg. Geosci. Model Dev. 2020, 12, 3357–3399. [Google Scholar] [CrossRef] [Green Version]
  40. Grivas, G.; Athanasopoulou, E.; Kakouri, A.; Bailey, J.; Liakakou, E.; Stavroulas, I.; Kalkavouras, P.; Bougiatioti, A.; Kaskaoutis, D.G.; Ramonet, M.; et al. Integrating in situ Measurements and City Scale Modelling to Assess the COVID–19 Lockdown Effects on Emissions and Air Quality in Athens, Greece. Atmosphere 2020, 11, 1174. [Google Scholar] [CrossRef]
  41. Roorda-Knape, M.C.; Janssen, N.A.; Hartog, J.; Van Vliet, P.H.; Harssema, H.; Brunekreef, B. Air pollution from traffic in city districts near major motorways. Atmos. Environ. 1998, 32, 1921–1930. [Google Scholar] [CrossRef]
  42. Petritoli, A.; Bonasoni, P.; Giovanelli, G.; Ravegnani, F.; Kostadinov, I.; Bortoli, D.; Weiss, A.; Schaub, D.; Richter, A.; Fortezza, F. First comparison between ground-based and satellite-borne measurements of tropospheric nitrogen dioxide in the Po basin. J. Geophys. Res. 2004, 109, D15307. [Google Scholar] [CrossRef] [Green Version]
  43. Kumar, V.; Remmers, J.; Beirle, S.; Fallmann, J.; Kerkweg, A.; Lelieveld, J.; Mertens, M.; Pozzer, A.; Steil, B.; Barra, M.; et al. Evaluation of the coupled high-resolution atmospheric chemistry model system MECO(n) using in situ and MAX-DOAS NO2 measurements. Atmos. Meas. Tech. 2021, 14, 5241–5269. [Google Scholar] [CrossRef]
  44. Heckel, A.; Richter, A.; Tarsu, T.; Wittrock, F.; Hak, C.; Pundt, I.; Junkermann, W.; Burrows, J.P. MAX-DOAS measurements of formaldehyde in the Po-Valley. Atmos. Chem. Phys. 2005, 5, 909–918. [Google Scholar] [CrossRef] [Green Version]
  45. Kambezidis, H.; Tulleken, R.; Amanatidis, G.; Paliatsos, A.; Asimakopoulos, D. Statistical evaluation of selected air pollutants in Athens, Greece. Environmentrics 1995, 6, 349–361. [Google Scholar] [CrossRef]
  46. Alexandri, G.; Georgoulias, A.; Balis, D. Effect of Aerosols, Tropospheric NO2 and Clouds on Surface Solar Radiation over the Eastern Mediterranean (Greece). Remote Sens. 2021, 13, 2587. [Google Scholar] [CrossRef]
  47. Steinbacher, M.; Zellweger, C.; Schwarzenbach, B.; Bugmann, S.; Buchmann, B.; Ordonez, C.; Prevot, A.S.H.; Hueglin, C. Nitrogen oxide measurements at rural sites in Switzerland: Bias of conventional measurement techniques. J. Geophys. Res. 2007, 112, D11307. [Google Scholar] [CrossRef] [Green Version]
  48. Richter, A.; Godin, S.; Gomez, L.; Hendrick, F.; Hocke, K.; Langerock, B.; van Roozendael, M.; Wagner, T. Spatial Representativeness of NORS Observations; Report; Institute of Environmental Physics, University of Bremen: Bremen, Germany, 2013; Available online: https://nors.aeronomie.be/index.php/documents (accessed on 1 November 2021).
  49. Cusack, M.; Perez, N.; Pey, J.; Alastuey, A.; Querol, X. Source apportionment of fine PM and sub-micron particle number concentrations at a regional background site in the western Mediterranean: A 2.5 year study. Atmos. Chem. Phys. 2013, 13, 5173–5187. [Google Scholar] [CrossRef] [Green Version]
  50. Lyamani, H.; Olmo, F.J.; Foyo, I.; Alados-Arboleds, L. Black carbon aerosols over an urban area in south-eastern Spain: Changes detected after the 2008 economic crisis. Atmos. Environ. 2011, 45, 6423–6432. [Google Scholar] [CrossRef]
  51. Vrekoussis, M.; Richter, A.; Hilboll, A.; Burrows, J.B.; Gerasopoulos, E.; Lelieveld, J.; Barrie, L.; Zerefos, C.; Mihalopoulos, N. Economic Crisis Detected from Space: Air Quality observations over Athens/Greece. Geophys. Res. Lett. 2013, 40, 458–463. [Google Scholar] [CrossRef]
  52. Georgoulias, A.K.; van der A, R.J.; Stammes, P.; Boersma, K.F.; Eskes, H.J. Trends and trend reversal detection in 2 decades of tropospheric NO2 satellite observations. Atmos. Chem. Phys. 2019, 19, 6269–6294. [Google Scholar] [CrossRef] [Green Version]
  53. Katsoulis, B. The relationship between synoptic, mesoscale and microscale meteorological parameters during poor air quality events in Athens, Greece. Sci. Total Environ. 1996, 181, 13–24. [Google Scholar] [CrossRef]
  54. Kourtidis, K.A.; Ziomas, I.C.; Rappenglueck, B.; Proyou, A.; Balis, D. Evaporative traffic hydrocarbon emissions, traffic CO and speciated HC traffic emissions from the city of Athens. Atmos. Environ. 1999, 33, 3831–3842. [Google Scholar] [CrossRef]
  55. Crutzen, P.J. The role of NO and NO2 in the chemistry of the troposphere and stratosphere. Annu. Rev. Earth Planet. Sci. 1998, 7, 443–472. [Google Scholar] [CrossRef]
  56. Ma, J.; Richter, A.; Burrows, J.P.; Nuß, H.; van Aardenne, J.A. Comparison of model-simulated tropospheric NO2 over China with GOME-satellite data. Atmos. Environ. 2006, 40, 593–604. [Google Scholar] [CrossRef]
  57. Stavrakou, T.; Müller, J.F.; Bauwens, M.; Boersma, K.F.; van Geffen, J. Satellite evidence for changes in the NO2 weekly cycle over large cities. Sci. Rep. 2020, 10, 10066. [Google Scholar] [CrossRef] [PubMed]
  58. Kanakidou, M.; Mihalopoulos, N.; Kindap, T.; Im, U.; Vrekoussis, M.; Gerasopoulos, E.; Dermitzaki, E.; Unal, A.; Kocak, M.; Markakis, K.; et al. Megacities as hot spots of air pollution in the East Mediterranean. Atmos. Environ. 2011, 45, 1223–1235. [Google Scholar] [CrossRef]
Figure 1. The location of the MAX-DOAS and in situ monitoring stations and the model simulation domain. The urban (S) and remote (W) MAX-DOAS viewing directions are also shown.
Atmosphere 12 01634 g001
Figure 2. Daily averaged MAX-DOAS retrieved NO2 differential slant column densities (DSCDs) from two viewing directions, urban (black markers) and remote (green markers) and NO2 concentrations from the three in situ monitoring stations; (a) urban, (b) urban background and (c) suburban. Period: October 2012 to September 2017. The simulated NO2 concentrations are also plotted against the corresponding in situ observations (blue markers) for the period January to June 2016.
Atmosphere 12 01634 g002
Figure 3. Average tropospheric NO2 slant columns and NO2 concentrations for each month in the data set from October 2012 to July 2017. The black curves represent the MAX-DOAS tropospheric NO2 slant column measurements towards the urban (a) and the remote direction (b). The dashed curves are the same averages after cloud screening. The red and blue curves represent the urban and suburban in situ concentration measurements, respectively. The dashed red curve corresponds to the urban background in situ measurements.
Atmosphere 12 01634 g003
Figure 4. Ratio of the daily averaged urban and remote DSCDNO2 measurements at the +1o elevation angle for the period from October 2012 to July 2017. The black thick curve corresponds to the smoothed data using a 30-day moving average filter. The internal panel depicts the 5-year averaged seasonal cycle of the ratio index (solid curve) and the seasonal cycle considering data only for days when the prevailing wind direction was between 130o and 210o (dashed curve).
Atmosphere 12 01634 g004
Figure 5. Correlation between daily averaged model NO2 concentrations for each grid point and MAX-DOAS retrieved NO2 DSCDs for the two viewing directions of the telescope: urban (a) and remote (b) for the period January to June 2016 (r values are only shown when statistically significant, p < 0.05).
Atmosphere 12 01634 g005
Figure 6. Monthly averages of tropospheric NO2 slant columns from October 2012 to July 2017 for the urban (black curve) and the remote direction (green curve). The dashed lines represent the NO2 levels’ trend over the 5-year period.
Atmosphere 12 01634 g006
Figure 7. Hourly averaged tropospheric NO2 DSCDs for the cold period (a) and the warm period (b). The time on the x-axis is in UTC hours (the corresponding LT is UTC + 02 in winter and UTC + 03 in summer). Each solid curve corresponds to a different elevation angle (1°, 4°, 8°, 15°, 30°). The dashed curves represent the diurnal patterns when only days with wind speed >3 m/s are considered. Different scales (right y-axes) were used for the 30° elevation (blue curves). Period: October 2012 to September 2017.
Atmosphere 12 01634 g007
Figure 8. Hourly averaged NO2 concentrations from the urban monitoring station for the cold period (blue curve) and the warm period (red curve). The bars represent the standard error. The times on the x-axis are in UTC hours (the corresponding LT is UTC + 02 in winter and UTC + 03 in summer). Period: October 2012 to September 2017.
Atmosphere 12 01634 g008
Figure 9. The mean (January–June 2016) contribution (%) of road traffic to NO2 concentration values in Athens as simulated by the city-scale air quality model. The location and the viewing directions of the MAX-DOAS instrument are also shown.
Atmosphere 12 01634 g009
Figure 10. Average tropospheric NO2 slant columns and NO2 concentrations for each day of the week (data set October 2012 to July 2017).
Atmosphere 12 01634 g010
Table 1. Correlations (r) between the two MAX-DOAS directions (urban, remote) and the three in situ stations (urban, urban background, suburban) for four wind direction sections.
MAX-DOAS North Section
(303.75°–56.25°)
South Section
(123.75°–236.25°)
East Section (56.25°–123.75°)West Section
(236.25°–303.75°)
In Situ
urban 0.500.430.380.46
urban
urban 0.470.510.310.40
urban
background
remote 0.350.370.380.29
suburban
Table 2. Daily averaged NO2 from in situ and MAX-DOAS measurements in Athens from October 2012 to July 2017 and separately for the cold period (November–March) and the warm period (April–October). Simulated values (and statistics) for the period January to June 2016 are also shown.
SitesMean In Situ NO2 Measurements
(μg m−3)
Mean MAX-DOAS NO2 Measurements (molec cm−2)Mean Model NO2 Simulations (μg m−3)
October 2012–
July 2017
Cold Period
(Nov–Mar)
Warm Period
(Apr–Oct)
October 2012–
July 2017
Cold Period
(Nov–Mar)
Warm Period
(Apr–Oct)
January 2016–
June 2016
Urban66.04 59.4370.227.73 × 10168.22 × 10167.33 × 101671.10
MB = −13.6
Norm. MAE = 25%
FAC2 = 97%
Urban background27.1330.8924.29---51.30
MB = 22.9
Norm. MAE = 103%
FAC2 = 59%
Suburban background/Remote18.9921.1217.443.68 × 10164.40 × 10163.11 × 101622.3
MB = −15.7
Norm. MAE = 43%
FAC2 = 58%
Table 3. Daily averaged MAX-DOAS NO2 measurements for weekdays and Sundays and the estimated contribution of the urban sources. Results are presented as averaged values for winter (December–February) and summer (June–August) months from October 2012 to July 2017 and separately for the urban and the remote area.
SitesWinter (December–February)Summer (June–August)
Weekdays
molec cm−2
Sundays
molec cm−2
Contribution
%
Weekdays
molec cm−2
Sundays
molec cm−2
Contribution
%
Urban9.04 ×10166.68 × 101626.15.94 × 10164.58 × 101622.9
Remote4.94 ×10163.64 × 101626.32.25 × 10161.83 × 101618.7
Publisher’s Note: MDPI stays neutral with regard to jurisdictional claims in published maps and institutional affiliations.

