Article

Predicting the Effects of Solar Storms on the Ionosphere Based on a Comparison of Real-Time Solar Wind Data with the Best-Fitting Historical Storm Event

German Aerospace Center, Institute for Solar-Terrestrial Physics, Space Weather Impact, Kalkhorstweg 53, 17235 Neustrelitz, Germany
*
Author to whom correspondence should be addressed.
Atmosphere 2021, 12(12), 1684; https://doi.org/10.3390/atmos12121684
Submission received: 16 November 2021 / Revised: 9 December 2021 / Accepted: 14 December 2021 / Published: 16 December 2021
(This article belongs to the Special Issue Ionospheric Monitoring and Modelling for Space Weather)

Abstract

:
This study presents a new modeling approach that aims for long time predictions (more than 12 h) of ionospheric disturbances driven by solar storm events. The proposed model shall run in an operational framework to deliver fast and precise localized warnings for these disturbances in the future. The solar wind data driven approach uses a data base of historical solar storm impacts covering two solar cycles to reconstruct future events and resulting ionospheric disturbances. The basic components of the model are presented and discussed in this study, and the strengths of the reconstruction based on historical events are presented by showing the good correlations for predicted and observed geomagnetic activity. Initial results on the ionospheric response are discussed for all historical events using global total electron content (GTEC) and in more detail using total electron content (TEC) maps for two specific case studies (including the St. Patrick’s Day geomagnetic storm during the 17 March 2015). Average root mean square error (RMSE) values of 3.90 and 5.21 TECU are calculated for these cases confirming good results for the current configuration of the model. Possible future improvements of the individual model parts, as well as the planned extensions and applications are discussed in detail.

1. Introduction

The complex interaction between solar wind and magnetosphere is a crucial driver for the upper atmosphere variability [1]. The characteristics of these variations change considerably when the solar wind is modified by interplanetary coronal mass ejections (ICME) or co-rotating interaction regions (CIR). Thus, ionospheric perturbations can be observed on different time scales and of different strength [2,3,4]. Furthermore, also spatial variations characterized by different processes (e.g., solar wind driven plasma drifts) are crucial [5,6,7]. The ionospheric disturbances can cause various problems for communication and navigation systems (e.g., reduced positioning accuracy for global navigation satellite system). Such disturbances need to be understood and predicted to assure the operation of infrastructure and services that are crucial for most users [8,9,10].
Forecasting ionospheric disturbances due to geomagnetic storms driven by ICME or even CIR is a major challenge that is being pursued and already carried out by various institutions. In this study, the idea of an improved global forecast model is presented and the basic concepts are validated. The model is able to provide 24 h forecast of ionospheric disturbances even during significant solar storms and describes ionospheric perturbations in high local and spatial resolution based on the observed solar wind conditions and information from historical storm events.
The model presented here is a significant extension of the previous work completed in the EU FP7 as project Advanced Forecast For Ensuring Communication Through Space (AFFECTS), where a forecast for ionospheric disturbances based on historical storm information was implemented [11,12,13]. The proposed total electron content (TEC) perturbation forecast model was realized based on empirical information and the extensive data archive of regional TEC maps for Europe. Unlike in the approach of this study, the forecast was based on geomagnetic indices rather than solar wind data. The approach followed a series of similar studies on modeling ionospheric parameters at the German Aerospace Center (DLR) Neustrelitz [14,15,16]. The efforts to enhance the model further are due the great need for the improvement of empirical ionospheric forecast models, which are able to run under real-time conditions [17,18,19].
In this study, an extended approach of the previous work is presented, aiming at two crucial changes. The model is extended to global maps and the forecast leading time is improved by prediction of TEC disturbances based on solar wind data instead of geomagnetic indices. The basic idea for the presented model is the forecast of ionospheric disturbances during solar storms by applying impact information from historical ICME or CIR events with similar features. This is realized with the use of data over approximately two solar cycles.
Another example of existing ionospheric disturbance forecast is the Solar Wind driven autoregression model for Ionospheric short-term Forecast (SWIF), which provides predictions for the critical frequency of the ionospheric F2 layer [20,21,22]. The model has been validated [22] and is operational on the European Digital upper Atmosphere Server (DIAS) providing ionospheric forecasts. However, the SWIF approach is performed only for certain stations and differs fundamentally in the calculation of predictions. Nevertheless, SWIF is an option for future comparisons with the model proposed in this study. Other approaches based on machine learning or neural networks (e.g., [23,24]) may also be considered for the model evaluation compared to other approaches.
For figures and analyses, whenever possible in this study, the St. Patrick’s Day geomagnetic storm during the 17 March 2015 is used as an example because the behavior of this event has been discussed in various studies [25,26,27,28] and thus the underlying processes are well understood. Other storms are used especially for the analyses of the event reconstruction to avoid larger data gaps.

2. Data

Solar wind data, geomagnetic indices, and total electron content (TEC) maps are applied in this study and are required for the model. A brief introduction to the different measurements is given in this section.

2.1. Solar Wind Measurements

Features of the solar wind are measured by the National Aeronautics and Space Administration (NASA) satellite missions Advanced Composition Explorer (ACE) and Deep Space Climate Observatory (DSCOVR). The data of the instruments on board these satellites are provided in real-time and are used by different institutions to monitor and forecast space weather events [29,30]. ACE and DSCOVR were launched 25 August 1997 and 11 February 2015 orbiting the L1 Lagrangian point since then.
The Solar Wind Electron, Proton, and Alpha Monitor (SWEPAM) on board ACE measures the solar wind plasma electron and ion fluxes at minutely resolution [31]. The same parameters are measured by the Faraday cup and electron spectrometer on board DSCOVR [32]. In addition, the Magnetic Field Experiment (MAG) on board ACE and the magnetometer on board DSCOVR measure the six magnetic field vectors of the interplanetary magnetic field (IMF). ACE data are provided through the NASA ACE Science Center [33,34] and DSCOVR data are provided through the National Oceanic and Atmospheric Administration’s National Centers for Environmental Information [35]. Both datasets are available in real-time.
For this study, in particular, the proton density n p , proton speed v p and the North-South IMF direction B z will be analyzed as they describe the variations during ICME, as well as CIR. Although n p and v p describe the general strength of an event, the strength of the southward magnetic field (negative B z ) is an important measure for the geoeffectiveness of ICME [36,37]. This has to be considered especially during strong geomagnetic activity [38]. In addition, two derived parameters will be used. The dynamic pressure p d will be calculated as
p d = 1 2 · n p · v p 2
combining the two solar wind features. B z is then included by introducing the effective pressure p e with a relative scale of B z according to
a = B z B z 0 k .
This scale is combined with p d according to
p e = p d e a + 1 .
This logistic function (or Fermi function), which was proposed in a previous study [12], is parameterized with the upper boundary B z 0 and a scaling factor k, which have been set to −10 nT and 0.01 nT in this study. By introducing this parameter, it is possible to evaluate the three measured values as one time series. This alternative allows a simplified version of the model approach.

2.2. Geomagnetic Indices

The disturbance storm time (Dst) describes the strength of the ring current and provides a reliable measurement for the impact of geomagnetic storms [39]. The ring current occurs when charged particles of the solar wind enter the inner magnetosphere and move along the geomagnetic field lines in a westward direction around Earth. The magnetic field of this ring current impacts the field strength on Earth’s surface. This impact is described with Dst and provided at hourly resolution through the World Data Center for Geomagnetism in Kyoto [40,41,42]. Geomagnetic activity described by Dst is correlated with the strength of solar wind features and, thus, can be predicted based on their measurements [43,44,45,46,47].
The K index describes the disturbances in the horizontal component of Earth’s magnetic field and is therefore another measurement for geomagnetic activity [48,49,50]. The global Kp index is provided at 3-hourly resolution by the German Research Centre for Geosciences in Potsdam [51]. Similar to Dst, geomagnetic activity described by Kp is correlated with the strength of solar wind features and can be predicted based on their measurement [52,53].

2.3. Global TEC Maps

Global TEC maps are provided by the International Global Navigation Satellite System (GNSS) Service (IGS) for different analysis centers [54]. Since maps with high sampling rate of at least 1 h are required, the Universitat Politècnica de Catalunya (UPC) rapid high-rate solution (UHR) maps are applied in this study. These maps are provided by NASA through the Crustal Dynamics Data Information System [55]. The European Space Agency (ESA) rapid high-rate solution (EHR) maps and the IGS combined (IHR) maps would also be suitable for the analysis, but in general the IGS data products are only a temporary solution. In the future DLR TEC maps with even higher sampling rate will be applied during the real-time operation of the model.
TEC is preferred over other ionospheric parameters (e.g., critical frequency of the F2 layer), because it can be provided as TEC maps with global coverage in near real-time. In addition, TEC is an integral measurement of the ionosphere’s electron density (equivalent to the ionospheric range error) that is of interest for most users and provided in established space weather services [56].

2.4. Reference Events

The basis for this study and the proposed forecast is a comprehensive list of historical events (ICME and CIR) that have caused ionospheric disturbances. The list compiled for this purpose is based on various sources. A large number of events can be taken from literature (e.g., [57,58,59,60]). Other events are selected manually, with Kp (≥5) and Dst (≤ 50 nT) assumed to be indicators of IMCE and CIR. The compiled list is presented in Figure 1 showing a total of 593 events.
The number of events each month indicates a dependence on the solar cycle 23 and 24 and thus a representative set of events can be assumed. On the other hand, the number of events that can be used in the analysis is much smaller than the total because data gaps (within 24 h of the onset time) prevent some periods from being evaluated for both solar wind data and TEC maps. Nevertheless, the proposed analysis includes a sufficient number of events.

3. Modeling Approach

Data assimilation of ongoing observations with dynamical models is a powerful tool for space weather predictions [61] and can be achieved with Kalman filtering [62] or extended Kalman filtering and ensemble Kalman filtering [63,64]. These approaches require a known model. In cases without a model dynamics can be reconstructed using the delay coordinate method, the so-called Takens filtering [65]. The combination of both approaches has been introduced as Kalman-Takens filtering [66,67]. This method realizes a model-free filter which applies Kalman filtering and data-driven Takens modeling [66]. The otherwise required model is replaced with dynamics from the delay coordinate method [66]. The idea of the model presented in this paper is inspired by these approaches, which do not rely on a dynamic model, but differs significantly in its non-continuous calculations and static observation sequences, that are used for the reconstruction.
The proposed forecast in this study is only performed if significant changes in the solar wind are observed. This splits the forecast into two steps: identification of events in solar wind features and TEC reconstruction based on past ionospheric disturbances. The first part is realized comparable to Takens filtering with static delays referencing the past events and a chosen observation function. The TEC reconstruction is realized with corresponding differential TEC (dTEC) entries for these past events. Thus, the precise prediction of the event onset time and the observation function are the crucial parts of the forecast. The details and current development status of the components of the forecast are presented in the following sections, which describe in more detail solar wind monitoring, event reconstruction, dTEC data archive, and quiet as well as storm condition TEC forecast.

3.1. Solar Wind Monitoring

ACE and DSCOVR instruments provide continuously solar wind and IMF parameters of which n p , v p and B z are used for the proposed forecast. In addition, the calculated parameters p d (see Equation (1)) and p e (see Equation (3)) are analyzed. The identification of relevant solar storms is realized by two procedures, where both approaches can be applied to single parameters or any combination of parameters.
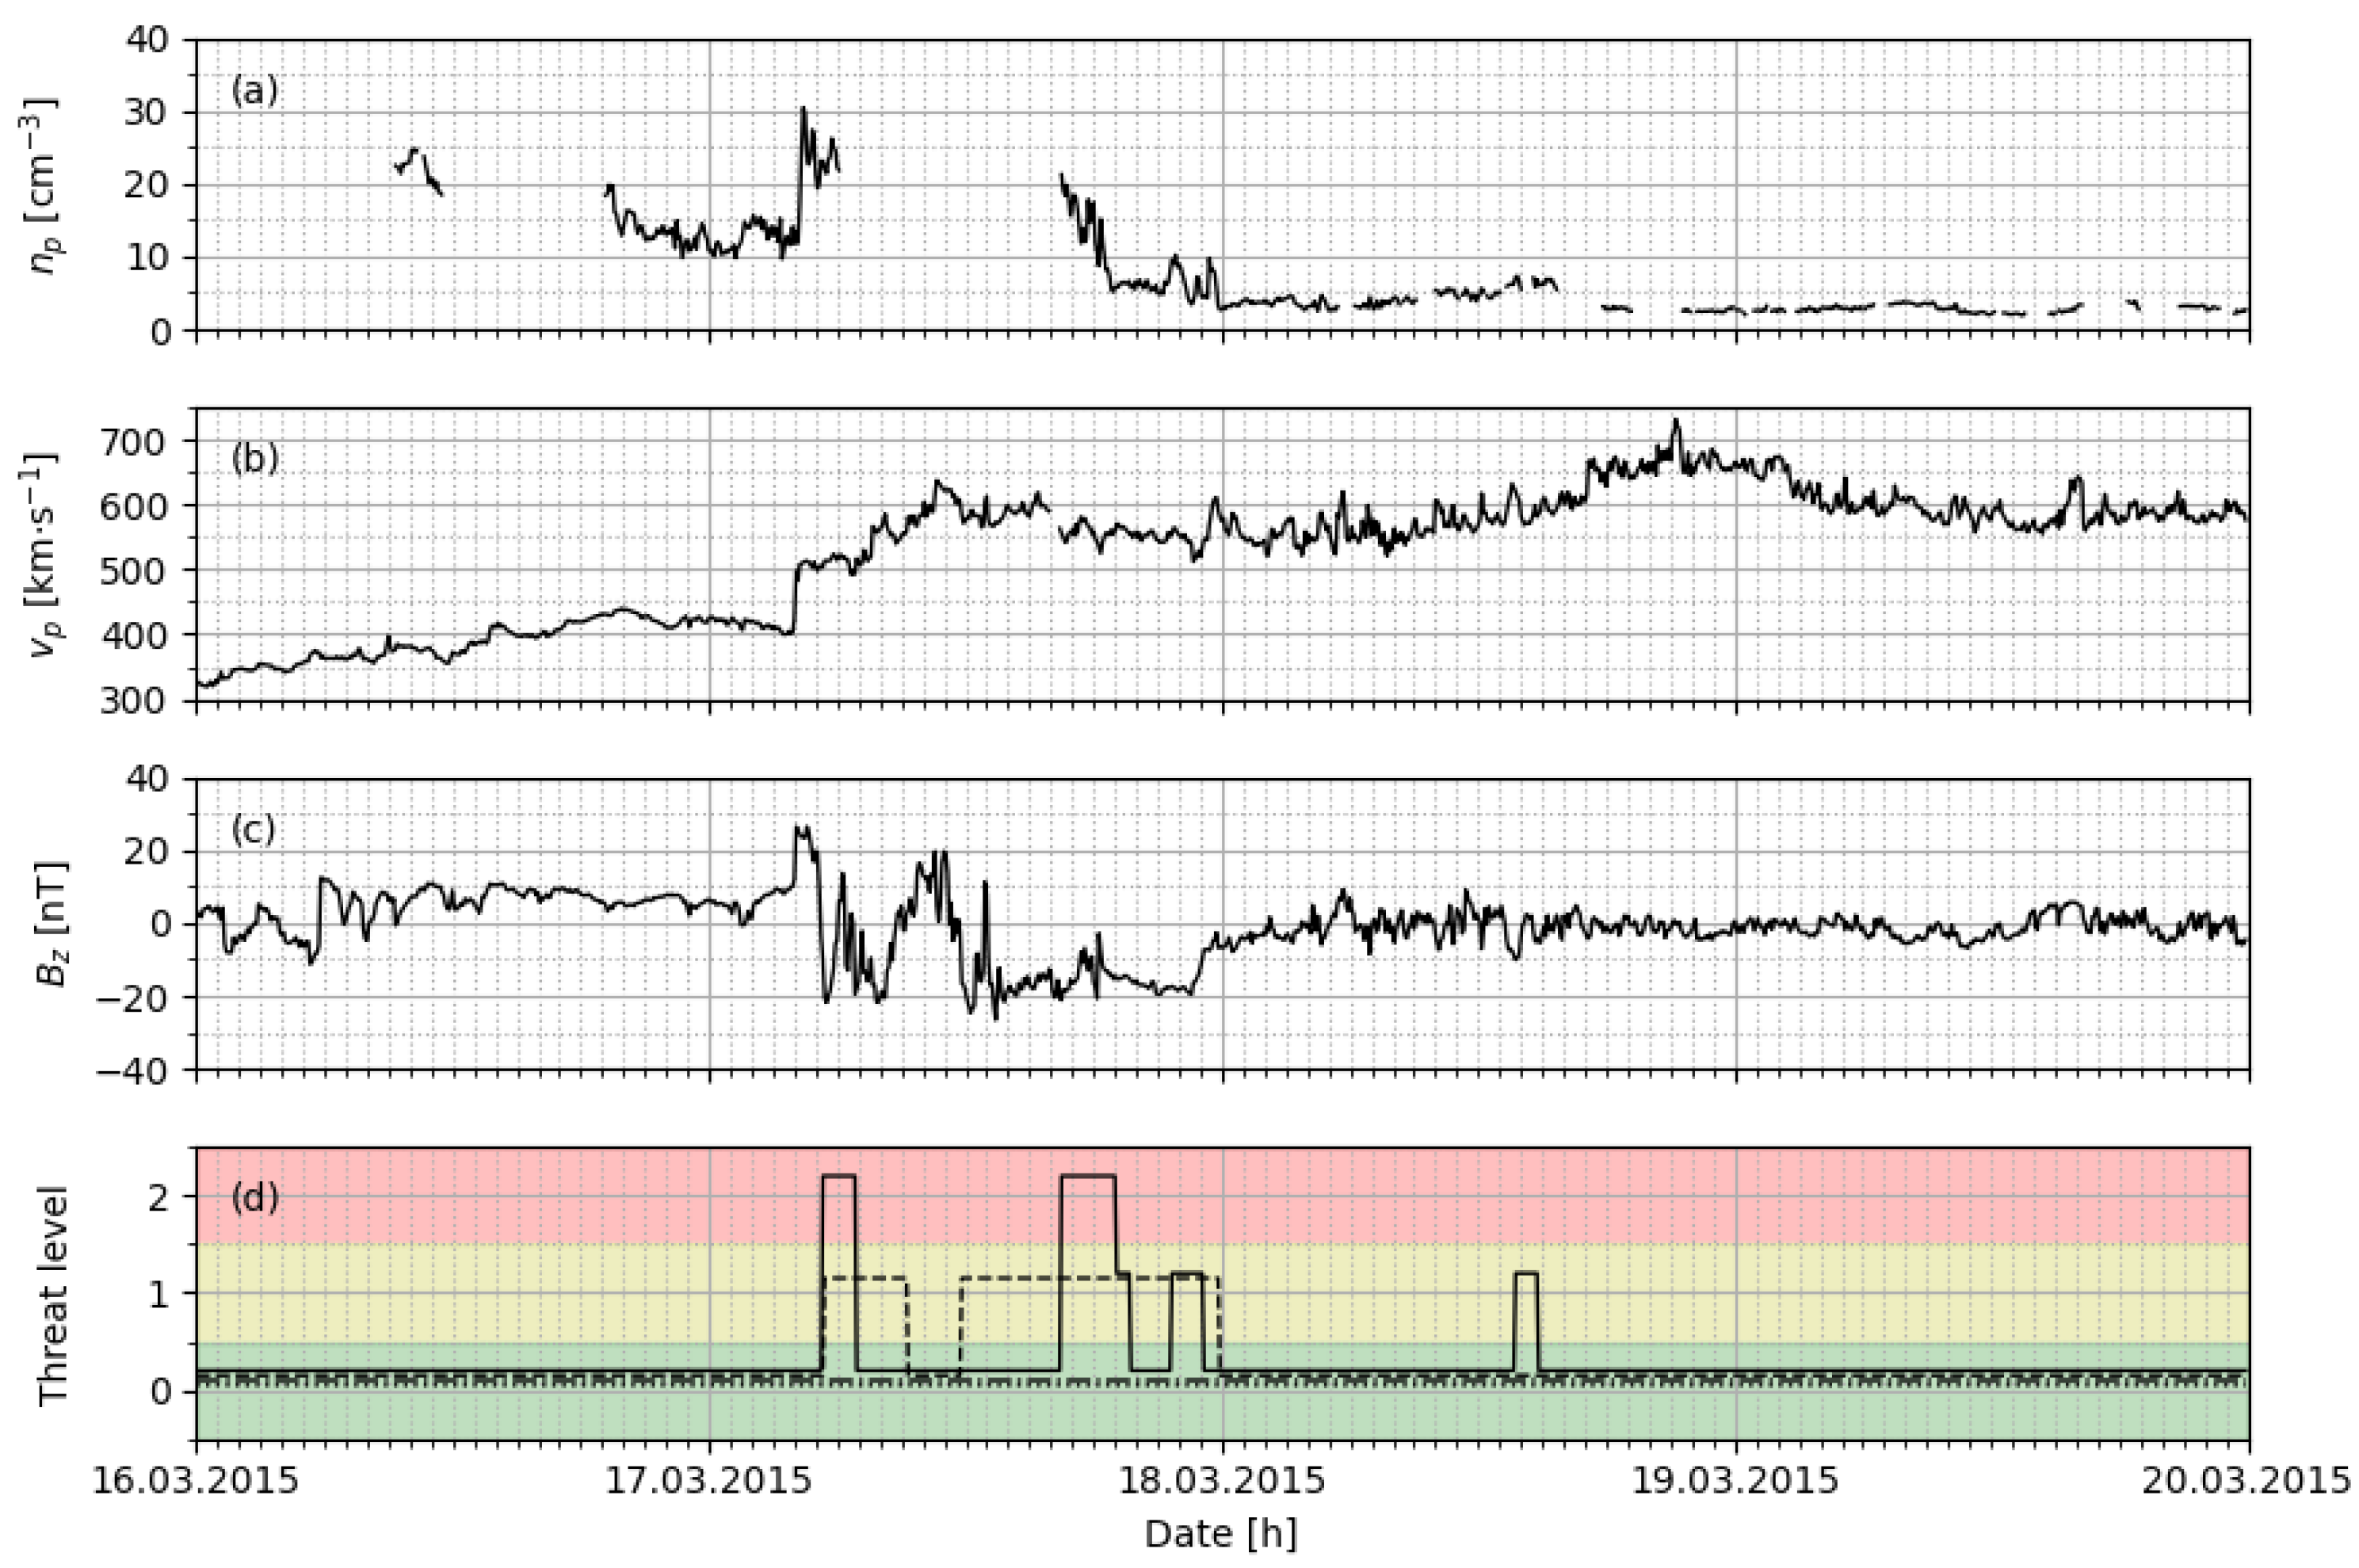
The first approach uses static thresholds for each parameter to classify moderate and strong events. The thresholds are summarized in Table 1. These values are based on the previous implementation in AFFECTS, but are intended to be adjusted to the current solar cycle in future analyses since the previous analysis was based on a smaller set of historical storm events. An example calculation of threat levels is shown in Figure 2 for the St. Patrick’s Day geomagnetic storm.
This ICME driven super storm was a significant event during the solar cycle 24 [26]. For n p , there are larger data gaps during the period shown, but for the other parameters a continuous calculation can be performed. Similar situations may occur at any time, so the evaluation of single parameters and their combinations is implemented. For example, the rounded up mean threat level T c of all threat levels T according to
T c = 1 k i = 1 k T i
is an approach that detects a threat when the majority of parameters k exceeds the thresholds. Despite the missing parameter, the event is well bound by the threat levels and an onset time (during the shock) can be identified. The sheath and magnetic cloud as described in other studies [26] are covered with the threat levels as well.
The second approach does not apply thresholds on absolute scales and instead relies on the calculation of multiple simple moving averages (SMA). This method is only appropriate for n p , v p , p d and p e . B z is excluded due to the quasi-stationary behavior [68] which is observed for the majority of intervals. For each parameter a number s of SMA with time window w and weight v defines the mean SMA c as
SMA c ( x ) = 1 s i = 1 s SMA ( x ; w i , v i ) = 1 s i = 1 s v i w i j = n w i + 1 n x j .
The time windows and weights may be optimized using a longer time frame or may be defined with a set of values based on expected variations. Finally, the difference of a parameter and corresponding SMA c is calculated according to
d x = x SMA c ( x )
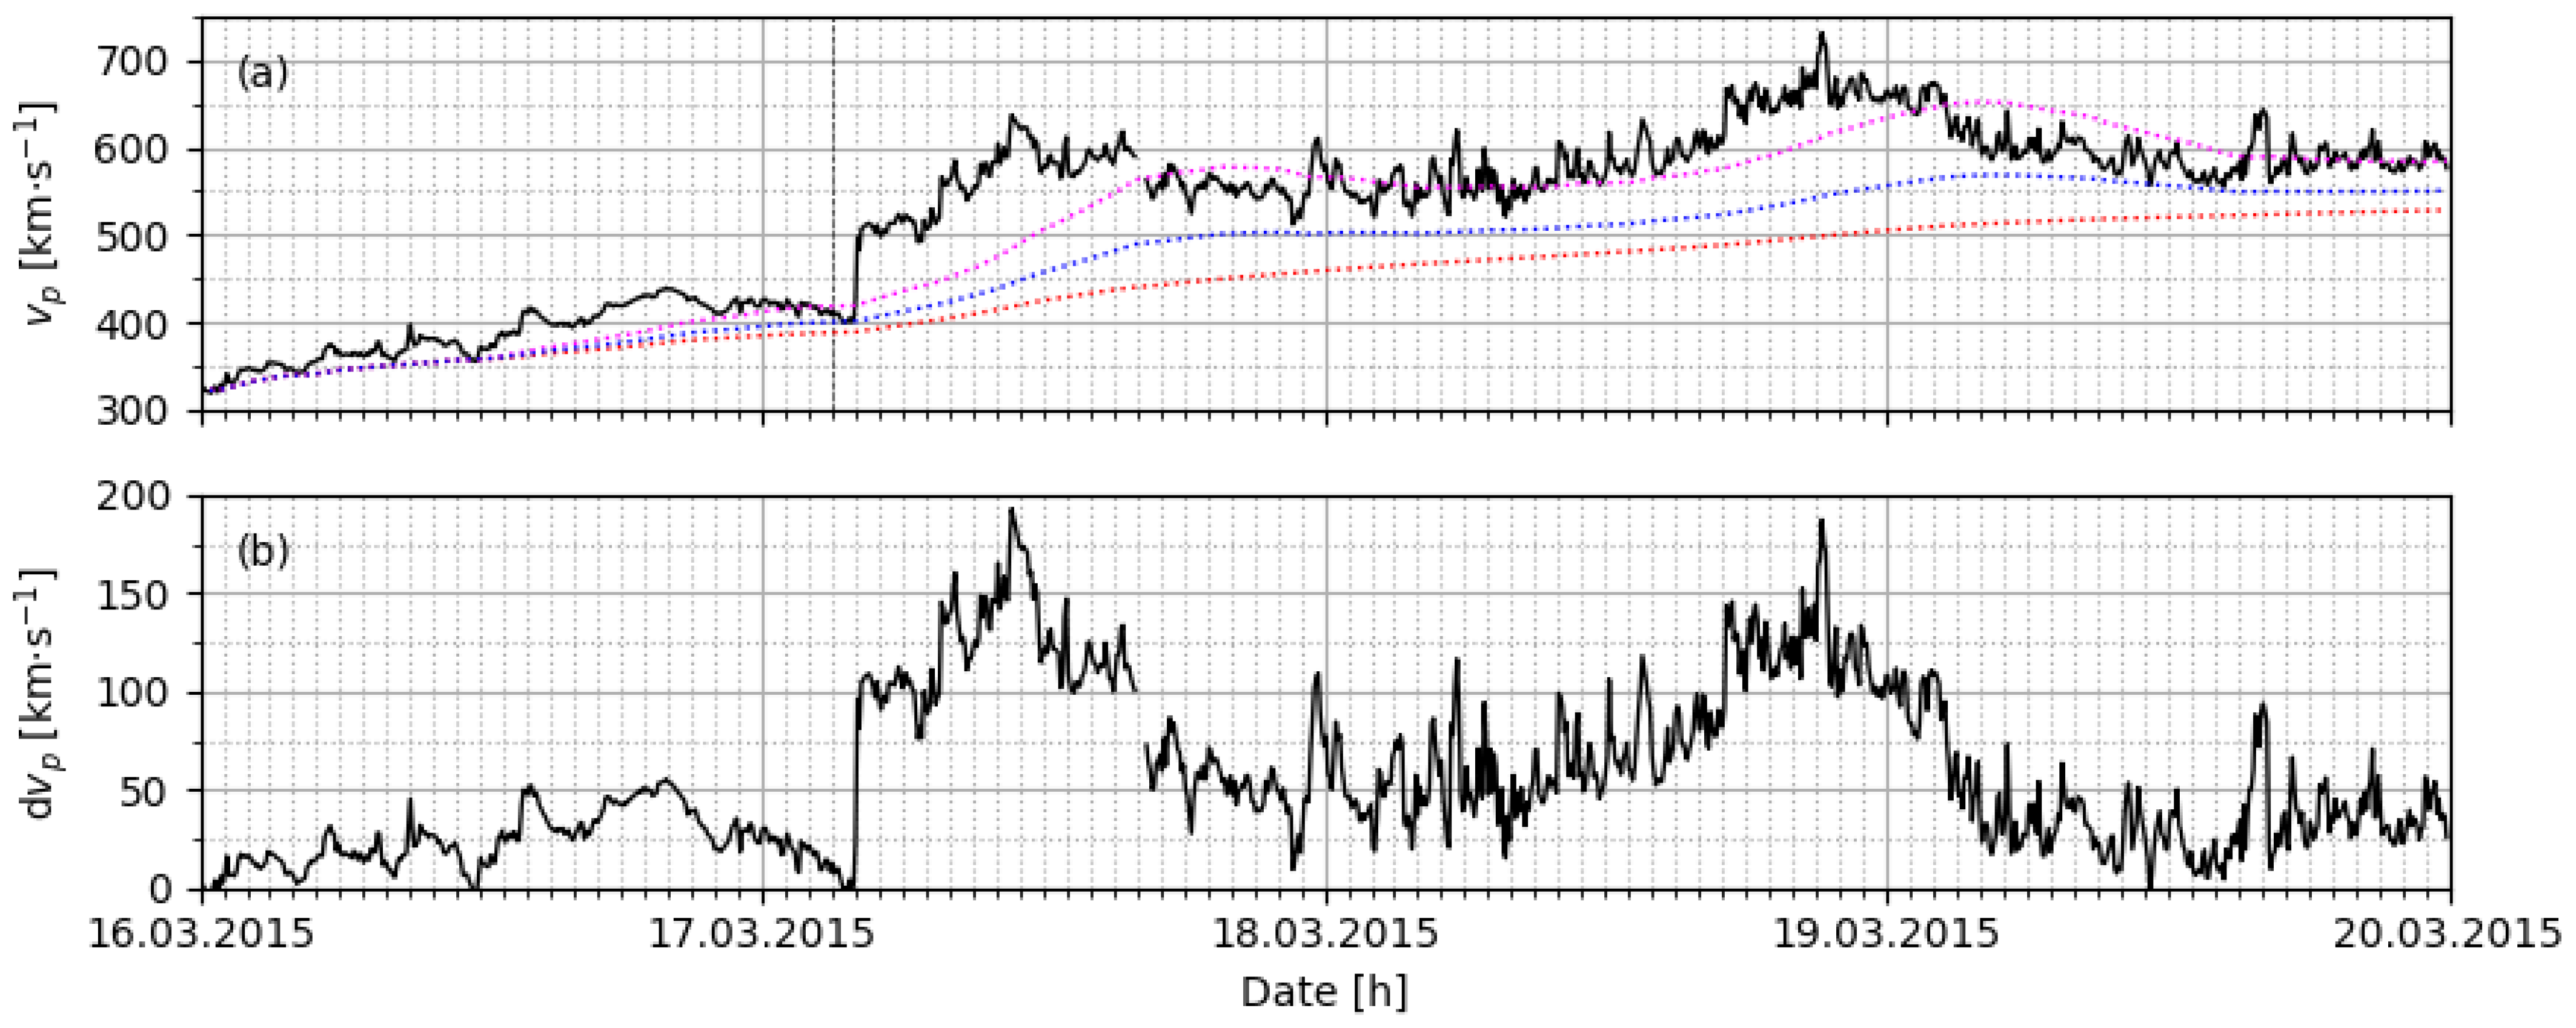
providing a relative scale that can be applied to detect events. Similar to the thresholds for the absolute values, those for the relative scale must also be optimized for the current solar cycle in future analyses (e.g., using simulations of the solar cycle based on solar flux measurements). The example for v p in Figure 3 is calculated with two equally weighted time windows of 1 and 27 d.
The resulting difference shows a much more distinct trend of the event even in this simple and not optimized configuration. In addition, this approach allows to detect storm conditions below the thresholds defined in Table 1. Both presented approaches are potential options for operating the forecast and can be further developed in the future. Other solutions may also be introduced to the framework.

3.2. Event Reconstruction

The detection of an event triggers the actual forecast process. For this, a past event from the reference list must be assigned to the current solar wind conditions. In general, this calculation requires the start time of the event t 0 , the last time step t n and all measurements x in this period per parameter k (sampling rate of 1 h). Thus, an input vector I k is defined as
I k = ( x t 0 x t n ) .
Furthermore, a matrix A k over 24 h with all reference events E is stored. All entries up to the last time step t n are selected from this matrix according to
B k = A k , t 0 t n = x E 1 , t 0 x E 1 , t n x E m , t 0 x E m , t n
and this new defined matrix B k is used to calculate the best fitting event. Before the main process, there is the option to apply another function to the data, which performs a cumulative processing of the measurements according to
x t = f ( x t , x t 1 ) .
The maximum may be applied as this specific function to only consider the increases of a parameter over time. The use of such a function generally depends on the method chosen to establish the fitting event. There are two methods implemented to realize this.
The first method will only be briefly mentioned in the context of this study, as this selection method is much more restrictive and, therefore, not specific enough with the given number of reference events. The method is based on the interpretation by lookup tables and thus the processing of selected information before the comparison of solar wind parameters. Such features include season, solar activity level (characterized by the solar radio flux index F10.7), geomagnetic indices and geometrical quantities (e.g., declination). However, this leads quite soon to a reduced set of fitting candidates based on the recently available historical events (e.g., assigning the season reduces the set of fitting reference events to approximately 25 ± 5%). With each further parameter this amount decreases and thus, the current situation of the solar wind has only a secondary role. This is not preferable and complicates the evaluation of the model results.
The second method does not rely on expert knowledge and calculates the best fitting event based on a nearest neighbor approach that takes n p , v p , B z and p e into account. This is accomplished by calculating the distance d for each combination of reference event with the current event as
d E , t = d ( B E , t , I t ) = | | B E , t I t | | .
The result for each combination is either the distance at the last time step
d E = d E , t n
or the mean distance from onset to last time step
d E = 1 n i = 1 n d E , t i .
Finally, the best fitting event E F with the smallest distance is selected according to
E F E , d E = min ( d E 1 d E m ) .
To estimate how much better E F compared to other entries performs (mean distance d ¯ calculated with d according to Equations (11) or (12) including all reference events), a quality parameter q is defined as
q E F = 1 d E F d ¯ .
This parameter is not a measure of the overall quality of the forecast, but allows to estimate how well the selected reference event describes the observed conditions and to what extent other reference events could be assigned. An Additional parameter can be calculated using the observed and predicted trend (e.g., Pearson’s correlation, Spearman’s correlation, or cosine similarity are appropriate parameters to evaluate the assigned prediction). The quality of the forecast is further described by the number of time steps at which the selected reference event changes. The number of changes depends strongly on the chosen method (see Equations (11) and (12)) and and is a measure of the forecast stability.
The proposed process is evaluated in three steps: by use of the quality parameters, comparison between observed and predicted Kp as well as comparison between observed and predicted GTEC. Furthermore, four configurations of the algorithm are investigated. The configurations NN t n and NN t 0 t n perform the nearest neighbor (NN in configuration name) approach without applying a function (see Equation (9)) for the last (see Equation (11)) and all time steps (see Equation (12)). Both configurations are extended to NNM t n and NNM t 0 t n by applying the maximum (M in configuration name) for n p , v p and p e and the minimum for B z according to Equation (9). This configuration only considers increases (decreases in case of B z ) and produces a constant time series otherwise. The analysis is based on the prediction of each reference event from the set of possible candidates (all other 592 reference events) with the four defined algorithms, excluding the event to be reconstructed. This is performed for each hourly time step of the stored 24 h time windows.
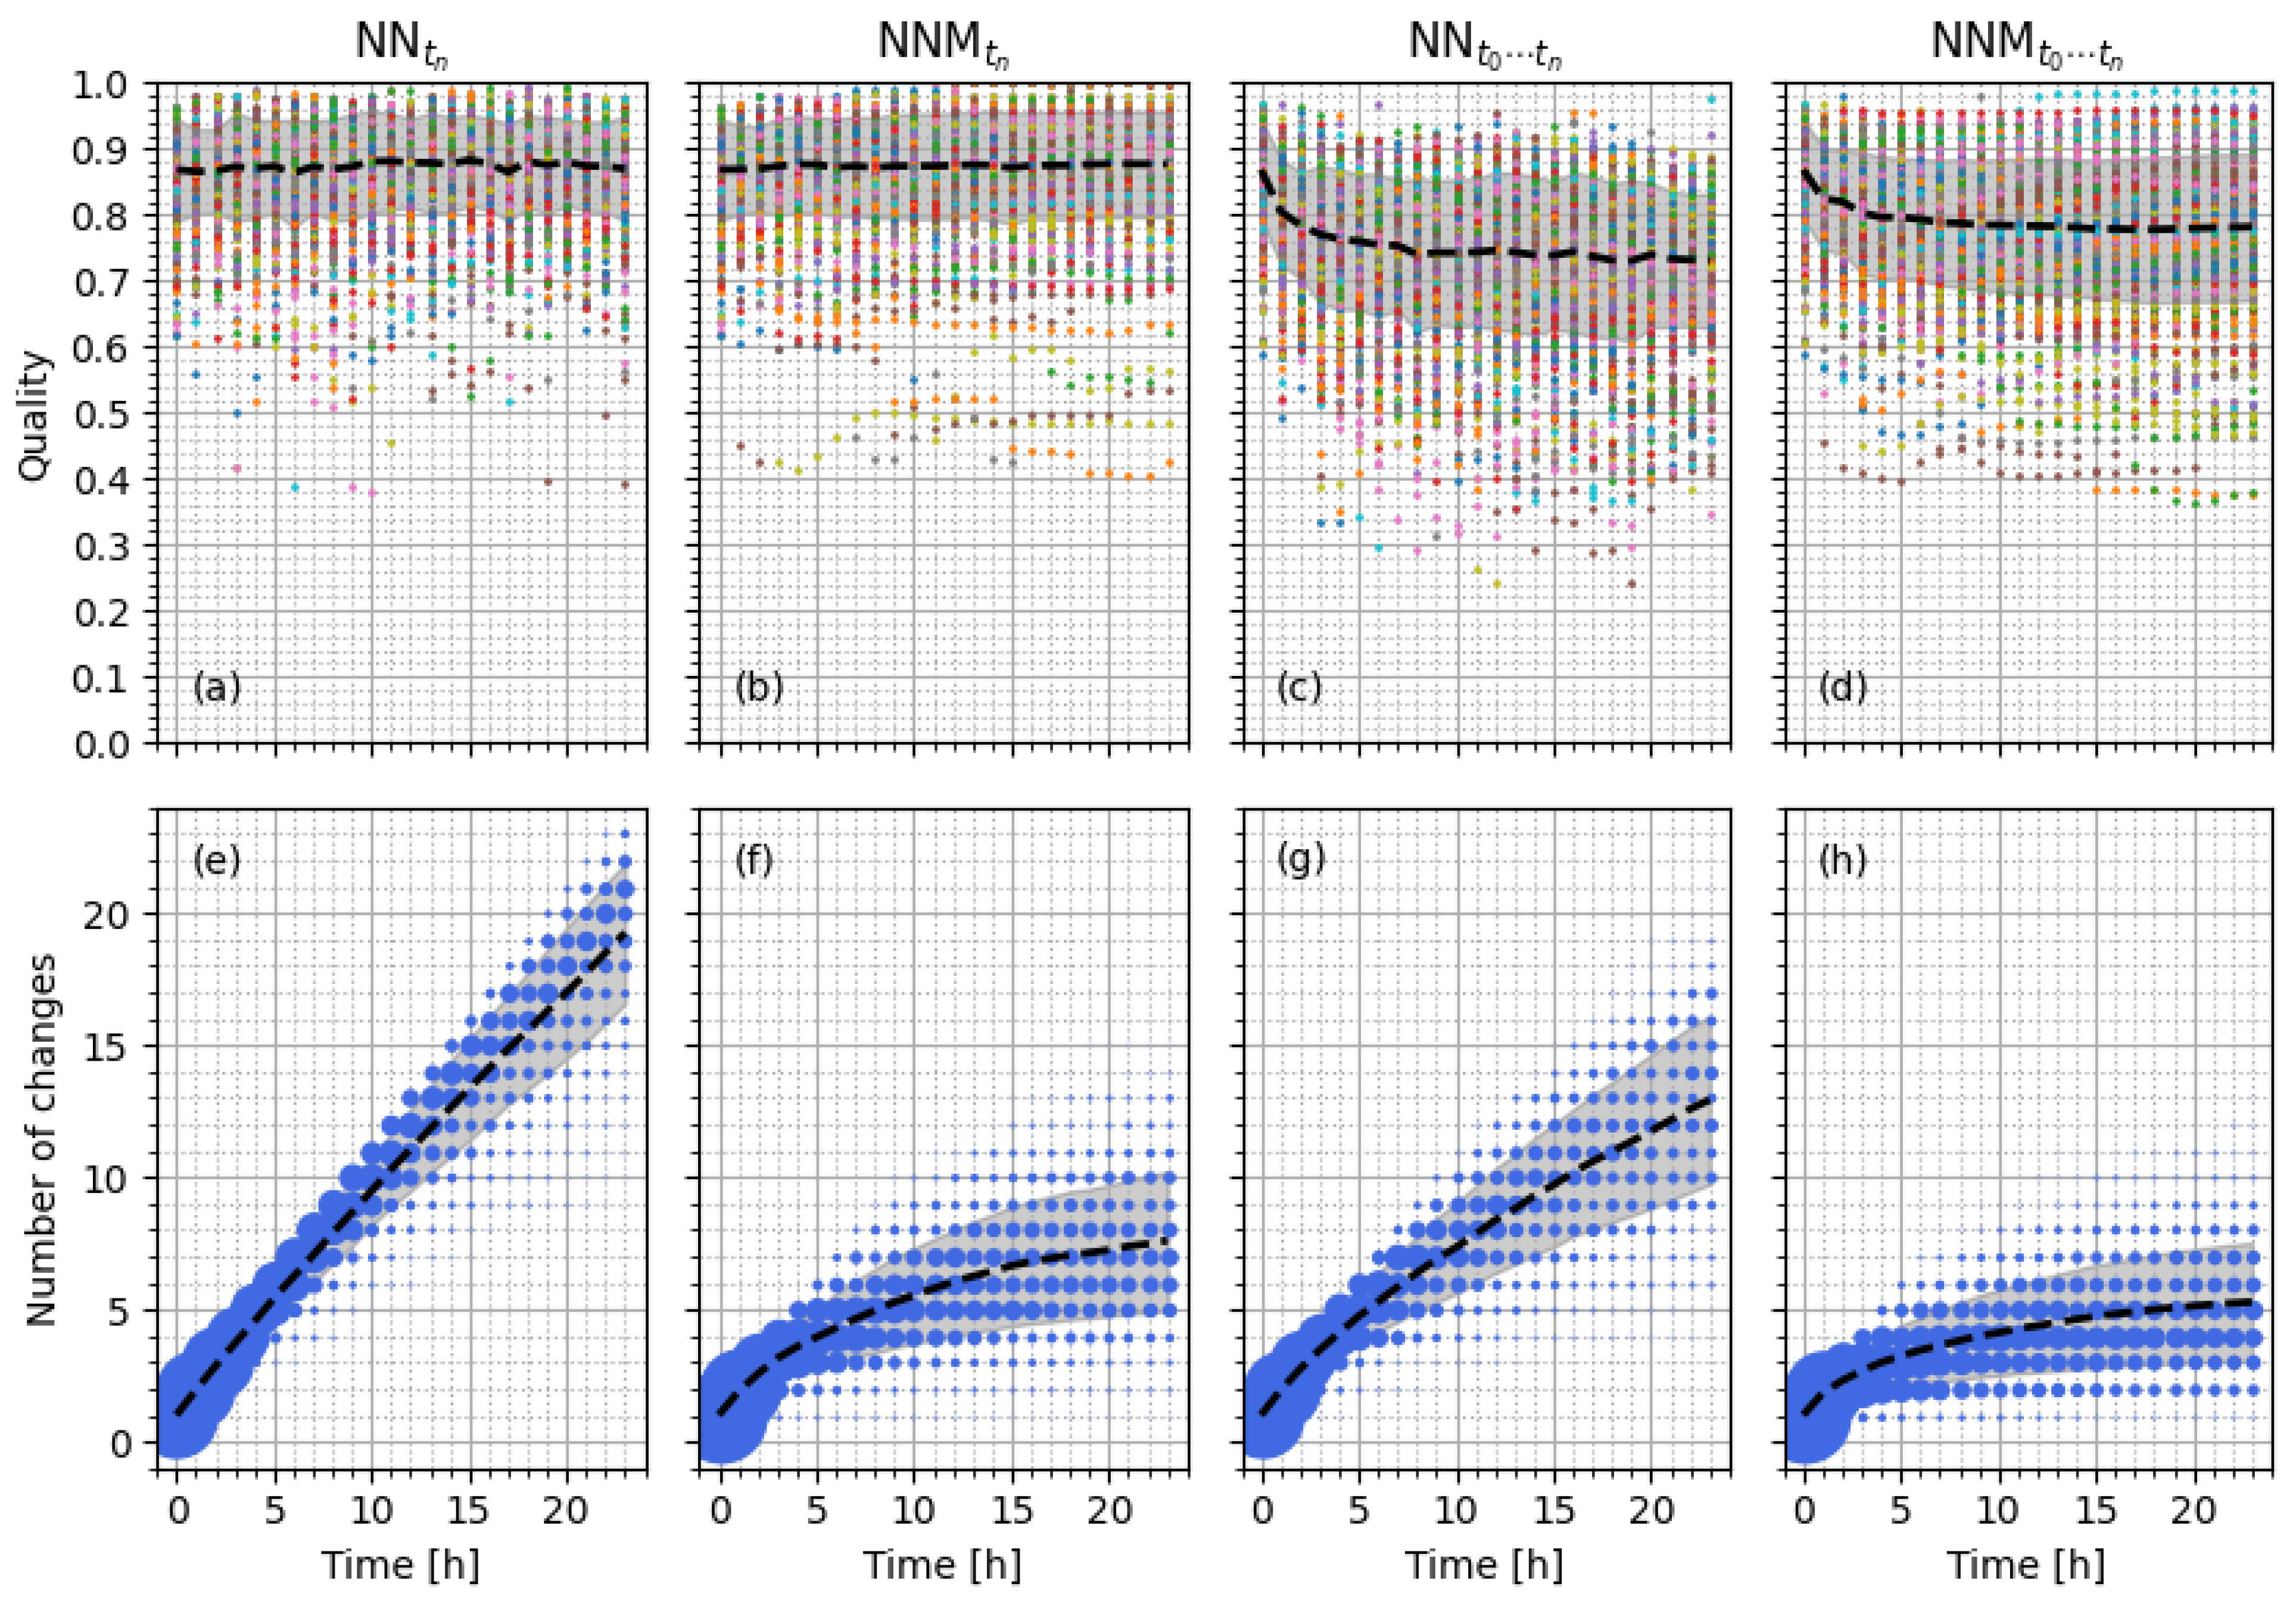
Each data point in the first row of Figure 4 represents one of the reference events and the best-fitting event according to the proposed approaches (excluding itself from the set of potential candidates). Thus, the resulting variability of the quality (see Equation (14)) describes how well events are selected using the different approaches. The second row of Figure 4 shows the number of changes between time steps and summarizes the distribution for all data points (size of dots). The estimated mean quality in Figure 4a,b is constant (approximately 0.87) due to the chosen method adjusting the best fitting event during that time step. However, this causes the selected reference event to change continuously, and the number of changes in Figure 4e shows that this happens for most of the events at each time step. This behavior is not desirable as it prevents a stable prediction. As shown in Figure 4f, the problem can be significantly reduced (more than 50%) by applying the maximum (minimum) without having a significant impact on the quality of the selection. The application of such a simple function has already resulted in a major improvement of the results. Thus, this option is definitely a useful addition to the core algorithm.
The estimated mean quality in Figure 4c,d is decreasing during the first time steps but then stabilizes (approximately at 0.75 and 0.79). The quality for NN t 0 t n and NNM t 0 t n is lower than for NN t n and NNM t n , because a time series is matched instead of a single data point. The quality in Figure 4c,d does not decrease indefinitely as the most significant changes in events are observed at some of the first time steps (e.g., shock of IMCE). These deviations determine the correlation and if, for example, no secondary shock occurs, then the model reaches a stable state. In the other case, the model would adjust further. The number of changes in Figure 4g,h show as well the impact of applying the maximum (minimum) to the time series. The number of changes is significantly decreased in Figure 4h but also the prediction quality is slightly improved in Figure 4d.
As explained, these parameters do not provide any information about the quality of the TEC forecast (e.g., compared to other models) and instead describe how well the selected forecast compares to all other candidates in the reference list. These parameters are also useful to calibrate the stability and sensitivity of the model.
A first estimation of the forecast quality is calculated by comparing observed and predicted parameters. The geomagnetic index Kp is analyzed because it strongly depends on the latitude [69] and thus describes the influence of the solar wind also spatially. Since global TEC maps for the analyzed period are not yet available at the required sampling rate, the global mean TEC (GTEC) across all grid points (latitudes Φ and longitudes Λ ) according to Equation (15) from the final combined solution (IGS) maps is used in this study (sampling rate of 2 h).
GTEC = 1 | Φ | · | Λ | i = 1 | Φ | j = 1 | Λ | TEC i , j
After the GTEC calculation, the required sampling rate of 1 h is obtained by applying linear interpolation. The analysis with GTEC is expected to be related to geomagnetic indices [70] and thus to solar wind features, but the lack of latitudinal separation is expected to create interference of different spatial variations.
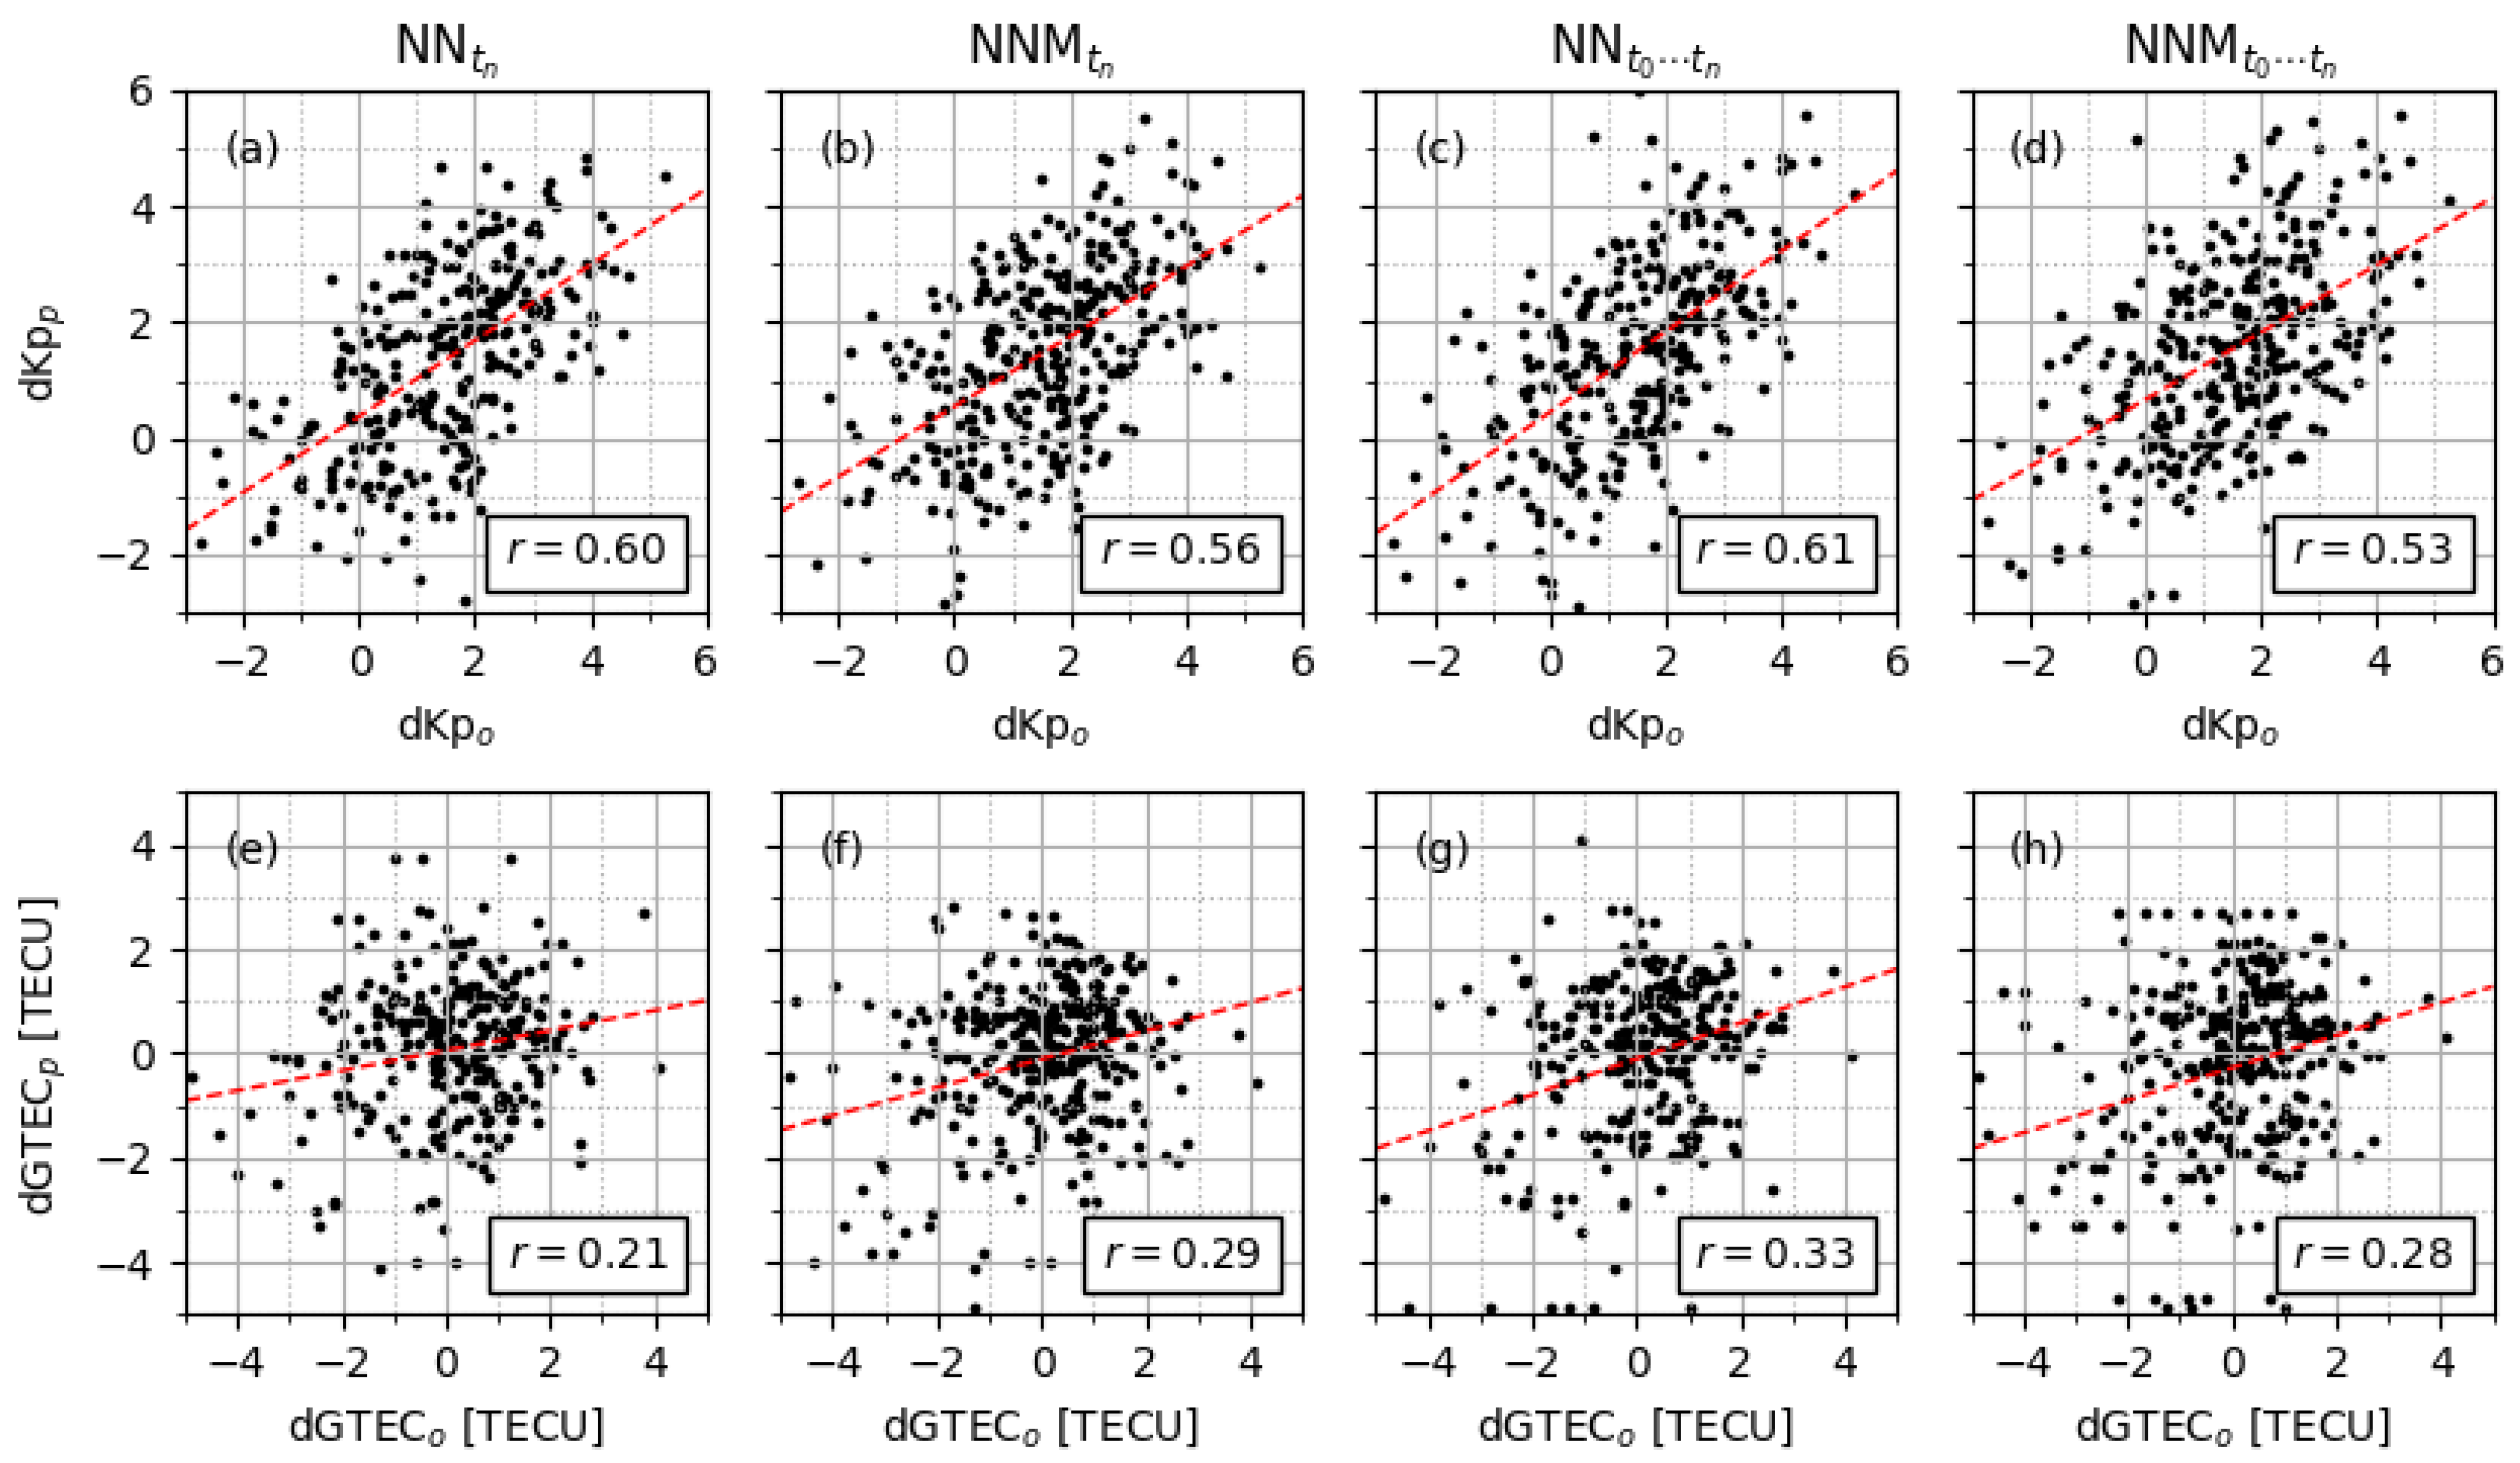
Figure 5 shows the difference of Kp and GTEC at the third time step past the onset time with scatter plots (the time step is chosen arbitrarily within the first phase of the storm). The correlation of observed and predicted Kp is moderate for all configurations of the model approach at this time step. NN t 0 t n performs better than the other configurations, but the difference is insignificant. All configurations are capable of recreating the geomagnetic effects in the first hours of an event. The correlation of observed and predicted GTEC is weak with NN t 0 t n performing the best. Configuration NN t n is considerably worse than the others. Continuously adjusting to the last time step increases the probability of missing a crucial feature in the solar wind resulting in weak correlation.
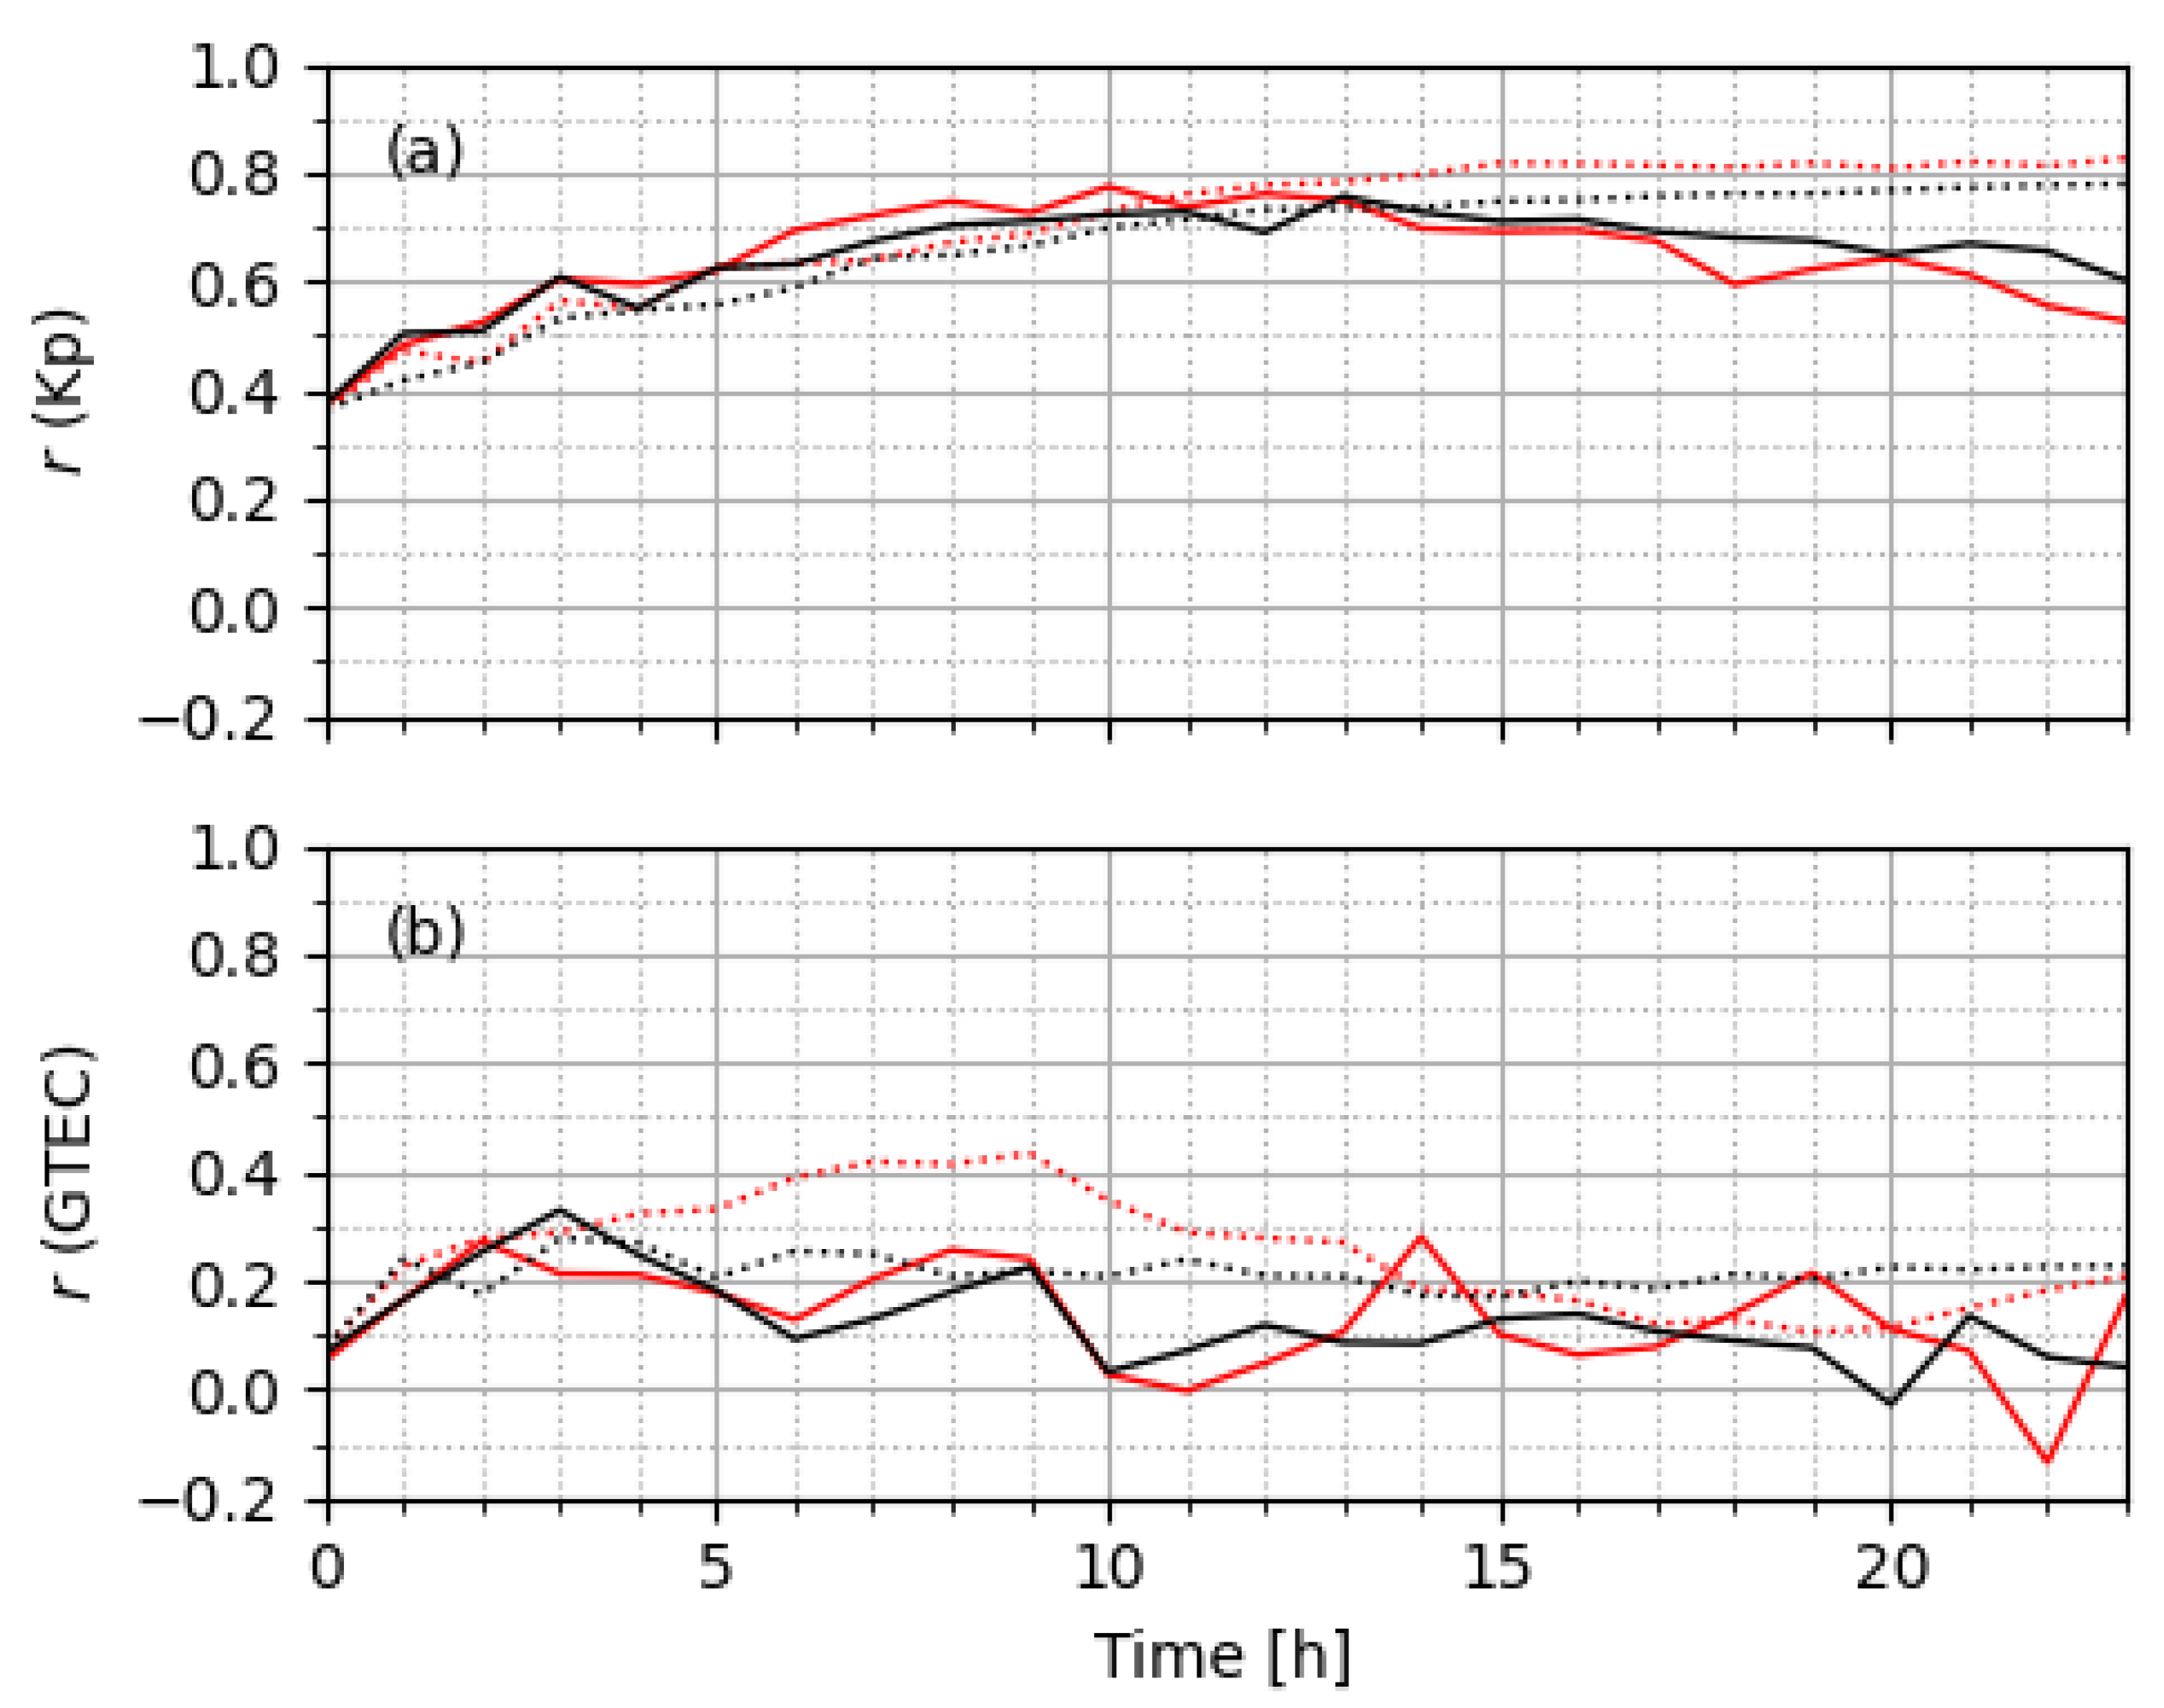
The analysis of the correlation is extended by calculating each time step. The resulting correlation time series are shown in Figure 6.
The correlation of Kp in Figure 6a is moderate and strong after the first few hours for all configurations. The most significant difference between configurations is observed after approximately 12 h. Although configurations NN t n and NN t 0 t n show a decrease in correlation from this point on, the correlation for NNM t n and NNM t 0 t n is approximately constant. This suggests that the maximum (or minimum) of solar wind features is crucial for the duration of geomagnetic effects, and therefore the approaches that prioritize these maxima (minima) perform better in the recovery phase of an event. The mean correlation based on Kp for NN t n , NNM t n , NN t 0 t n and NNM t 0 t n is 0.64, 0.70, 0.64 and 0.66, respectively. These correlations are good considering that these are only first results and a Kp nowcast is not taken into account.
The correlation of GTEC in Figure 6b is weak for all configurations and has much stronger deviations. The results indicate that either the model algorithm or configuration needs to be improved, or that GTEC is not appropriate due to the lack of separation of spatial features (dTEC variations in different regions). This can only be resolved with the help of analyses based on TEC maps in the future. NNM t n and NNM t 0 t n generally perform better showing again the importance of the maximum (minimum). The mean correlation based on GTEC for NN t n , NNM t n , NN t 0 t n and NNM t 0 t n is 0.13, 0.25, 0.12 and 0.21, respectively.
Figure 7 shows an example reconstruction for the geomagnetic storm during 14 December 2006. Several of the configuration aspects discussed are seen in detail. For example, the reconstructed trend of B z according to NN t n in Figure 7i shows the ongoing change of the selected reference event and how this results in a good fit. However, this trend also shows that the variations do not fit before the selected time step. The observed deviations are stronger than in any other configuration. For NNM t n (e.g., see Figure 7j) the number of changes is reduced to 2 and a very good fit for all parameters is calculated. This shows once again that the reconstruction of an event is improved by applying the maximum (minimum) function (see Equation (9)). NN t 0 t n and NNM t 0 t n have a similar improvement with a reduced number of changes (especially in the second half of the 24 h period). The improvement is less significant for these configurations though, since NN t 0 t n shows without the applied function a small number of changes and a good fit for all parameters. In conclusion, NNM t n , NN t 0 t n and NNM t 0 t n predict n p , v p , B z and p e for the geomagnetic storm during 14 December 2006 well, and only a small number of adjustments is required. A stable forecast, that is able to account potential variations, is realized on this basis.

3.3. dTEC Archive

In the archive, n p , v p , B z , p d and p e as well as dTEC maps and TEC maps are stored in a 24 h window for each reference event. The data have a shared sampling rate (for this study 1 h) for direct use in the forecast process. The solar wind data are stored for the calculation of the fitting event to the current situation and the TEC maps are stored for the reconstruction of the event progression. The dTEC maps at each time step t (sampling rate of 1 h) are calculated according to
dTEC t = TEC t CMA ( TEC t ) = TEC t 1 27 i = 13 13 TEC t + 24 i .
The centered moving average (CMA) is calculated here for the same time of day over a time window of 27 d. The starting time t 0 is the onset time of the reference event. Additionally, a 2-dimensional Gaussian filter can be applied to ensure better processing and interpretability for the forecast. The filtered dTEC is calculated for each coordinate with latitude ϕ and longitude λ according to the Gaussian kernel G as
G ( ϕ , λ , dTEC ; σ ) = 1 ( 2 π · σ ) 3 e ϕ 2 + λ 2 + dTEC 2 2 σ 2 .
The standard deviation σ controls the smoothing factor of the Gaussian filter.
In Figure 8, the calculated dTEC and filtered dTEC during the St. Patrick’s Day geomagnetic storm at 17 March 2015 14:00 UTC are shown. The filter removes certain components of the spatial variations and reduces the range of values. This is desirable only up to a certain degree for an accurate forecast. On the other hand, the filtered map can be better superimposed on the quiet condition forecast to retrieve the storm condition forecast. This eliminates strong gradients and artifacts which otherwise negatively influence the forecast quality. Both TEC and dTEC maps are stored in the archive, so that it is also possible to provide a forecast based on relative values Δ TEC according to
Δ TEC t = dTEC t CMA ( TEC t ) · 100 % = TEC t CMA ( TEC t ) CMA ( TEC t ) · 100 %
For this alternative no quiet condition forecast is required and Δ TEC would be delivered at each time step as the corresponding prediction. This approach was already implemented in the framework of the EU FP7 AFFECTS project [12].
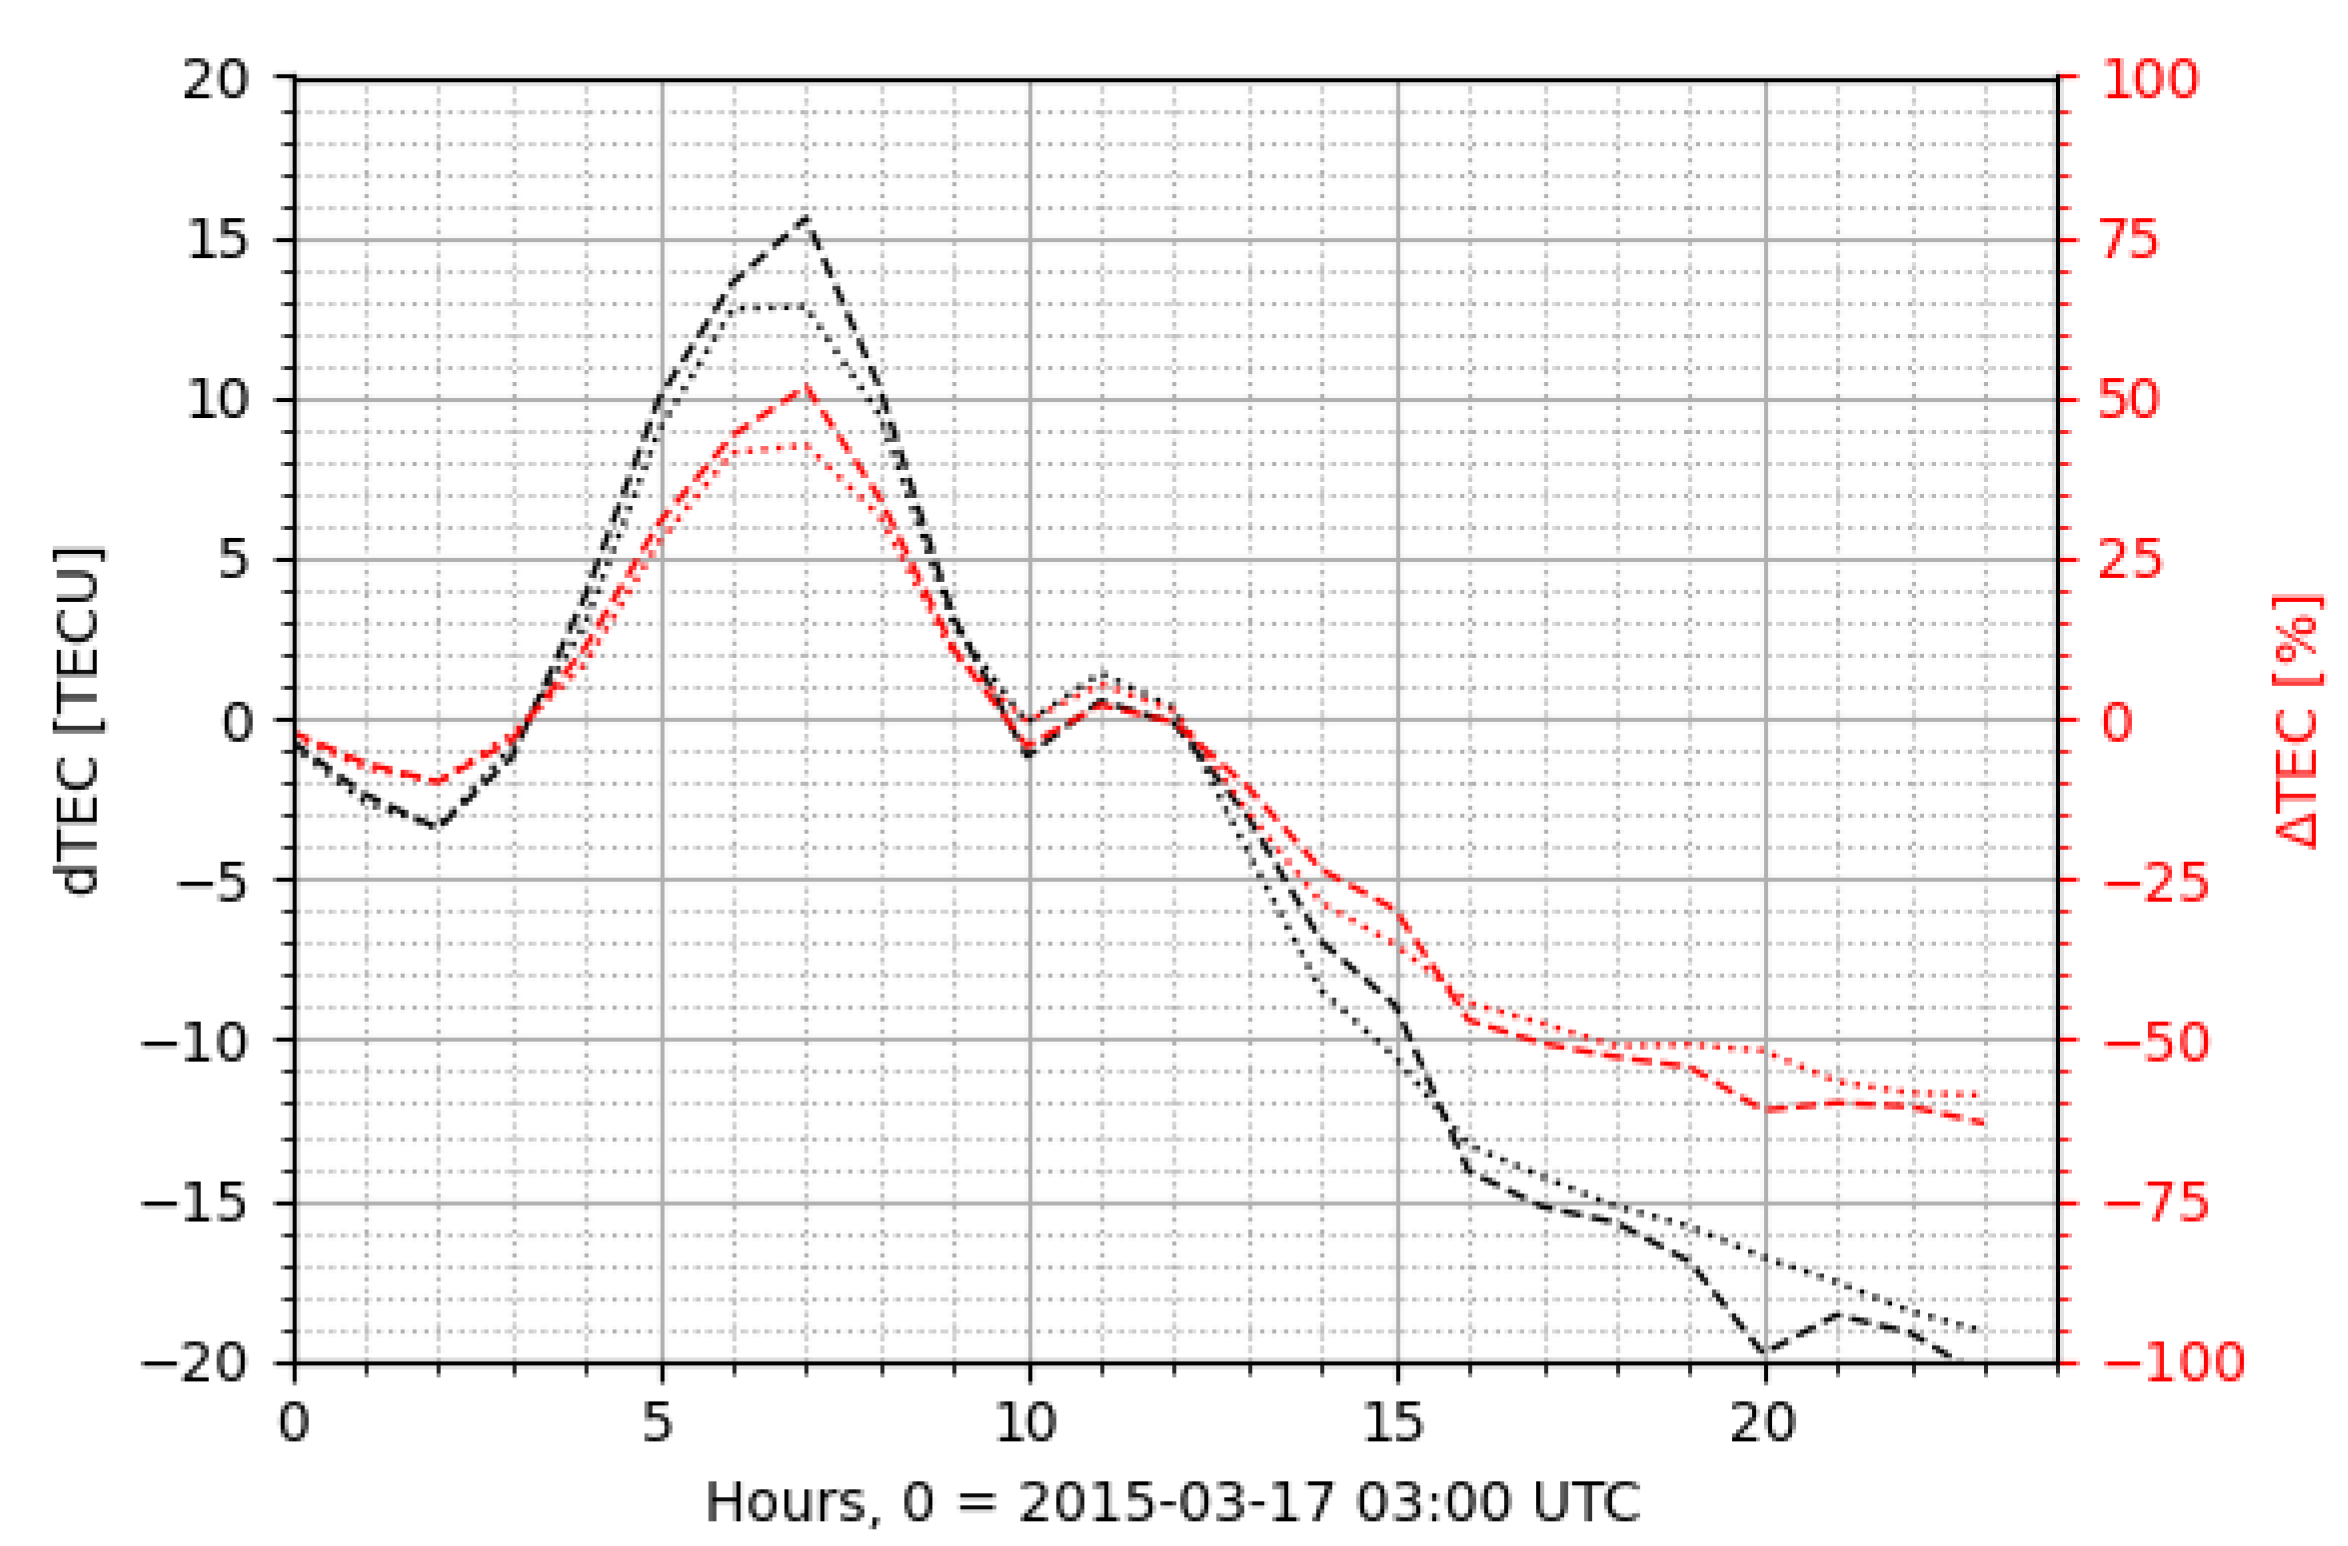
Figure 9 shows dTEC, as well as Δ TEC, during the St. Patrick’s Day geomagnetic storm for 24 h from the onset time 17 March 2015 03:00 UTC (recorded interplanetary shock) at a selected mid-latitude location.
Both calculated trends reflect the results of various studies investigating the ionospheric response to this event [25,27,28] showing the impact of a positive ionospheric storm followed by a negative ionospheric storm during the recovery period. Figure 9 shows also that the impact of the Gaussian filter has no significant impact on the time series. The defining variations of the event are unchanged despite the elimination of spatial artifacts (see Figure 8). The root mean square error (RMSE) between unfiltered and filtered dTEC is 2.88 TECU (2.21%) for all grid points during the 24 h period (see Figure 9). Nevertheless, the applied filter has to be optimized in the future. In addition, each event may obtain a specific filter configuration, if that approach proves to be beneficial.

3.4. Quiet Condition Forecast

The forecast for climatological changes in the ionosphere is calculated using the same time window of 27 d as dTEC (covering a single solar rotation). A time window of 81 d as used in various solar flux proxy models would also be an option. However, this is rather uncommon for processing TEC. The quiet condition forecast (qTEC) at each time step t (sampling rate of 1 h) is calculated using a SMA according to
qTEC t = SMA ( TEC t 24 ) = 1 27 i = 27 1 TEC t + 24 i .
Thus, dTEC (reference events) and qTEC (observed event) refer to different time frames with respect to the onset time (see Equation (16)). The use of CMA would be the optimal solution in both cases (accounting for the enveloping ionospheric trend), but this is obviously not possible for a real-time qTEC calculation.
Figure 10 shows CMA and SMA during the St. Patrick’s Day geomagnetic storm at 17 March 2015. The difference between the two maps is insignificant (e.g., the mean value for CMA and SMA is approximately 26.76 and 26.31 TECU). There are also no apparent differences in the spatial distribution. Therefore, the results are good considering that qTEC is only the background model.

3.5. Storm Condition Forecast

The storm condition forecast (fTEC) is provided either directly through dTEC maps (see Equation (16)), Δ TEC maps (see Equation (18)) or through combination of these maps with the background model according to Equations (20) and (21).
fTEC t = qTEC t + dTEC E F
fTEC t = qTEC t · ( Δ TEC E F + 100 % )
The selected reference event E F (see Equation (13)) can change over time resulting in continuous updates of the forecast (see Figure 7).
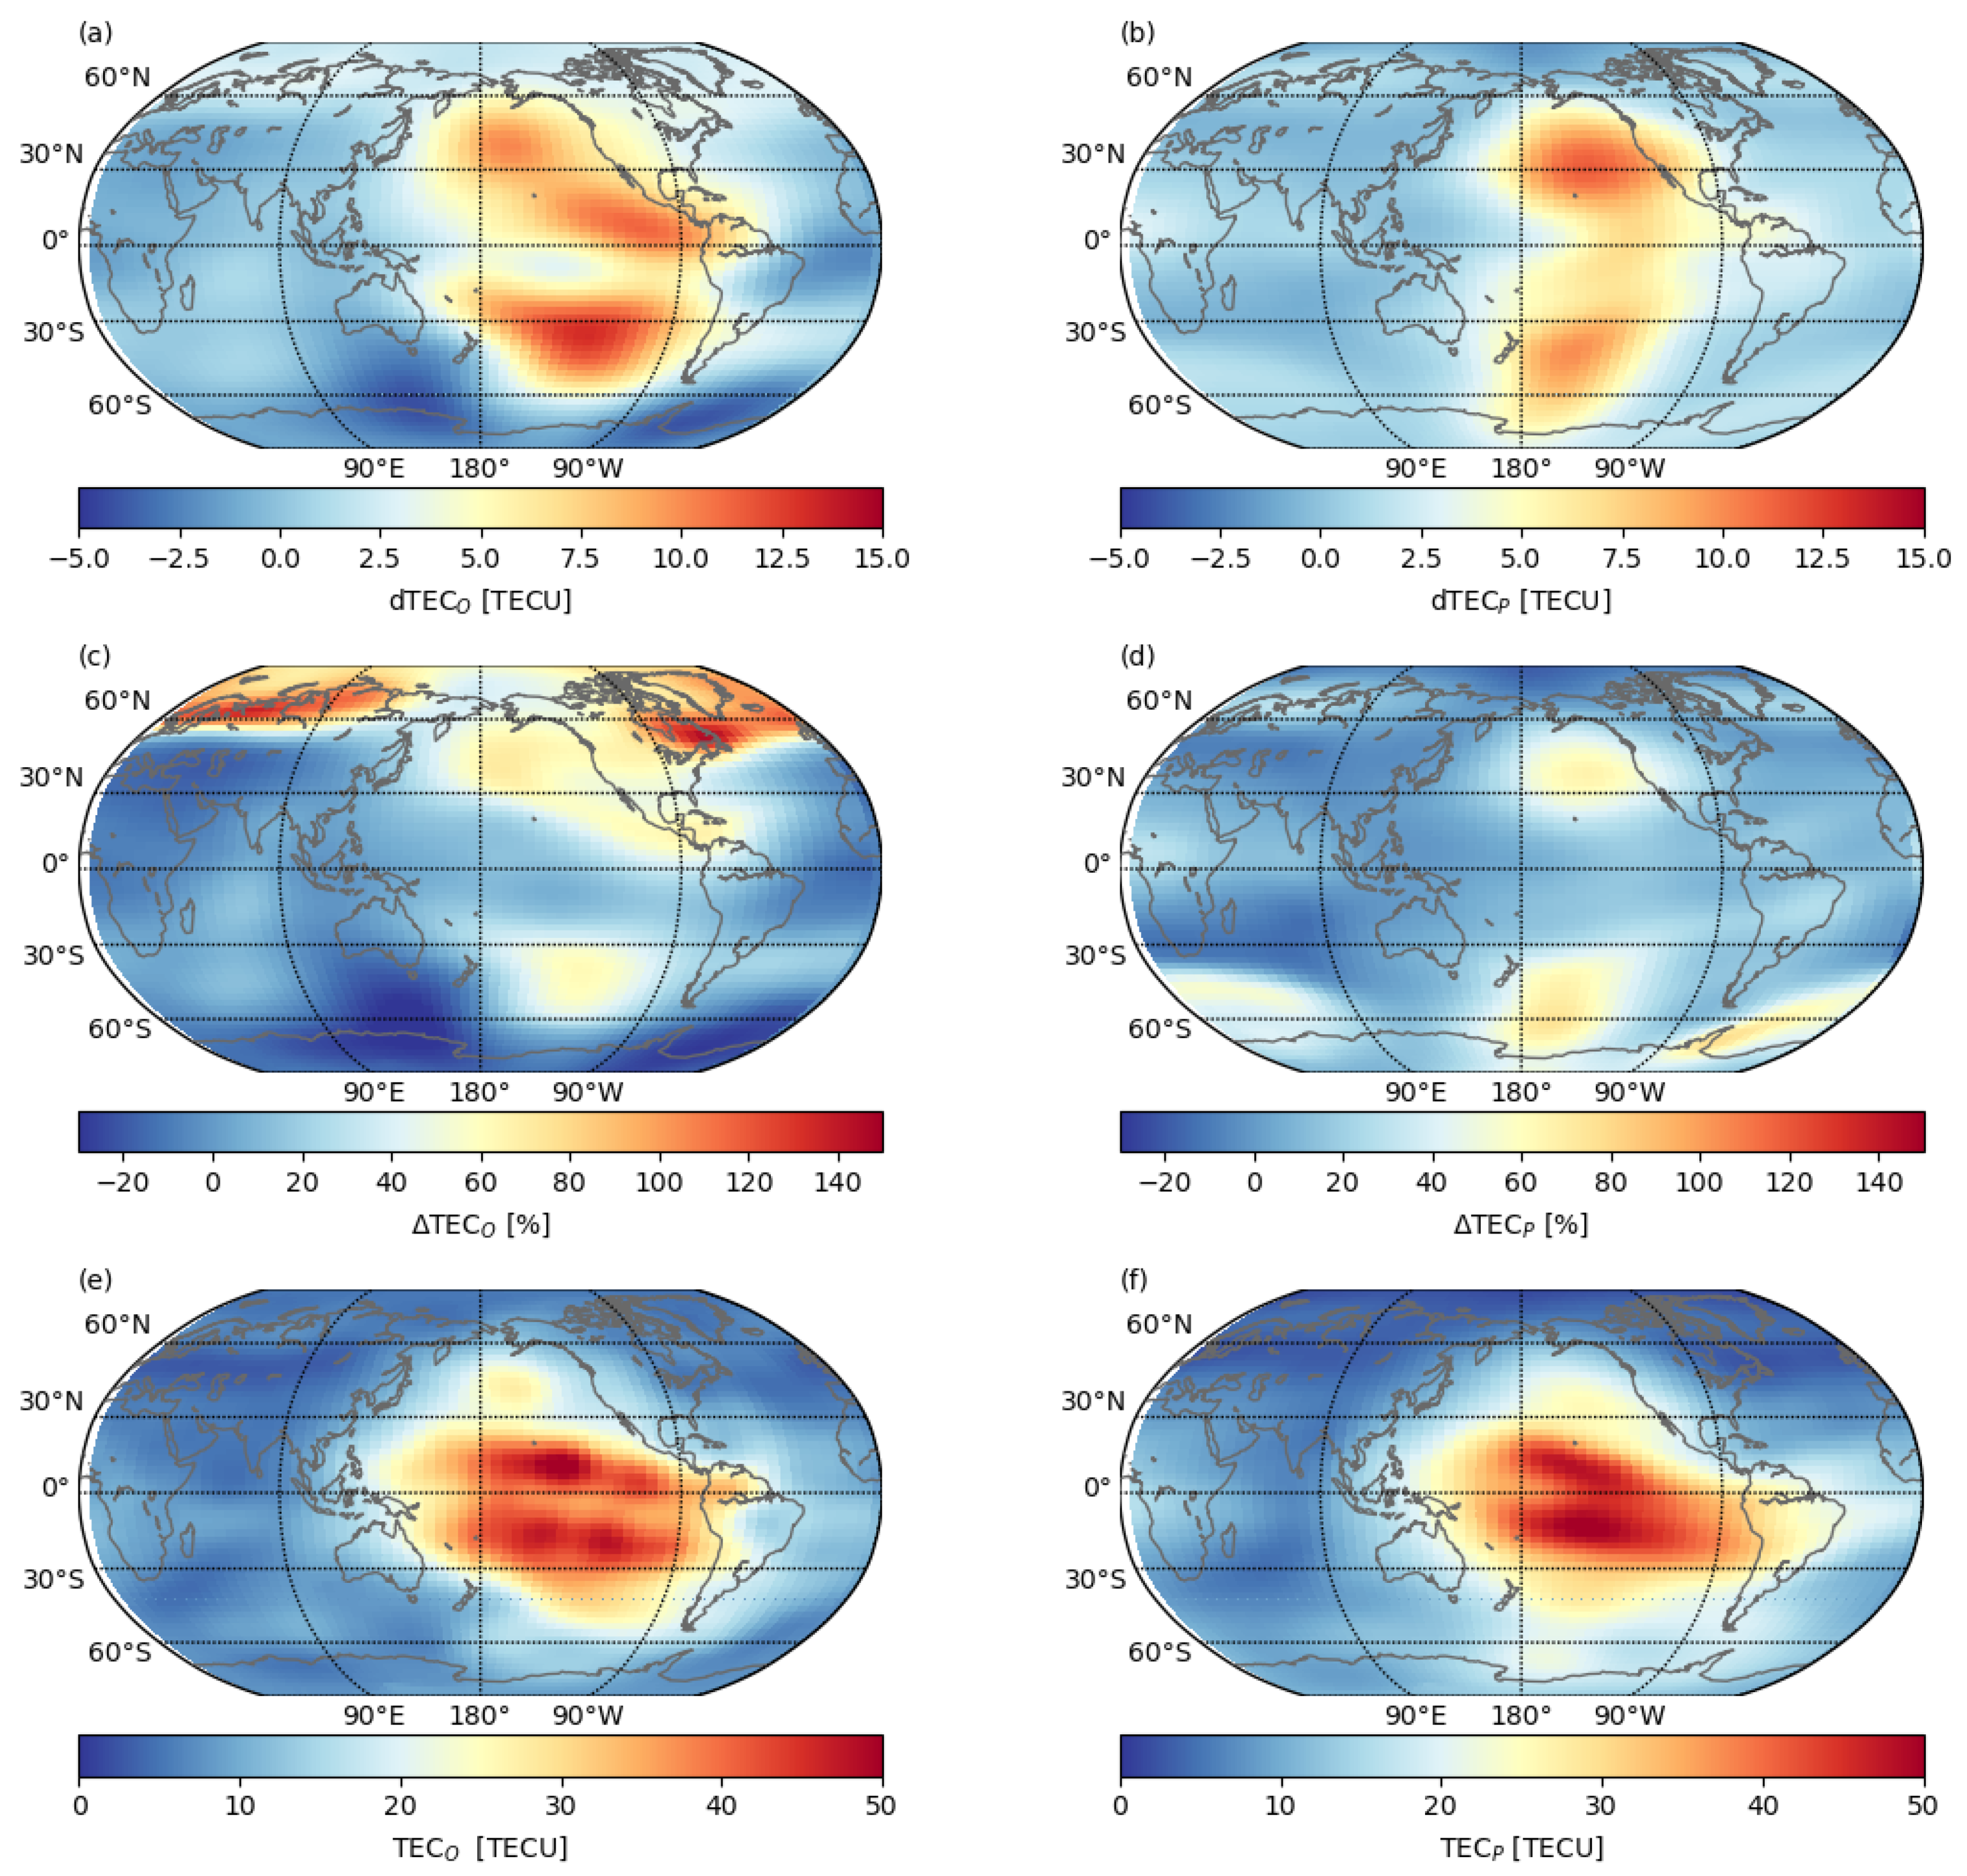
The forecast according to NNM t n and NNM t 0 t n for the geomagnetic storm during 14 December 2006 favors the reference event during 15 September 2005 (assigned to 67% and 17% of the time steps). The forecast according to this reference event and Equation (20) is shown in Figure 11. Both observed and predicted dTEC (see Figure 11a,b), show an TEC enhancement in the Northern and Southern hemisphere between approximately 180 ° W to 90 ° W. The spatial distribution is different in shape and the observed dTEC in the Southern hemisphere is stronger. Nevertheless, the major features are retrieved. The derived Δ TEC maps (see Figure 11b,c) show the increase in both hemisphere as well, but other features are also present. The observed Δ TEC shows strong enhancements (up to 150%) in the Northern hemisphere at approximately 60 ° N between 90 ° W to 90 ° E. These features (on Earth’s night side) is less pronounced (up to 60%) for the predicted Δ TEC. Since TEC tends to take on rather small values at these latitudes and during the night, these changes do not make a significant difference to the absolute values, but nonetheless they indicate areas where ionospheric disturbances are likely to occur. The TEC observations during the event (onset 13:00 UTC, time step 12 h) and final forecast (see Figure 11b,c) have a good agreement regarding absolute values and as expected, a TEC increase in both hemispheres is retrieved. The spatial distribution due to the differences in dTEC is also present in the TEC forecast.
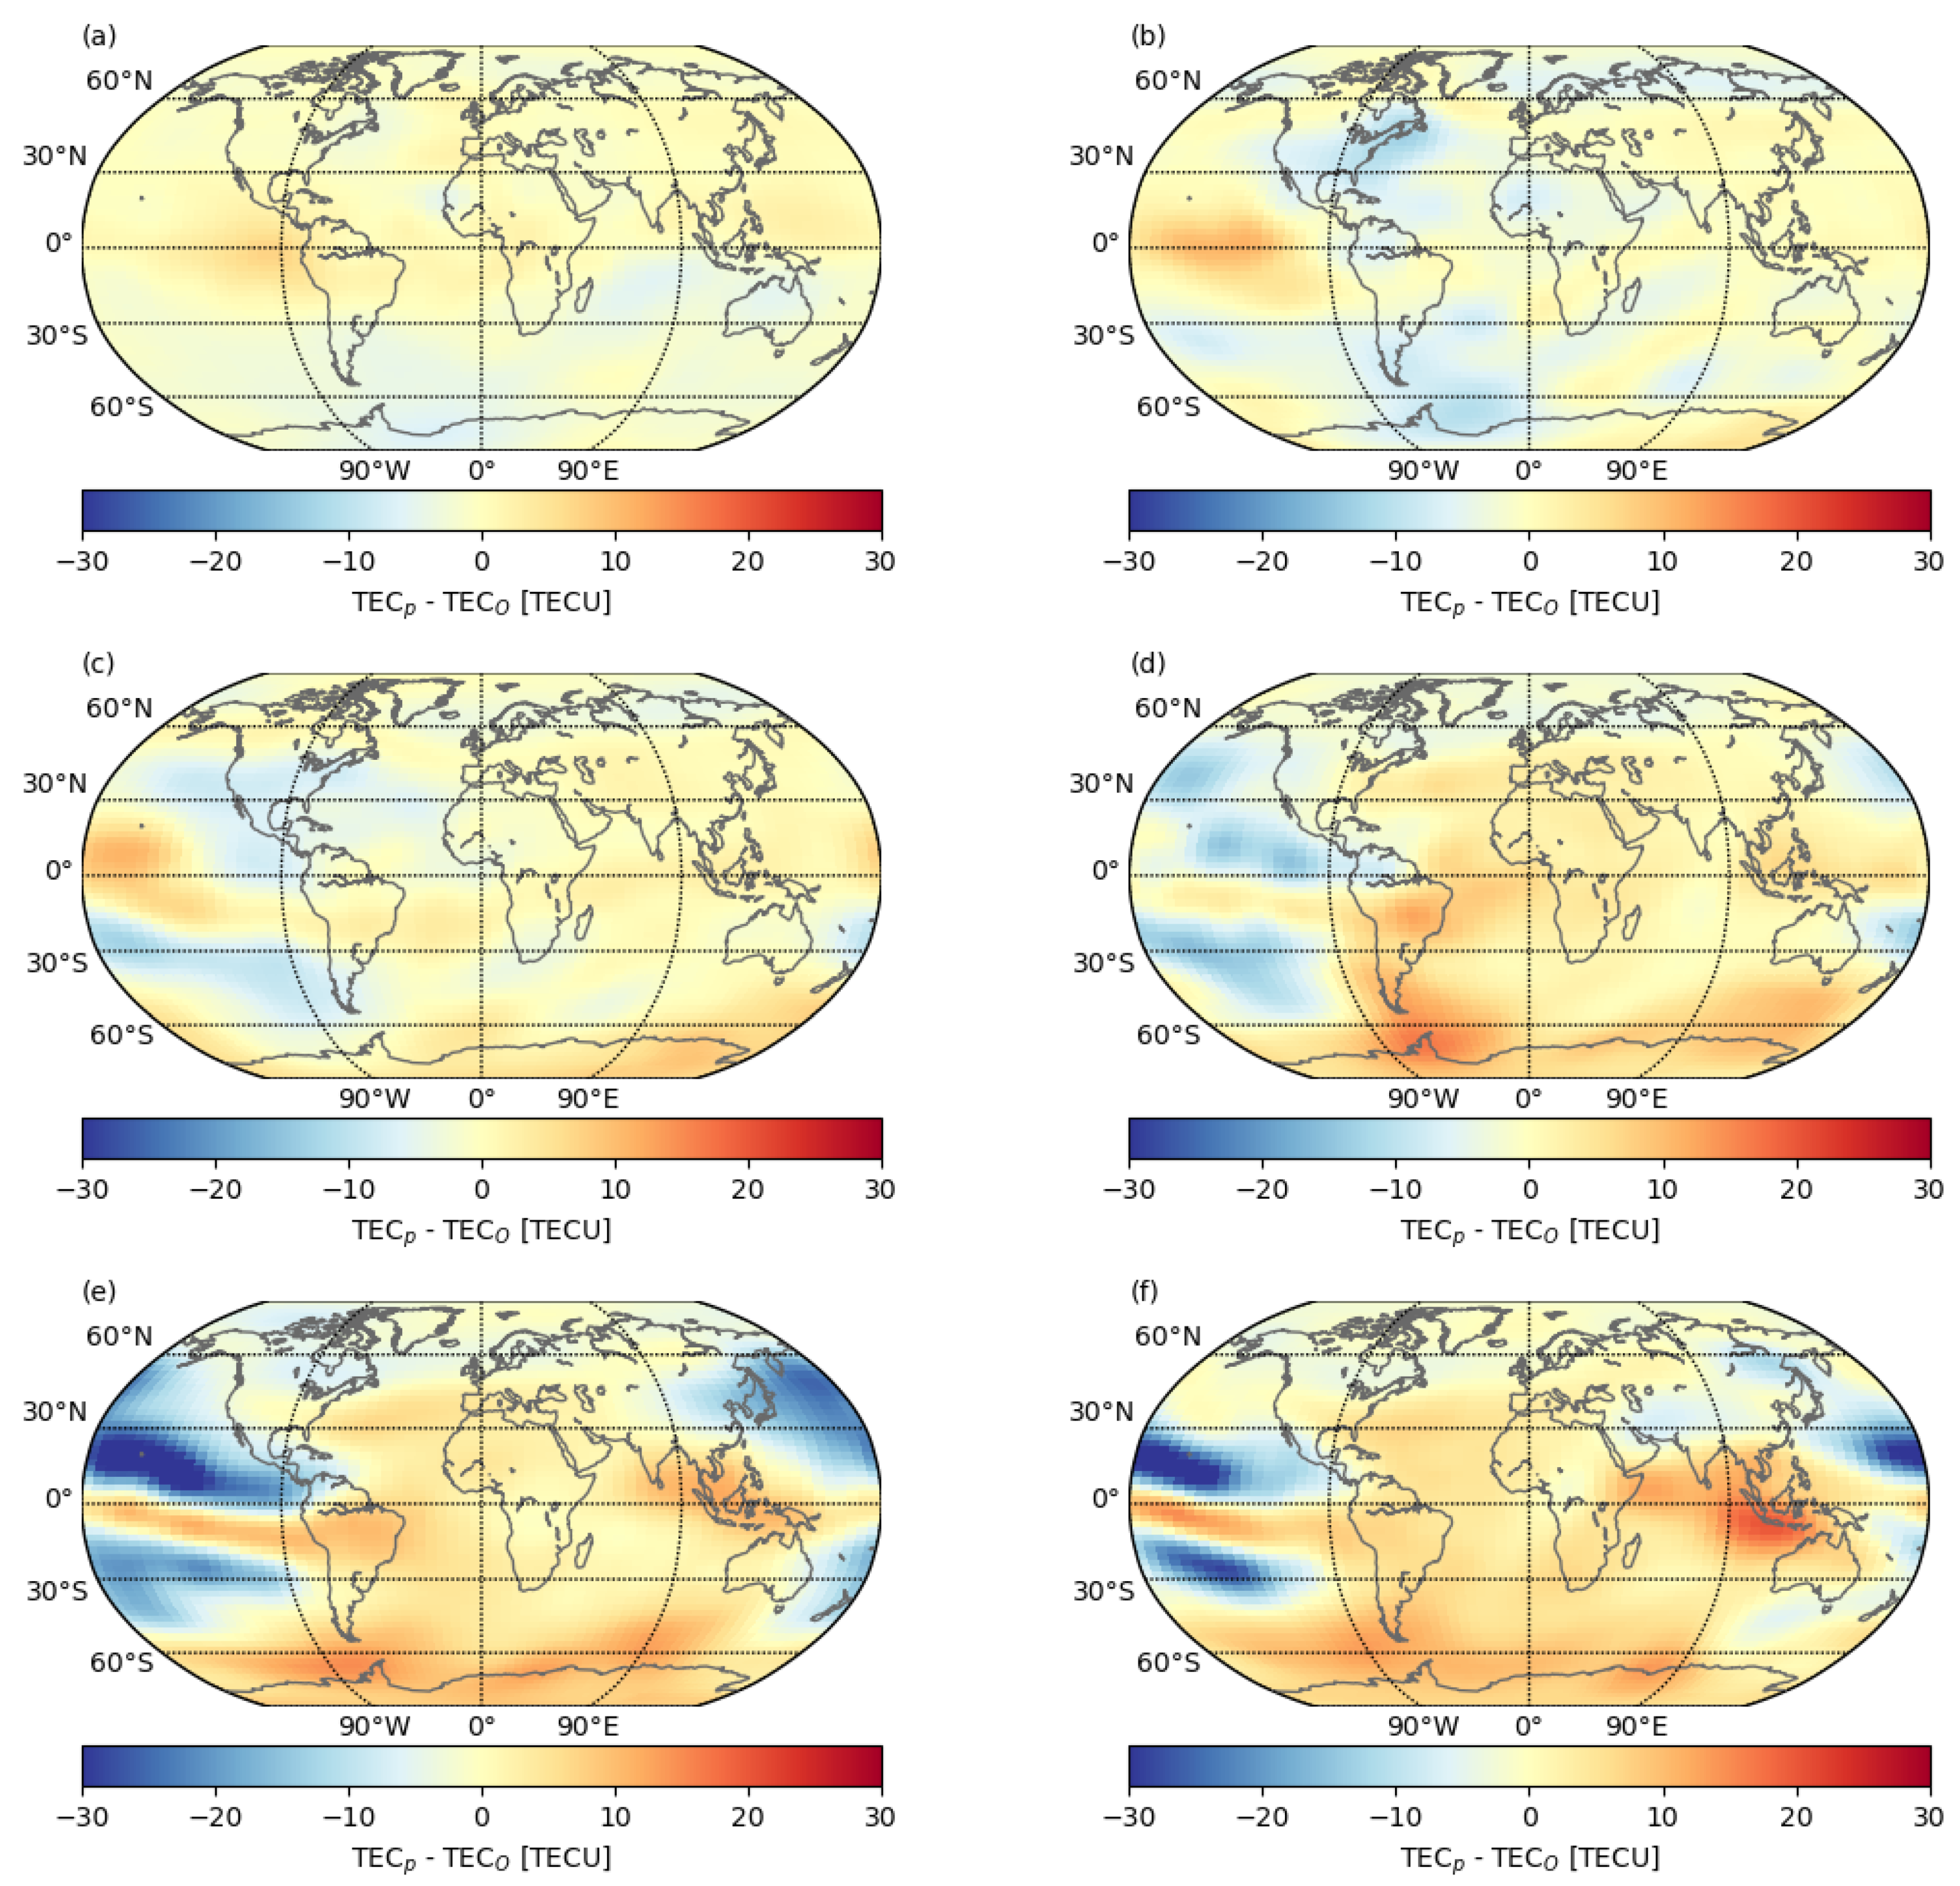
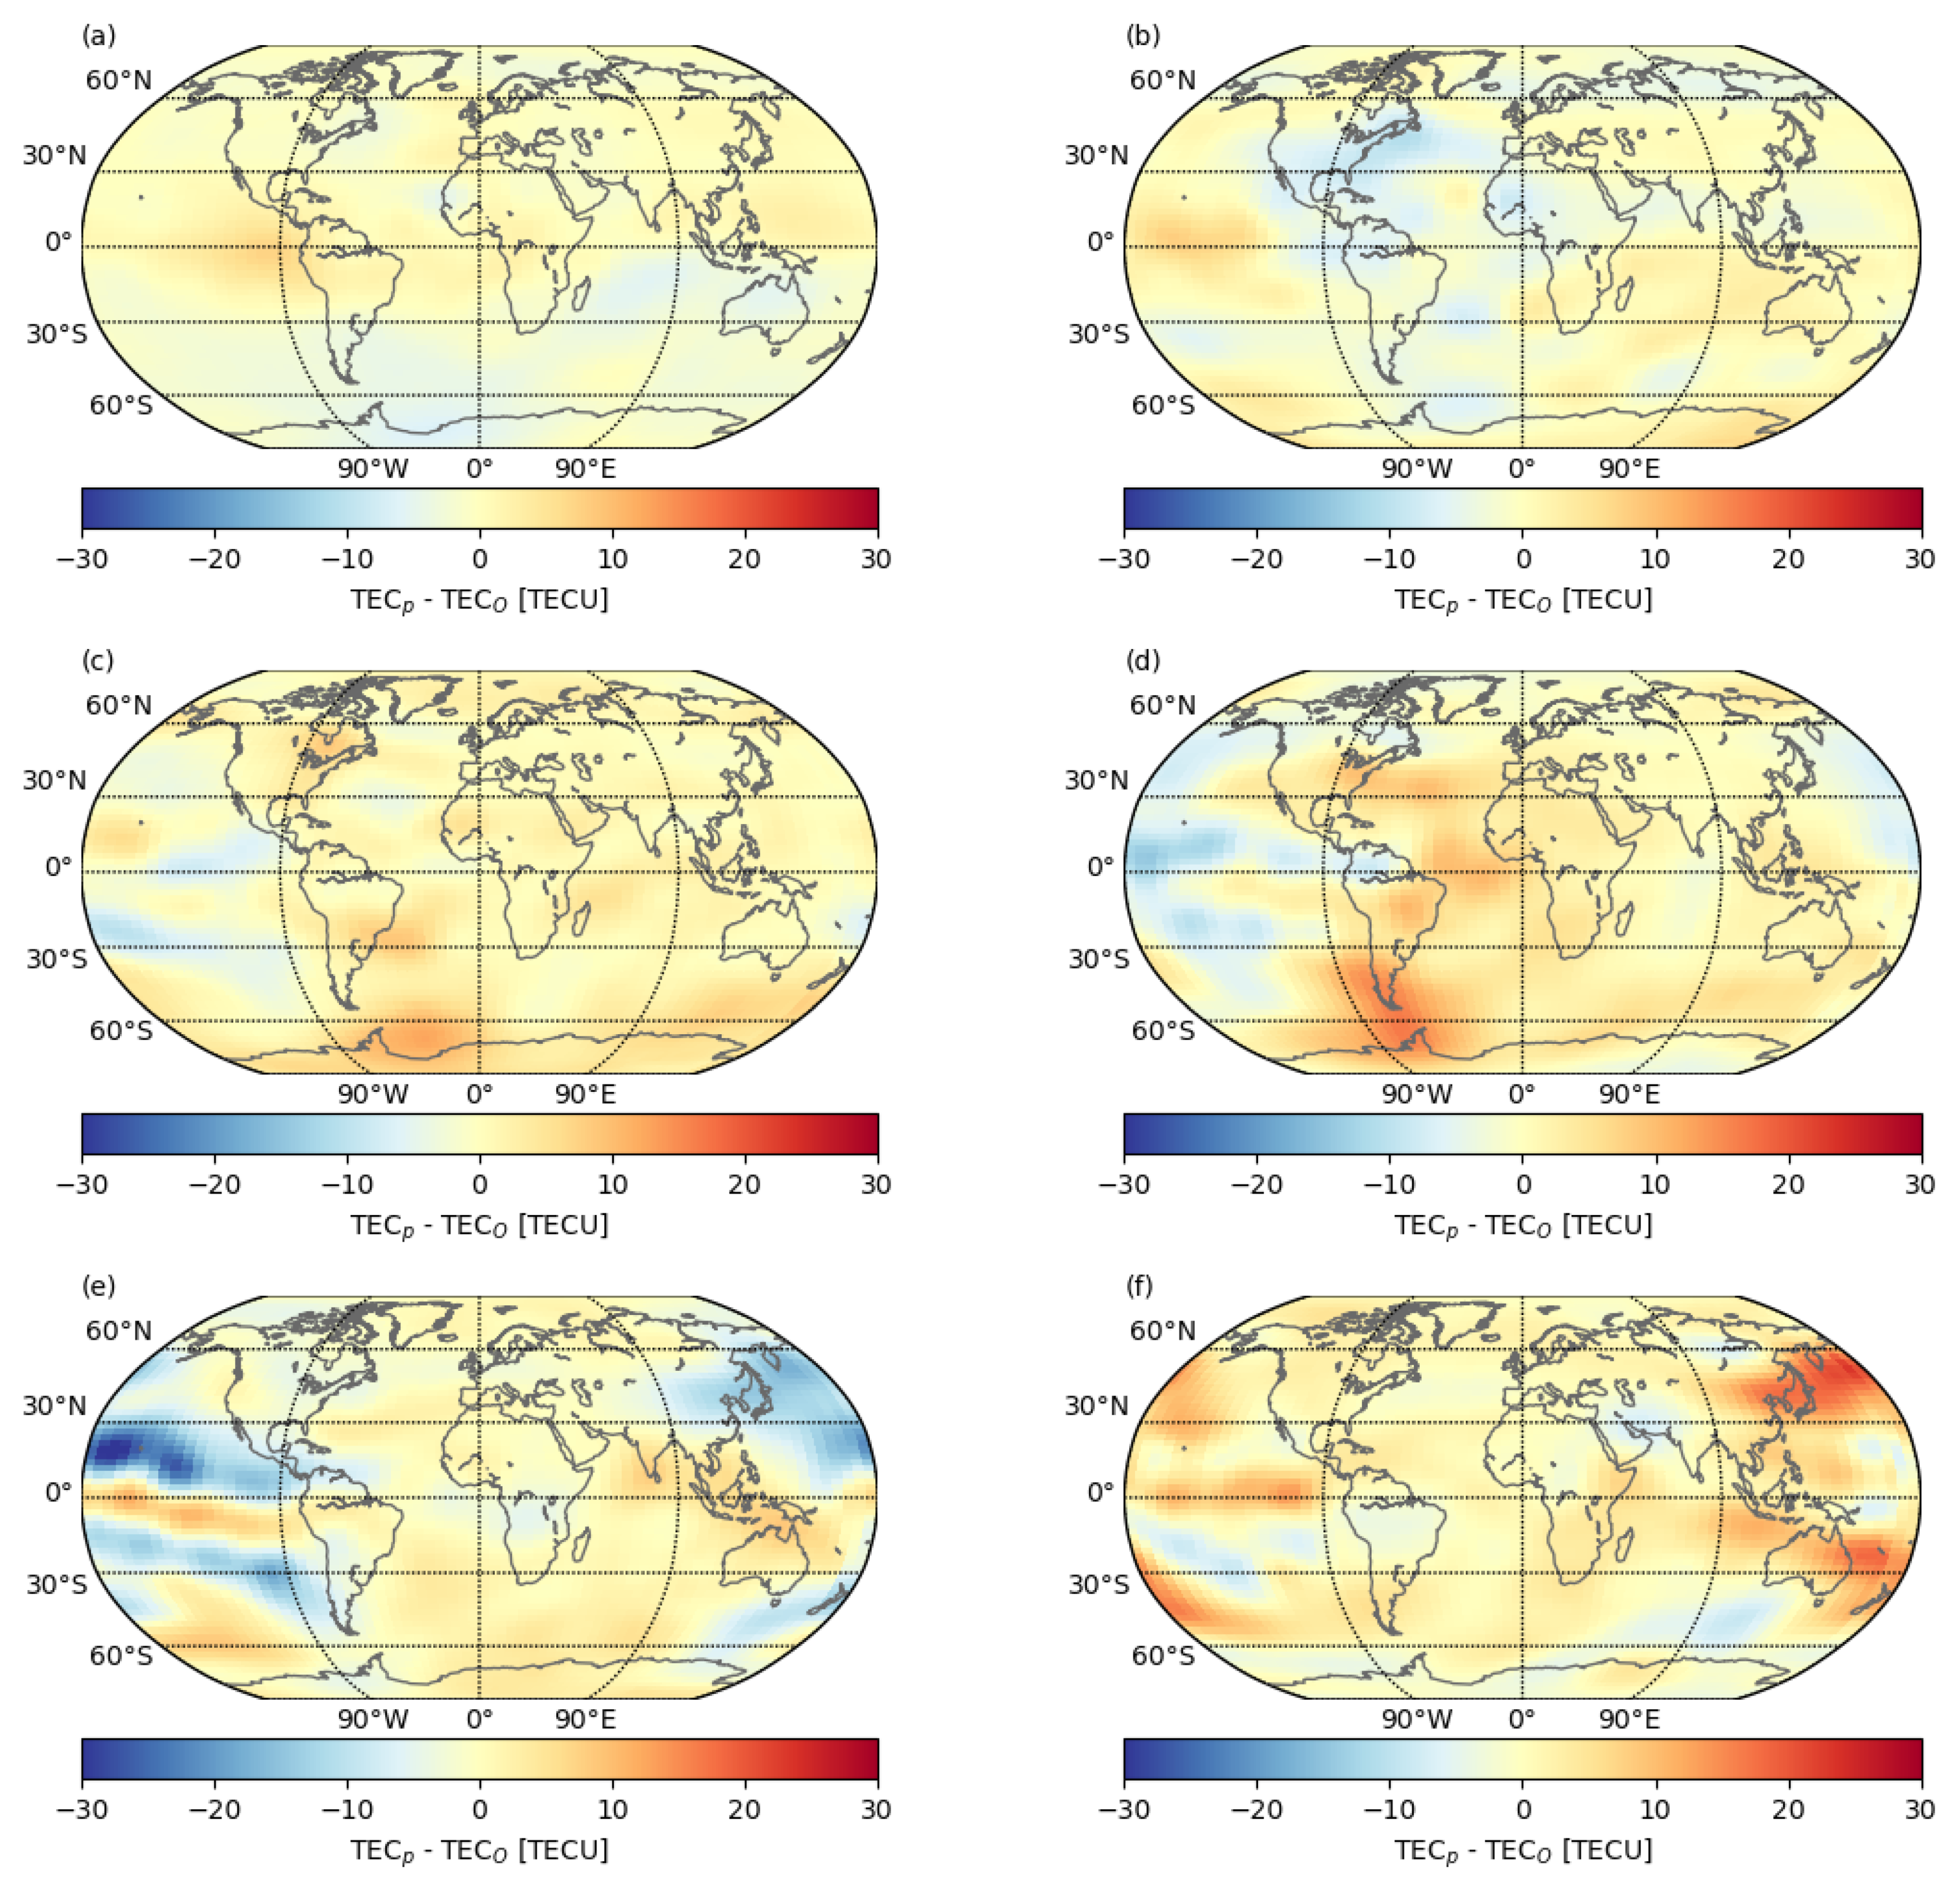
The difference of observed and predicted TEC in Figure 12d shows the discussed, inaccurate features. The TEC enhancement above and below the Equator on Earth’s day side, as well as the high latitudes in the Northern hemisphere are underestimated by the forecast. Nevertheless, the forecast is good considering that the RMSE is 5.53 TECU. These features are even more pronounced in following time steps (during maximum impact). However, the difference decreases during the last time step in Figure 12f. The strength of the occurring event was underestimated by the model. This error can be reduced during periods using the same reference event by applying the observed difference during the last available time step to the future time steps as
fTEC t = fTEC t + fTEC n TEC n , t > n .
Figure 13 shows the adjusted difference maps (based on results in Figure 12) according to Equation (22) using the difference of 3 h before each time step. The spatial variations are not entirely removed, but they are minimized and the RMSE values are better at every time step (e.g., the underestimated TEC above and below the Equator in Figure 12f is compensated in Figure 13f). This improvement obtains better over time and makes especially the short-term predictions (few hours) more accurate. Nevertheless, the initial forecast and the forecasts covering more than 12 h are still dependent on the reliable reconstruction based on reference events.
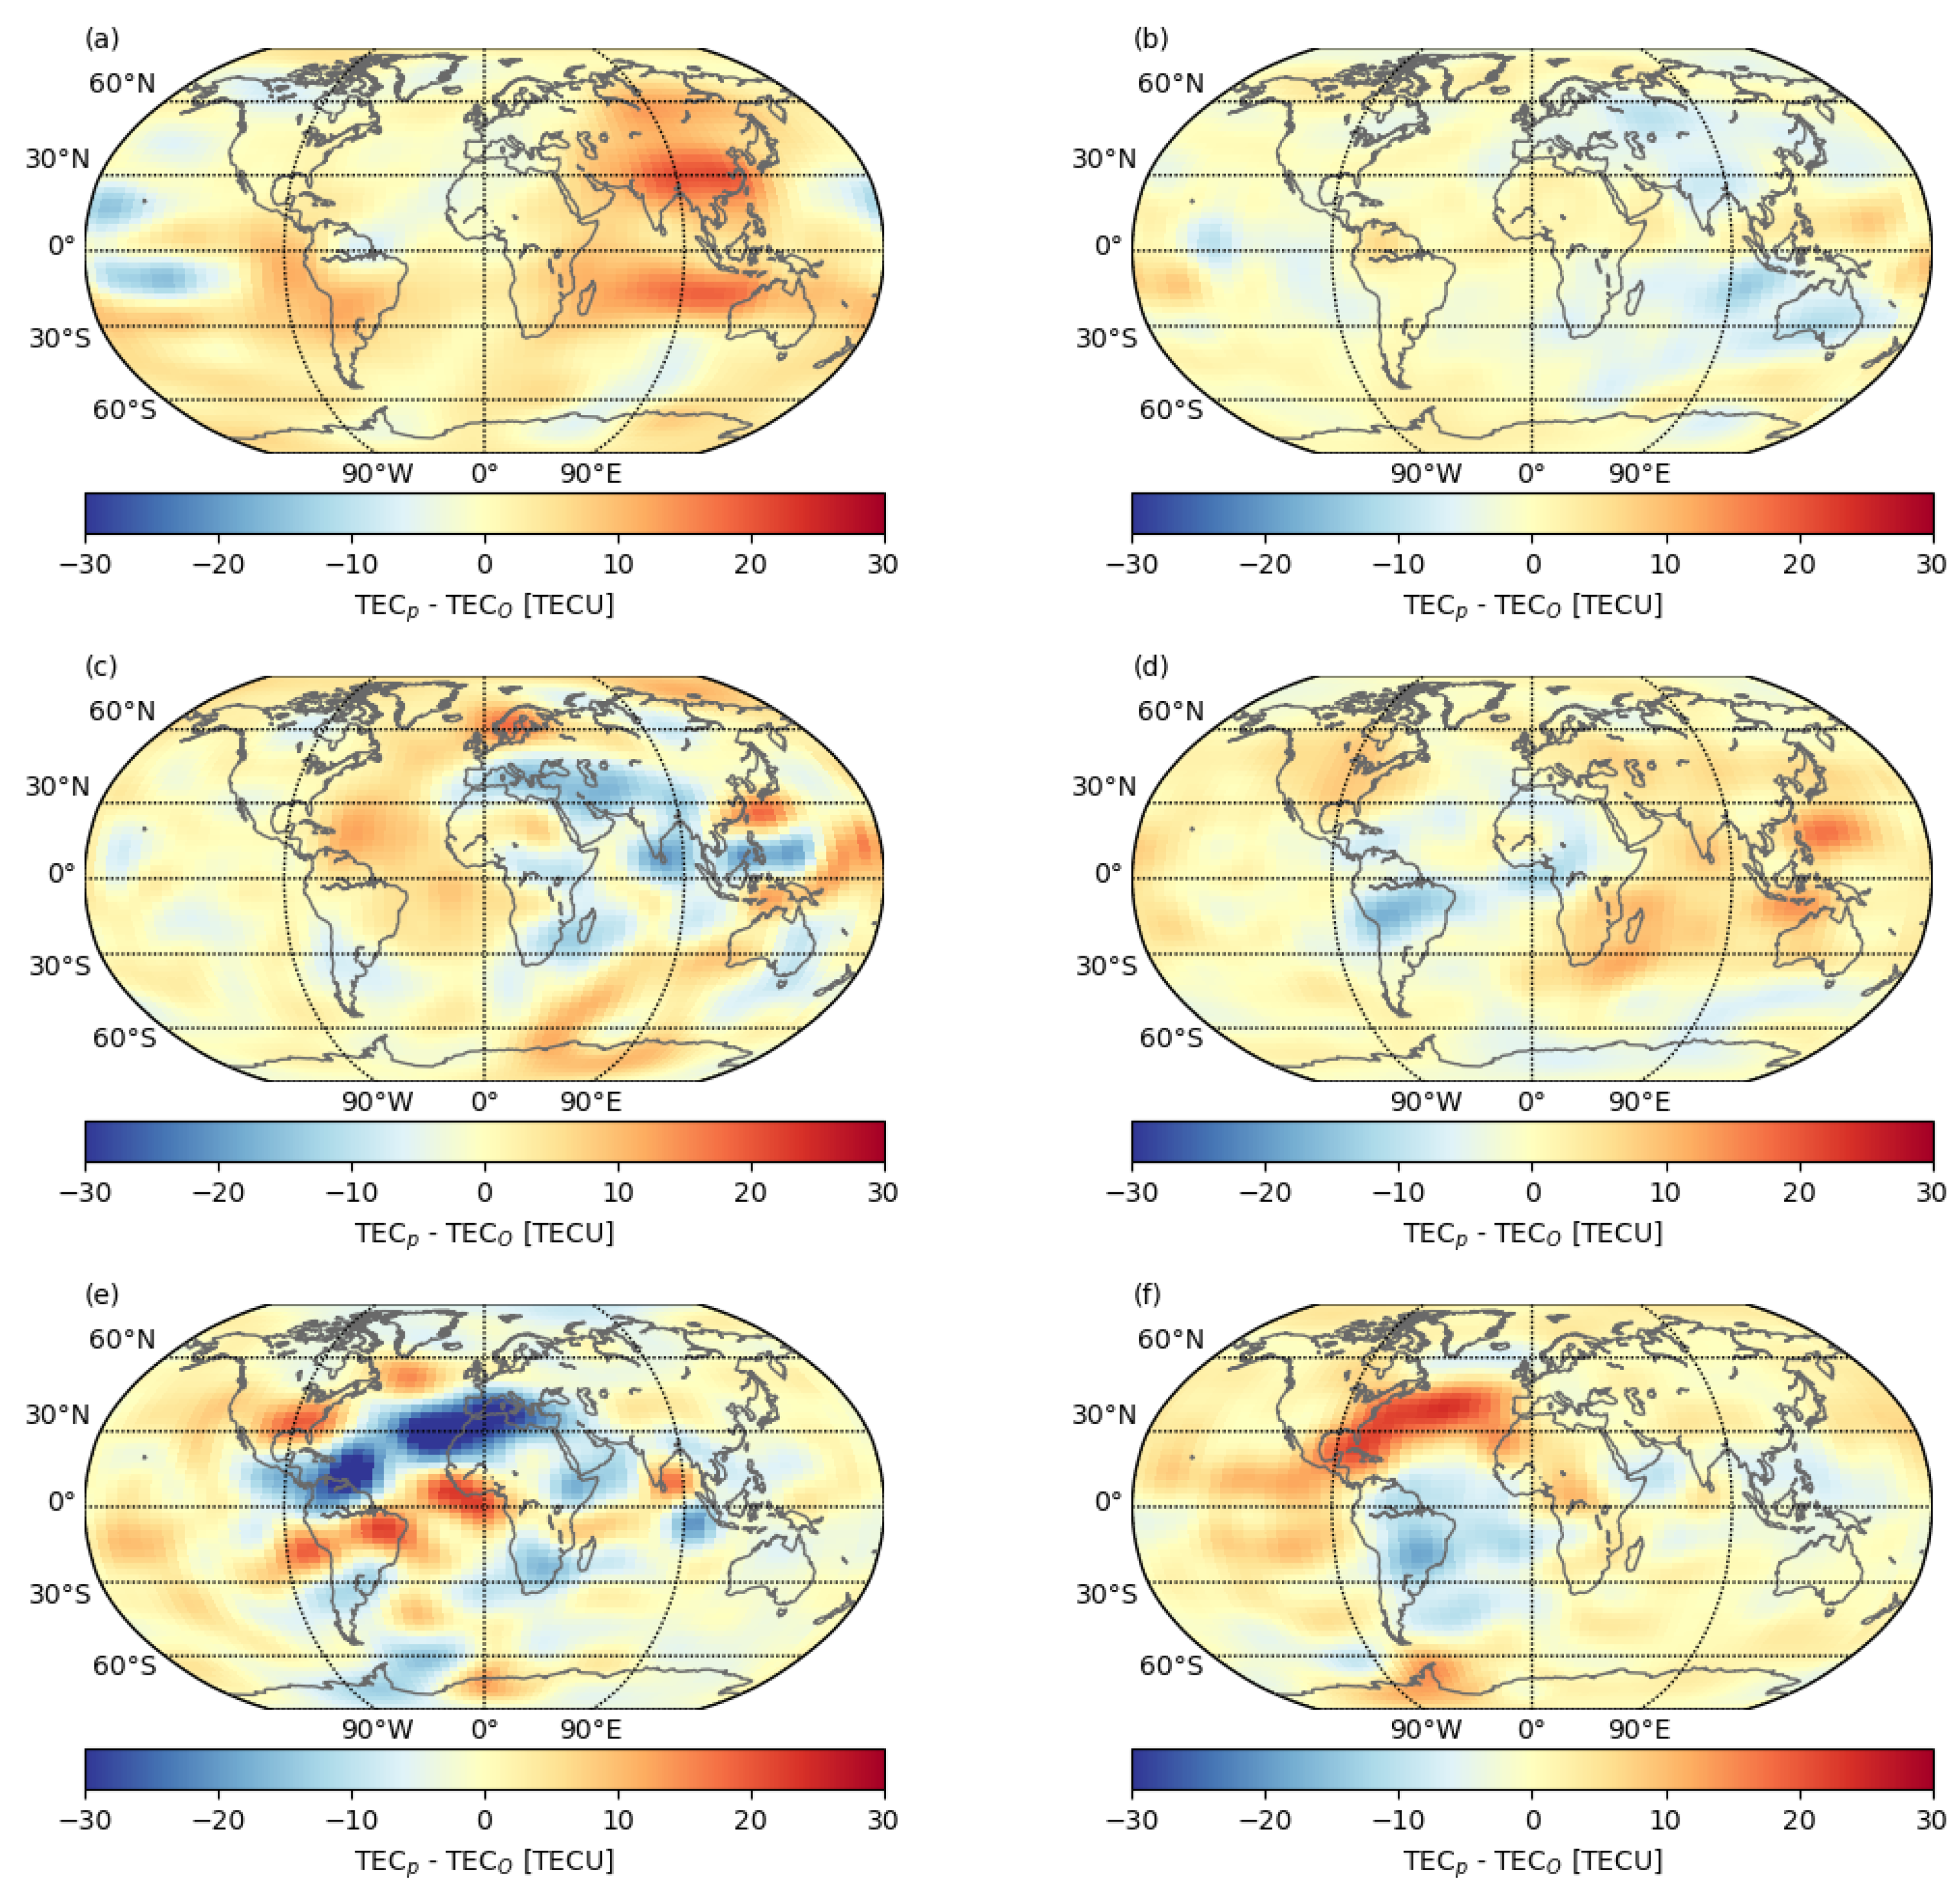
Figure 14 shows the difference maps according to Equation (22) for the St. Patrick’s Day geomagnetic storm at 17 March 2015. These results are calculated based on v p and B z , since n p and p e are not available due to the data gaps of n p in that period (see Figure 2). The critical time period with the strongest variations is again about 15 h after the observed shock (see Figure 14e). The difference is also much stronger than in the first example (see Figure 13e), but still the calculated RMSE values are good (maximum RMSE of 7.49 TECU).
Figure 12, Figure 13 and Figure 14 show that good RMSE values can be achieved, but this parameter alone is not enough to describe the quality of the forecast. Especially the spatial distribution of the TEC variations is a crucial criteria to describe the benefit of the approach. These spatial features have to be categorized and analyzed in detail for the realization of the proposed model.

4. Discussion

The presented ionospheric forecast model is based on the idea to use information from historical solar storm events to provide a detailed spatial and regional forecast of expected ionospheric disturbances. In respect to the first historical event based empirical model, developed within the AFFECTS project [12], several aspects have been added in the presented model in order to significantly enhance such forecast. The area of the predictions was extended from maps of the European region to global maps, which requires a more comprehensive evaluation of the results. Further, the proposed model is based largely on the analysis of solar wind data and is not using geomagnetic indices as the implemented model as part of AFFECTS. However, this may be added again in the future to make the forecast more accurate as solar storms progress. The most crucial difference is in the methods applied in both approaches. The proposed reconstruction from historical reference events (instead of applying a mean trend) in this study allows to analyze the spatial distribution in much more detail and even the consideration of secondary shocks and their respective impacts can be covered. The proposed corrections based on observed TEC during an event (see Figure 12 and Figure 13) may be applied to geomagnetic data as well. Thus, the proposed procedure would match the three data sets (solar wind data, geomagnetic indices, and TEC maps) continuously to reconstruct the best-fitting event overall.
The calculated RMSE in Figure 13 and Figure 14 have mean values of 3.90 and 5.21 TECU (maximum values of 5.57 and 7.49 TECU), which corresponds to an ionospheric range error (L1 band) of 0.63 and 0.84 m (0.90 and 1.21 m). These error levels are acceptable for most users and are very promising results for the strong storm conditions examined. In addition, even the strongest observed differences of approximately 30 TECU (ionospheric range error of 4.86 m) are a considerable improvement in respect to a climatological forecast.
The operational implementation of the model will update continuously during solar storm forecasts and provide the most recent calculation time (e.g., during the change of the selected reference event). During such an update, the forecast is calculated again for the whole period (covering already passed time steps). Thus, a consistent forecast is provided in real-time. The stability and reliability of these forecasts can be estimated using the quality of the event selection and number of occurred changes (see impact on historical events in Figure 4), but a measure of the overall accuracy of the forecast must also be defined for an operational service. The calculated RMSE (see Figure 12, Figure 13 and Figure 14) is also considered as a performance parameter for the accuracy of continued forecasts.

5. Conclusions and Outlook

The TEC forecast model presented in this study does not attempt to describe both quiet and storm conditions, but can be operated on top of a climatological TEC forecast allowing much more detailed predictions of the temporal and spatial storm impact on the ionosphere. The model is activated with solar wind conditions during times of solar activity when ionospheric disturbances are expected. The model selects from a large data base of ionospheric storms at each time step the most appropriate historical event and can significantly limit the predictable variations. The accuracy and precision of the model is, therefore, given by the TEC response to geomagnetic activity driven by past ICME and CIR events.
The detection of such events is implemented with a set of thresholds (applied to solar wind and IMF measurements) and the model forecast is triggered according to the pre-defined threat levels (see Figure 2). In the proposed approach, the selection of fitting reference events is realized using a nearest neighbor approach that is executed in different configurations and continuously updated based on the measurements. The continuous evaluation of the actual event with the pool of available reference events with each other is performed for these configurations (see Figure 4 and Figure 7) and moderate to good as well as weak correlations are retrieved for Kp and GTEC (see Figure 5), respectively. The correlation of Kp mainly confirms the event selection results, whereas GTEC results are more difficult to interpret since these values combine all the spatial variations of TEC (including negative and positive responses).
The presented example forecast of a reference event shows how the spatial distribution of TEC is reconstructed (see Figure 11). Although the general variations are described in both hemispheres, there are significant differences especially in the transition regions between high and low TEC values. This particularly affects the equatorial region, for which additional improvements need to be implemented in the future (e.g., TEC distribution along the geomagnetic Equator). Nevertheless, the difference map in Figure 13 and Figure 14 present very promising results.
The introduced modeling approach aims for long time predictions (more than 12 h) of ionospheric disturbances due to solar storms. This is important, since long-term predictions of regional and spatial ionospheric disturbances are crucial for users of satellite based navigation, communication, and remote sensing services. The inclusion of the impact of solar storms on the ionosphere based on real-time data has not yet been satisfactorily completed in existing empirical and physical ionosphere forecast models. The forecast model presented here compares all available historical storm information to predict the most probable impact of future solar storm. In addition, the model is continuously improving by increasing its historical event data base with every upcoming solar storm.
In the future, the solar wind monitoring will be extended by the option of analyzing relative values in order to detect ICME or CIR during periods of strong solar wind activity. Both the current and planned approach will use an optimized setup of thresholds for the last two solar cycles and will be operated in parallel as part of the model. In addition, the filtering in the model (see Equation (17)) will be adjusted, since the existing solution does not reflect the value range of the initial TEC maps. An appropriate scaling or a different filtering method will solve this problem.
The main part of the further analysis will be the comprehensive evaluation of the TEC response during each reference event. The results of this analysis will be used to decide whether the proposed method (nearest neighbor) satisfies the requirements or whether certain selection criteria need to be added (e.g., season). In addition to the spatial distribution, the temporal evolution of the reference events also has a crucial role, which is why the comparison will also be performed covering all time steps (24 h time window). Based on this evaluation, further changes will be applied and sensitivity as well as stability of the model will be set accordingly.
In the future, additions to the model that incorporate further data are of main focus. These additions to the model would progressively improve the forecast with each time step and be more independent of the observed solar wind conditions. Each selection based on one of the measurements (solar wind measurements including IMF data, geomagnetic indices and global TEC maps) could be weighted according to the passed time and attributed importance for the forecast. For this, however, these data must be available with sufficient time in advance.
Longer lead times for the forecast may be achieved by analyzing further in situ measurements, such as considering the velocity and acceleration of CME calculated based on images from Large Angle and Spectrometric Coronagraph on-board the Solar and Heliospheric Observatory [71]. However, this also requires forecasting climatological changes in the ionosphere for longer time periods and thus increases significantly the complexity of the model and its evaluation. This also has to be considered in regard to the defined scope of the model for a real-time service.
In addition, different methods for assigning historical storm events may be analyzed to implement approaches that achieve better accuracy and efficiency than the current implementation. Furthermore, solar storms occurring in the future will be integrated into the data base granting a continuous improvement of the forecast capabilities.

Author Contributions

Conceptualization, E.S. and J.B.; methodology, E.S. and J.B.; software, E.S.; validation, E.S.; formal analysis, E.S.; investigation, E.S. and J.B.; writing—original draft preparation, E.S.; visualization, E.S. All authors have read and agreed to the published version of the manuscript.

Funding

This research received no external funding.

Institutional Review Board Statement

Not applicable.

Informed Consent Statement

Not applicable.

Data Availability Statement

Publicly available datasets were analyzed in this study. ACE MAG and ACE SWEPAM data were obtained from the NASA ASC interface at http://www.srl.caltech.edu/ACE/ASC/level2/index.html (accessed on 16 August 2021). TEC maps were obtained from the NASA CDDIS interface at https://cddis.nasa.gov/archive/gnss/products/ionex/ (accessed on 16 August 2021). Definitive Kp index data were obtained from the GFZ Potsdam interface at https://www.gfz-potsdam.de/kp-index/ (accessed on 16 August 2021). The Dst index data were obtained from the WDC Kyoto interface at http://wdc.kugi.kyoto-u.ac.jp/dstdir/ (accessed on 16 August 2021).

Acknowledgments

We thank the ACE MAG and SWEPAM instrument team and the ACE Science Center for providing the ACE data, NASA CDDIS for providing TEC maps, GFZ Potsdam for providing Kp index data and WDC Kyoto for providing Dst index data.

Conflicts of Interest

The authors declare no conflict of interest.

References

  1. Milan, S.E.; Clausen, L.B.N.; Coxon, J.C.; Carter, J.A.; Walach, M.T.; Laundal, K.; Østgaard, N.; Tenfjord, P.; Reistad, J.; Snekvik, K.; et al. Overview of Solar Wind-Magnetosphere-Ionosphere-Atmosphere Coupling and the Generation of Magnetospheric Currents. Space Sci. Rev. 2017, 206, 547–573. [Google Scholar] [CrossRef]
  2. Borovsky, J.E.; Denton, M.H. Differences between CME-driven storms and CIR-driven storms. J. Geophys. Res. 2006, 111. [Google Scholar] [CrossRef] [Green Version]
  3. Denton, M.H.; Borovsky, J.E.; Skoug, R.M.; Thomsen, M.F.; Lavraud, B.; Henderson, M.G.; McPherron, R.L.; Zhang, J.C.; Liemohn, M.W. Geomagnetic storms driven by ICME- and CIR-dominated solar wind. J. Geophys. Res. 2006, 111. [Google Scholar] [CrossRef] [Green Version]
  4. Turner, N.E.; Cramer, W.D.; Earles, S.K.; Emery, B.A. Geoefficiency and energy partitioning in CIR-driven and CME-driven storms. J. Atmos. Sol.-Terr. Phys. 2009, 71, 1023–1031. [Google Scholar] [CrossRef]
  5. Yang, N.; Le, H.; Liu, L. Statistical analysis of the mid-latitude trough position during different categories of magnetic storms and different storm intensities. Earth Planets Space 2016, 68, 171–181. [Google Scholar] [CrossRef] [Green Version]
  6. Ogawa, Y.; Seki, K.; Keika, K.; Ebihara, Y. Characteristics of CME- and CIR-Driven Ion Upflows in the Polar Ionosphere. J. Geophys. Res. Space Phys. 2019, 124, 3637–3649. [Google Scholar] [CrossRef] [Green Version]
  7. Dugassa, T.; Habarulema, J.B.; Nigussie, M. Equatorial and low-latitude ionospheric TEC response to CIR-driven geomagnetic storms at different longitude sectors. Adv. Space Res. 2020, 66, 1947–1966. [Google Scholar] [CrossRef]
  8. Baker, D.N.; Daly, E.; Daglis, I.; Kappenman, J.G.; Panasyuk, M. Effects of Space Weather on Technology Infrastructure. Space Weather 2004, 2. [Google Scholar] [CrossRef]
  9. Balan, N.; Skoug, R.; Ram, S.T.; Rajesh, P.K.; Shiokawa, K.; Otsuka, Y.; Batista, I.S.; Ebihara, Y.; Nakamura, T. CME front and severe space weather. J. Geophys. Res. Space Phys. 2014, 119, 10041–10058. [Google Scholar] [CrossRef]
  10. Eastwood, J.P.; Biffis, E.; Hapgood, M.A.; Green, L.; Bisi, M.M.; Bentley, R.D.; Wicks, R.; McKinnell, L.A.; Gibbs, M.; Burnett, C. The Economic Impact of Space Weather: Where Do We Stand? Risk Anal. 2017, 37, 206–218. [Google Scholar] [CrossRef]
  11. Berdermann, J.; Borries, C.; Hoque, M.M.; Jakowski, N. Forecast of Total Electron Content over Europe for Disturbed Ionospheric Conditions. Available online: https://elib.dlr.de/80067/ (accessed on 14 December 2021).
  12. Borries, C.; Berdermann, J.; Jakowski, N.; Hoque, M.; Bothmer, V. Preparation of an advanced TEC forecast based on the statistical analysis of historical ionospheric storms. In Proceedings of the 4th International Galileo Science Colloquium, Prague, Czech Republic, 4–6 December 2013. [Google Scholar]
  13. Borries, C.; Berdermann, J.; Jakowski, N.; Wilken, V. Ionospheric storms-A challenge for empirical forecast of the total electron content. J. Geophys. Res. Space Phys. 2015, 120, 3175–3186. [Google Scholar] [CrossRef]
  14. Hoque, M.M.; Jakowski, N. A new global empirical NmF2 model for operational use in radio systems. Radio Sci. 2011, 46. [Google Scholar] [CrossRef]
  15. Jakowski, N.; Hoque, M.M.; Mayer, C. A new global TEC model for estimating transionospheric radio wave propagation errors. J. Geod. 2011, 85, 965–974. [Google Scholar] [CrossRef]
  16. Hoque, M.M.; Jakowski, N. A new global model for the ionospheric F2 peak height for radio wave propagation. Ann. Geophys. 2012, 30, 797–809. [Google Scholar] [CrossRef] [Green Version]
  17. Schrijver, C.J.; Kauristie, K.; Aylward, A.D.; Denardini, C.M.; Gibson, S.E.; Glover, A.; Gopalswamy, N.; Grande, M.; Hapgood, M.; Heynderickx, D.; et al. Understanding space weather to shield society: A global road map for 2015–2025 commissioned by COSPAR and ILWS. Adv. Space Res. 2015, 55, 2745–2807. [Google Scholar] [CrossRef]
  18. Heelis, R.A.; Maute, A. Challenges to Understanding the Earth’s Ionosphere and Thermosphere. J. Geophys. Res. Space Phys. 2020, 125. [Google Scholar] [CrossRef]
  19. Licata, R.J.; Tobiska, W.K.; Mehta, P.M. Benchmarking Forecasting Models for Space Weather Drivers. Space Weather 2020, 18, e2020SW002496. [Google Scholar] [CrossRef]
  20. Tsagouri, I.; Belehaki, A. A new empirical model of middle latitude ionospheric response for space weather applications. Adv. Space Res. 2006, 37, 420–425. [Google Scholar] [CrossRef]
  21. Tsagouri, I.; Belehaki, A. An upgrade of the solar-wind-driven empirical model for the middle latitude ionospheric storm-time response. J. Atmos. Sol.-Terr. Phys. 2008, 70, 2061–2076. [Google Scholar] [CrossRef]
  22. Tsagouri, I.; Belehaki, A. Ionospheric forecasts for the European region for space weather applications. J. Space Weather Space Clim. 2015, 5, A9. [Google Scholar] [CrossRef] [Green Version]
  23. Cesaroni, C.; Spogli, L.; Aragon-Angel, A.; Fiocca, M.; Dear, V.; Franceschi, G.D.; Romano, V. Neural network based model for global Total Electron Content forecasting. J. Space Weather Space Clim. 2020, 10, 11. [Google Scholar] [CrossRef]
  24. Liu, L.; Zou, S.; Yao, Y.; Wang, Z. Forecasting Global Ionospheric TEC Using Deep Learning Approach. Space Weather 2020, 18. [Google Scholar] [CrossRef]
  25. Astafyeva, E.; Zakharenkova, I.; Förster, M. Ionospheric response to the 2015 St. Patrick’s Day storm: A global multi-instrumental overview. J. Geophys. Res. Space Phys. 2015, 120, 9023–9037. [Google Scholar] [CrossRef] [Green Version]
  26. Wu, C.C.; Liou, K.; Lepping, R.P.; Hutting, L.; Plunkett, S.; Howard, R.A.; Socker, D. The first super geomagnetic storm of solar cycle 24: “The St. Patrick’s day event (17 March 2015) ”. Earth Planets Space 2016, 68, 151. [Google Scholar] [CrossRef] [Green Version]
  27. Krypiak-Gregorczyk, A. Ionosphere response to three extreme events occurring near spring equinox in 2012, 2013 and 2015, observed by regional GNSS-TEC model. J. Geod. 2018, 93, 931–951. [Google Scholar] [CrossRef] [Green Version]
  28. Kumar, S.; Kumar, V.V. Ionospheric Response to the St. Patrick’s Day Space Weather Events in March 2012, 2013, and 2015 at Southern Low and Middle Latitudes. J. Geophys. Res. Space Phys. 2019, 124, 584–602. [Google Scholar] [CrossRef] [Green Version]
  29. Stone, E.C.; Frandsen, A.M.; Mewaldt, R.A.; Christian, E.R.; Margolies, D.; Ormes, J.F.; Snow, F. The Advanced Composition Explorer. Space Sci. Rev. 1998, 86, 1–22. [Google Scholar] [CrossRef]
  30. Zwickl, R.D.; Doggett, K.A.; Sahm, S.; Barrett, W.P.; Grubb, R.N.; Detman, T.R.; Raben, V.J.; Smith, C.W.; Riley, P.; Gold, R.E.; et al. The NOAA Real-Time Solar-Wind (RTSW) System Using Ace Data. In The Advanced Composition Explorer Mission; Springer: Dordrecht, The Netherlands, 1998; pp. 633–648. [Google Scholar] [CrossRef]
  31. McComas, D.J.; Bame, S.J.; Barker, P.; Feldman, W.C.; Phillips, J.L.; Riley, P.; Griffee, J.W. Solar Wind Electron Proton Alpha Monitor (SWEPAM) for the Advanced Composition Explorer. In The Advanced Composition Explorer Mission; Springer: Dordrecht, The Netherlands, 1998; pp. 563–612. [Google Scholar] [CrossRef]
  32. Burt, J.; Smith, B. Deep Space Climate Observatory: The DSCOVR mission. In Proceedings of the 2012 IEEE Aerospace Conference, Big Sky, MT, USA, 3–10 March 2012. [Google Scholar] [CrossRef]
  33. Garrard, T.L.; Davis, A.J.; Hammond, J.S.; Sears, S.R. The ACE Science Center. Space Sci. Rev. 1998, 86, 649–663. [Google Scholar] [CrossRef]
  34. ASC. ACE Level 2 (Verified) Data. 2021. Available online: http://www.srl.caltech.edu/ACE/ASC/level2/index.html (accessed on 16 August 2021).
  35. NCEI. DSCOVR Space Weather Data Portal. 2021. Available online: https://www.ngdc.noaa.gov/dscovr/portal/index.html (accessed on 16 August 2021).
  36. Gonzalez, W.D.; de Gonzalez, A.L.C.; Lago, A.D.; Tsurutani, B.T.; Arballo, J.K.; Lakhina, G.K.; Buti, B.; Ho, C.M.; Wu, S.T. Magnetic cloud field intensities and solar wind velocities. Geophys. Res. Lett. 1998, 25, 963–966. [Google Scholar] [CrossRef] [Green Version]
  37. Verbanac, G.; Živković, S.; Vršnak, B.; Bandić, M.; Hojsak, T. Comparison of geoeffectiveness of coronal mass ejections and corotating interaction regions. Astron. Astrophys. 2013, 558, A85. [Google Scholar] [CrossRef] [Green Version]
  38. Adachi, H.; Sakurai, T.; Marubashi, K. Geomagnetic effects of high-density plasma with southward magnetic field in the interplanetary coronal mass ejection observed on 2–3 May 1998. Earth Planets Space 2006, 58, 315–322. [Google Scholar] [CrossRef] [Green Version]
  39. Mayaud, P.N. Derivation, Meaning, and Use of Geomagnetic Indices; American Geophysical Union: Washington, DC, USA, 1980. [Google Scholar] [CrossRef]
  40. Sugiura, M.; Kamei, T. Equatorial Dst index 1957–1986. In IAGA Bull. 40; Berthelier, A., Menvielle, M., Eds.; International Service of Geomagnetic Indices: Saint-Maur-des-Fosses, France, 1991. [Google Scholar]
  41. Nose, M.; Sugiura, M.; Kamei, T.; Iyemori, T.; Koyama, Y. Dst Index. 2015. Available online: https://isds-datadoi.nict.go.jp/wds/10.17593__14515-74000.html (accessed on 16 August 2021). [CrossRef]
  42. WDC. Geomagnetic Equatorial Dst Index. 2021. Available online: http://wdc.kugi.kyoto-u.ac.jp/dstdir/ (accessed on 16 August 2021).
  43. Valdivia, J.A.; Sharma, A.S.; Papadopoulos, K. Prediction of magnetic storms by nonlinear models. Geophys. Res. Lett. 1996, 23, 2899–2902. [Google Scholar] [CrossRef] [Green Version]
  44. Wu, J.G.; Lundstedt, H. Prediction of geomagnetic storms from solar wind data using Elman Recurrent Neural Networks. Geophys. Res. Lett. 1996, 23, 319–322. [Google Scholar] [CrossRef]
  45. O’Brien, T.P.; McPherron, R.L. Forecasting the ring current index Dst in real time. J. Atmos. Sol.-Terr. Phys. 2000, 62, 1295–1299. [Google Scholar] [CrossRef]
  46. Temerin, M.; Li, X. A new model for the prediction of Dst on the basis of the solar wind. J. Geophys. Res. Space Phys. 2002, 107, SMP 31-1–SMP 31-8. [Google Scholar] [CrossRef]
  47. Kim, R.S.; Moon, Y.J.; Gopalswamy, N.; Park, Y.D.; Kim, Y.H. Two-step forecast of geomagnetic storm using coronal mass ejection and solar wind condition. Space Weather 2014, 12, 246–256. [Google Scholar] [CrossRef] [Green Version]
  48. Bartels, J. The standardized index Ks and the planetary index Kp. IATME Bulletin 12b. 1949. Available online: http://isgi.unistra.fr/IAGABulletins/IATME_Bulletin_12b_Herbert_Weisman_Bartels_1949.pdf (accessed on 14 December 2021).
  49. Bartels, J.; Veldkamp, J. International data on magnetic disturbances, fourth quarter, 1953. J. Geophys. Res. 1954, 59, 297–302. [Google Scholar] [CrossRef]
  50. Chambodut, A.; Marchaudon, A.; Menvielle, M.; Mazouz, F.E.L.; Lathuillére, C. The K -derived MLT sector geomagnetic indices. Geophys. Res. Lett. 2013, 40, 4808–4812. [Google Scholar] [CrossRef] [Green Version]
  51. GFZ. Geomagnetic Kp Index. 2021. Available online: https://www.gfz-potsdam.de/kp-index/ (accessed on 16 August 2021).
  52. Boberg, F.; Wintoft, P.; Lundstedt, H. Real time Kp predictions from solar wind data using neural networks. Phys. Chem. Earth Part C Solar Terr. Planet. Sci. 2000, 25, 275–280. [Google Scholar] [CrossRef]
  53. Wintoft, P.; Wik, M.; Matzka, J.; Shprits, Y. Forecasting Kp from solar wind data: Input parameter study using 3-hour averages and 3-hour range values. J. Space Weather Space Clim. 2017, 7, A29. [Google Scholar] [CrossRef] [Green Version]
  54. Hernández-Pajares, M.; Juan, J.M.; Sanz, J.; Orus, R.; Garcia-Rigo, A.; Feltens, J.; Komjathy, A.; Schaer, S.C.; Krankowski, A. The IGS VTEC maps: A reliable source of ionospheric information since 1998. J. Geod. 2009, 83, 263–275. [Google Scholar] [CrossRef]
  55. NASA. GNSS Atmospheric Products. 2021. Available online: https://cddis.nasa.gov/archive/gnss/products/ionex/ (accessed on 16 August 2021).
  56. Kriegel, M.; Berdermann, J. Ionosphere Monitoring and Prediction Center. In Proceedings of the 2020 European Navigation Conference (ENC), Dresden, Germany, 23–24 November 2020. [Google Scholar] [CrossRef]
  57. Jian, L.; Russell, C.T.; Luhmann, J.G.; Skoug, R.M. Properties of Interplanetary Coronal Mass Ejections at One AU During 1995 - 2004. Sol. Phys. 2006, 239, 393–436. [Google Scholar] [CrossRef] [Green Version]
  58. Jian, L.; Russell, C.T.; Luhmann, J.G.; Skoug, R.M. Properties of Stream Interactions at One AU during 1995–2004. Sol. Phys. 2006, 239, 337–392. [Google Scholar] [CrossRef] [Green Version]
  59. Jian, L.; Russell, C.T.; Luhmann, J.G. Comparing Solar Minimum 23/24 with Historical Solar Wind Records at 1 AU. Sol. Phys. 2011, 274, 321–344. [Google Scholar] [CrossRef] [Green Version]
  60. Pick, L.; Effenberger, F.; Zhelavskaya, I.; Korte, M. A Statistical Classifier for Historical Geomagnetic Storm Drivers Derived Solely From Ground-Based Magnetic Field Measurements. Earth Space Sci. 2019, 6, 2000–2015. [Google Scholar] [CrossRef] [Green Version]
  61. Codrescu, S.M.; Codrescu, M.V.; Fedrizzi, M. An Ensemble Kalman Filter for the Thermosphere-Ionosphere. Space Weather 2018, 16, 57–68. [Google Scholar] [CrossRef]
  62. Kalman, R.E. A New Approach to Linear Filtering and Prediction Problems. J. Basic Eng. 1960, 82, 35–45. [Google Scholar] [CrossRef] [Green Version]
  63. Kalnay, E. Atmospheric Modeling, Data Assimilation and Predictability; Cambridge University Press: Cambridge, UK, 2002. [Google Scholar] [CrossRef]
  64. Evensen, G. Data Assimilation; Springer: Berlin/Heidelberg, Germany, 2009. [Google Scholar] [CrossRef]
  65. Rand, D.; Young, L.S. (Eds.) Dynamical Systems and Turbulence, Warwick 1980; Springer: Berlin/Heidelberg, Germany, 1981. [Google Scholar] [CrossRef]
  66. Hamilton, F.; Berry, T.; Sauer, T. Ensemble Kalman Filtering without a Model. Phys. Rev. X 2016, 6, 011021. [Google Scholar] [CrossRef] [Green Version]
  67. Hamilton, F.; Berry, T.; Sauer, T. Kalman-Takens filtering in the presence of dynamical noise. Eur. Phys. J. Spec. Top. 2017, 226, 3239–3250. [Google Scholar] [CrossRef] [Green Version]
  68. Jankovičovà, D.; Vörös, Z.; Šimkanin, J. The influence of solar wind turbulence on geomagnetic activity. Nonlinear Process. Geophys. 2008, 15, 53–59. [Google Scholar] [CrossRef]
  69. Thomsen, M.F. Why Kp is such a good measure of magnetospheric convection. Space Weather 2004, 2. [Google Scholar] [CrossRef]
  70. Şentürk, E. Statistical Analysis of Storm-time TEC Variation during Ascending and Descending Solar Periods of 24th Solar Cycle. Geomagn. Aeron. 2021, 61, 277–286. [Google Scholar] [CrossRef]
  71. Schwenn, R. Heliospheric 3D structure and CME propagation as seen from SOHO: Recent lessons for space weather predictions. Adv. Space Res. 2000, 26, 43–53. [Google Scholar] [CrossRef]
Figure 1. Reference events are shown from 1998 to 2018. Blue lines mark events that are taken from literature and red lines mark events that are selected based on geomagnetic indices. The black dots mark the number of events each month. A total of 593 events is included.
Atmosphere 12 01684 g001
Figure 2. Proton density n p (a), proton speed v p (b), North-South IMF direction B z (c) and calculated threat levels (d) are shown from 16 March 2015 to 20 March 2015 covering the St. Patrick’s Day geomagnetic storm. The threat levels of n p (dotted line), v p (dash-dotted line), B z (dashed line) and effective pressure p e (solid line) cover the shock, sheath and magnetic cloud of the event.
Atmosphere 12 01684 g002
Figure 3. Proton speed v p (a) and difference d v p between v p and multiple moving averages (b) are shown from 16 March 2015 to 20 March 2015 covering the St. Patrick’s Day geomagnetic storm. The moving averages with windows of 1 d (magenta) and 27 d (red), as well as their mean (blue) are shown with the dotted line.
Atmosphere 12 01684 g003
Figure 4. Quality of the selected reference event (ad) and number of changes (eh) are shown for the forecasts of each reference event (excluding itself from the set of potential candidates) for different configurations of the algorithm (columns). The dots in the plots of the first row mark the quality of each forecast (different colors) during that time step. The dots in the plots of the second row mark the number of changes that occur for each forecast and size of these dots is equivalent to the number of forecasts. The dashed line and the gray area are the corresponding means and standard deviations.
Atmosphere 12 01684 g004
Figure 5. The scatter plots show the correlation of observed and predicted values for dKp (ad) and dGTEC (eh) according to the different configurations of the forecast algorithm (columns). The trend line (red dashed line) and correlation coefficient are shown for each combination.
Atmosphere 12 01684 g005
Figure 6. Correlation of observed and predicted values for Kp (a) and GTEC (b) are shown for different model configurations. The results for the configuration without (solid line) and with (dotted line) applying a maximum function are shown for the model approach based on the last time step (red line) and whole time series (black line).
Atmosphere 12 01684 g006
Figure 7. Proton density n p (ad), proton speed v p (eh), North-South IMF direction B z (il) and effective pressure p e (mp) are shown for the geomagnetic storm during 14 December 2006. The observed (solid black line) and the predicted periods (solid red line; red dots mark starting point of selected reference events) are shown for the different configurations of the forecast algorithm (columns). The overall trend of each selected reference event is shown with the dashed gray line.
Atmosphere 12 01684 g007
Figure 8. dTEC map (a) and filtered dTEC map (b) during the St. Patrick’s Day geomagnetic storm at 17 March 2015 14:00 UTC. The standard deviation σ of the Gaussian filter is arbitrarily set to 3 TECU.
Atmosphere 12 01684 g008
Figure 9. dTEC (black) and Δ TEC (red) during the St. Patrick’s Day geomagnetic storm from 17 March 2015 03:00 UTC to 18 March 2015 03:00 UTC at geographic latitude 52.5 ° N and geographic local time 12 h. Shown are unfiltered values (dashed line) and filtered values (dotted line).
Atmosphere 12 01684 g009
Figure 10. Centered moving average (CMA) TEC map (a) and simple moving average (SMA) TEC map (b) during the St. Patrick’s Day geomagnetic storm at 17 March 2015 14:00 UTC.
Atmosphere 12 01684 g010
Figure 11. Observed (a,c,e) and predicted (b,d,f) maps are shown for dTEC (a,b), Δ TEC (c,d) and TEC (e,f) for the geomagnetic storm during 14 December 2006 at the time step 12 h after the onset 13:00 UTC. The map projection is focused on the day side of Earth at this time.
Atmosphere 12 01684 g011
Figure 12. The difference between observed and predicted TEC for the geomagnetic storm during 14 December 2006 is shown at the time step 3 (a), 6 (b), 9 (c), 12 (d), 15 (e) and 18 (f) h after the onset 13:00 UTC. The corresponding root mean square errors are 2.21, 3.70, 3.76, 5.53, 8.78 and 7.58 TECU.
Atmosphere 12 01684 g012
Figure 13. The difference between observed and predicted TEC (adjusted by applying the difference map of the previous step) for the geomagnetic storm during 14 December 2006 is shown at the time step 3 (a), 6 (b), 9 (c), 12 (d), 15 (e) and 18 (f) h after the onset 13:00 UTC. The corresponding root mean square errors are 2.21, 2.83, 3.46, 4.58, 5.57 and 4.77 TECU.
Atmosphere 12 01684 g013
Figure 14. The difference between observed and predicted TEC (adjusted by applying the difference map of the previous step) for St. Patrick’s Day geomagnetic storm at 17 March 2015 is shown at the time step 3 (a), 6 (b), 9 (c), 12 (d), 15 (e) and 18 (f) h after the onset 3:00 UTC. The corresponding root mean square errors are 5.71, 3.22, 5.47, 4.13, 7.49 and 5.26 TECU.
Atmosphere 12 01684 g014
Table 1. Threshold for moderate (1) and strong (2) events according to solar wind and interplanetary magnetic field parameters.
ParameterThreshold 1Threshold 2
Proton density n p 40 cm 3 60 cm 3
Proton speed v p 800 km·s 1 1000 km·s 1
North-South IMF B z −15 nT−50 nT
Dynamic pressure p d 10 nPa50 nPa
Effective pressure p e 2 nPa3 nPa
Publisher’s Note: MDPI stays neutral with regard to jurisdictional claims in published maps and institutional affiliations.