Article

A Method to Generate Experimental Aerosol with Similar Particle Size Distribution to Atmospheric Aerosol

1
School of Energy and Environmental Engineering, Hebei University of Technology, Tianjin 300401, China
2
Berkeley Education Alliance for Research in Singapore, Singapore 138602, Singapore
3
Tianjin Key Lab of Indoor Air Environmental Quality Control, School of Environmental Science and Engineering, Tianjin University, Tianjin 300072, China
*
Author to whom correspondence should be addressed.
Atmosphere 2021, 12(12), 1669; https://doi.org/10.3390/atmos12121669
Submission received: 10 November 2021 / Revised: 29 November 2021 / Accepted: 10 December 2021 / Published: 12 December 2021

Abstract

:
The SARS-CoV virus spreads in the atmosphere mainly in the form of aerosols. Particle air filters are widely used in indoor heating, ventilation, and air-conditioning (HVAC) systems and filtration equipment to reduce aerosol concentration and improve indoor air quality. Requirements arise to rate filters according to their mass-based filtration efficiency. The size distribution of test aerosol greatly affects the measurement results of mass-based filtration efficiency and dust loading of filters, as well as the calibration of optical instruments for fine-particle (PM2.5) mass concentration measurement. The main objective of this study was to find a new method to generate a chemically nontoxic aerosol with a similar particle size distribution to atmospheric aerosol. We measured the size distribution of aerosols generated by DEHS (di-ethyl-hexyl-sebacate), PSL (poly-styrene latex), olive oil, and 20% sucrose solution with a collision nebulizer in a wide range of 15 nm–20 μm. Individually, none of the solutions generated particles that share a similar size distribution to atmospheric aerosol. We found that the 20% sucrose solution + olive oil mixture solution (Vss:Voo = 1:2) could be used to generate a chemically nontoxic aerosol with similar particle number/volume size distribution to the atmospheric aerosol (t-test, p < 0.05). The differences in the mass-base filtration efficiency measured by the generated aerosol and the atmospheric aerosol were smaller than 2% for MERV 7, 10, 13, and 16 rated filters. The aerosol generated by the new method also performed well in the calibration of optical-principle-based PM2.5 concentration measurement instruments. The average relative difference measured by a tapered element oscillating microbalance (TEOM) and a Dusttrak Model 8530 (calibrated by aerosol generated by the new method) was smaller than 5.8% in the real-situation measurement.

1. Introduction

The wide spreading of the high infections disease, such as Corona Virus Disease 2019 (COVID-19) and Severe Acute Respiratory Syndrome Coronavirus 2 (SARS-CoV), has attracted worldwide attention [1,2,3]. At present, COVID-19 is seriously threatening the health of people [4,5]. Most of the epidemiological evidence indicated that the virus spreads in the atmosphere and indoor air in the form of aerosols [6,7,8,9]. Once the source of infection appears indoors, cross-infection occurs through sneezing or through the ventilation system, etc. [10,11]. Creating a healthy, energy-saving, and comfortable indoor environment is very important to human health [12]. Improving the filtration efficiency of the ventilation system for atmospheric particles is an important part of prevention. In previous studies, particle air filters, and even high-efficiency particle air filters (HEPA), are being used in indoor heating, ventilation, and air-conditioning (HVAC) systems [13,14]; portable air filters [15,16,17] and other indoor filtration equipment to improve indoor air quality. In recent years, concerns about the filtration effectiveness of infectious aerosol particles, especially the indoor fine particles (PM2.5), are increasing [18,19,20,21,22,23,24,25]. Manufacturers also have an interest in testing and classifying air filters according to their capacity to remove PM2.5 [26]. However, in the vast majority of current test standards, HVAC filters were evaluated according to their size-resolved filtration efficiency. American Society of Heating, Refrigerating and Air-Conditioning Engineers (ASHRAE) Standard 52.2 [27] measures the average size-resolved filtration efficiency in three particle size bins (0.3–1, 1–3, and 3–10 µm). The minimum filtration efficiency among the three bins determines the minimum efficiency reporting value (MERV). The KCl solution is suggested to generate experimental aerosol in ASHRAE Standard 52.2 [27]. ISO standard 29463 [28] and Chinese standard GBT 14295 [29] use the resulting size-resolved filtration efficiency data at the most penetrating particle size (MPPS, at ~0.4μm) to classify filters in the particle range of 0.3–10 µm. ISO standard 29463 [28] suggests using particles generated by DEHS (di-ethyl-hexyl-sebacate), PSL (poly-styrene latex), PAO (poly-alpha-olefin), etc., in measurement. ISO 16890 [26] advocates using the measured size-resolved particle filtration efficiency data to calculate the mass-based filtration efficiency for PM1, PM2.5, and PM10. The size-resolved filtration efficiency data are weighted to the standardized and normalized size distribution of the related ambient aerosol fraction. The polydispersity of aerosol is needed to accurately measure the size-resolved filtration efficiency in a wide size range. According to some previous studies [30,31,32], none of the test aerosols (DEHS, PSL, PAO, KCl, A2 dust, and ASHRAE standard dust) recommended by standards can meet this requirement.
Recent investigations indicated that the concentration of PM2.5 has a positive relationship with the spread of COVID-19 [33], and the local mass-based filtration efficiency can be acquired by measuring the PM2.5 mass concentration upstream and downstream of the filters in use [34]. This method can also be used to rate filters for manufacturers. However, the mass-based filtration efficiency is greatly affected by the size distribution of the test aerosol [32]. The size distributions of test aerosols generated by DEHS, PSL, PAO, KCl, etc., are quite different from atmospheric aerosol [30,31,32]. For test aerosols, the aerodynamic size distribution is mainly concentrated around 0.1 μm, and the largest size of particle is less than 0.3 μm [30,31,32]. However, the particle size distribution of atmospheric aerosols is more abundant than test aerosols, and the size distribution is mainly concentrated between 0.5 and 50 μm [32]. Therefore, the use of a generator similar to the composition of the atmospheric aerosols can best reflect the actual filtration effect of filtration equipment during the COVID-19 pandemic. Moreover, some low-temperature materials improve the heat-exchange performance of the hot end of the generator to significantly improve the efficiency of the generator [35]. Therefore, it becomes necessary to find a new method to generate an experimental aerosol with a particle size distribution similar to the atmospheric aerosol that is stable and with controllable concentration.
The same requirement also exists in the dust-loading test of filters. The dust-loading capacity is another important index of filters and is usually tested with ASHRAE test dust (ASHRAE 52.2, 2017). Raynor and Chae [36] measured the dust loading in the laboratory test with ASHRAE dust and in real use. Big differences existed in dust loading in these two different situations. They believed it was caused by the fact that the majority of the mass in the ASHRAE test dust was composed of large particles (>1 μm), while the particles collected in the real situation were much smaller. Waring and Siegel [37] also emphasized the effect of size distribution on dust loading in their modeling study. The size distribution of aerosols also affects the calibration of portable instruments and sensors [38,39], which were widely used to measure PM2.5 mass concentration based on optical principles. Their faster response time, cheaper price, and portability are their advantages over traditional instruments that use gravimetric or oscillating microbalance principles. However, they need to be carefully calibrated to ensure the accuracy of measurement data.
In addition, the health effects of the experimental aerosol also need to be improved. Some chemically nontoxic liquids, such as sugar solution and olive oil, are possible substitutes for generated aerosols. Their chemical characteristics are similar to the main compositions of atmospheric aerosols [40]. In fact, they have already been used to generate experimental aerosols. Harris and Smith [41] tried to use olive oil to seed particles for optical flow measurement. He et al. [42] used particle image velocimetry to measure air movement in a reverse rotation cyclone. Sugar aerosol is used to represent flow movements due to its adequate scattering property and high resolution. However, the size distributions of sugar particles and olive oil particles have not been well studied before.
The goals of this study were to (1) measure the particle size distributions of aerosols generated by DEHS, PSL, olive oil, and sucrose solution, as well as the atmospheric aerosol in a wide size range; (2) try to find a method to generate a chemically nontoxic experimental aerosol with similar particle size distribution to the atmospheric aerosol; and (3) check the performance of aerosol generated by the new method in mass-based filtration efficiency measurement with different levels of filters and instrument calibration.

2. Methodology

2.1. Sampling and Instrumentation

We used a one-jet collision nebulizer (BGI Inc., Waltham, MA, USA) with a flow rate of 2.0 L/min to generate particles. The collision nebulizer is widely applied to generate fine aerosols from a liquid supply [40,43]. Different kinds of solutions were poured into the nebulizer, respectively: DEHS (pure liquid), PSL (microsphere), olive oil, and sucrose solution. Before each test, the nebulizer was totally cleaned. The nebulizer was supplied with HEPA-filtered clean air. A mass flow meter (Alicat Scientific Inc., Tucson, AZ, USA) was used to control and record the flow and pressure of the compressed air. It should be noted that the relative humidity would have a significant effect on the size of ambient particles [14,15], and therefore could be used to adjust the size of generated particles. However, for the sake of unity of contrast and better comparison with previous studies, the generated aerosol was dried by a diffusion dryer (DDU 570, TOPAS, Inc., Dresden, Germany). The generated aerosols did not have direct contact with the drying agent. This was performed so that only a very low percentage of particles would be lost during the drying process.
The dried aerosol was then generated into the air duct and diluted by the clean air. We used a nozzle flow meter to measure the flow of the mixed air. The dilution ratio of the generated aerosol can be measured and calculated. The temperature and relative humidity (RH) of the mixed air was kept at 22.5 ± 0.5 °C and 23.1 ± 2.2% (measurements recorded by a HOBO data logger (UX 100-003, Onset Inc., Bourne, MA, USA)) by a positive temperature coefficient (PTC) heater. The air duct was carefully cleaned with alcohol at least twice to prevent cross-contamination between different experimental cases.
A scanning mobility particle sizer (SMPS) and aerodynamic particle sizer (APS) combination system was used to measure the particle size distribution. The SMPS (AGM 1500, MSP, Inc., Shoreview, MN, USA) was composed of a differential mobility analyzer (DMA) and a condensation particle counter (CPC). It measured particle mobility diameter from 15 to 1000 nm with 24 channels. The APS (3321, TSI, Inc., St. Paul, MN, USA) measured particle aerodynamic size in the range of 0.453–20 μm with 52 channels. The SMPS and APS were calibrated by the manufacturers before the measurement. The sampling intervals of the SMPS and the APS were all set to be 1 min. The particle size distribution in each case was measured for at least 2 h. The data measured in the first 10 min in each case were abandoned to avoid the fluctuation. Only the average particle-size-distribution data are shown in the main text. The schematic diagram of the experimental setup was shown in Figure 1.

2.2. Method to Combine the SMPS and the APS Data

The SMPS and APS combination system is used in many studies to measure a wide range of particle size distributions [44,45,46]. However, the SMPS and the APS have different principles in particle size measurement. The SMPS classifies particles based on their different mobility characteristics in the electrical field. A spherical particle’s electrical mobility size is equal to its physical size [47]. The APS measures the aerodynamic diameter size of particles. The aerodynamic diameter (da) can be calculated from the physical diameter (dp) by using Equation (1) [40]:
  d a = d p ( ρ p ρ 0 χ ) 1 / 2  
where ρ p is the density of particles, kg/m3; ρ 0 is the unit density, 1000 kg/m3; and χ is the dynamic shape factor.
Special attention should be paid when combining the data measured by the SMPS and APS. Khlystov et al. [46] developed a method to combine SMPS and APS data into a single spectrum. However, to use this algorithm, the densities and shape factors of aerosols should be known. Shi et al. [44] found that the APS data had sharp peaks at the lower end of the size spectrum. They believed that this was caused by an instrumental defect. Therefore, they discarded the APS data in the region of overlap in their study. Molgaard et al. [45] removed the data of SMPS size fractions > 487 nm and APS size fractions < 482 nm in their study. The multiple charge particle correction routine problems in the SMPS were reduced by removing larger size channels, and the number of coincidence errors in APS can be reduced by removing smaller size cannels. Our study mainly focused on the comparison of particle size distribution generated by different solutions. A method similar to that reported by Molgaard et al. [45] was used in this study: removing the SMPS size fractions of over 0.813 μm and the APS size fractions of smaller than 0.835 μm. We assumed that the generated particles were spherical in this study.

2.3. Statistical Method

The SPSS (IBM Corp., Armonk, NY, USA) was used to conduct the statistical analysis. The data distribution normality was initially checked by using the Kolmogorov–Smirnov test. The results proved that the particle distributions were all Gaussian distributed; therefore, further analyses were conducted by parametric statistics. We used the Student’s t-test to analyze the differences between two variables. A p-value less than 0.05 was regarded to be statistically significant in this study.

3. Results

3.1. Comparison of Particle Size Distribution of Experimental Aerosols to Atmospheric Aerosol

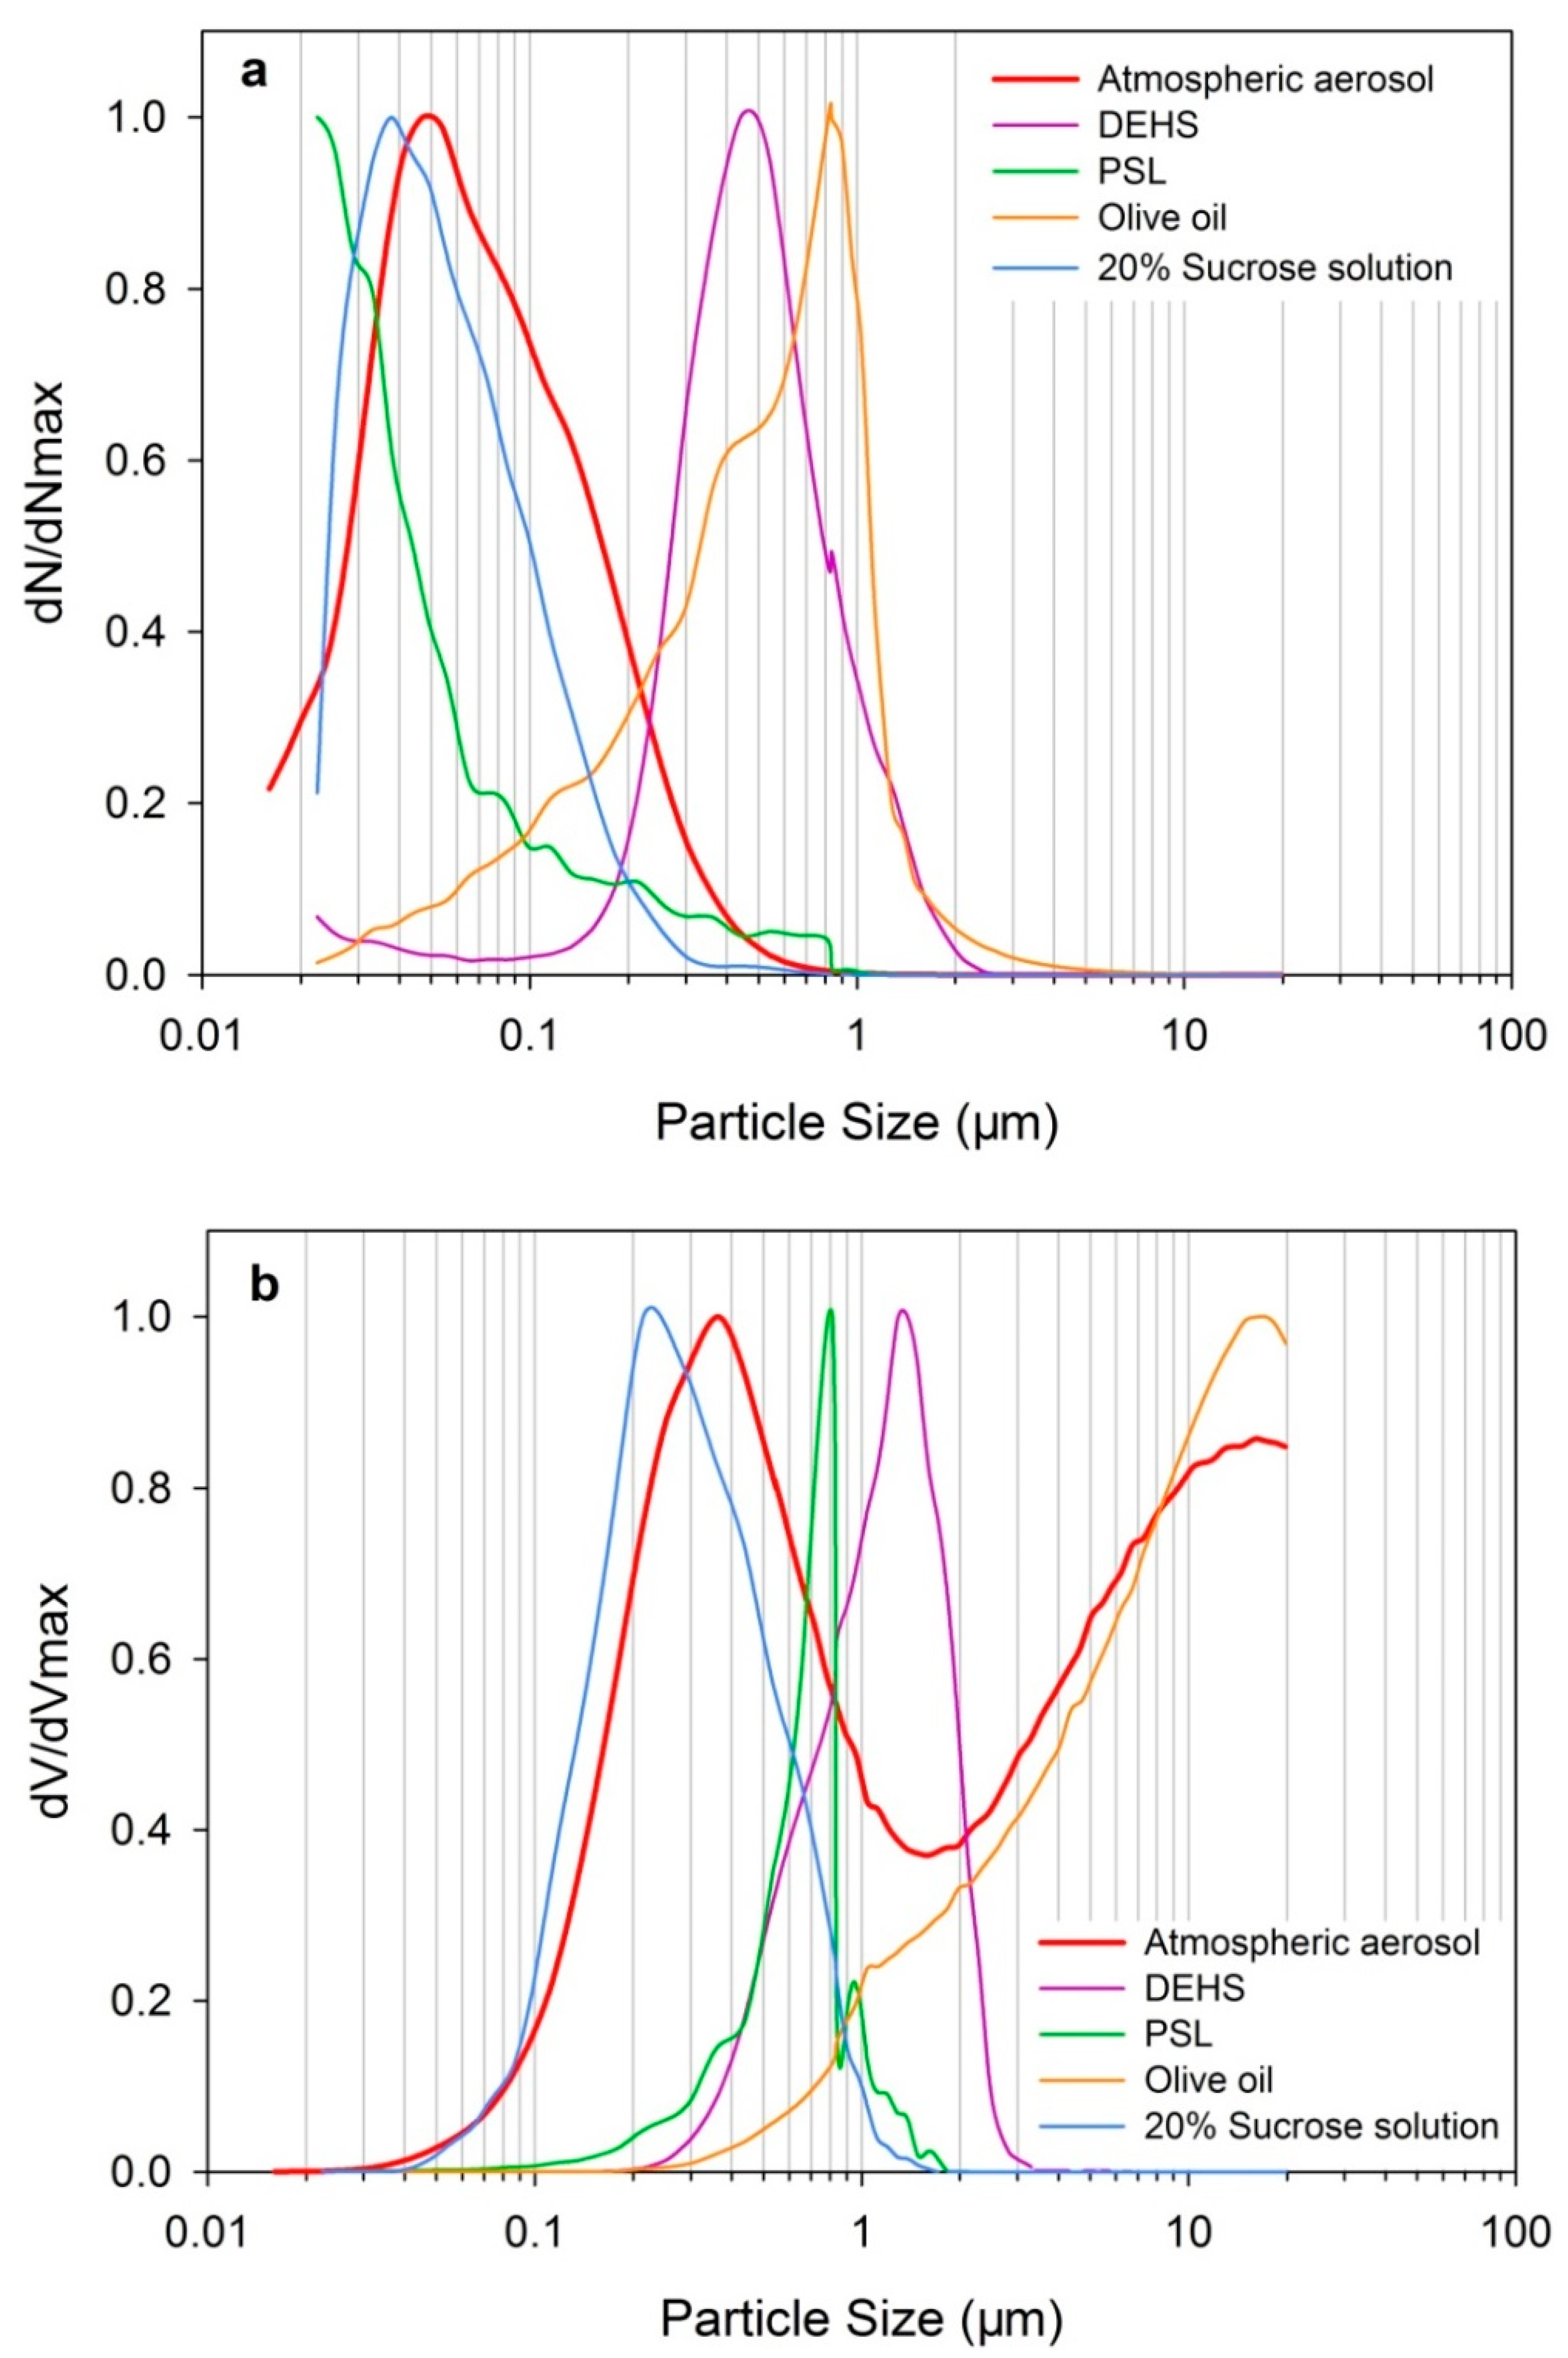
We measured the size distribution of particles generated by the collision nebulizer with DEHS, PSL, olive oil, and sucrose solution (20% mass concentration), respectively. The pressure of compressed air was set to be 0.3 MPa. We also used the SMPS and APS combination system to measure the local atmospheric aerosol size distribution. Supplementary Materials Figure S1 shows the number and volume size distribution of the measured aerosols. The number concentration of different aerosols varied on a large scale; for example, the peak number concentration of aerosols generated by DEHS was about 25 times that of olive oil. In this study, we mainly focused on the comparison of the size distribution of aerosols. Therefore, we only reported the normalized particle size distribution in the main text (Figure 2). Supplementary Materials Table S1 summarized the detailed particle size distribution data for different aerosols. We believe that these data can contribute to the current database of experimental aerosol characteristics.
The lognormal distribution can be used to fit aerosol size distributions from many different sources [48]:
d N i d l o g d p = N 2 π l n σ g e x p [ ( l n d p l n d g ) 2 2 ( l n σ g ) 2 ]
where N is the total number concentration, #/cm3; d p is particle diameter, μm; d g is particle median diameter, μm; and σ g is the geometric standard deviation. The normalized particle size distribution can be completely characterized by the particle median diameter ( d g ) and geometric standard deviation (( σ g ). They can be calculated as follows:
l n d g = 1 N 0   ( l n d p ) d n  
l n σ g = ( 0 ( l n d p l n d g ) 2 d n ) / ( N 1 )
The particle mass/volume size distribution can be calculated by following Equation (5) and assuming that the particles were all spherical in this study.
d V i d l o g d p = d N i d l o g d p π d p 3 6  
Due to the fact that the atmospheric aerosol has many sources [49], its size distribution may have more than one mode [48]. These modes are the following [46]: nucleation (3–30 nm), Aitken (30–130 nm), accumulation (130 nm–1 μm), and coarse (1–10 μm). The size distribution of atmospheric aerosol can be fitted by a sum of lognormal distributions [40,48]. Table 1 summarizes the parameters for the measured aerosol size distributions.
The normalized particle number size distributions of test aerosols are shown in Figure 2a. The peak of the atmospheric aerosol number size distribution occurred in the Aitken mode (at around 47 nm) in this study. This particle peak diameter is a little larger than has been reported in some previous studies conducted in Europe or America; Azimi et al. [50], for example, reported a value of around 20 nm. It is much closer, however, to the size distributions that have been measured in China [51]. Regional differences in atmospheric sources may be the reason for this phenomenon. The peak diameter of PSL (<16 nm) and sucrose solution (33 nm) is smaller than that of atmospheric aerosol. Conversely, the size of oily particles is much larger. The peak diameters of particles generated by DEHS (440 nm) and olive oil (835 nm) are all larger than that of atmospheric aerosol.
The particle volume distribution was calculated by Equation (5) and reported in Figure 2b and Supplementary Materials Figure S1b. The atmospheric aerosol volume distribution has two peaks: at 0.36 μm (accumulation mode) and 14.86 μm (coarse mode), respectively. The shape of the volume distribution shares similarities with that of previous studies [52]. The two peaks are dominated by particles from different sources [48]. For the other experimental aerosols, they are unimodally distributed due to the fact that their sources are unique. It should be noted that the peak diameter of particles generated by sucrose solution (0.21 μm) was smaller than the accumulation mode peak of atmospheric aerosol, and the peak diameter of particles generated by olive oil (17.15 μm) was larger than the coarse mode peak of atmospheric aerosol.
Individually, none of the solutions generated particles that share a similar size distribution to atmospheric aerosol. We infer, though, that it may be possible to generate a kind of experimental aerosol which shares a similar number/volume size distribution to atmospheric aerosol by combining two different solutions. This method imitates the “multiple sources characteristic” of atmospheric aerosols. According to the above experimental results, we believe that the sucrose solution + olive oil mixture solution may be a reasonable attempt. First, the peak diameters of particles generated by sucrose solution and olive oil are beyond the range of atmospheric aerosol for number size and volume size. Second, the sucrose solution and olive oil are all nontoxic. It is possible to generate a kind of chemically nontoxic aerosol by the mixture solution.
The volume ratio of sucrose solution and olive oil may be a crucial factor that influences the size distribution of particles generated. We further discuss this matter in Section 3.4. Except for the proportion, the pressure of compressed air and the concentration of sucrose solution had little effect on the shape of particle size distribution. We first analyze their influence in Section 3.2 and Section 3.3.

3.2. The Effect of Compressed Air Pressure on Particle Size Distribution

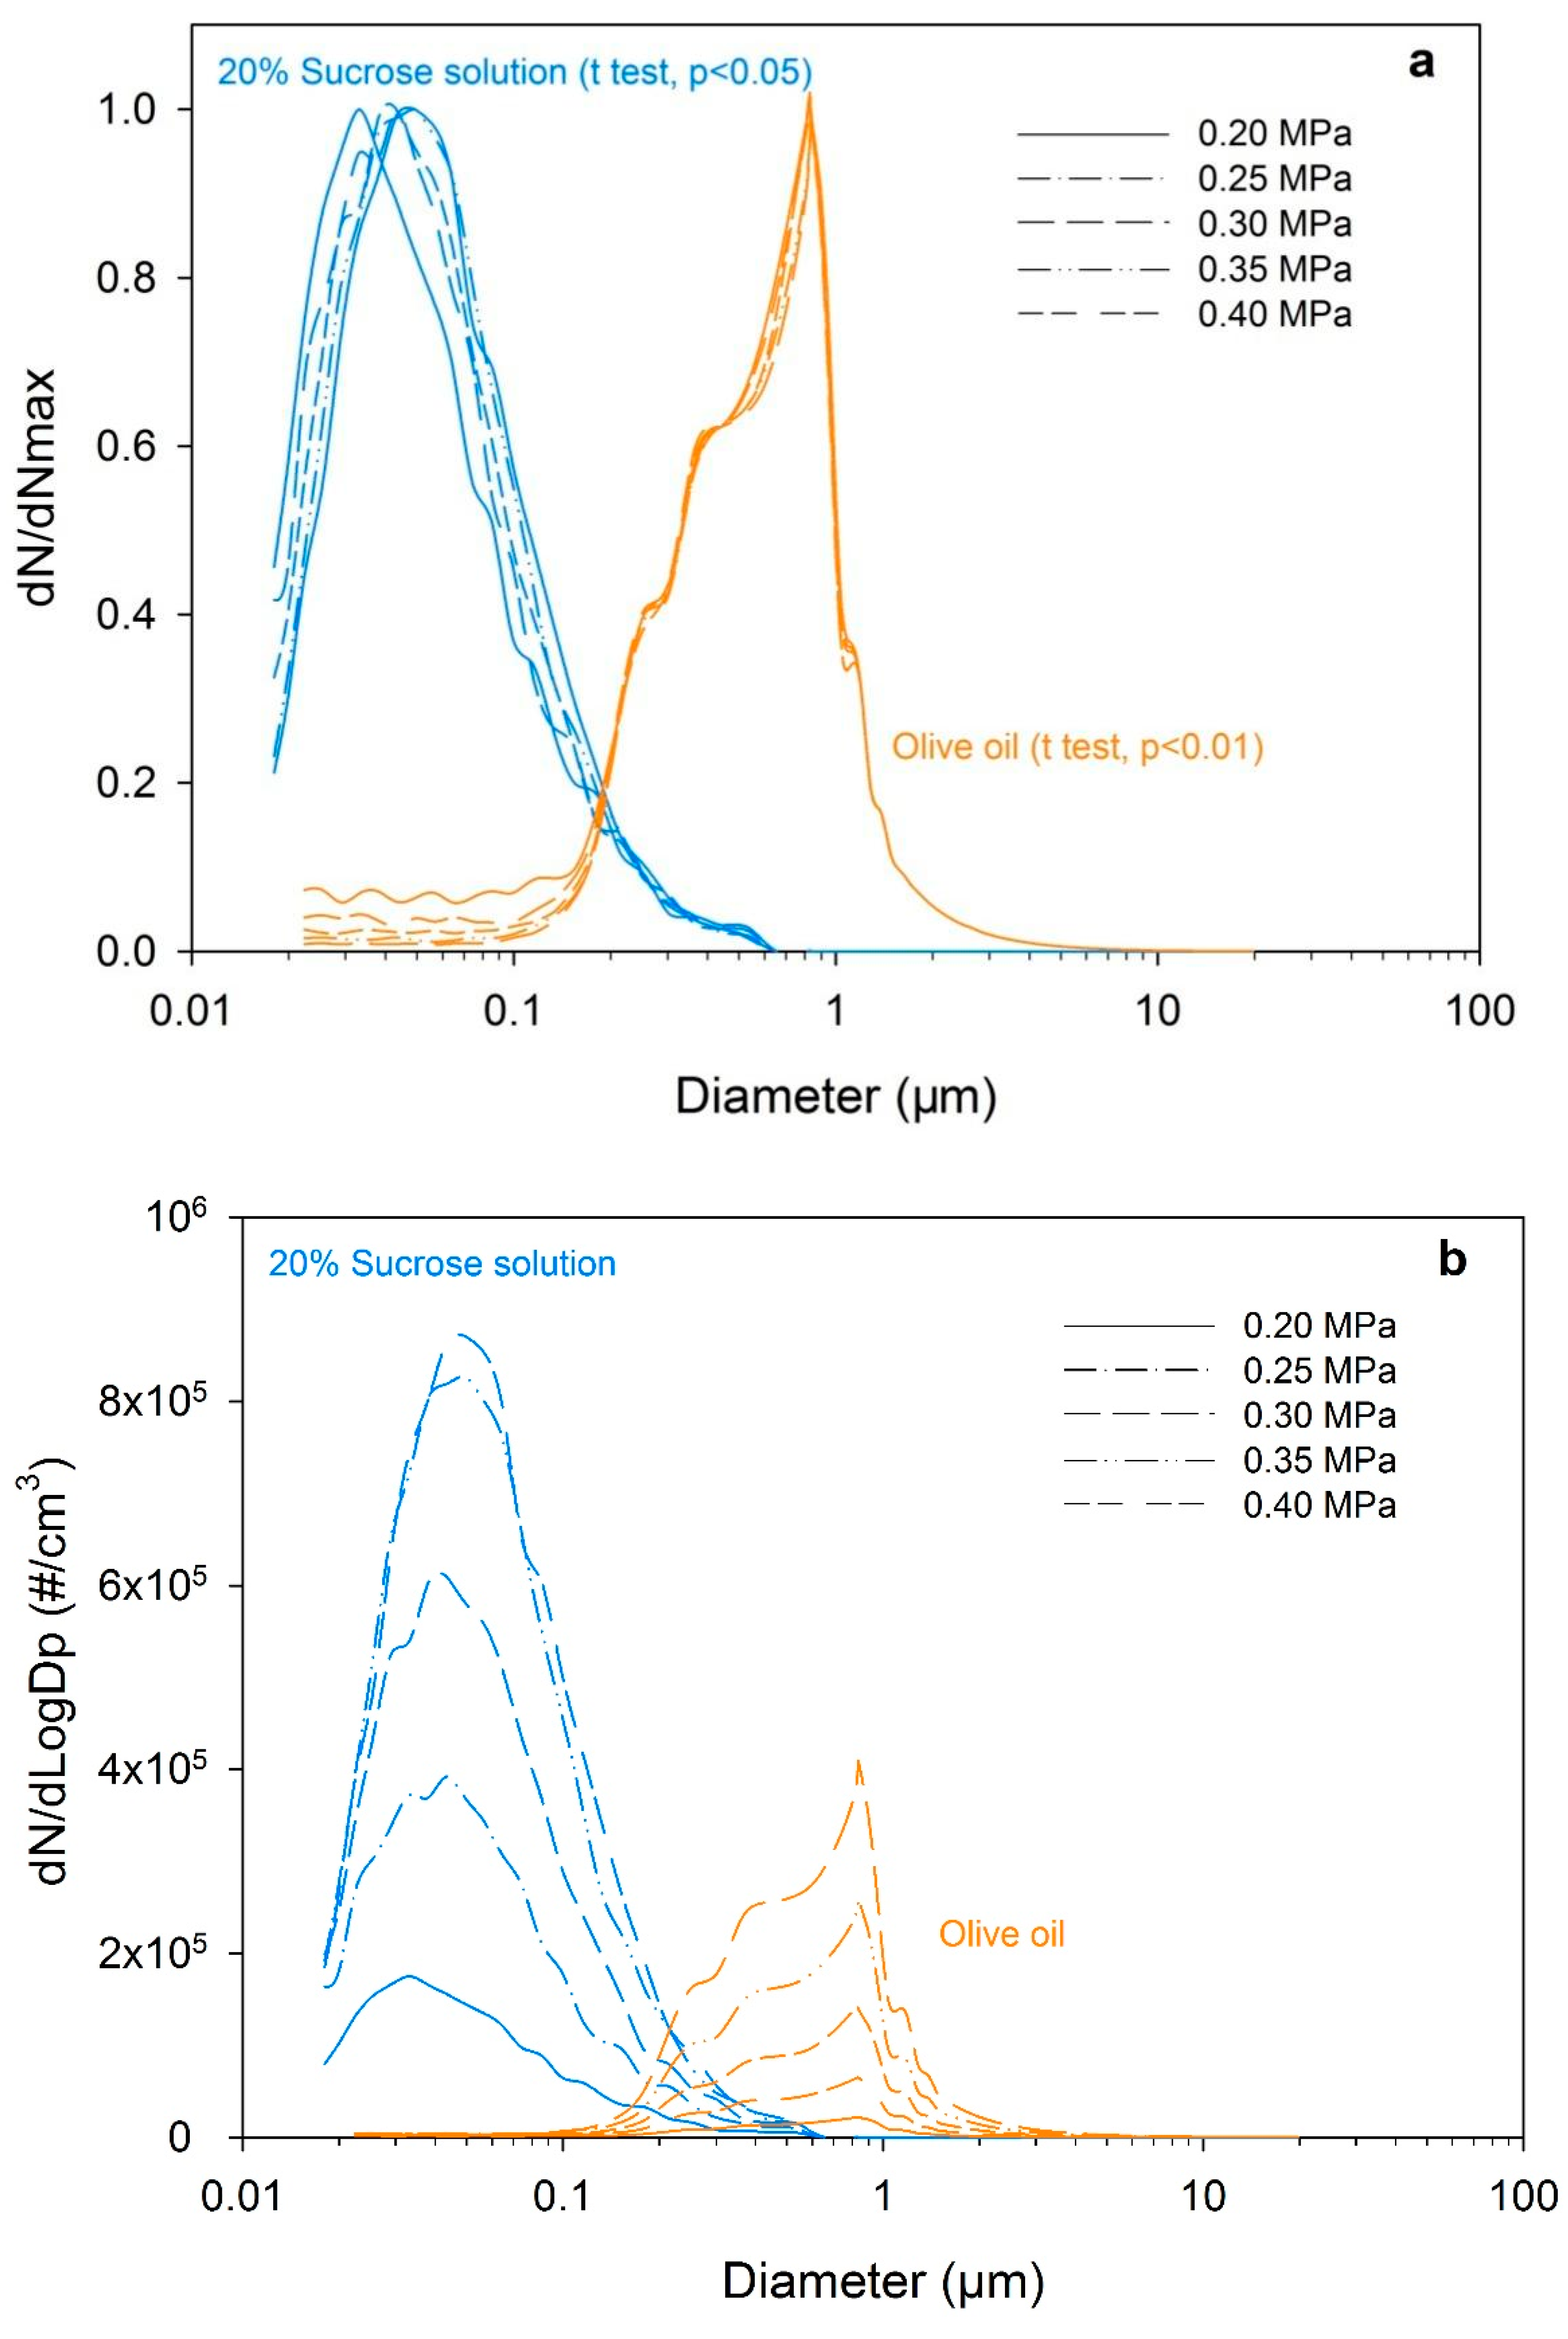
The compressed air’s pressure was set to 0.20, 0.25, 0.30, 0.35, and 0.40 MPa, respectively, to check its influence on the distribution of generated particles. The setting of pressure is also the range of compressed air’s pressure used in most experimental studies to generate particles. It can be seen from Figure 3a that the changing of compressed air’s pressure changes the peak diameter of particles generated by a sucrose solution on a small scale. We used the Student t test to check the differences between the two distributions. The results showed that no significant differences were found between them (for any two distributions, p < 0.05). It is clear from Figure 3a that the compressed air’s pressure did not change the peak diameter of particles generated by olive oil. The statistical results also proved this conclusion (for any two distributions, p < 0.01).
In sum, the compressed air’s pressure had a very limited effect on the normalized particle size distribution. This finding agrees with the results from some previous studies [43,53]. Therefore, 0.3 MPa was chosen as a representative pressure to be used in the following experiments in Section 3.3 and Section 3.4.
The changing of pressure mainly affected the number concentration of generated particles, both for sucrose solution and olive oil (as shown in Figure 3b). We found out that either the peak or sum of the particle number concentration was linearly influenced by pressure (linear regression, R2 > 0.95 for all cases). Supplementary Materials Figure S2 shows the detailed regression results.

3.3. The Effect of Sucrose Solution’s Concentration on Particle Size Distribution

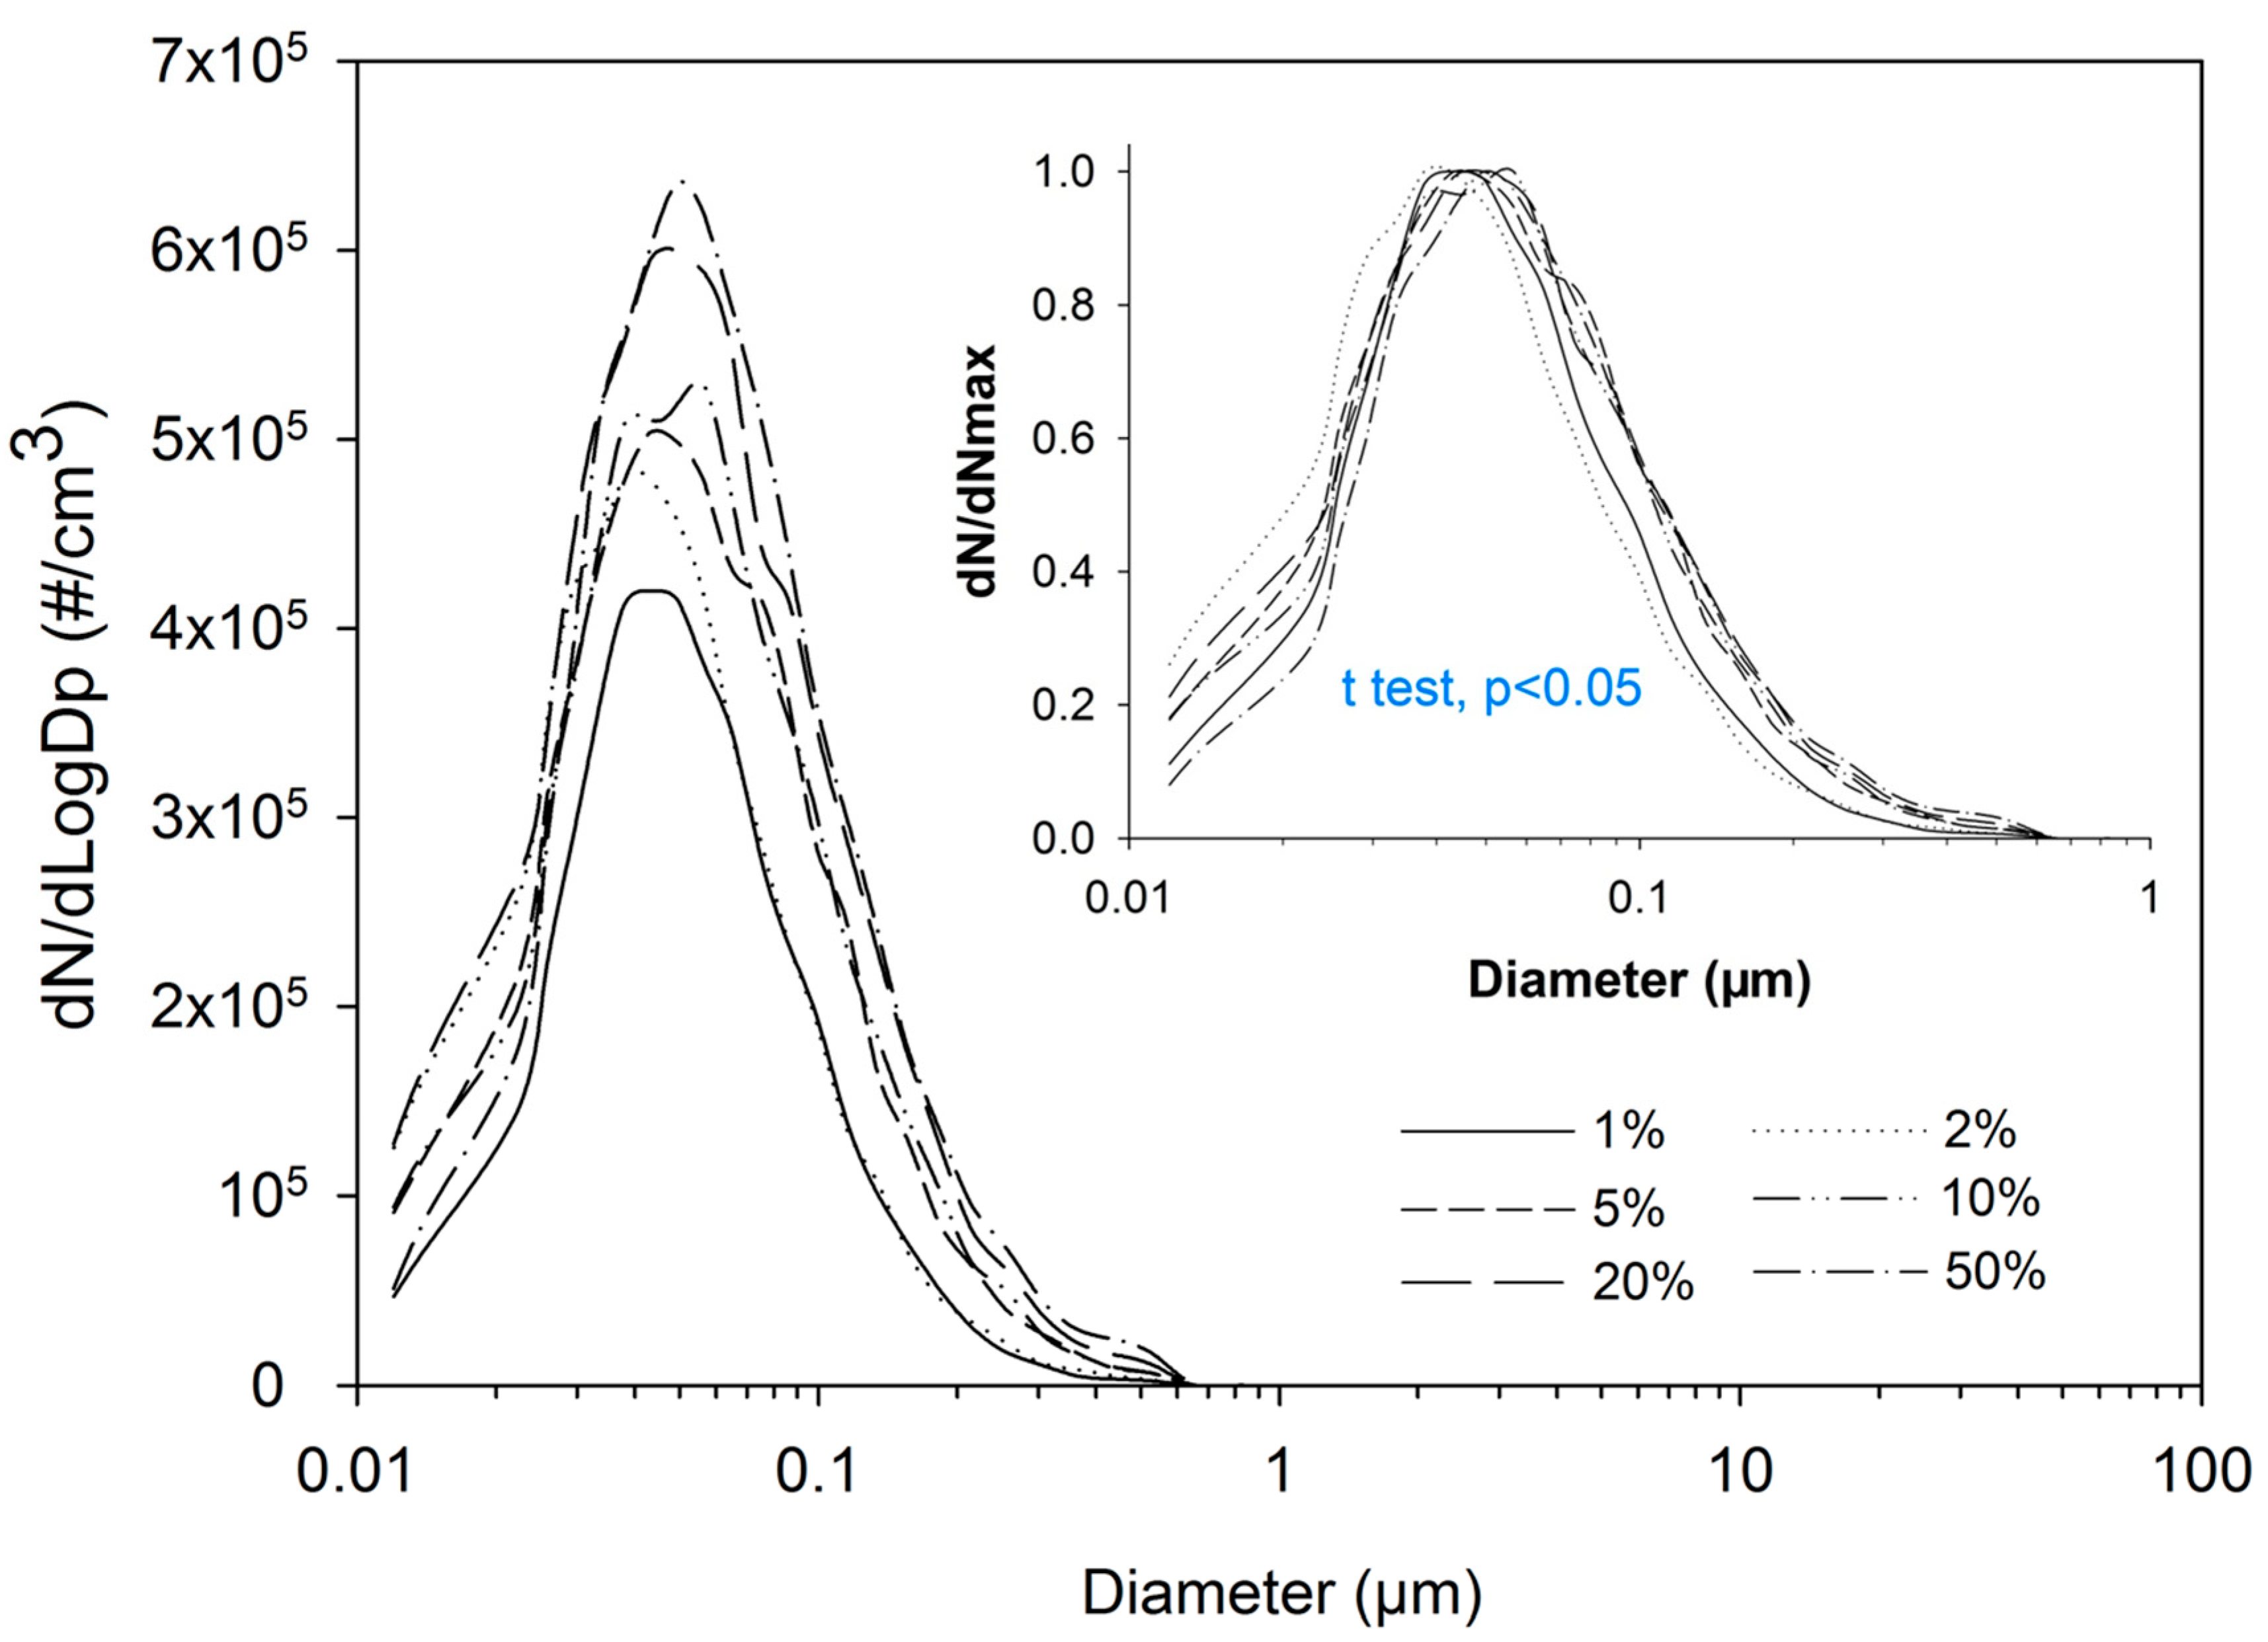
Apart from the pressure of compressed air, the mass concentration of sucrose solution may be another factor affecting the particle size distribution. We checked this by using six different kinds of mass concentrations: 1%, 2%, 5%, 10%, 20%, and 50%.
As shown in Figure 4, the solution concentration had a very limited influence on the normalized particle number size distribution. The statistical results showed that no significant differences were found between them (for any two distributions, p < 0.05). This may be caused by the fact that the diameters of the droplets were relatively stable. The generated particles’ peak/total number concentration increased as the solution’s mass concentration increased. However, their relationship is not linear. Logarithmic equations can be used to better plot their relationship (R2 > 0.93). The detailed regression results are shown in Supplementary Materials Figure S3. Further study of the reason for this logarithmic relationship is needed.
To summarize, the mass concentration of the solution had a limited effect on the size distribution of generated particles, although it influenced the number of particles generated. For the following experimental study described in Section 3.4, 20% was chosen as a representative mass concentration.

3.4. The Size Distribution of Particles Generated by Sucrose Solution and Olive Oil Mixture Solution

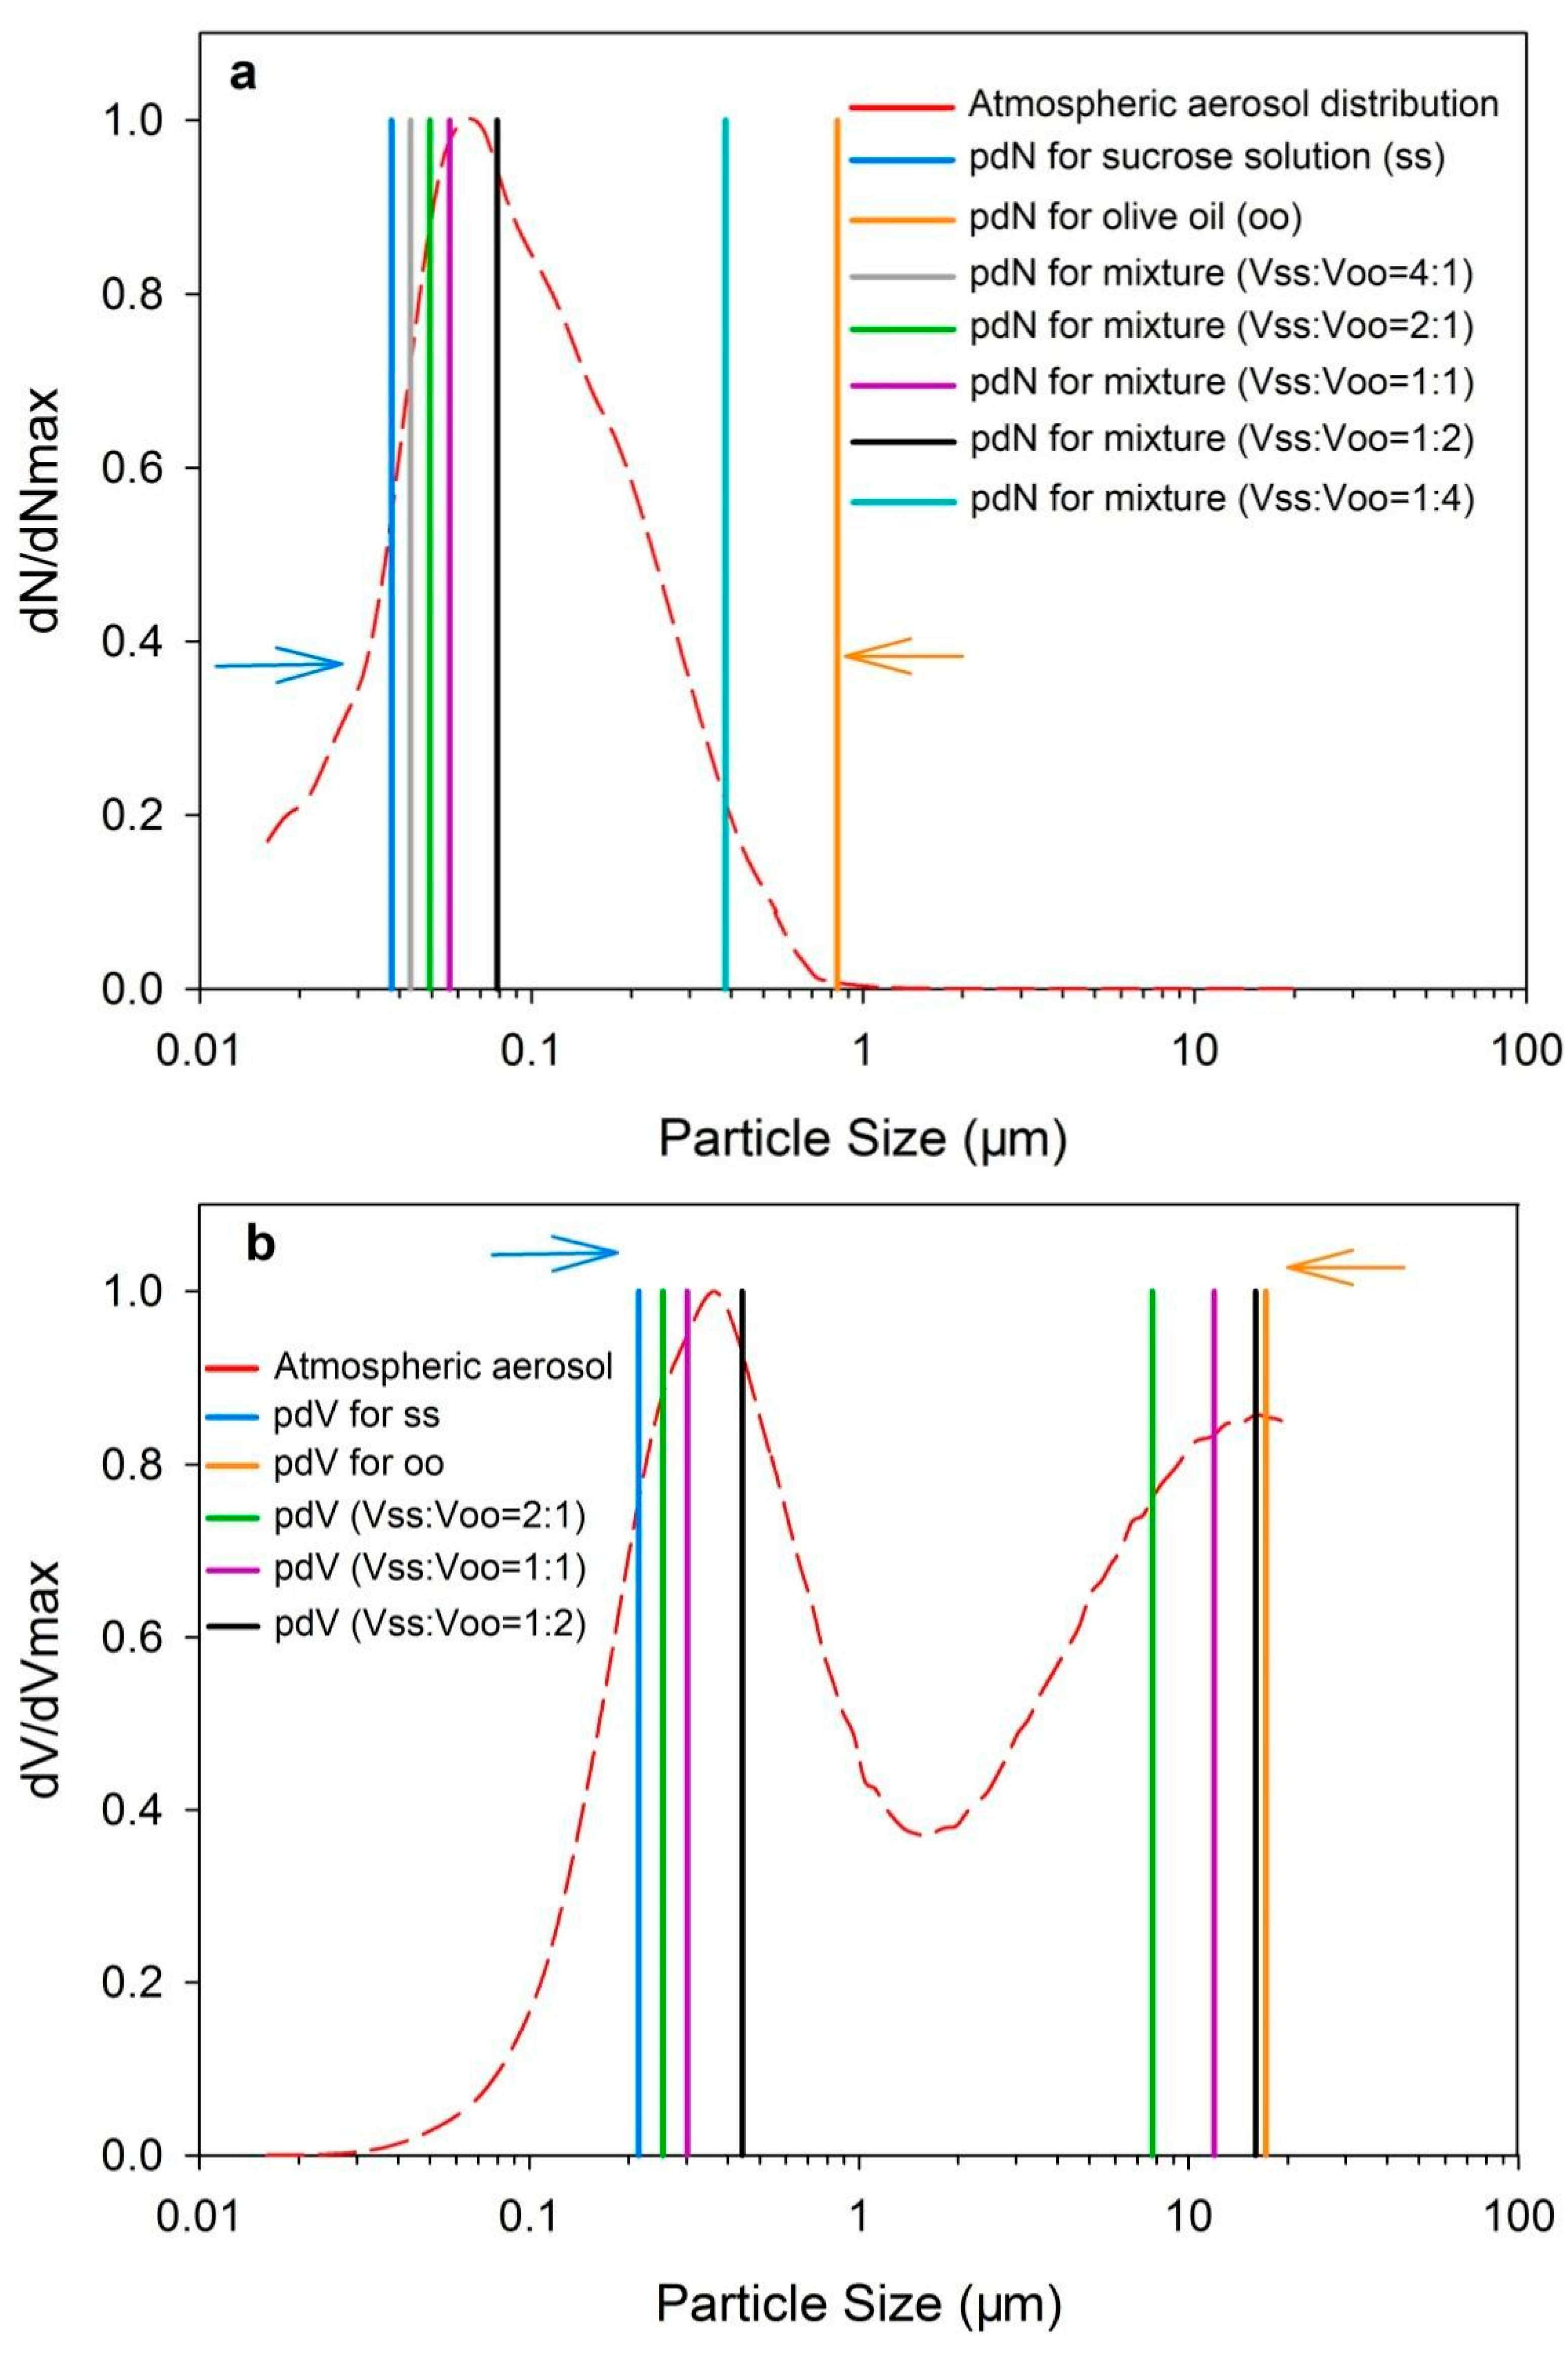
After the pressure of compressed air and the mass concentration of sucrose solution were fixed, the volume ratio of sucrose solution and olive oil was the only factor that could influence the size distribution of particles generated by the mixture solution. We checked the effect of volume ratio of sucrose solution and olive oil (abbreviated as Vss:Voo, with Vss meaning the volume of 20% sucrose solution and Voo meaning the volume of olive oil) in five groups, namely 4:1, 2:1, 1:1, 1:2, and 1:4. It is clear from Figure 5a that, with the increasing of Vss:Voo (in the direction from 1:4 to 4:1), the peak diameter of particle number concentration became smaller. We used the t-test to check the differences in particle number size distribution between the atmospheric aerosol and the aerosols generated by five different kinds of mixture solutions. When the volume ratio was 2:1, 1:1, and 1:2, there existed no significant differences between the generated aerosol and atmospheric aerosol in particle number distribution (p < 0.05).
The similarity of the generated aerosol and atmospheric aerosol in particle volume/mass distribution was also studied. As shown in Figure 5b, the volume distributions of the generated aerosols all had two peaks. This shape shares some similarities with the atmospheric aerosol. The two peak diameters all shifted to a smaller part with the increasing of Vss:Voo (in the direction from 1:2 to 2:1). When the volume ratio was 1:2, there existed no significant differences between the generated aerosol and atmospheric aerosol in particle volume distribution according to the statistical results (p < 0.05). In addition, by changing the volume ratio, we can generate aerosols that may be used in other situations (for example, to represent indoor particles).

4. Discussion

We found that 1:2 (Vss:Voo) was a suitable volume ratio to generate aerosol with a similar particle number/volume size distribution to the atmospheric aerosol. Its real performance in mass-based filtration efficiency measurement and instrument calibration was further checked.

4.1. Mass-Based Filtration Efficiency Measurement

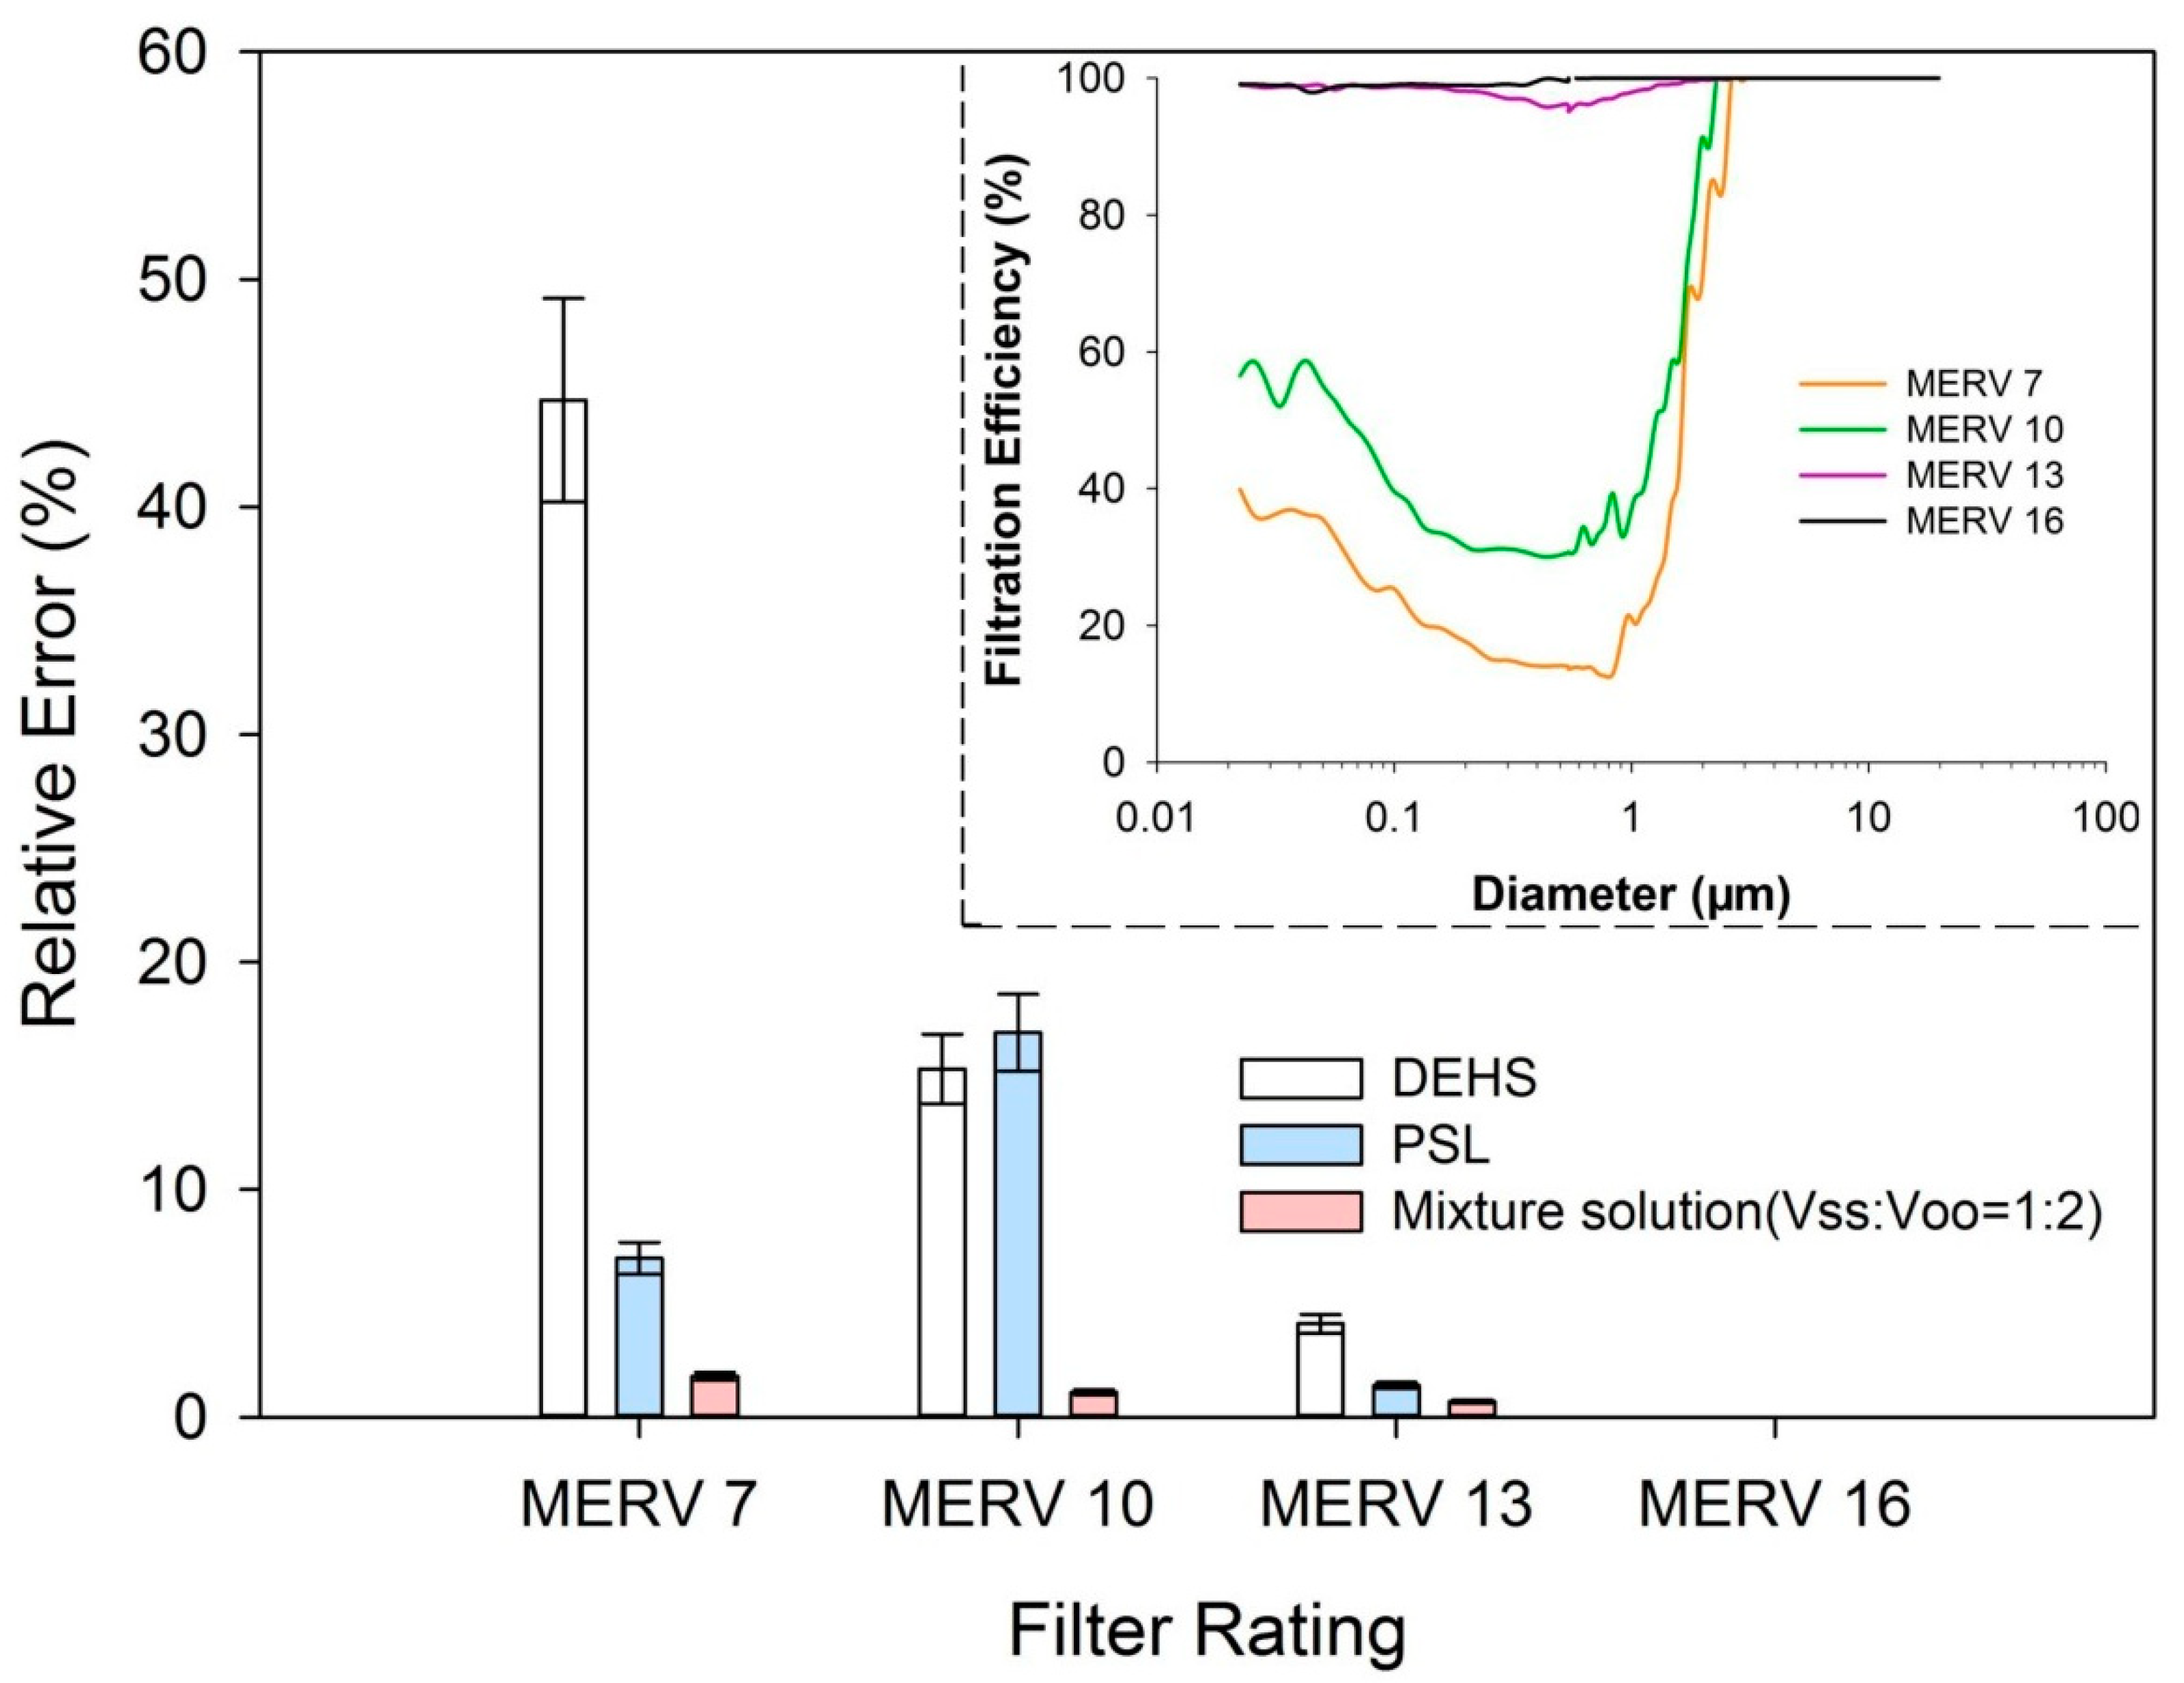
Four different kinds of filters rated at MERV 7, 10, 13, and 16 were used in this check. Their size-resolved removal efficiency was first measured by the SMPS and APS combination system under their respective rating airflow. The results are shown in the upper-right corner of Figure 6. Four different kinds of aerosols were used in the following mass-based filtration efficiency test: atmospheric aerosol and aerosols generated by DEHS, PSL, and the mixture solution (Vss:Voo = 1:2).
We used two portable optical monitoring devices (Dusttrak Model 8530, TSI Inc., St. Paul, MN) to measure the PM2.5 mass concentration upstream and downstream of the filters simultaneously. A Tapered Element Oscillating Microbalance (TEOM) monitor (Model 1405-D, Thermo Scientific, Inc., Franklin, MA) was used to calibrate the two Dusttrak Models 8530 with local atmospheric aerosol. The detailed calibration process is summarized in the Supporting Materials (SM). The sampling interval of PM2.5 concentrations was set to 1 s. The measurement for each case (case number: different rated filters × different aerosol = 4 × 4 = 16) was continued for at least one hour. The data measured in the first 10 min in each case were abandoned.
The mass-based filtration efficiency can be calculated by using the following equation:
η m a s s = ( 1 P M 2.5 , d o w n   P M 2.5 , u p ) × 100 %
where η m a s s is the mass-based filtration efficiency; P M 2.5 , d o w n is the PM2.5 concentration downstream of the filters, μg/m3; and P M 2.5 , u p is the PM2.5 concentration upstream of the filters, μg/m3. The mass-based filtration efficiency of MERV 7, 10, 13, and 16 rated filters measured by different types of aerosols is shown in Supplementary Materials Figure S4.
The relative error in Figure 6 is defined as follows:
R E = | η m a s s , g a η m a s s , a a |   η m a s s , a a × 100 %
where R E is the relative error, η m a s s , g a is the mass-based filtration efficiency measured with experimentally generated aerosols, and η m a s s , a a is the mass-based filtration efficiency measured with atmospheric aerosol.
The results reported in Figure 6 show that the size distribution of particles used in the measurement did have an influence on the mass-based filtration efficiency. This agrees with the theoretical calculation results by Stephens [53]. For the MERV 7 filter, the relative error ranged from as low as ~1.8%, using the mixture solution, to as high as ~44.7%, using DEHS. For MERV 10, the relative error ranged from as low as ~1.1%, using the mixture solution, to as high as ~16.9%, using PSL. The aerosol generated by the mixture solution performed well in mass-based filtration efficiency measurements. It is also worth noting that the relative errors were smaller for the MERV 13 and MERV 16 filters, because they have a removal efficiency of 90–100% for particles in the whole size range. Thus, the size distribution of aerosols would not influence the mass-based filtration efficiency results as much for these as for lower efficiency filters. Moreover, a recent study suggested that wearing a high-efficiency particulate-filtering respirator to reduce the exposure of ambient particles could also improve the cardiovascular function [24,25]. For the main means of protection, the filtering effect of some fine particles in the atmosphere is very important to the respirator. Therefore, a high-efficiency particulate-filtering respirator may be able to test their filtration efficiency by using a mixed solution similar to atmospheric aerosols.

4.2. Instrument Calibration

Nowadays, many optical instruments and sensors are widely used to measure PM2.5 mass concentration. Take the Dusttrak Model 8530, for example. A diaphragm pump draws aerosol into a sensing chamber in a continuous stream. In the chamber, the stream is illuminated by laser light. A fraction of light scattered by the particles is captured by a mirror and focused to a photodetector. The PM2.5 concentration can be calculated by multiplying the photometric signal by the calibration factor. The instrument is usually calibrated to a gravimetric sample or a TEOM with local atmospheric aerosol, due to the fact that the size distribution of the aerosol may affect the performance of the photodetector [38,39]. However, the concentration of atmospheric aerosol cannot be controlled.
Here, we calibrated the Dusttrak Model 8530 to a TEOM with aerosol generated by the mixture solution. The calibration process was conducted in a well-controlled chamber with a volume of about 27 m3. The internal walls of the chamber were stainless steel. The chamber was purified for at least 24 h by the fresh-air system, which was equipped with a HEPA filter and a speed-controllable fan. Four mixing fans were kept open during the calibration process. The Dusttrak Model 8530 was placed next to the TEOM. The sampling interval was set to be 1 min to meet the shortest sampling interval of TEOM. The aerosol generated by the mixture solution was supplied into the chamber. The calibration process continued for at least 1 h and was repeated three times. The calibration factor is PM2.5,Dusttrak = 1.19 PM2.5,TEOM.
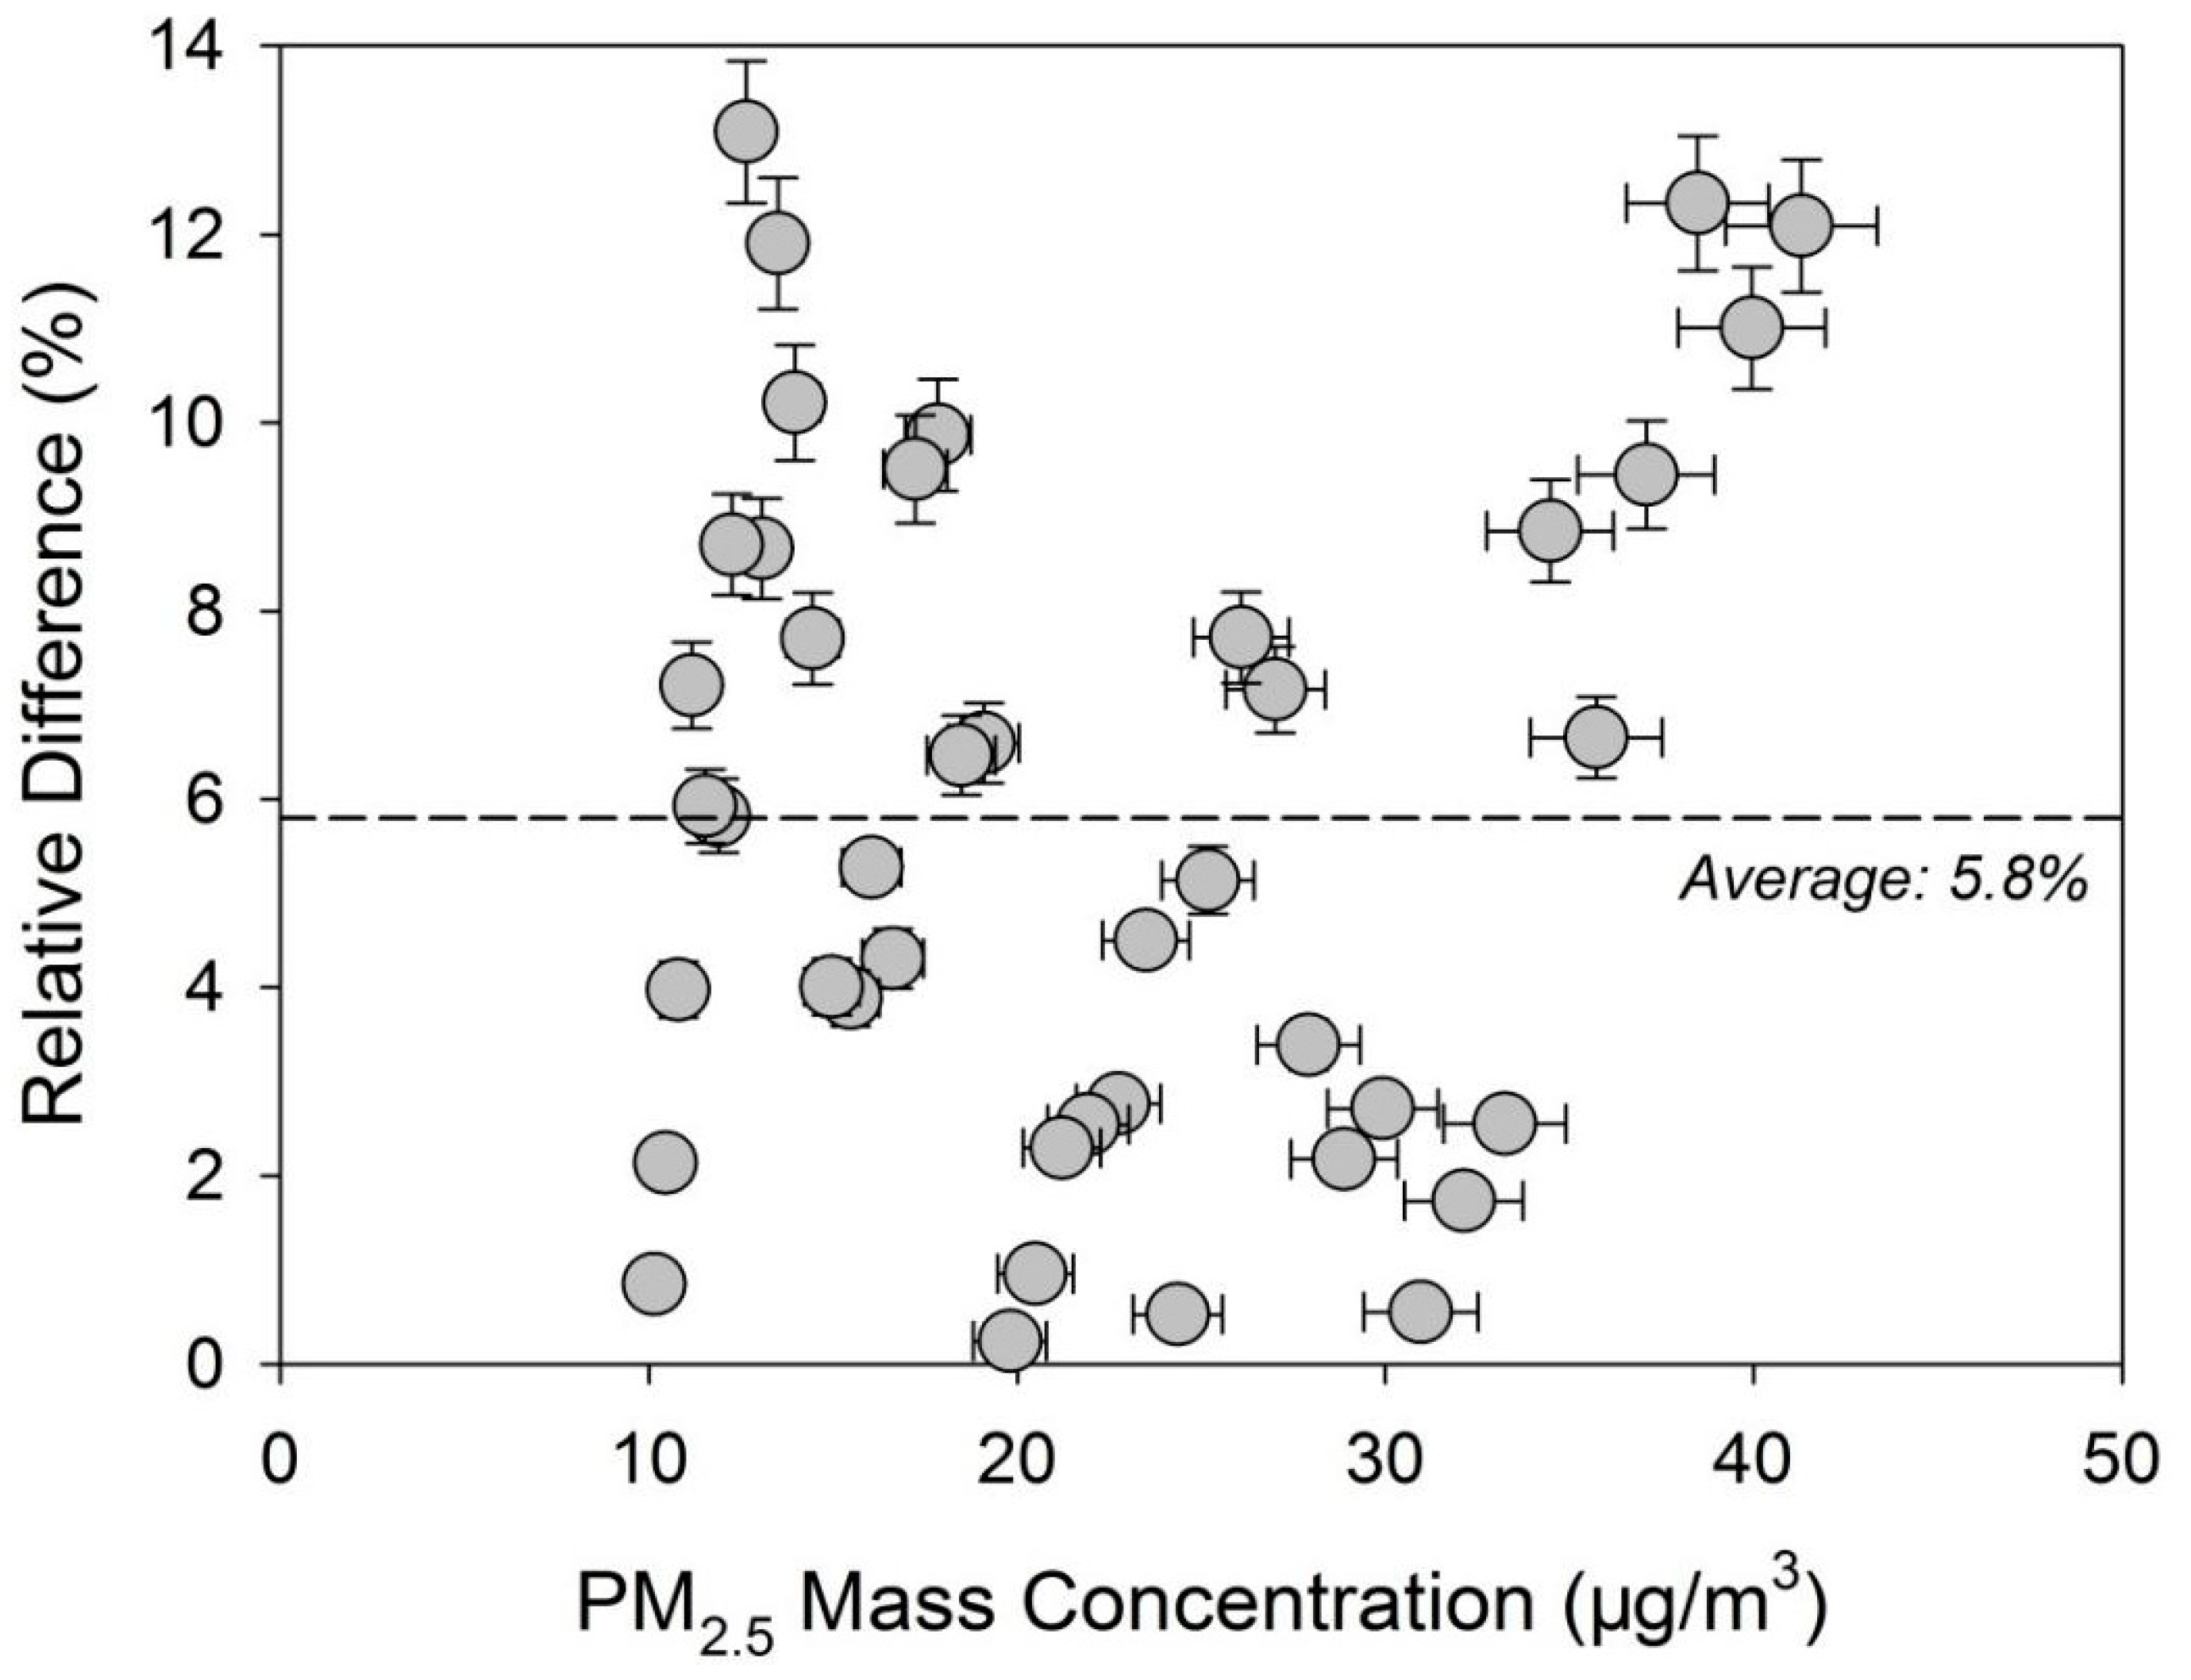
The real performance of the calibrated Dusttrak Model 8530 was checked next. We used the calibrated Dusttrak Model 8530 and TEOM to measure the outdoor PM2.5 concentrations for a week. The relative difference (RD) between the mass concentration measured by the Dusttrak Model 8530 and TEOM is defined as follows:
R D = | P M 2.5 , T E O M P M 2.5 , D u s t t r a k |   P M 2.5 , T E O M × 100 %
where P M 2.5 , T E O M is the PM2.5 concentration measured by TEOM, μg/m3; and P M 2.5 , D u s t t r a k is the PM2.5 concentration measured by Dusttrak at the same time, μg/m3.
Figure 7 shows the relative difference between the calibrated Dusttrak Model 8530 and TEOM under different outdoor PM2.5 concentrations. The calibrated Dusttrak Model 8530 performed well in real-situation measurements (average relative difference: 5.8%). This proved that the aerosol generated by the sucrose solution + olive oil mixture solution can be used in optical principle-based instruments or sensor calibration.
It should be noted that some limitations existed in our current study. First, the particle size distribution of the aerosol generated by the sucrose solution + olive oil mixture solution is quite similar to the atmospheric aerosol. However, differences may still exist in their chemical composition, particle shape, optical properties, and electrical properties. Second, the proper volume ratio of sucrose solution and olive oil was found by using an experimental method in this study. The principle in the shifting of particle size distribution with the changing of volume ratio of mixture solution may be an interesting topic for further study.

5. Conclusions

(1) We used the SMPS + APS combination system to measure the size distribution of particles generated by DEHS, PSL, olive oil, and 20% sucrose solution with a collision nebulizer in a wide size range, from 15 nm to 20 μm. This set of data is expected to contribute to the database of experimental aerosol characteristics. None of the single solutions can generate particles that have a size distribution similar to atmospheric aerosol.
(2) We found that the 20% sucrose solution + olive oil mixture solution (Vss:Voo = 1:2) can be used to generate a chemically nontoxic aerosol with a similar particle number/volume size distribution to atmospheric aerosol. The statistical results proved that no significant difference existed between the generated aerosol and atmospheric aerosol in particle number and volume distribution (t-test, p < 0.05).
(3) The pressure of compressed air had a limited effect on the size distribution of particles generated by the collision nebulizer. The peak and total of particle number concentration were linearly affected by the pressure (linear regression, R2 > 0.95 for all cases). The concentration of sucrose solution had little effect on the particle size distribution. Logarithmic equations can be used to plot the relationship between the mass concentration of solution and the number concentration of generated particles.
(4) The generated aerosol by mixture solution performed well in the mass-based filtration efficiency measurement. The relative error (difference in the mass-base filtration efficiency measured by generated aerosol and atmospheric aerosol) was smaller than 2% for MERV 7, 10, 13, and 16 rated filters. This kind of generated aerosol can also be used in optical principle-based instruments or sensor calibration. The average relative difference measured by TEOM and the calibrated Dusttrak Model 8530 was smaller than 5.8% in real-situation measurements.

Supplementary Materials

The following are available online at https://www.mdpi.com/article/10.3390/atmos12121669/s1, Figure S1: Particle number size distribution (a) and volume size distribution (b); Figure S2: The relationship between pressure of compressed air and aerosol concentration. a and b are for 20% sucrose solution; c and d are for olive oil; Figure S3: The relationship between mass concentration of sucrose solution and aerosol concentration; Figure S4: The mass-based filtration efficiency of MERV 7, 10, 13, 16 rated filters measured; Table S1: Particle size distribution in the size range of 16 nm-20 μm.

Author Contributions

J.R., writing—original draft, data curation, and funding acquisition; J.H., writing—original draft and visualization; J.L. (Jiayu Li), investigation and formal analysis; J.L (Junjie Liu), writing—review and editing, methodology, and project administration. All authors have read and agreed to the published version of the manuscript.

Funding

This study was supported by the National Natural Science Foundation of China (Project No. 52108075), Natural Science Foundation of Hebei Province, China (Project No. E2020202147) and S&T Program of Hebei (Project No. 216Z4502G).

Institutional Review Board Statement

Not applicable.

Informed Consent Statement

Not applicable.

Conflicts of Interest

The authors declare that they have no known competing financial interests or personal relationships that could have appeared to influence the work reported in this paper.

References

  1. Li, J.; Tartarini, F. Changes in air quality during the COVID-19 lockdown in Singapore and associations with human mobility trends. Aerosol. Air Qual. Res. 2020, 20, 1748–1758. [Google Scholar] [CrossRef]
  2. Pansini, R.; Fornacca, D. Early Spread of COVID-19 in the Air-Polluted Regions of Eight Severely Affected Countries. Atmosphere 2021, 12, 795. [Google Scholar] [CrossRef]
  3. Seposo, X.; Ng, C.F.S.; Madaniyazi, L. Immediate and Delayed Meteorological Effects on COVID-19 Time-Varying Infectiousness in Tropical Cities. Atmosphere 2020, 12, 513. [Google Scholar] [CrossRef]
  4. Kong, X.; Guo, C.; Lin, Z.; Duan, S.; He, J.; Ren, Y.; Ren, J. Experimental study on the control effect of different ventilation systems on fine particles in a simulated hospital ward. Sustain. Cities Soc. 2021, 73, 103102. [Google Scholar] [CrossRef] [PubMed]
  5. Dong, L.; Chen, B.; Huang, Y.; Song, Z.; Yang, T. Analysis on the Characteristics of Air Pollution in China during the COVID-19 Outbreak. Atmosphere 2021, 12, 205. [Google Scholar] [CrossRef]
  6. Ai, Z.; Hashimoto, K.; Melikov, A.K. Airborne transmission between room occupants during short-term events: Measurement and evaluation. Indoor Air 2019, 29, 563–576. [Google Scholar] [CrossRef] [PubMed] [Green Version]
  7. Gorbunov, B. Aerosol particles laden with viruses that cause COVID-19 travel over 30 m distance. Preprints 2020, 546, v2. [Google Scholar] [CrossRef]
  8. Bhaganagar, K.; Bhimireddy, S. Local atmospheric factors that enhance air-borne dispersion of coronavirus-High-fidelity numerical simulation of COVID19 case study in real-time. Environ. Res. 2020, 191, 110170. [Google Scholar] [CrossRef]
  9. Srivastava, S.; Zhao, X.; Manay, A.; Chen, Q. Effective ventilation and air disinfection system for reducing Coronavirus Disease 2019 (COVID-19) infection risk in office buildings. Sustain. Cities Soc. 2021, 75, 103408. [Google Scholar] [CrossRef] [PubMed]
  10. Ai, Z.; Melikov, A.K. Airborne spread of expiratory droplet nuclei between the occupants of indoor environments: A review. Indoor Air 2018, 28, 500–524. [Google Scholar] [CrossRef] [PubMed]
  11. Ai, Z.; Mak, C.M.; Gao, N.; Niu, J. Tracer gas is a suitable surrogate of exhaled droplet nuclei for studying airborne transmission in the built environment. Build. Simul. 2020, 13, 489–496. [Google Scholar] [CrossRef] [PubMed] [Green Version]
  12. Wei, P.; Zhou, B.; Tan, M.; Li, F.; Lu, J.; Dong, Z.; Xiao, Y. Study on thermal comfort under non-uniform thermal environment condition in domestic kitchen. Proc. Eng. 2017, 205, 2041–2048. [Google Scholar] [CrossRef]
  13. Fisk, W.J. Health benefits of particle filtration. Indoor Air 2013, 23, 357–368. [Google Scholar] [CrossRef] [PubMed]
  14. Ren, J.; Liu, J.; Cao, X.; Li, F.; Li, J. Ultrafine particles in the cabin of a waiting commercial airliner at Tianjin International Airport, China. Indoor Built. Environ. 2018, 27, 1247–1258. [Google Scholar] [CrossRef]
  15. Ren, J.; Cao, X.; Liu, J. Impact of atmospheric particulate matter pollutants to IAQ of airport terminal buildings: A first field study at Tianjin Airport, China. Atmos. Environ. 2018, 179, 222–226. [Google Scholar] [CrossRef]
  16. Punsmann, S.; van der Graaf, T.; Zahradnik, E.; Czibor, C.; Raulf, M.; Sander, I. Effectiveness of a portable air filtration device in reducing allergen exposure during household chores. Allergo J. Int. 2019, 28, 299–307. [Google Scholar] [CrossRef]
  17. Ren, J.; Tang, M.; Novoselac, A. Experimental study to quantify airborne particle deposition onto and resuspension from clothing using a fluorescent-tracking method. Build. Environ. 2022, 209, 108580. [Google Scholar] [CrossRef]
  18. Kong, X.; Ren, Y.; Ren, J.; Duan, S.; Guo, C. Energy-saving performance of respiration-type double-layer glass curtain wall system in different climate zones of China: Experiment and simulation. Energ. Build. 2021, 252, 111464. [Google Scholar] [CrossRef]
  19. Dai, X.; Liu, J.; Li, X.; Zhao, L. Long-term monitoring of indoor CO2 and PM 2.5 in Chinese homes: Concentrations and their relationships with outdoor environments. Build. Environ. 2018, 144, 238–247. [Google Scholar] [CrossRef]
  20. Ren, J.; Liu, J. Fine particulate matter control performance of a new kind of suspended fan filter unit for use in office buildings. Build. Environ. 2019, 149, 468–476. [Google Scholar] [CrossRef]
  21. Zhuang, J.; Li, F.; Liu, X.; Cai, H.; Feng, L.; Li, X. An experiment-based impulse response method to characterize airborne pollutant sources in a scaled multi-zone building. Atmos. Environ. 2021, 251, 118272. [Google Scholar] [CrossRef]
  22. Dai, X.; Liu, J.; Zhang, X. Monte Carlo simulation to control indoor pollutants from indoor and outdoor sources for residential buildings in Tianjin, China. Build. Environ. 2019, 165, 106376. [Google Scholar] [CrossRef]
  23. Ren, J.; He, J.; Kong, X.; Xu, W.; Kang, Y.; Yu, Z.; Li, H. A field study of CO2 and particulate matter characteristics during the transition season in the subway system in Tianjin, China. Energ. Build. 2022, 254C, 111620. [Google Scholar] [CrossRef]
  24. Faridi, S.; Brook, R.D.; Hassanvand, M.S.; Nodehi, R.N.; Shamsipour, M.; Tajdini, M.; Sadeghian, S. Cardiovascular health effects of wearing a particulate-filtering respirator to reduce particulate matter exposure: A randomized crossover trial. J. Hum. Hypertens. 2021, 1–11. [Google Scholar] [CrossRef]
  25. Faridi, S.; Nodehi, R.N.; Sadeghian, S.; Tajdini, M.; Hoseini, M.; Yunesian, M.; Naddafi, K. Can respirator face masks in a developing country reduce exposure to ambient particulate matter? J. Expo. Sci. Env. Epid. 2020, 30, 606–617. [Google Scholar] [CrossRef]
  26. ISO. ISO 16890-2016, Air Filters for General Ventilation; International Organization for Standardization (ISO): Geneva, Switzerland, 2016. [Google Scholar]
  27. ASHRAE. ASHRAE 52.2-2012, Method of Testing General Ventilation Air-Cleaning Devices for Removal Efficiency by Particle Size; ASHRAE: Peachtree Corners, GA, USA, 2012. [Google Scholar]
  28. ISO. ISO 29463-2017, High-Efficiency Filters and Filter Media for Removing Particles in Air; International organization for standardization (ISO): Geneva, Switzerland, 2017. [Google Scholar]
  29. G.B.T. Chinese. Air Filters Standard (Standard GBT 14295-2008 in Chinese). 2008. Available online: https://www.chinesestandard.net/PDF/English.aspx/GBT14295-2008 (accessed on 12 December 2021).
  30. Porstendörfer, J.; Röbig, G.; Ahmed, A. Experimental determination of the attachment coefficients of atoms and ions on monodisperse aerosols. J. Aerosol. Sci 1979, 10, 21–28. [Google Scholar] [CrossRef]
  31. Maricq, M.M.; Xu, N. The effective density and fractal dimension of soot particles from premixed flames and motor vehicle exhaust. J. Aerosol. Sci. 2004, 35, 1251–1274. [Google Scholar] [CrossRef]
  32. Myers, D.L.; Arnold, B.D. Electrets and filtration: Lab testing and field performance head to head. Filtr. Separat. 2005, 42, 44–49. [Google Scholar] [CrossRef]
  33. Shao, L.; Cao, Y.; Jones, T.; Santosh, M.; Silva, L.F.; Ge, S.; BéruBé, K. COVID-19 mortality and exposure to airborne PM2.5: A lag time correlation. Sci. Total Environ. 2021, 806, 151286. [Google Scholar] [CrossRef] [PubMed]
  34. Ren, J.; Wade, M.; Corsi, R.L.; Novoselac, A. Particulate matter in mechanically ventilated high school classrooms. Build. Environ. 2020, 184, 106986. [Google Scholar] [CrossRef]
  35. Ge, M.; Li, Z.; Wang, Y.; Zhao, Y.; Zhu, Y.; Wang, S.; Liu, L. Experimental study on thermoelectric power generation based on cryogenic liquid cold energy. Energy 2021, 220, 119746. [Google Scholar] [CrossRef]
  36. Raynor, P.C.; Chae, S.J. Dust loading on electrostatitically charged filters in a standard test and a real HVAC system. Filtr. Separat. 2003, 40, 35–39. [Google Scholar] [CrossRef]
  37. Waring, M.S.; Siegel, J.A. Particle loading rates for HVAC filters, heat exchangers, and ducts. Indoor Air 2008, 18, 209–224. [Google Scholar] [CrossRef] [PubMed]
  38. Kim, J.Y.; Magari, S.R.; Herrick, R.F.; Smith, T.J.; Christiani, D.C.; Christiani, D.C. Comparison of fine particle measurements from a direct-reading instrument and a gravimetric sampling method. J. Occup. Environ. Hyg. 2004, 1, 707–715. [Google Scholar] [CrossRef] [PubMed]
  39. Rivas, I.; Mazaheri, M.; Viana, M.; Moreno, T.; Clifford, S.; He, C.; Bischof, O.F.; Martins, V.; Reche, C.; Alastuey, A.; et al. Identification of technical problems affecting performance of DustTrak DRX aerosol monitors. Sci. Total Environ. 2017, 584, 849–855. [Google Scholar] [CrossRef] [PubMed] [Green Version]
  40. Hinds, W.C. Aerosol Technology: Properties, Behavior, and Measurement of Airborne Particles, 2nd ed.; Wiley: New York, NY, USA, 1999. [Google Scholar]
  41. Harris, S.; Smith, B. Olive oil tracer particle size analysis for optical flow investigations in a gas medium. In Proceedings of the 67th Annual Meeting of the APS Division of Fluid Dynamics, San Francisco, CA, USA, 23–25 November 2014. [Google Scholar]
  42. He, M.; Zhang, Y.; Ma, L.; Wang, H.; Fu, P.; Zhao, Z. Study on flow field characteristics in a reverse rotation cyclone with PIV. Chem. Eng. Process 2018, 126, 100–107. [Google Scholar] [CrossRef]
  43. May, K.R. The collison nebulizer: Description, performance and application. J. Aerosol. Sci. 1973, 4, 235–243. [Google Scholar] [CrossRef]
  44. Shi, J.P.; Harrison, R.M.; Evans, D. Comparison of ambient particle surface area measurement by epiphaniometer and SMPS/APS. Atmos. Environ. 2001, 35, 6193–6200. [Google Scholar] [CrossRef]
  45. Molgaard, B.; Koivisto, A.J.; Hussein, T.; Hämeri, K. A new clean air delivery rate test applied to five portable indoor air cleaners. Aerosol. Sci. Tech. 2014, 48, 409–417. [Google Scholar] [CrossRef]
  46. Khlystov, A.; Stanier, C.; Pandis, S.N. An algorithm for combining electrical mobility and aerodynamic size distributions data when measuring ambient aerosol special issue of aerosol science and technology on findings from the fine particulate matter supersites program. Aerosol. Sci. Tech. 2004, 38, 229–238. [Google Scholar] [CrossRef] [Green Version]
  47. Sioutas, C. Evaluation of the measurement performance of the scanning mobility particle sizer and aerodynamic particle sizer. Aerosol. Sci. Tech. 1999, 30, 84–92. [Google Scholar] [CrossRef] [Green Version]
  48. Kulkarni, P.; Baron, P.A.; Willeke, K. Aerosol Measurement: Principles, Techniques, and Applications; John Wiley & Sons: Hoboken, NJ, USA, 2011. [Google Scholar]
  49. Leoni, C.; Pokorná, P.; Hovorka, J.; Masiol, M.; Topinka, J.; Zhao, Y.; Krumal, K.; Cliff, S.; Mikuska, P.; Hopke, P.K. Source apportionment of aerosol particles at a European air pollution hot spot using particle number size distributions and chemical composition. Environ. Pollut. 2018, 234, 145–154. [Google Scholar] [CrossRef] [PubMed]
  50. Azimi, P.; Zhao, D.; Stephens, B. Estimates of HVAC filtration efficiency for fine and ultrafine particles of outdoor origin. Atmos. Environ. 2014, 98, 337–346. [Google Scholar] [CrossRef]
  51. Li, X.; Wang, J.; Tu, X.D.; Liu, W.; Huang, Z. Vertical variations of particle number concentration and size distribution in a street canyon in Shanghai, China. Sci. Total Environ. 2007, 378, 306–316. [Google Scholar] [CrossRef]
  52. Vu, T.V.; Delgado-Saborit, J.M.; Harrison, R.M. Particle number size distributions from seven major sources and implications for source apportionment studies. Atmos. Environ. 2015, 122, 114–132. [Google Scholar] [CrossRef]
  53. Stephens, B. Evaluating the sensitivity of the mass-based particle removal calculations for HVAC filters in ISO 16890 to assumptions for aerosol distributions. Atmosphere 2018, 9, 85. [Google Scholar] [CrossRef] [Green Version]
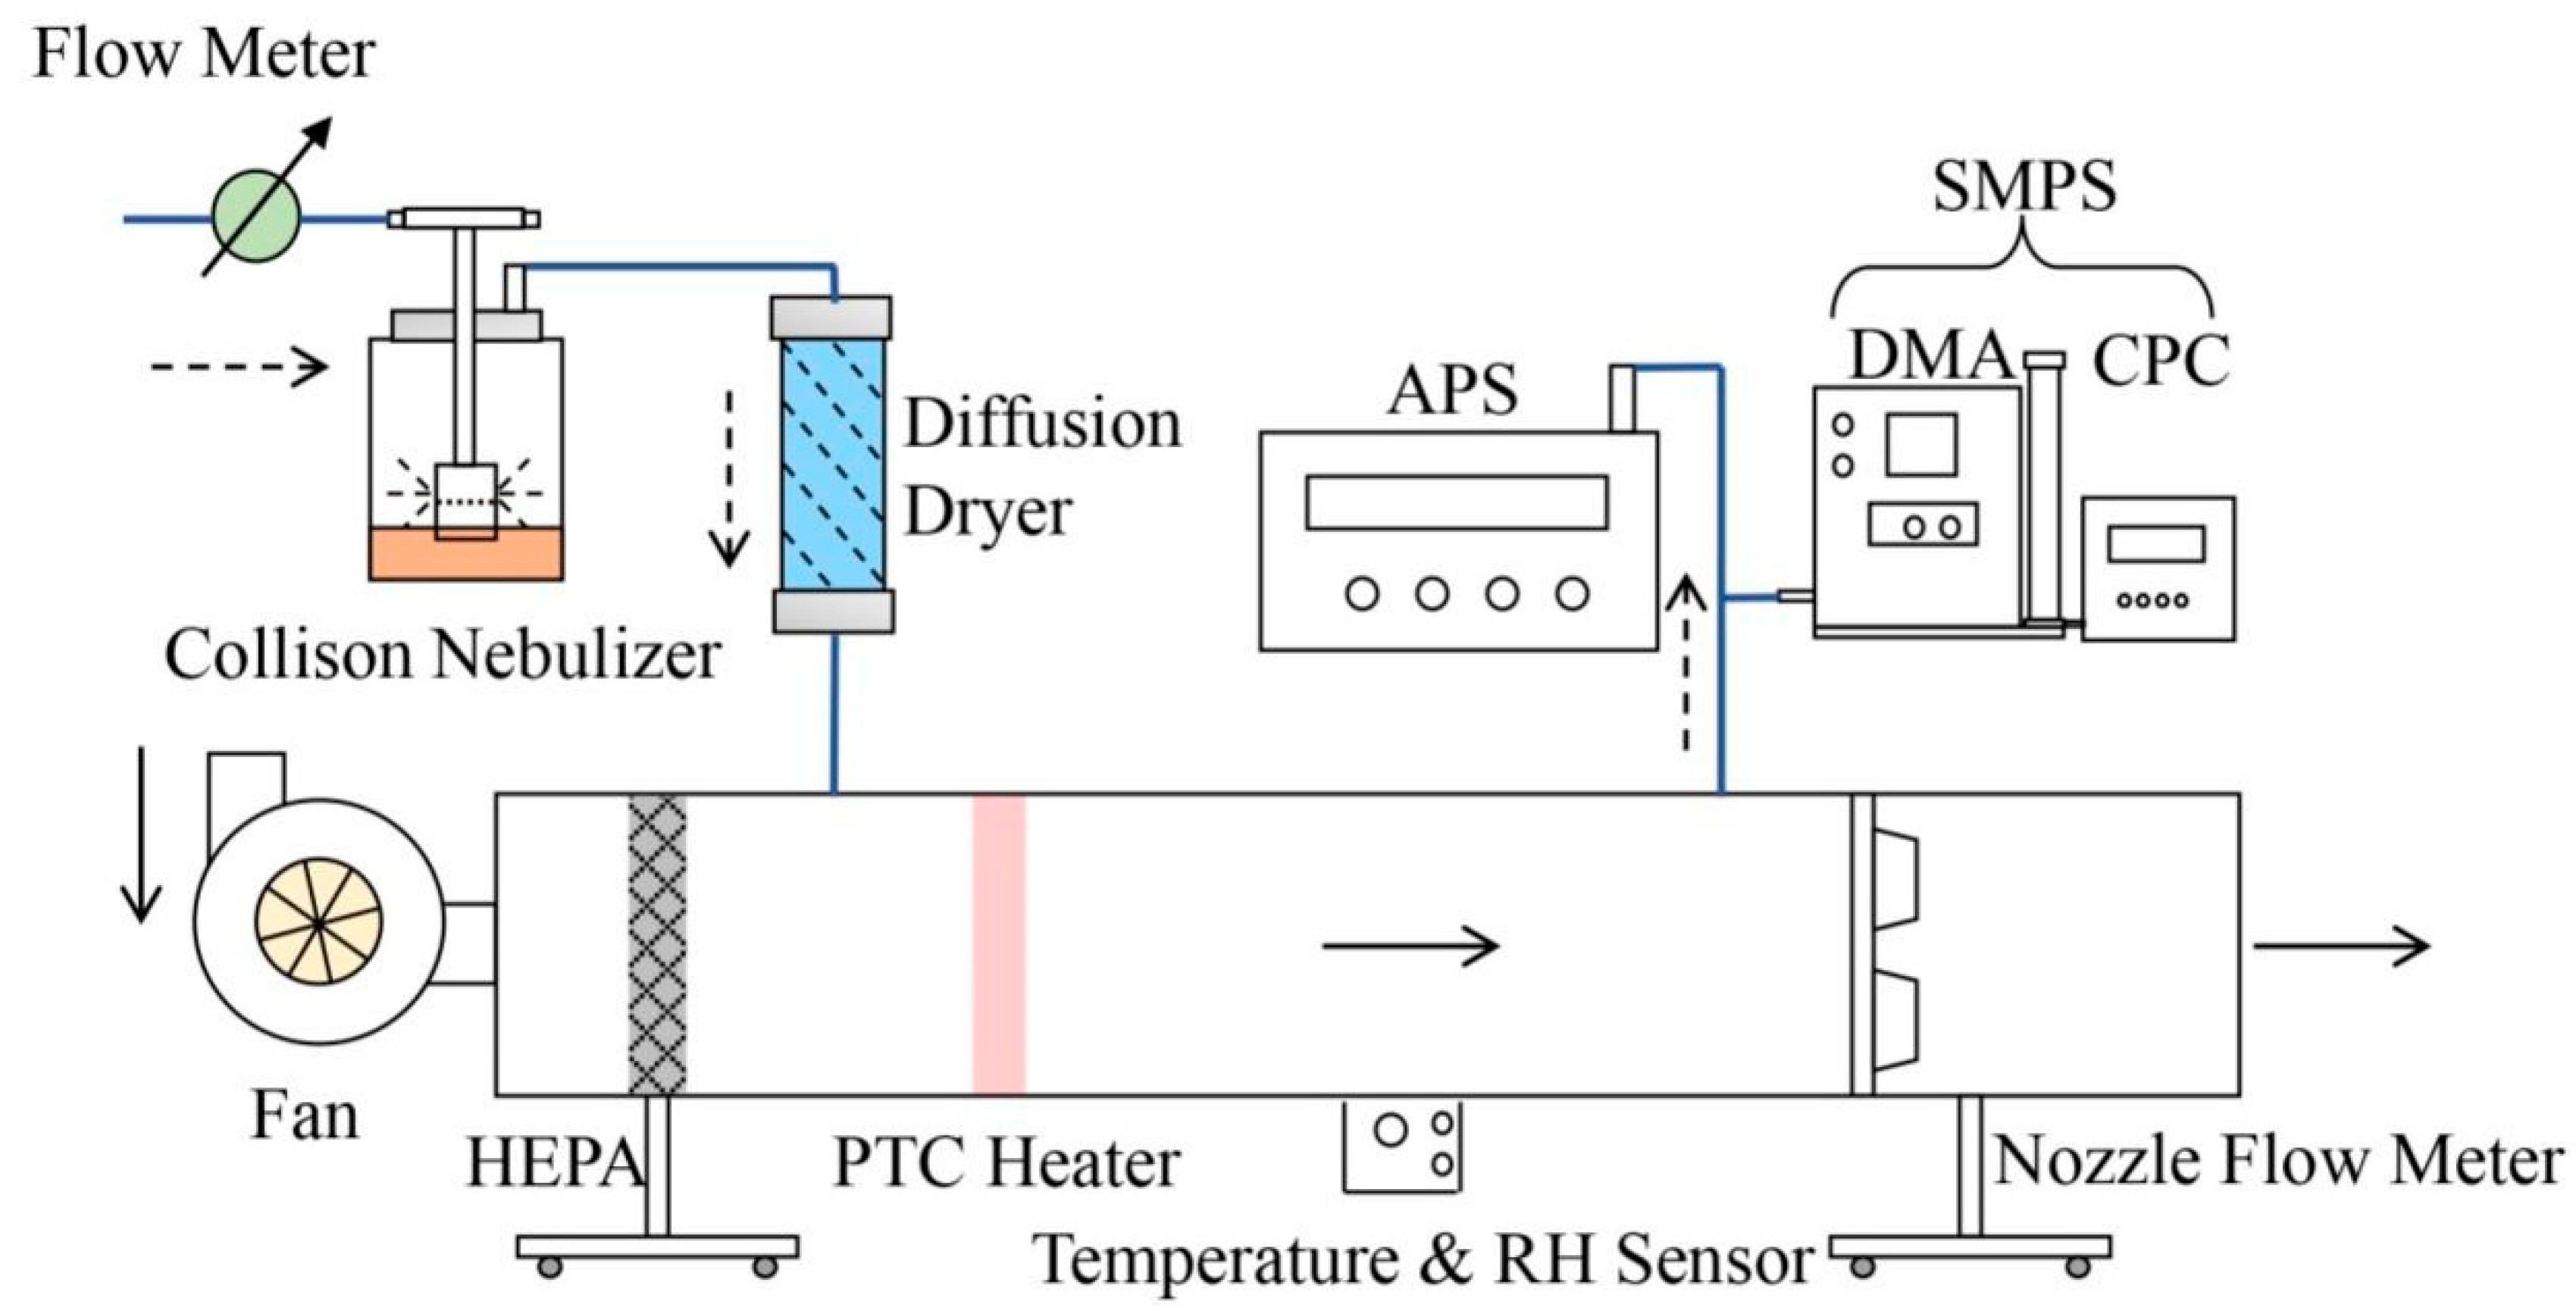
Figure 1. Schematic diagram of experimental setup.
Atmosphere 12 01669 g001
Figure 2. Normalized particle number (a) and volume (b) size distribution.
Atmosphere 12 01669 g002
Figure 3. Influence of compressed air’s pressure on the normalized size distribution (a) and size distribution (b) of particles generated by sucrose solution and olive oil.
Atmosphere 12 01669 g003
Figure 4. The influence of sucrose solution’s concentration on the normalized size distribution.
Atmosphere 12 01669 g004
Figure 5. The influence of different percentages on the normalized particle number (a) and volume (b) size distribution generated by olive and sugar mixture solution. pdN means the peak diameter of particle number distribution; pdV means the peak diameter of particle volume distribution.
Atmosphere 12 01669 g005
Figure 6. Relative error of mass-based filtration efficiency for PM2.5 measured with experimental aerosols and atmospheric aerosol.
Atmosphere 12 01669 g006
Figure 7. Relative difference measured by the TEOM and calibrated Dusttrak Model 8530.
Atmosphere 12 01669 g007
Table 1. Size distribution parameters of aerosols measured.
Aerosol Type or Generated by d g ( μ m ) σ g
Atmospheric0.019 (a)1.95 (a)
0.066 (b)1.85 (b)
0.134 (c)1.85 (c)
DEHS0.5231.97
PSL0.0472.07
Olive oil0.7312.39
20% sucrose solution0.0541.72
20% sucrose solution + olive oil (Vss:Voo = 1:2)0.0732.12
Note: (a) means mode 1, (b) means mode 2, and (c) means mode 3.
Publisher’s Note: MDPI stays neutral with regard to jurisdictional claims in published maps and institutional affiliations.