Article

A Preliminary Study of Radon Equilibrium Factor at a Tourist Cave in Okinawa, Japan

1
Graduate School of Health Sciences, Hirosaki University, 66-1 Honcho, Hirosaki 036-8564, Japan
2
Graduate School of Engineering and Science, University of the Ryukyus, Nishihara 903-0213, Japan
3
Faculty of Education, University of the Ryukyus, Nishihara 903-0213, Japan
4
Institute of Radiation Emergency Medicine, Hirosaki University, 66-1 Honcho, Hirosaki 036-8564, Japan
*
Author to whom correspondence should be addressed.
Present address: Fuji Electric Co., Ltd., 1 Fujimachi, Hino, Tokyo 191-8502, Japan.
Atmosphere 2021, 12(12), 1648; https://doi.org/10.3390/atmos12121648
Submission received: 18 November 2021 / Revised: 3 December 2021 / Accepted: 6 December 2021 / Published: 9 December 2021
(This article belongs to the Special Issue Atmospheric Radon Measurements, Control, Mitigation and Management)

Abstract

:
The International Commission on Radiological Protection (ICRP) issued its Publication 137, Occupational Intakes of Radionuclides: Part 3 in which the radon equilibrium factor is fixed as 0.4 for tourist caves; however, several studies have reported a different value for the factor and its seasonal variation has also been observed. In this study, the radon concentration, equilibrium equivalent radon concentration and meteorological data were measured, and the equilibrium factor was evaluated in a tourist cave, Gyokusen-do Cave located in the southern part of Okinawa Island in southwestern Japan. Radon concentrations were measured with an AlphaGUARD and their corresponding meteorological data were measured with integrated sensors. Equilibrium equivalent radon concentration was measured with a continuous air monitor. The measured radon concentrations tended to be low in winter and high in summer, which is similar to previously obtained results. By contrast, the equilibrium factor tended to be high in winter (0.55 ± 0.09) and low in summer (0.24 ± 0.15), with a particularly large fluctuation in summer. It was concluded that measurements in different seasons are necessary for proper evaluation of radon equilibrium factor.

1. Introduction

Radon (222Rn) is the second leading cause of lung cancer after tobacco smoking [1]. The decay of 226Ra in soil and rocks generates radon gas and in a closed space such as a cave, it can be presumed that high radon concentrations will be observed due to the stagnant air. In fact, radon concentrations of a hundred to tens of thousands of Bq m−3 have been observed in several caves around the world [2,3,4,5,6,7,8]. In 2017, the International Commission on Radiological Protection (ICRP) issued Publication 137, Occupational Intakes of Radionuclides: Part 3 in which the commission recommends a dose conversion factor for radon progeny of 6 mSv per mJ h m−3 for indoor workplace workers who are engaged in substantial physical activities, and for workers in tourist caves [9,10]. This value is equivalent to 34 nSv per Bq h m−3, which is approximately four times the dose conversion factor of 9 nSv per Bq h m−3 recommended in the United Nations Scientific Committee on the Effects of Atomic Radiation (UNSCEAR) 2006 report. Therefore, it is important to evaluate the effective dose for workers in tourist caves from radon.
On the other hand, it is necessary to obtain the equilibrium equivalent radon concentration (EERC) for evaluating the effective dose due to radon, which cannot be evaluated directly from the radon concentration. Therefore, although it is best to measure the EERC directly, its measurement is difficult. In general, the EERC is obtained by measuring radon concentration and multiplying it by the equilibrium factor Feq, which is the ratio of the EERC to the radon concentration. Thus, Feq is an important factor in the effective dose calculation.
The UNSCEAR 2006 report [11] recommended using a value of Feq = 0.4 for calculating indoor radon exposure. This value has been used in reports that evaluated the effective dose from indoor radon concentration [12,13]. ICRP Publication 137 also recommended using Feq of 0.4 for indoor workplaces and tourist caves [9]. The value of Feq is known to depend greatly on the environment of a site [14,15], and this is especially important in closed spaces such as underground mines and caves. Cigna [16] has summarized reports on Feq in caves by 12 researchers (the number of measurements was more than 880) and stated that the weighted average of Feq was 0.57. Chen and Harley [17] also summarized reports on Feq in a total of 136 underground show caves, tourist mines and thermal spas in 17 countries and noted that Feq varied from 0.10 to 0.85 and the weighted average was 0.39. Moreover, it is important to evaluate Feq in different seasons, as several studies have reported seasonal variation [18,19].
High radon concentrations have been observed in caves in Japan, as elsewhere in the world. Tanahara et al. [20] obtained radon concentrations ranging from 10 to 3000 Bq m−3 by a passive method using activated charcoal at Gyokusen-do Cave in Okinawa Prefecture. Fujimoto et al. [21] reported radon concentrations obtained by a grab sampling method at Akiyoshi-do Cave, Taisho-do Cave and Kagekiyo-do Cave in Yamaguchi Prefecture were in the ranges of 8–1700 Bq m−3, 29–3300 Bq m−3 and 1700–3400 Bq m−3, respectively. In addition, Fujimoto et al. obtained EERCs at the same caves in the ranges of 2–1000 Bq m−3, 22–2000 Bq m−3 and 890–1500 Bq m−3, respectively. Although Fujimoto et al. did not state the Feq, it would be approximately 0.6 when calculated. Thus, there are several reports on radon concentrations and EERCs in Japan; however, no report has been made on radon concentration, EERC and Feq simultaneously, continuously and seasonally in caves. It is therefore important to evaluate these values in various caves in Japan from the viewpoint of radiation protection for workers. In this study, a continuous air monitor (CAM) previously developed by Yamada et al. [22] was applied to make measurements at Gyokusen-do Cave which is one of the famous tourist caves in Japan. This study is a starting point for characterizing radon equilibrium factors at caves in Japan.

2. Materials and Methods

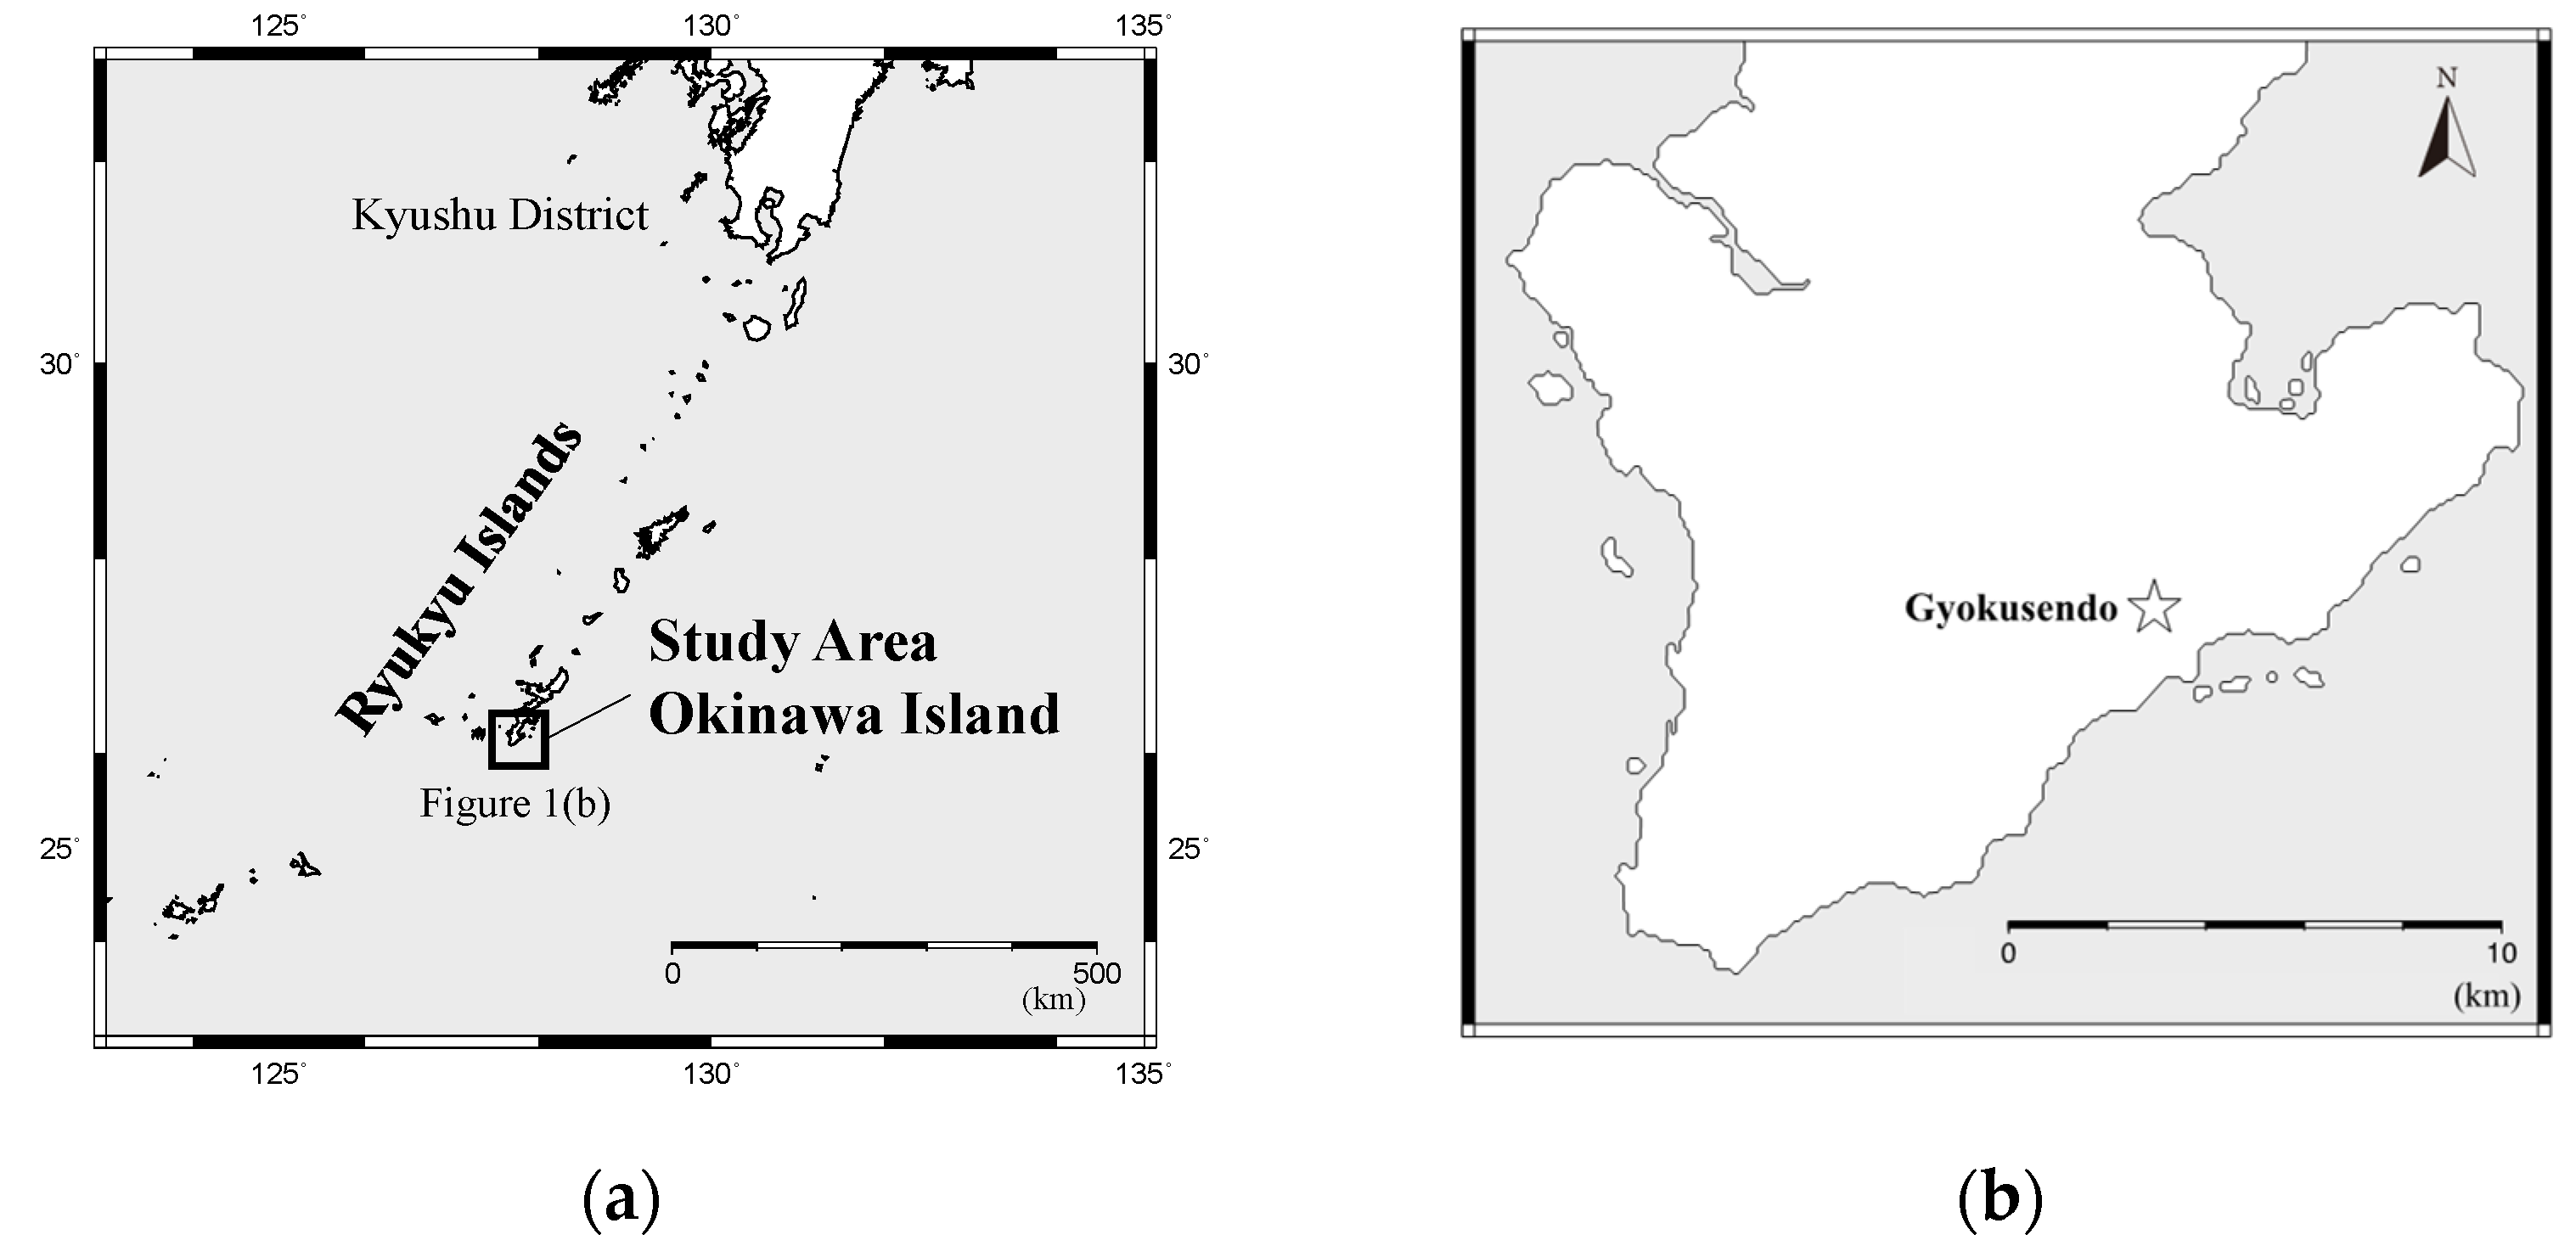
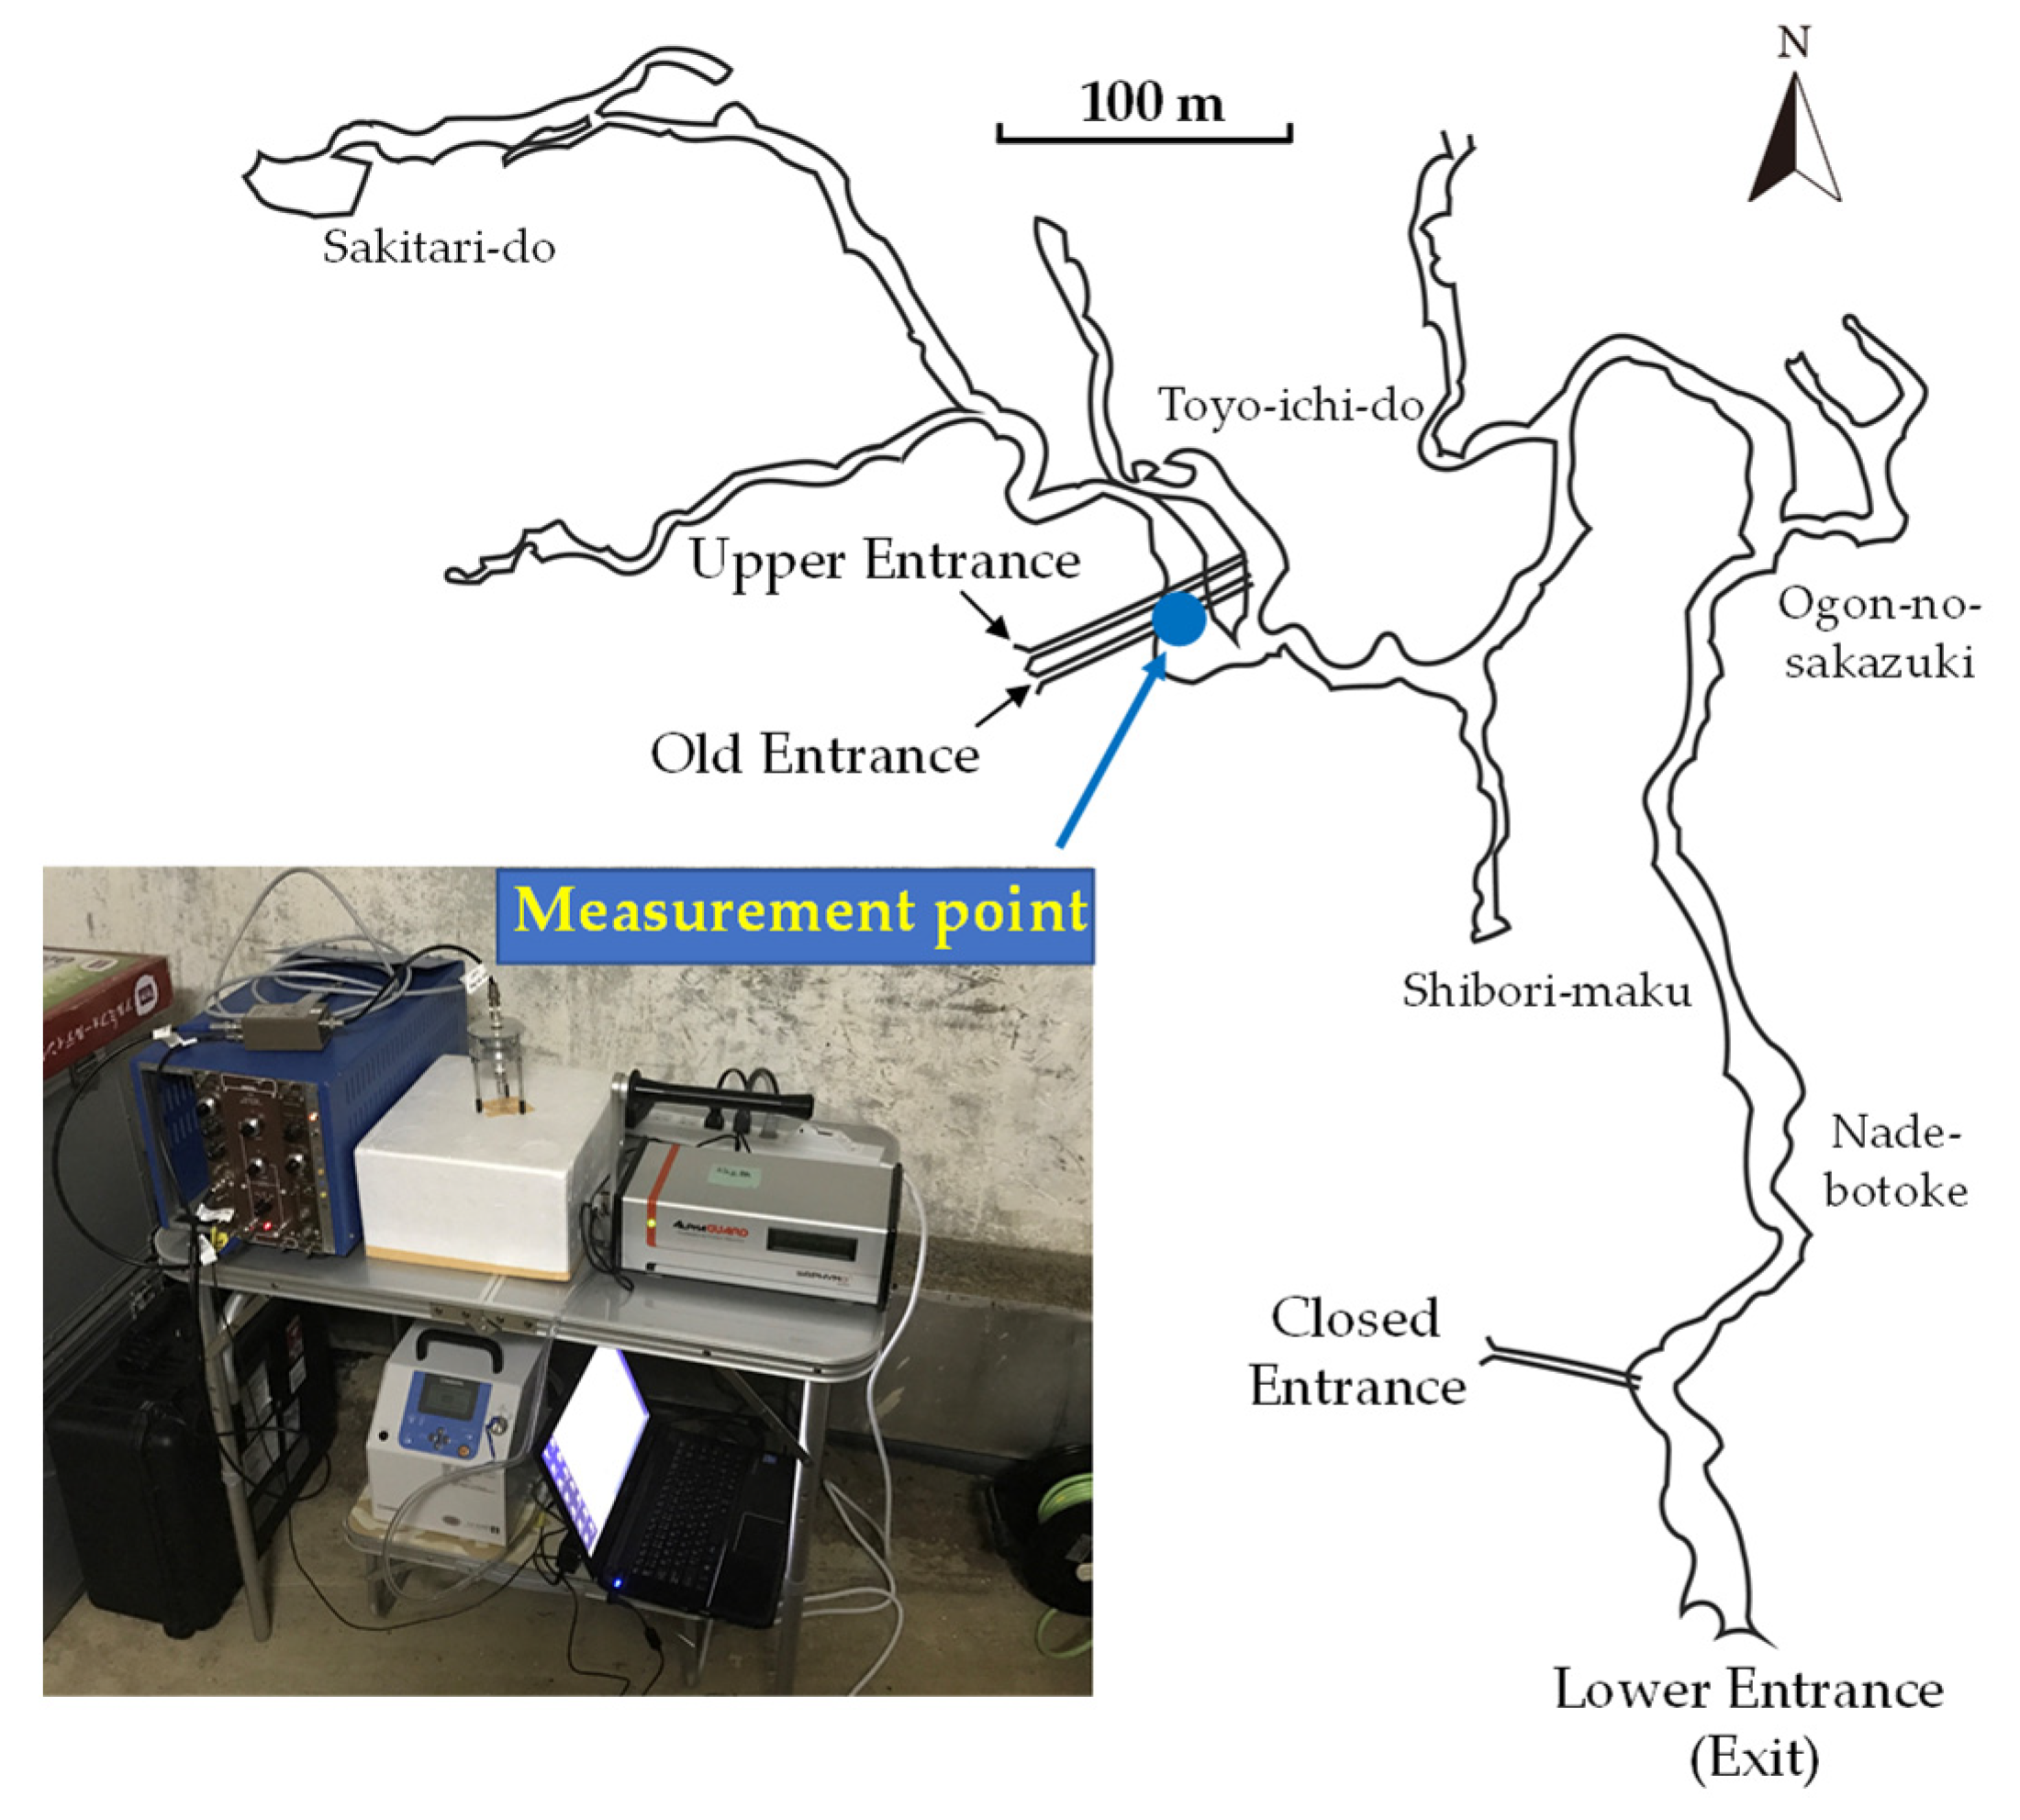
2.1. Measurement Site and Methods

Gyokusen-do Cave (26°08′ N, 127°45′ E) is located in the southern part of Okinawa Island, in southwestern Japan (Figure 1). This area has a subtropical oceanic climate, the annual average precipitation is more than 2000 mm, the annual average temperature is approximately 22 °C and the temperature rarely exceeds 35 °C because of the surrounding sea [23]. Gyokusen-do Cave was discovered in 1967 and opened to tourists in April 1972. It is now a part of the tourist attraction called “Okinawa World” and is visited by one million people a year. Gyokusen-do Cave is a limestone cave situated in a 120-m-thick body of Ryukyu limestone; its total length reaches 5000 m, of which approximately 900 m is open for tourism [24,25].
In this study, radon concentrations, EERC and meteorological data, which consisted of temperature, relative humidity and atmospheric pressure, were measured in the middle of the old entrance to Gyokusen-do Cave (Figure 2 and Figure 3) in January 2017 and July 2017. This was selected as the measurement site since the old entrance is the main route for ventilation in the cave [23]. Radon concentrations were measured with a pulse ionization chamber (AlphaGUARD, Saphymo GmbH, Frankfurt, Germany) in the diffusion mode at a height of 0.75 m. The corresponding meteorological data were measured with integrated sensors of the AlphaGUARD. The measurement interval for the chamber was set to 60 min. EERC was measured with the CAM [22] at a height of 1 m. The measurement interval of the CAM was set to 60 min, and the flow rate was set to 10 L min−1. The AlphaGUARD and the CAM were placed next to each other. The measurement period was about 24 h for the January measurement and about 48 h for the July measurement.
Feq was calculated by dividing the obtained EERC by the measured radon concentration. In addition, for the uncertainty of radon concentration, only the uncertainty for the counts obtained by AlphaGUARD (k = 1) was adopted. For the uncertainty of EERC, the uncertainty of potential alpha energy concentration (PAEC) and of conversion factor were taken into account from Equation (3) described below. Finally, the uncertainty of Feq was combined from the uncertainty of radon concentration and of EERC.

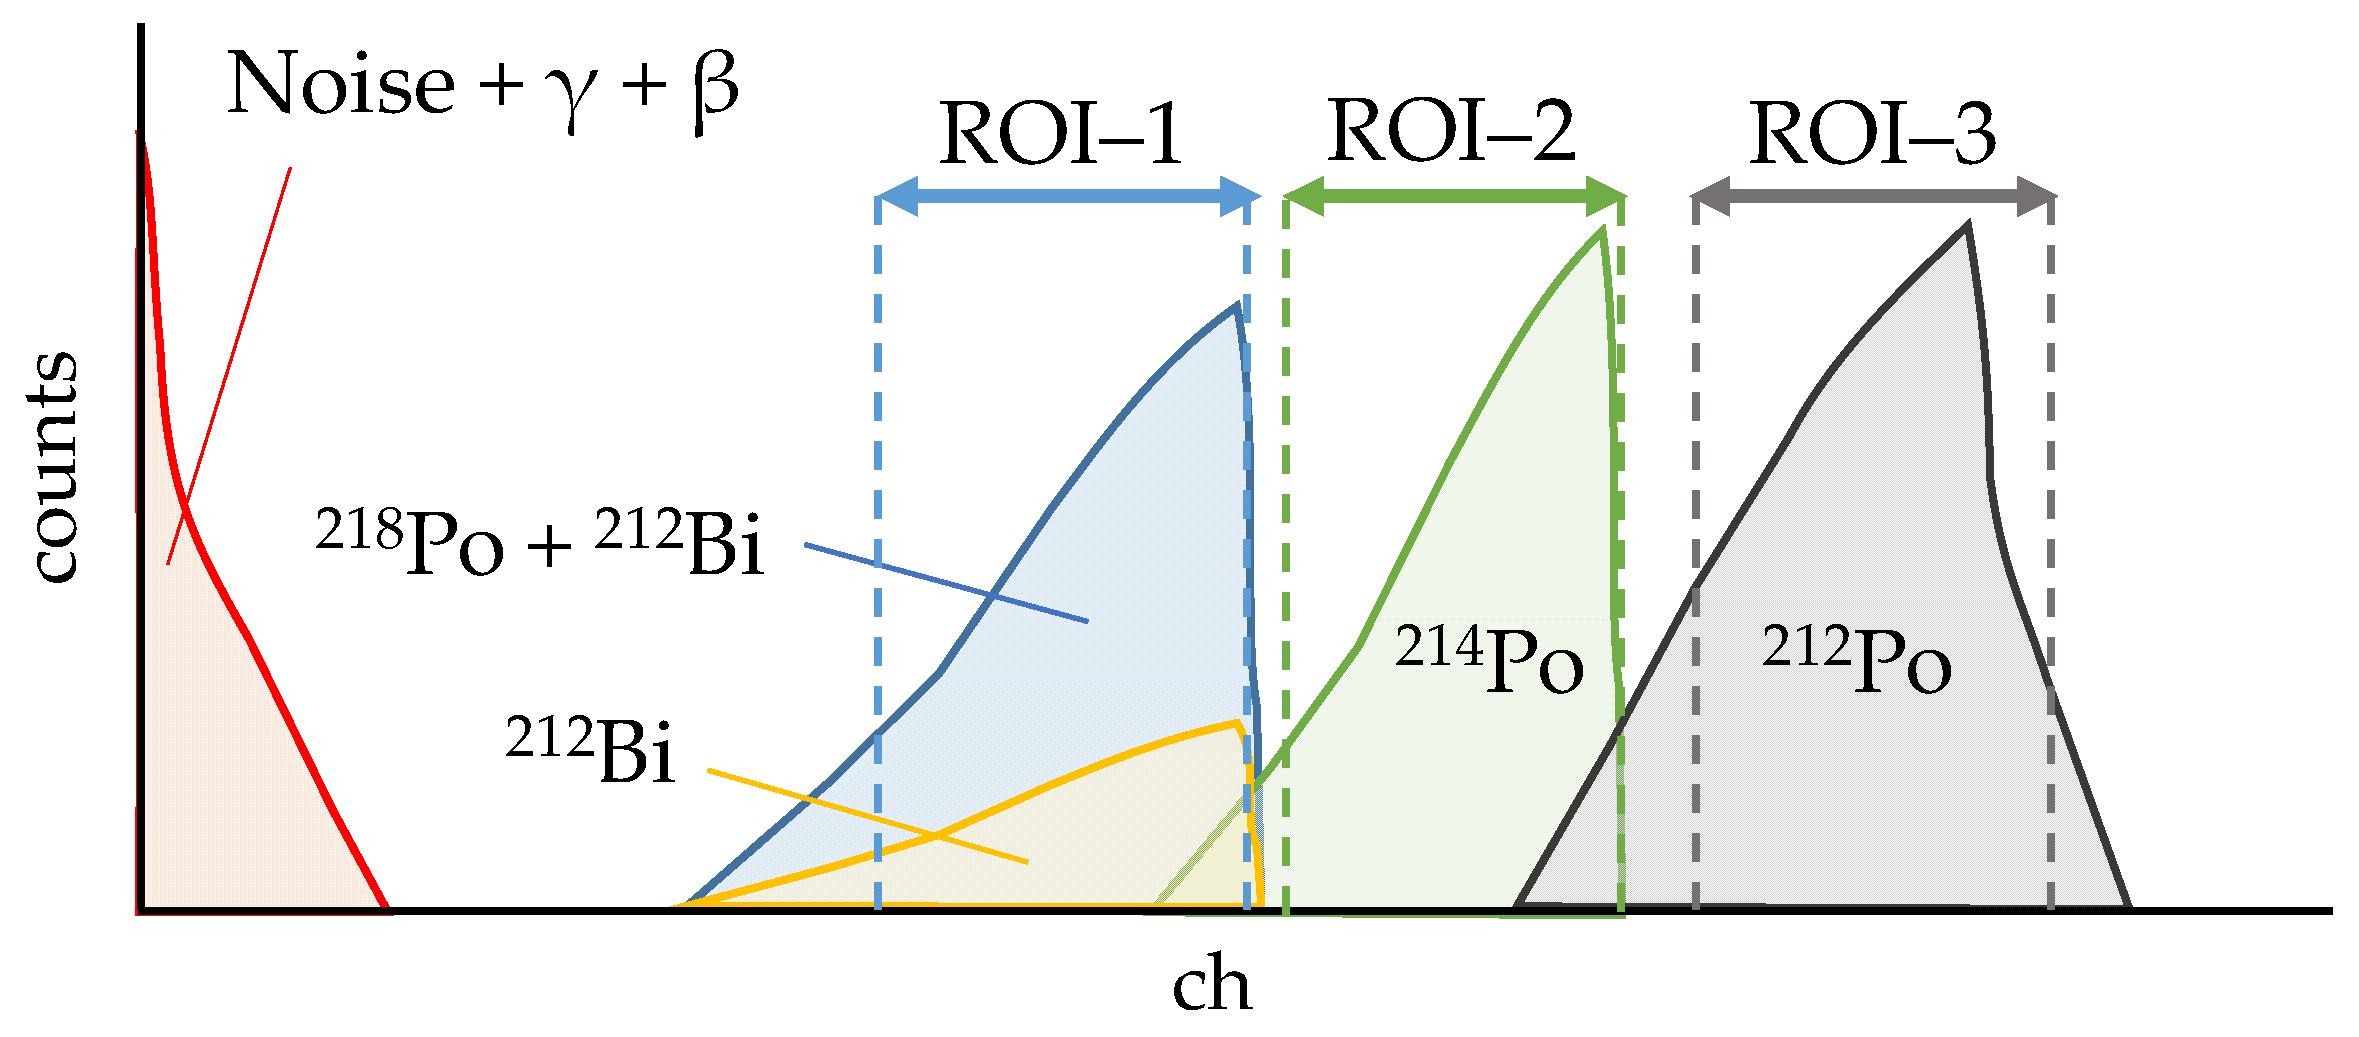
2.2. Evaluation Method of EERC Using the CAM

The International Commission on Radiation Units and Measurements (ICRU) defines two equations for calculating EERC: one is based on individual concentration of short-lived radon progeny, and the other is based on PAEC [26]. In these equations, EERC is defined as the concentration of radon in air, in equilibrium with its short-lived decay products, which would have the same potential alpha energy concentration as the existing non-equilibrium mixture [11]. PAEC is defined as the time integral of the potential alpha energy concentration in air to which an individual is exposed over a given time period [11] and an algorithm for calculating PAEC was given by Tokonami et al. [27]. It was adopted here in the evaluation of EERC.
When radioactive aerosol particles generated by natural radionuclides are measured using the CAM, three peaks from alpha particles due to radon and thoron progeny are observed (Figure 4). It is necessary to evaluate the counts of 218Po and 214Po because the PAEC calculation algorithm by Tokonami et al. uses these counts. Therefore, regions of interest (ROIs) were set to include each peak as shown in Figure 4, and the counts of 218Po and 214Po were evaluated from Equations (1) and (2).
N P 218 o = N ROI 1 N ROI 2   ×   C R P 214 o ROI 1 N ROI 3   ×   C F η Ch P 218 o
N P 214 o = N ROI 2 N ROI 3   ×   C R P 212 o ROI 2 η Ch P 214 o
Here, N i is the counts of i–radionuclide or ROI–i, C R i ROI j is the ratio of the counts in the ROI of i–radionuclide to the counts of i–radionuclide in ROI–j (i.e., the contribution ratio of i–radionuclide to ROI–j), and η Ch i is the percentage of i–radionuclide measured in ROI of i–radionuclide to all energies (i.e., channel efficiency). In addition, when calculating the counts of 218Po in the environment that includes thoron progeny, 212Bi is observed in the ROI of 218Po because the alpha energy of 212Bi (6.05 MeV) is almost equal to that of 218Po (6.00 MeV). As a result, the 218Po counts are overestimated. It is necessary to estimate the counts of 212Bi from the counts of 212Po, which is a decay product of 212Bi and is in radioactive equilibrium, and subtract it from the counts of ROI–1. Therefore, the third term of the numerator of Equation (1) includes a subtraction from the counts of ROI–1 for the estimated counts of 212Bi which are obtained by multiplying the counts of ROI of 212Po (i.e., ROI–3 in Figure 4) by the ratio of the counts of 212Po and the counts of 212Bi (conversion factor: CF).
Next, the counts of 218Po and 214Po calculated by Equations (1) and (2), respectively, were used to evaluate the PAEC, C P (eV m−3), as reported by Tokonami et al. [27]. Finally, the calculated C P was substituted into the following equation to evaluate the EERC, C eq (Bq m−3) [26].
C eq   =   C P 3.47 × 10 10
Here, the constant in the denominator is the conversion factor between EERC and PAEC (eV Bq−1) as defined by the ICRU.
It should be noted that each of the parameters required for calculation of PAEC was evaluated by an experiment using a radon chamber and a thoron chamber at the Institute of Radiation Emergency Medicine, Hirosaki University, Japan [28], and by the method of energy spectrum acquisition by Tamakuma et al. [29].

3. Results

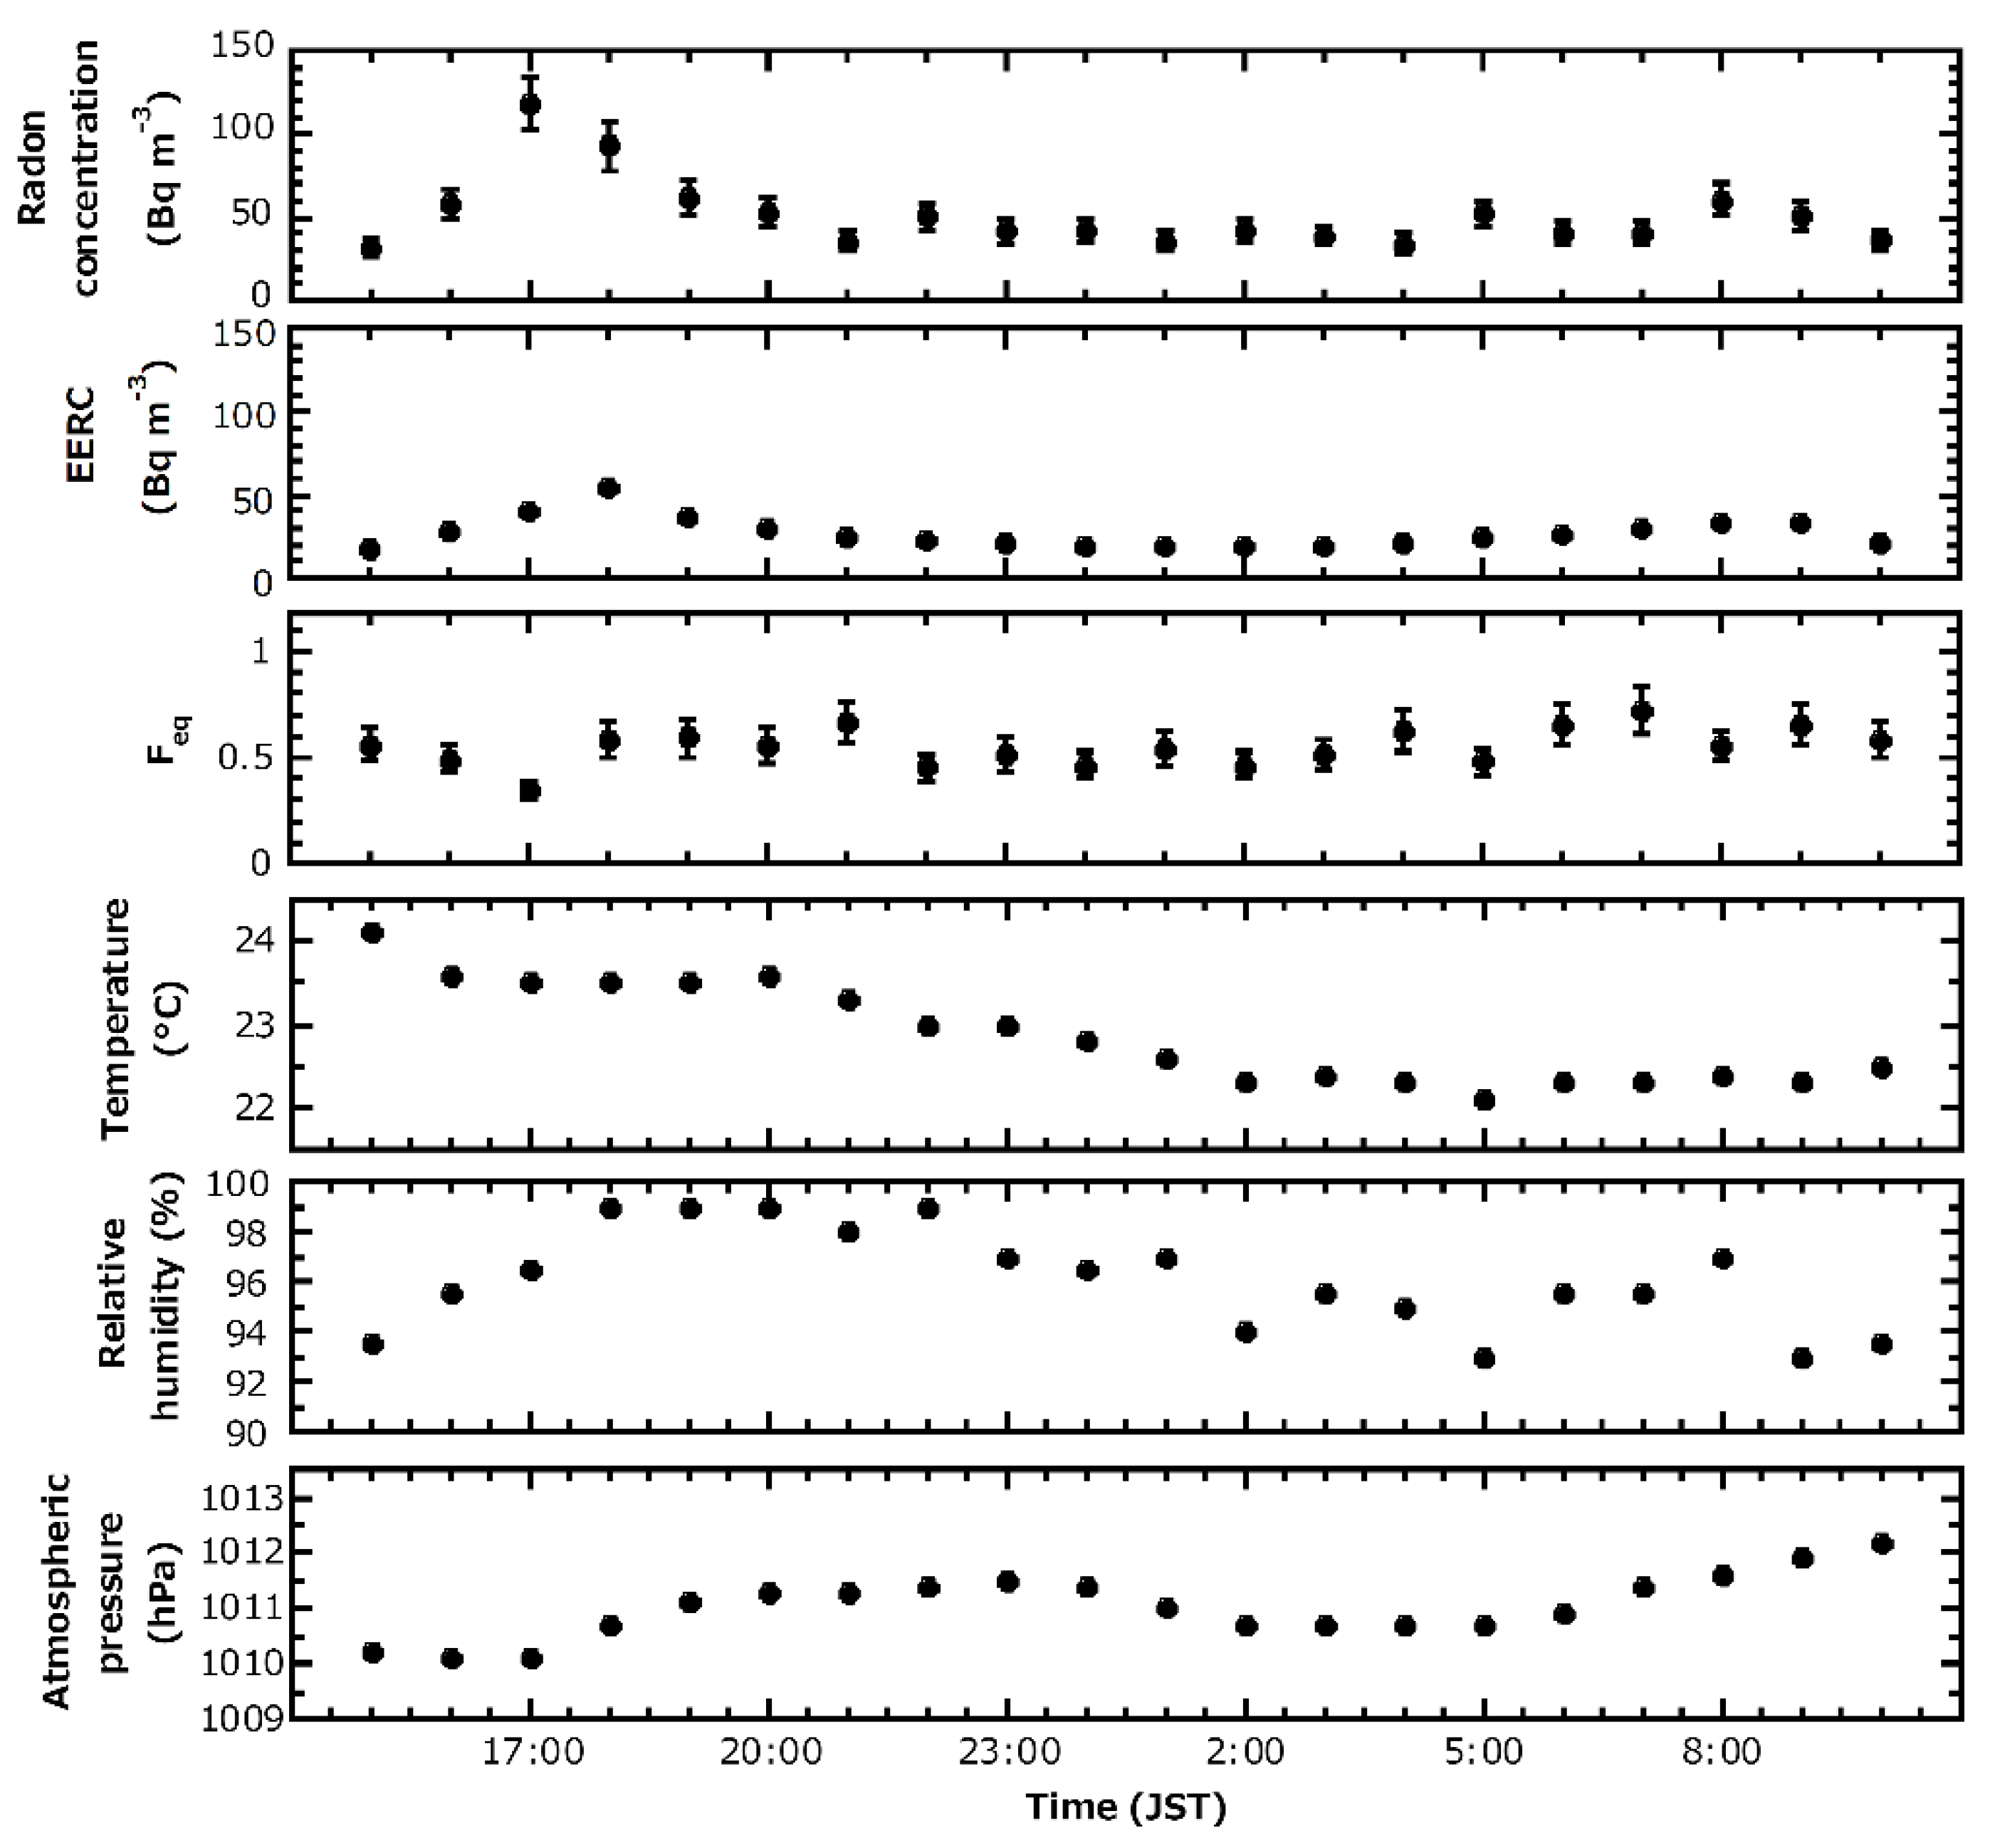
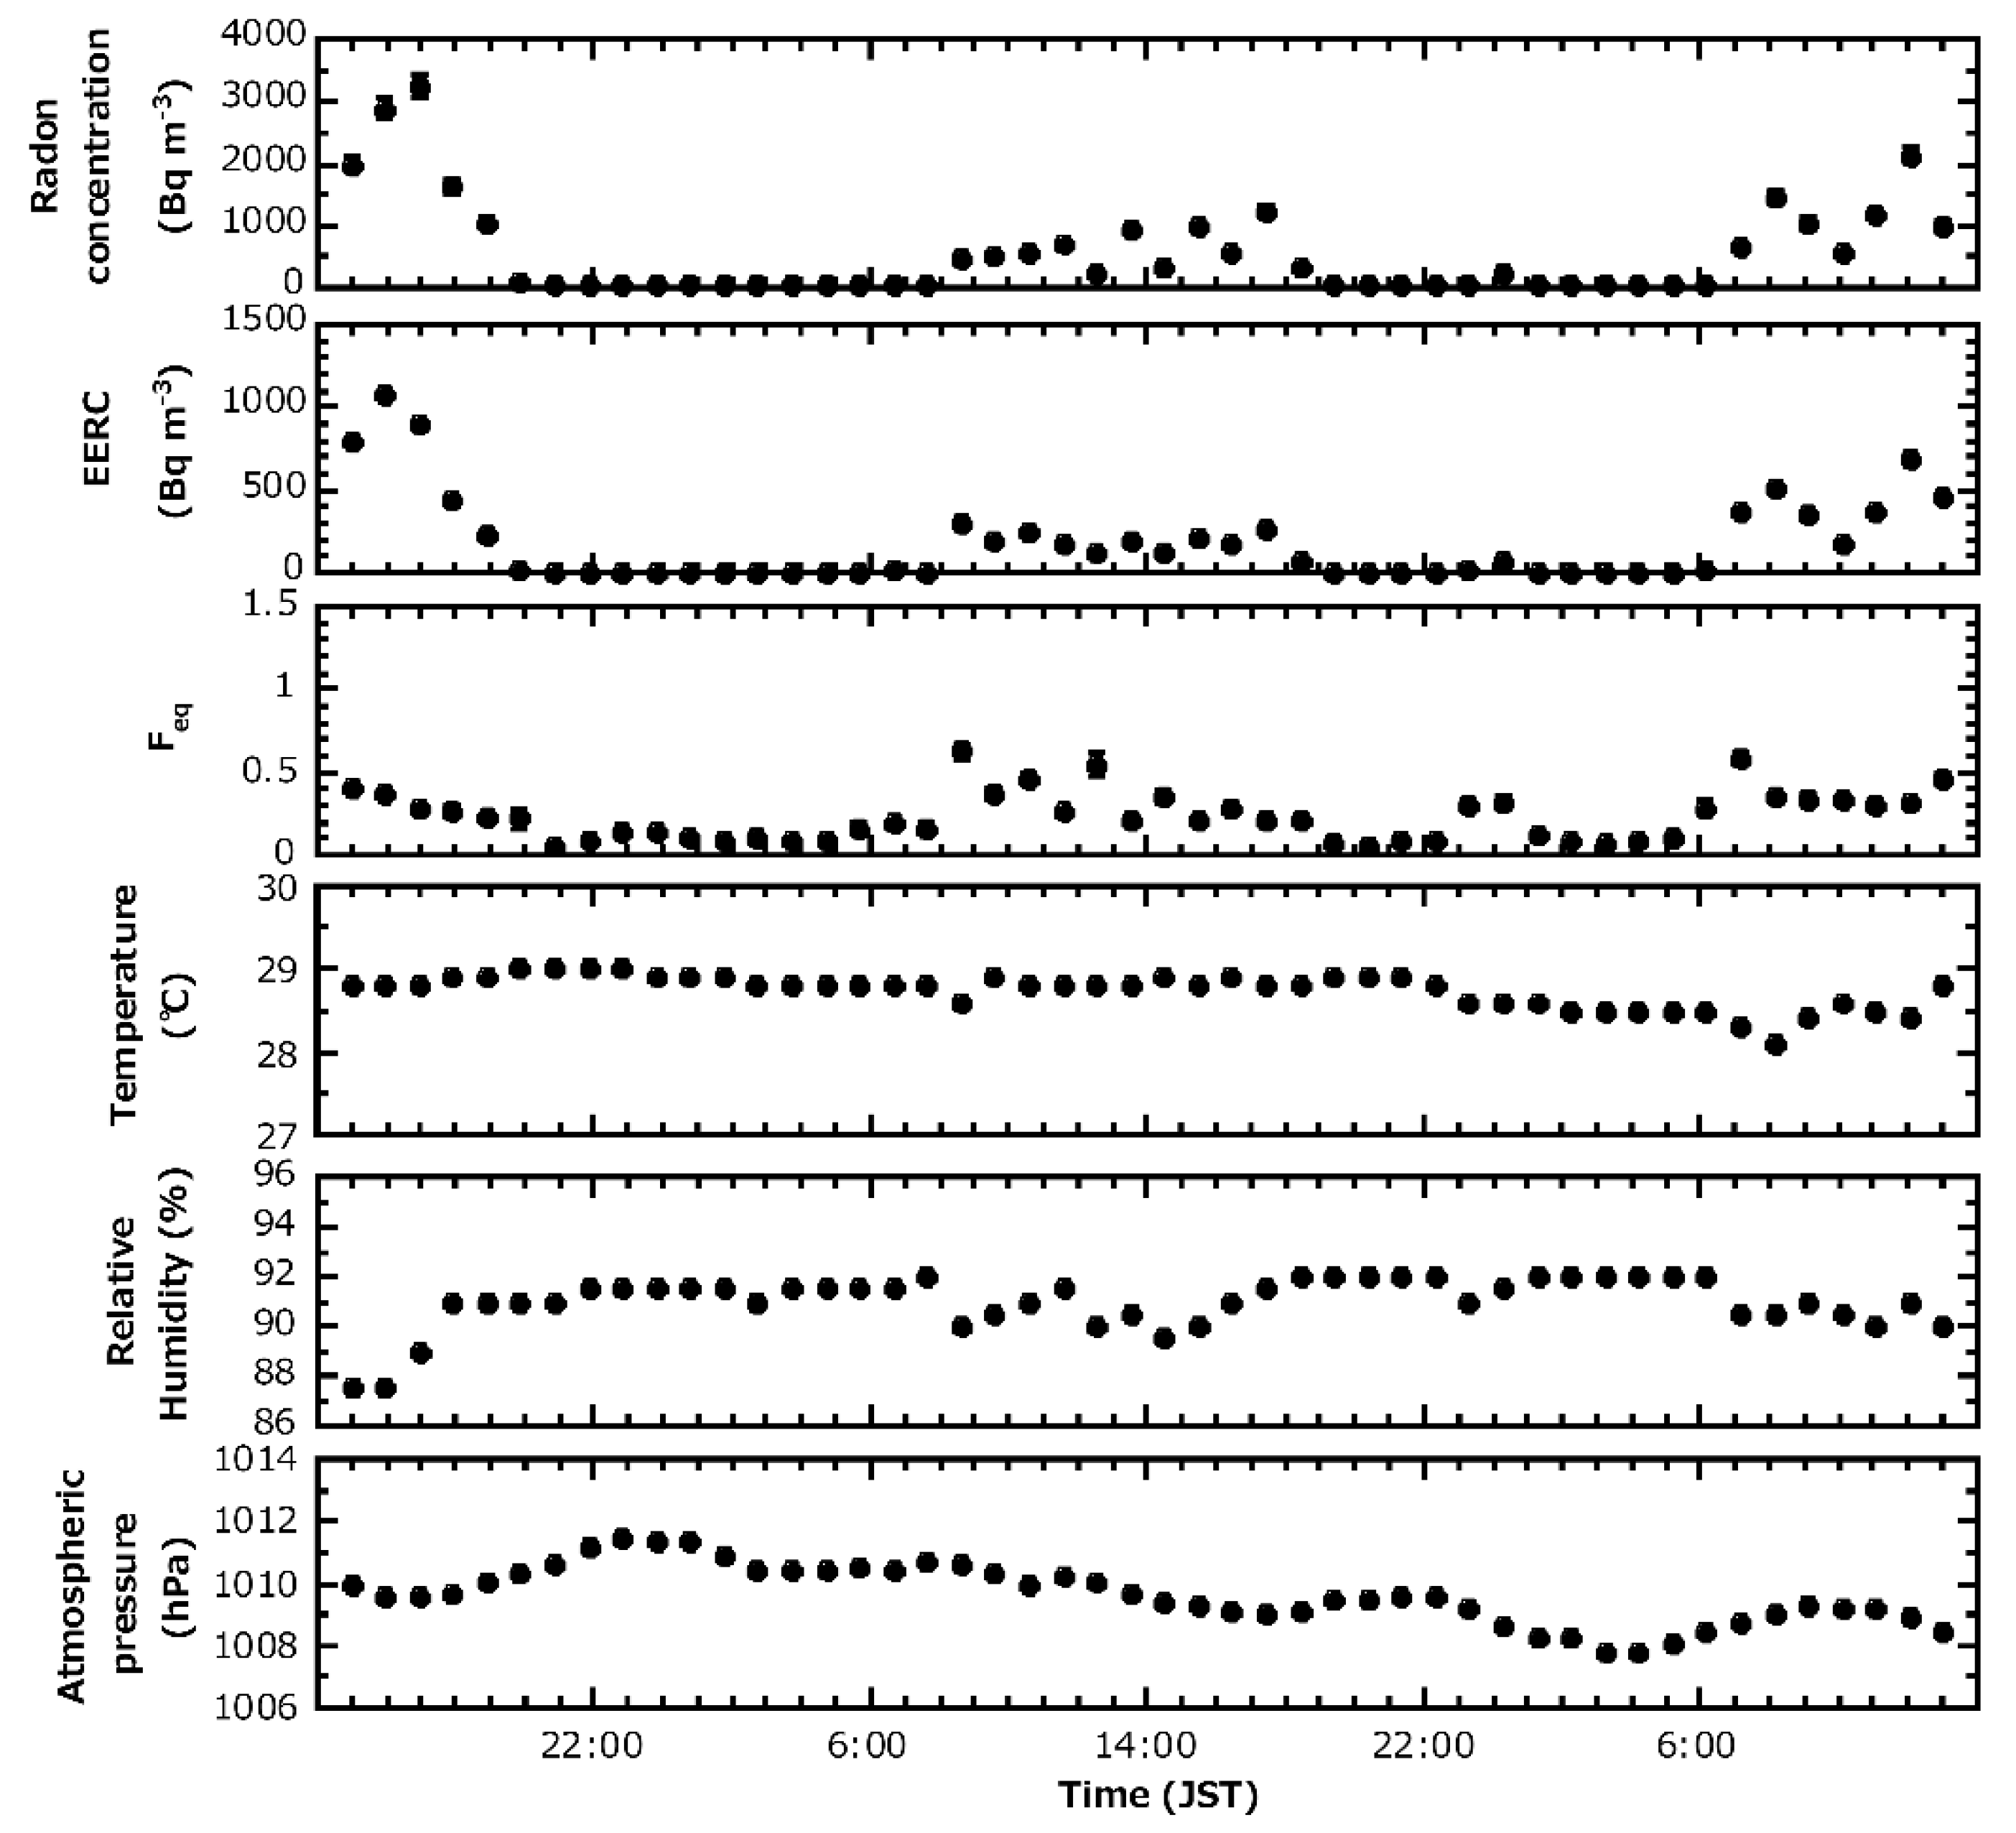
3.1. January 2017 Measurement

The results of measuring radon concentrations, EERC and meteorological data in January 2017 (i.e., winter) are shown in Figure 5. The radon concentrations in the cave fluctuated in the range of 32–118 Bq m−3 with an arithmetic mean of 51 Bq m−3. The EERC fluctuated in the range of 18–55 Bq m−3 with an arithmetic mean of 28 Bq m−3. From these results, Feq varied from 0.35 to 0.72 with an arithmetic mean (±standard deviation) of 0.55 ± 0.09. The error bars in Figure 5 indicate the respective uncertainties (k = 1). The relative standard uncertainties of radon concentration were 14–19%; the relative combined standard uncertainties of EERC and Feq were around 2% and approximately 12–16%, respectively. The contribution of standard uncertainties of radon concentration is more than 90% of the combined standard uncertainties of Feq.

3.2. July 2017 Measurement

The results of measuring radon concentrations, EERC and meteorological data in July 2017 (i.e., summer) are shown in Figure 6. The radon concentrations in the cave fluctuated in the range of 29–3232 Bq m−3 with an arithmetic mean of 568 Bq m−3. The EERC fluctuated in the range of 2–1069 Bq m−3 with an arithmetic mean of 183 Bq m−3. From these results, Feq varied from 0.05 to 0.63 with an arithmetic mean (±standard deviation) of 0.24 ± 0.15. The error bars in Figure 6 indicate the respective uncertainties (k = 1). The relative standard uncertainties of radon concentration were approximately 6–40%; the relative combined standard uncertainties of EERC and Feq were approximately 1–15% and 5–30%, respectively. The contribution of standard uncertainties of radon concentration is more than 75% of the combined standard uncertainties of Feq.

4. Discussion

In both measurement seasons, the variation of the radon concentrations measured by AlphaGUARD and the variation of the EERCs measured by CAM were in relatively good agreement. The remarkable increase and decrease in radon concentrations and EERCs are considered to be due to the cave air ventilation, based on the meteorological data. Ooka et al. [23] reported that the system of cave air ventilation differed greatly between winter and summer. In winter, air is flowing from the lower entrance to the upper and old entrances (cf. Figure 3) with active ventilation, and there is large inflow of air from outside the cave. Contrarily, in summer, although the air flows from the upper and old entrances to the lower entrance, ventilation is poor and the air is stagnant. Considering this report together with the results in this study, it appears that radon concentration increases with increasing relative humidity in winter (especially immediately after the start of measurement) because the high humidity air in the cave flows from the middle of the cave to the upper and old entrances. The radon concentration is not high, however, because it is diluted by outside air containing low radon concentration, due to the active ventilation in the cave. During summer, radon concentration increases with increasing relative humidity, as well as in winter. The radon concentration also seems to increase when the temperature drops. It is assumed that since the temperature of the air in the cave is approximately 25 °C and the air in the outside is approximately 30 °C, the air is flowing from inside the cave to the measurement point. Although some of the above assumptions can be considered as valid based on the limited meteorological data and the previous report data, one of the limitations of this study is that the cave air ventilation was not fully observed due to the lack of meteorological instruments at multiple points. In addition, since the measurement site is the middle of the old entrance to cave, the meteorological data might be affected by the external environment of the cave.
Radon concentrations were lower in winter (an arithmetic mean of 51 Bq m−3) and higher in summer (an arithmetic mean of 568 Bq m−3). This seasonal variation is similar to the results of past measurement of radon concentrations in Gyokusen-do Cave [20]. In addition, similar seasonal variations have been reported in many caves around the world [2,6,7,30,31,32,33]. Tanahara et al. [20,34] and Shiroma et al. [24] have proposed their own mechanisms as the cause of this seasonal variation. The former attributed the lower radon concentration in winter to the active cave air ventilation. Contrarily, the high radon concentration in summer was attributed to the poor cave air ventilation and the stagnant air. Ooka et al. [23] measured the cave air ventilation using carbon dioxide and determined that it was active in winter and less active in summer, which supports the mechanism proposed by Tanahara et al. [20,34]. Shiroma et al. [24] thought that the atmospheric radon concentration in the cave might have been supplied by dripping water from the limestone cave, and that the radon concentration in dripping water had the same seasonal variation as the atmospheric radon concentration.
Feq is higher in winter (0.55 ± 0.09) and lower in summer (0.24 ± 0.15). These values differ from the ICRP recommendation in caves of Feq = 0.4 [9]. Many studies in caves around the world have similarly reported that the Feq evaluated differed from the recommended Feq [18,19,35,36,37], however, and Chen and Harley [17] concluded that the recommended Feq value should be used with the understanding that its variability in actual caves can be more than ±50%. On the other hand, the arithmetic mean (±standard deviation) of the respective measurements for summer and winter is 0.33 ± 0.20, and the annual average from the seasonal average is 0.40. Therefore, it might be close to the ICRP recommendation value if considered as an annual average, however, it is difficult to conclude from only results of this measurement due to the insufficient number of samples. In addition, a wide range of daily variations was observed for Feq in this study, and similar daily variations have been observed in other studies making continuous measurements of Feq [38,39].
The seasonal variation of Feq observed in this study corresponds with that reported by Jovanovič [18] for Medvejek Cave and other caves. Moreover, the seasonal variation of Feq is known to show an opposite trend to that of radon concentrations. Vaupotič [19] reported the following results from measurements in the Postojna Cave: Feq became lower with increasing radon concentration; and the unattached fraction of short-lived radon decay products in the atmosphere of the cave was high in summer and relatively low in winter. The results of this study agree with the first point. Regarding the second point, several researchers have reported that the relationship between the unattached fraction and Feq was negatively correlated and followed a log-normal distribution [40,41,42]. Therefore, it can be presumed that the seasonal variation of Feq observed in this study is related to the variation of the unattached fraction of atmospheric radon progeny in the cave. It is concluded from these results that measurements in different seasons are necessary for proper evaluation of Feq, and it would be even better to measure the unattached fraction and the aerosol concentration which strongly affects the unattached fraction in order to identify the source of variation in Feq.
It should be noted that this measurement has been conducted in a short period of time (1–2 days) and at a single location which in the middle of the old entrance to cave. When conducting detailed investigation, it would be important to carry out long-term measurement more than one week and to conduct measurements at multiple points in the cave, from the viewpoint of representativeness of the monitoring data.

5. Conclusions

This article described the results of measurements of radon concentration and the equilibrium equivalent radon concentration (EERC), and the evaluation results of equilibrium factor, Feq, in a tourist cave, the Gyokusen-do Cave located in the southern part of Okinawa Island, Japan. The measurements were carried out for two periods, in winter (January 2017) and in summer (July 2017). Although the evaluated equilibrium factor was different from the ICRP recommendation for it in caves, the same is true for many studies in caves around the world. In addition, the equilibrium factor was found to be higher in winter (0.55 ± 0.09) and lower in summer (0.24 ± 0.15), with particularly large fluctuation in summer. It was not possible to determine the cause of the seasonal variation of the equilibrium factor only from the measurement items in this study. Moreover, although the trends of radon concentration, EERC and Feq, were able to be roughly estimated from the data obtained in this study, one of the limitations of this preliminary study is that a large enough number of samples necessary for representativeness of the monitoring data were not able to be collected. Therefore, the authors suggest that long-term measurements at multiple points in the cave in different seasons are necessary for proper evaluation of Feq.

Author Contributions

Conceptualization, R.Y., M.H. and S.T.; methodology, R.Y., M.H. and S.T.; validation, Y.T., T.S., S.N., Y.S., M.F., H.H. and N.A.; formal analysis, R.Y., H.H.; investigation, R.Y., Y.T., T.S., S.N., Y.S., M.F., M.H., N.A. and S.T.; resources, M.H. and S.T.; data curation, R.Y. and H.H.; writing—original draft preparation, R.Y.; writing—review and editing, R.Y., Y.T., M.H. and S.T.; visualization, R.Y.; supervision, M.H. and S.T.; project administration, M.H. and S.T.; funding acquisition, M.H. and S.T. All authors have read and agreed to the published version of the manuscript.

Funding

This research was funded by the Japan Society for the Promotion of Science KAKENHI, Grant Number 16H02667 and Hirosaki University Institutional Research Grant.

Institutional Review Board Statement

Not applicable.

Informed Consent Statement

Not applicable.

Data Availability Statement

Not applicable.

Acknowledgments

Nanto Co., Ltd. and particularly Ooka Sohei of Nanto Co., Ltd. are thanked for their help in measurements at Gyokusen-do Cave, and for providing the measurement site and use of electricity.

Conflicts of Interest

The authors declare no conflict of interest.

References

  1. World Health Organization (WHO). WHO Handbook on Indoor Radon; WHO Press: Geneva, Switzerland, 2009; pp. 1–94. [Google Scholar]
  2. Wilkening, M.H.; Watkins, D.E. Air exchange and 222Rn concentrations in the Carlsbad Caverns. Health Phys. 1976, 31, 139–145. [Google Scholar] [CrossRef]
  3. Solomon, S.B.; Cooper, M.B.; O’Brien, R.S.; Wilkinson, L. Radon exposure in a limestone cave. Radiat. Prot. Dosim. 1992, 45, 171–174. [Google Scholar] [CrossRef]
  4. Lario, J.; Sánchez-Moral, S.; Cuezva, S.; Taborda, M.; Soler, V. High 222Rn levels in a show cave (Castañar de Idor, Spain): Proposal and application of management measures to minimize the effects on guides and visitors. Atmos. Environ. 2006, 40, 7395–7400. [Google Scholar] [CrossRef]
  5. Amin, R.M.; Eissa, M.F. Radon level and radon effective dose rate determination using SSNTDs in Sannur cave, Eastern desert of Egypt. Environ. Monit. Assess. 2008, 143, 59–65. [Google Scholar] [CrossRef]
  6. Lu, X.; Li, L.Y.; Zhang, X. An environmental risk assessment of radon in Lantian karst cave of Shaanxi, China. Water Air Soil Pollut. 2009, 198, 307–316. [Google Scholar] [CrossRef]
  7. Somlai, J.; Hakl, J.; Kávási, N.; Szeiler, G.; Szabó, P.; Kovács, T. Annual average radon concentration in the show caves of Hungary. J. Radioanal. Nucl. Chem. 2011, 287, 427–433. [Google Scholar] [CrossRef]
  8. García Paz, F.A.; Gonzalez Romero, Y.A.; Zalakeviciute, R. Radon (222Rn) concentrations in the touristic Jumandy cave in the Amazon region of Ecuador. J. Radiat. Res. 2019, 60, 759–767. [Google Scholar] [CrossRef] [Green Version]
  9. International Commission on Radiological Protection (ICRP). Occupational Intakes of Radionuclides: Part 3. ICRP Publication 137. Ann. ICRP 2017, 46, 1–487. [Google Scholar] [CrossRef] [PubMed]
  10. Tokonami, S. Some thought on new dose conversion factors for radon progeny inhalation. Jpn. J. Health Phys. 2018, 53, 282–293, (In Japanese with English Abstract). [Google Scholar] [CrossRef] [Green Version]
  11. United Nation Scientific Committee on the Effects of Atomic Radiation (UNSCEAR). UNSCEAR 2006 Report to the General Assembly, with Scientific Annexes; United Nations: New York, NY, USA, 2009; Volume II. [Google Scholar]
  12. Sanada, T.; Fujimoto, K.; Miyano, K.; Doi, M.; Tokonami, S.; Uesugi, M.; Takata, Y. Measurement of nationwide indoor Rn concentration in Japan. J. Environ. Radioact. 2019, 45, 129–137. [Google Scholar] [CrossRef]
  13. Kudo, H.; Tokonami, S.; Omori, Y.; Ishikawa, T.; Iwaoka, K.; Sahoo, S.K.; Akata, N.; Hosoda, M.; Wanabongse, P.; Pornnumpa, C.; et al. Comparative dosimetry for radon and thoron in high background radiation areas in China. Radiat. Prot. Dosim. 2015, 167, 155–159. [Google Scholar] [CrossRef]
  14. Chen, J.; Harley, N.H. A review of indoor and outdoor radon equilibrium factors—Part I: 222Rn. Health Phys. 2018, 115, 490–499. [Google Scholar] [CrossRef]
  15. Hosoda, M.; Nugraha, E.D.; Akata, N.; Yamada, R.; Tamakuma, Y.; Sasaki, M.; Kelleher, K.; Yoshinaga, S.; Suzuki, T.; Rattanapongs, C.P.; et al. A unique high natural background radiation area–Dose assessment and perspectives. Sci. Total Environ. 2021, 750, 142346. [Google Scholar] [CrossRef]
  16. Cigna, A.A. Radon in caves. Int. J. Speleol. 2005, 34, 1–18. [Google Scholar] [CrossRef]
  17. Chen, J.; Harley, N.H. A Review of Radon Equilibrium Factors in Underground Mines, Caves, and Thermal Spas. Health Phys. 2020, 119, 342–350. [Google Scholar] [CrossRef]
  18. Jovanovič, P. Radon measurements in karst caves in Slovenia. Environ. Int. 1996, 22, 429–432. [Google Scholar] [CrossRef]
  19. Vaupotič, J. Nanosize radon short-lived decay products in the air of the Postojna Cave. Sci. Total Environ. 2008, 393, 27–38. [Google Scholar] [CrossRef] [PubMed]
  20. Tanahara, A.; Taira, H.; Takemura, M. Radon distribution and the ventilation of a limestone cave on Okinawa. Geochem. J. 1997, 31, 49–56. [Google Scholar] [CrossRef]
  21. Fujimoto, K.; Iimoto, T.; Furukawa, M.; Tokonami, S. Study on the exposure dose from indoor or outdoor radon etc. Survey of radon concentration in residential environment. In Radioactive Environment Study Report (1997); NIRS-R-35; National Institute of Radiological Sciences (Planning Office), Ed.; National Institute of Radiological Sciences: Chiba, Japan, 1998; pp. 28–31. (In Japanese) [Google Scholar]
  22. Yamada, R.; Tamakuma, Y.; Iwaoka, K.; Hosoda, M.; Shiroma, Y.; Akata, N.; Mizuno, H.; Yamada, K.; Kuroki, T.; Tokonami, S. Measurement system for alpha and beta emitters with continuous air sampling under different exposure situations. Appl. Radiat. Isot. 2017, 126, 79–82. [Google Scholar] [CrossRef]
  23. Ooka, S.; Sasaki, H.; Ishihara, Y.; Yoshimura, K. Cave air ventilation associated with speleothem formation in the Gyokusen-do Cave, Nanjo City, Okinawa Island, Southwest Japan. J. Speleol. Soc. Jpn. 2018, 43, 17–36, (In Japanese with English Abstract). [Google Scholar]
  24. Shiroma, Y.; Shiroma, M.; Kina, S.; Hosoda, M.; Yasuoka, Y.; Akata, N.; Furukawa, M. Source of atmospheric radon in the Gyokusendo, a limestone cave in Okinawa. Jpn. J. Health Phys. 2016, 51, 218–226, (In Japanese with English Abstract). [Google Scholar] [CrossRef] [Green Version]
  25. Nakasone, S.; Ishimine, A.; Shiroma, S.; Masuda, N.; Nakamura, K.; Shiroma, Y.; Ooka, S.; Tanaka, M.; Kato, A.; Hosoda, M.; et al. Temporal and Spatial Variation of Radon Concentrations in Environmental Water from Okinawa Island, Southwestern Part of Japan. Int. J. Environ. Res. Public Health 2021, 18, 998. [Google Scholar] [CrossRef] [PubMed]
  26. The International Commission on Radiation Units and Measurements (ICRU). ICRU Report 88, Measurement and reporting of radon exposures. J. ICRU 2012, 12, 1–191. [Google Scholar]
  27. Tokonami, S.; Ichiji, T.; Iimoto, T.; Kurosawa, R. Calculation procedure of potential alpha energy concentration with continuous air sampling. Health Phys. 1996, 71, 937–943. [Google Scholar] [CrossRef]
  28. Pornnumpa, C.; Oyama, Y.; Iwaoka, K.; Hosoda, M.; Tokonami, S. Development of radon and thoron exposure systems at Hirosaki University. Radiat. Environ. Med. 2018, 7, 13–20. [Google Scholar]
  29. Tamakuma, Y.; Yamada, R.; Hosoda, M.; Iwaoka, K.; Tokonami, S. Evaluation of a surface collection efficiency and a stability of flow rate for the commercially available filters used for ambient radioactive aerosols. Jpn. J. Heath Phys. 2019, 54, 5–12, (In Japanese with English Abstract). [Google Scholar] [CrossRef]
  30. Przylibski, T.A. Radon concentration changes in the air of two caves in Poland. J. Environ. Radioact. 1999, 45, 81–94. [Google Scholar] [CrossRef]
  31. Kowalczk, A.J.; Froelich, P.N. Cave air ventilation and CO2 outgassing by radon-222 modeling: How fast do caves breathe? Earth Planet. Sci. Lett. 2010, 289, 209–219. [Google Scholar] [CrossRef]
  32. Gregorič, A.; Zidanšek, A.; Vaupotič, J. Dependence of radon levels in Postojna Cave on outside air temperature. Nat. Hazards Earth Syst. Sci. 2011, 11, 1523–1528. [Google Scholar] [CrossRef] [Green Version]
  33. Nagy, H.É.; Szabó, Z.; Jordán, G.; Szabó, C.; Horváth, Á.; Kiss, A. Time variations of 222Rn concentration and air exchange rates in a Hungarian cave. Isot. Environ. Health Stud. 2012, 48, 464–472. [Google Scholar] [CrossRef] [PubMed]
  34. Tanahara, A.; Iha, H.; Taira, H. Factors controlling the changes in 222Rn concentration in Gyokusen Cave on Okinawa Island. J. Speleol. Soc. Jpn. 1997, 22, 98–105, (In Japanese with English Abstract). [Google Scholar]
  35. Szerbin, P. Radon concentrations and exposure levels in Hungarian caves. Health Phys. 1996, 71, 362–369. [Google Scholar] [CrossRef] [PubMed]
  36. Duffy, J.T.; Madden, J.S.; Mackin, G.M.; McGarry, A.T.; Colgan, P.A. A reconnaissance survey of radon in show caves in Ireland. Environ. Int. 1996, 22, 415–423. [Google Scholar] [CrossRef]
  37. Sas, D.; Navrátil, O.; Sládek, P. Monitoring of natural factors in Czech speleotherapeutic centres. Czechoslov. J. Phys. 1999, 49, 103–106. [Google Scholar] [CrossRef]
  38. Zahorowski, W.; Whittlestone, S.; James, J.M. Continuous measurements of radon and radon progeny as a basis for management of radon as a hazard in a tourist cave. J. Radioanal. Nucl. Chem. 1998, 236, 219–225. [Google Scholar] [CrossRef]
  39. Kávási, N.; Somlai, J.; Kovács, T.; Szabó, T.; Várhegyi, A.; Hakl, J. Occupational and patient doses in the therapeutic cave, Tapolca (Hungary). Radiat. Prot. Dosim. 2003, 106, 263–266. [Google Scholar] [CrossRef] [PubMed]
  40. Tokonami, S.; Iimoto, T.; Kurosawa, R. Continuous measurement of the equilibrium factor F and the unattached fraction fp of radon progeny in the environment. Environ. Int. 1996, 22, 611–616. [Google Scholar] [CrossRef]
  41. Chen, C.J.; Liu, C.C.; Lin, Y.M. Measurement of equilibrium factor and unattached fraction of radon progeny in Kaohsiung, Taiwan. Appl. Radiat. Isot. 1998, 49, 1613–1618. [Google Scholar] [CrossRef]
  42. Paul, A.; Röttger, S.; Honig, A.; Sulima, T.; Buchholz, A.; Keyser, U. Measurement of short-lived radon progenies by simultaneous αγ-spectrometry at the German radon reference chamber. Nucl. Instrum. Methods Phys. Res. A 1999, 434, 303–312. [Google Scholar] [CrossRef]
Figure 1. Maps showing the study area (a) and Gyokusen-do Cave (b).
Atmosphere 12 01648 g001
Figure 2. Map of Gyokusen-do Cave showing the measuring point and a photo of the measurement setup (This map was drawn using reference [23]).
Atmosphere 12 01648 g002
Figure 3. Profile view of Gyokusen-do Cave showing the measuring point (This figure was drawn using reference [23]).
Atmosphere 12 01648 g003
Figure 4. Schematic diagram of the observed alpha spectra.
Atmosphere 12 01648 g004
Figure 5. Measurement results in winter.
Atmosphere 12 01648 g005
Figure 6. Measurement results in summer.
Atmosphere 12 01648 g006
Publisher’s Note: MDPI stays neutral with regard to jurisdictional claims in published maps and institutional affiliations.

