
Investigation of Airflow Distribution and Contamination Control with Different Schemes in an Operating Room


Abstract
:1. Introduction
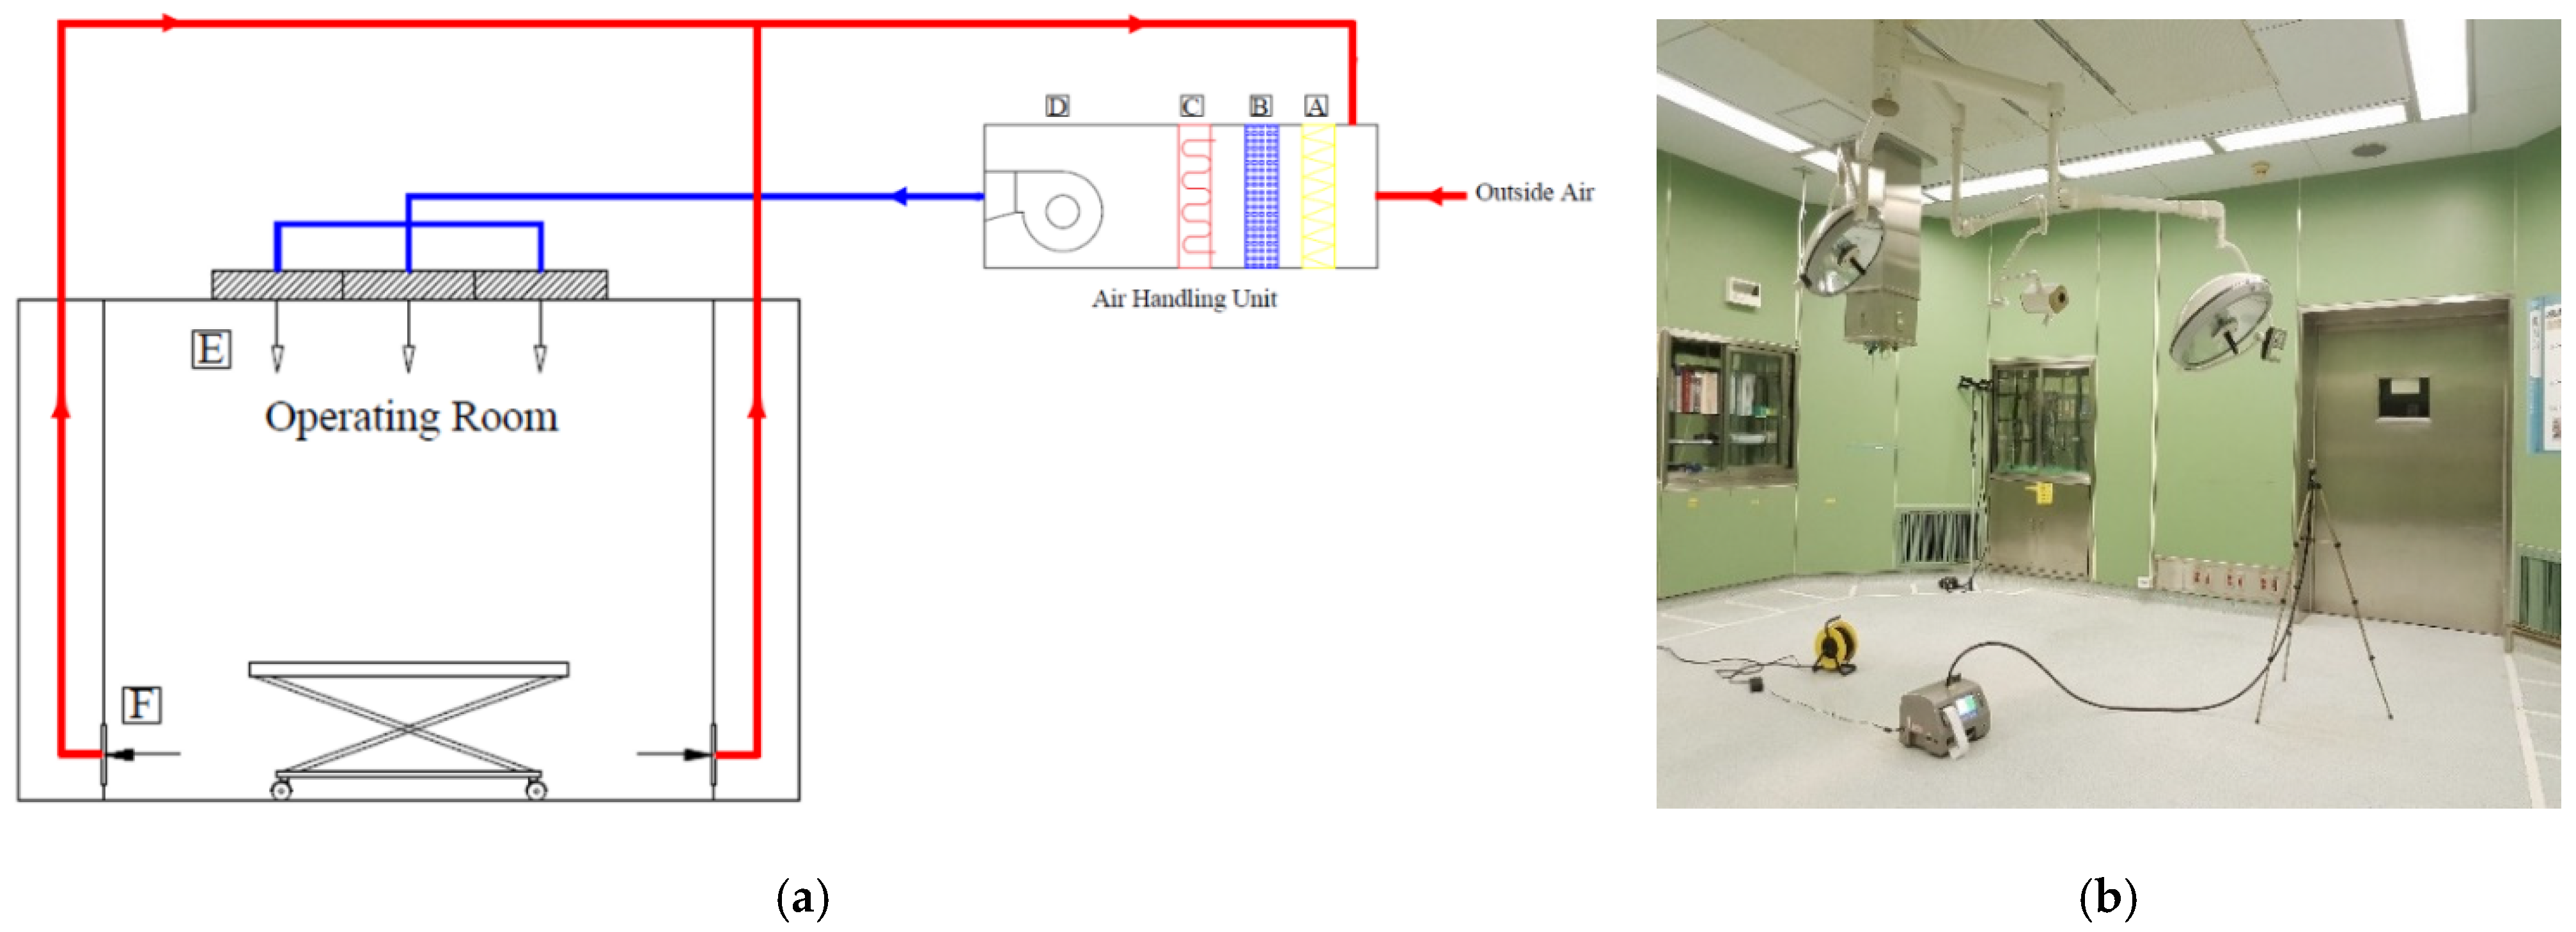
2. System Description
3. Methodology
3.1. Field Measurement Tests
3.2. CFD Simulation and Improvement Strategy
- Case 1: at-rest condition with no personnel and equipment inside the operating room.
- Case 2: operational condition with personnel inside performing a surgery.
- Case 3: actual condition with personnel inside and equipment blocking the return air.
3.3. Airflow Modelling and Boundary Conditions
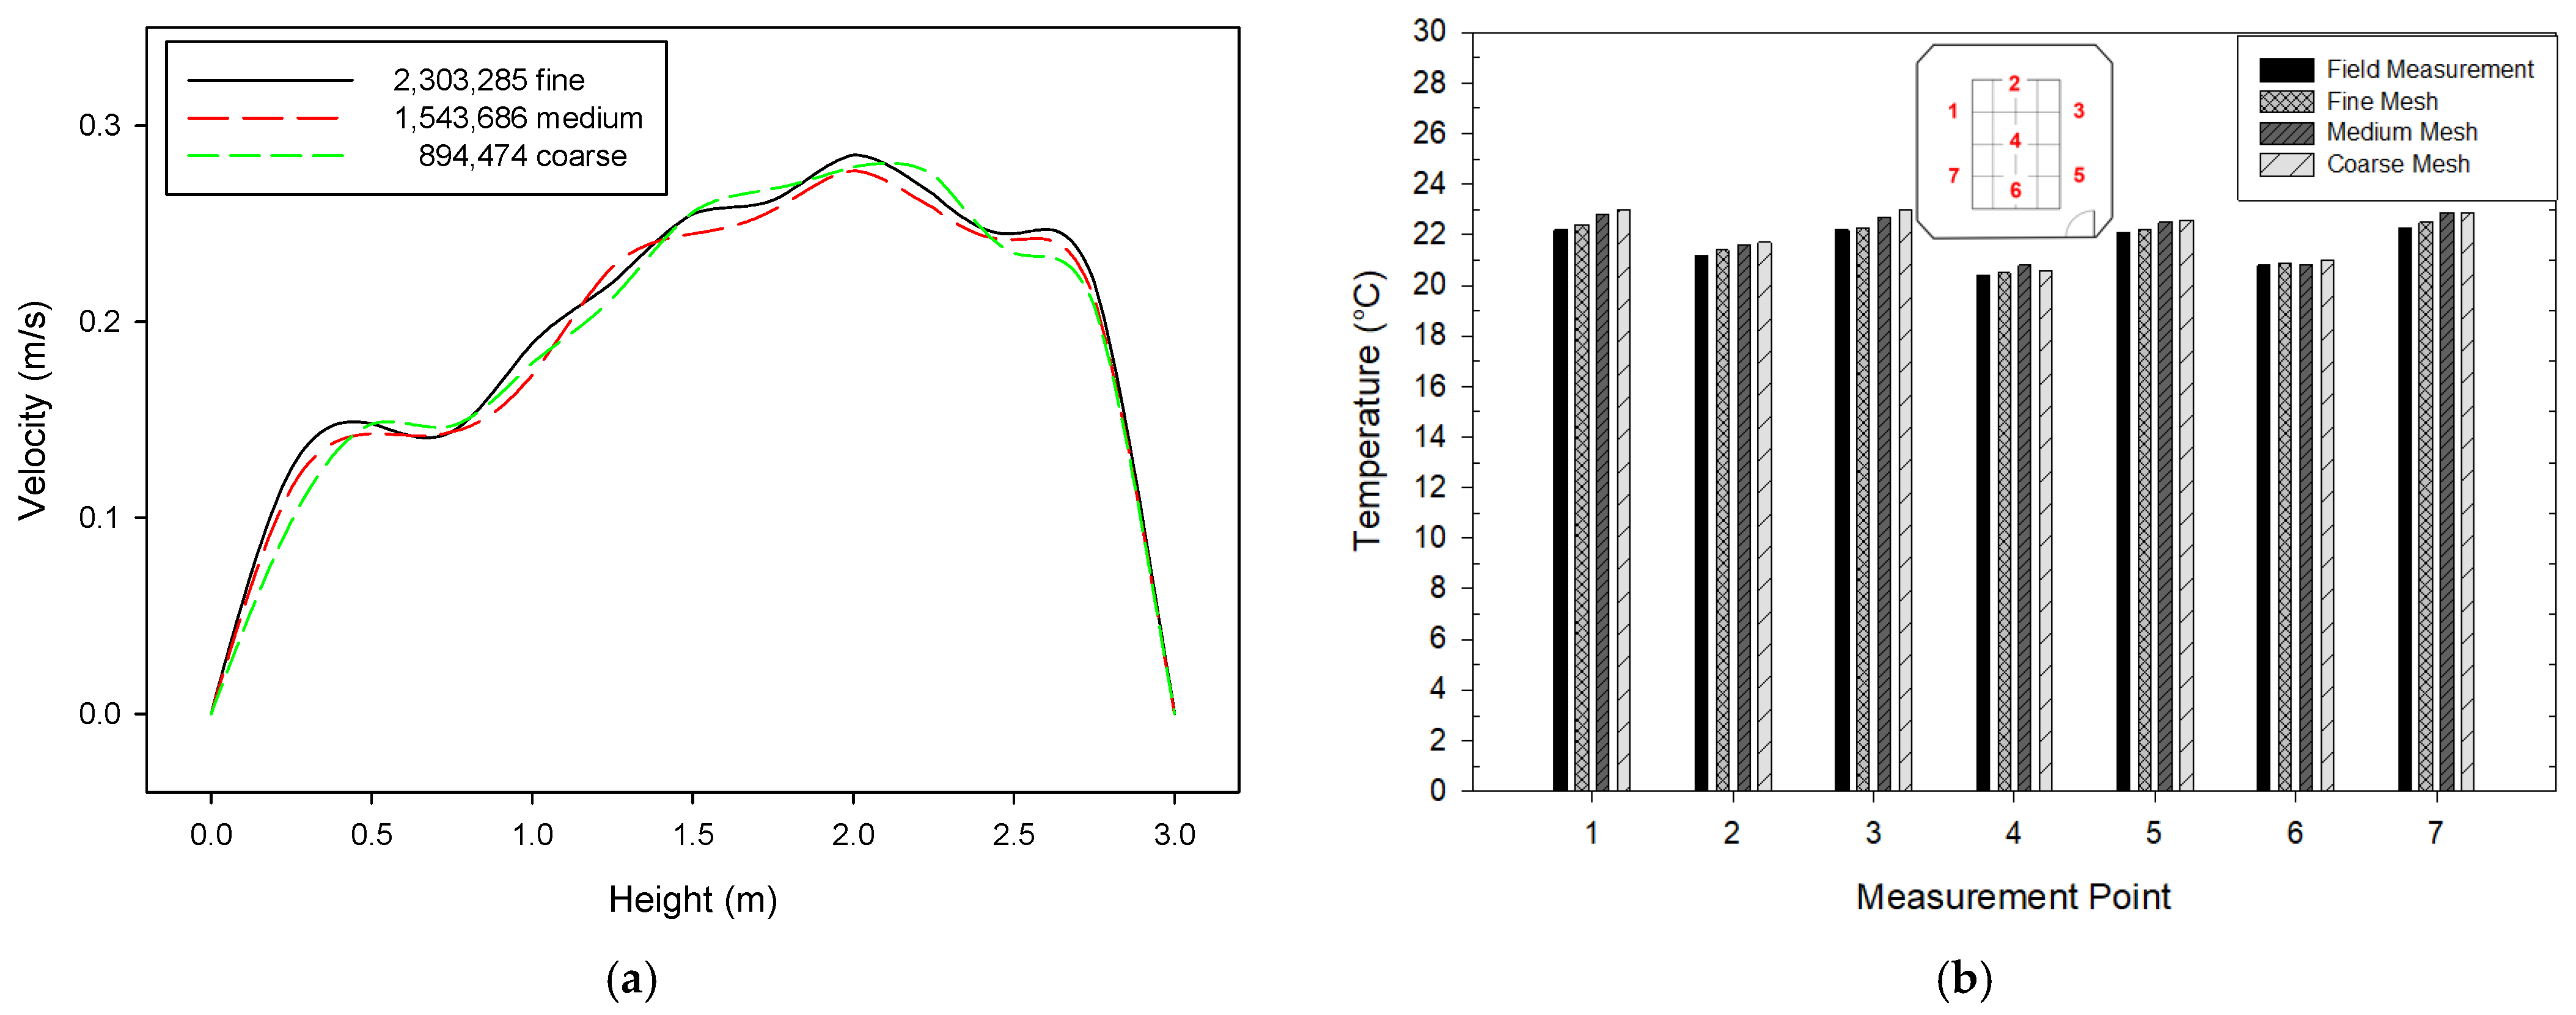
3.4. Grid Independence Test and Validation
4. Results and Discussion
4.1. Experimental Results
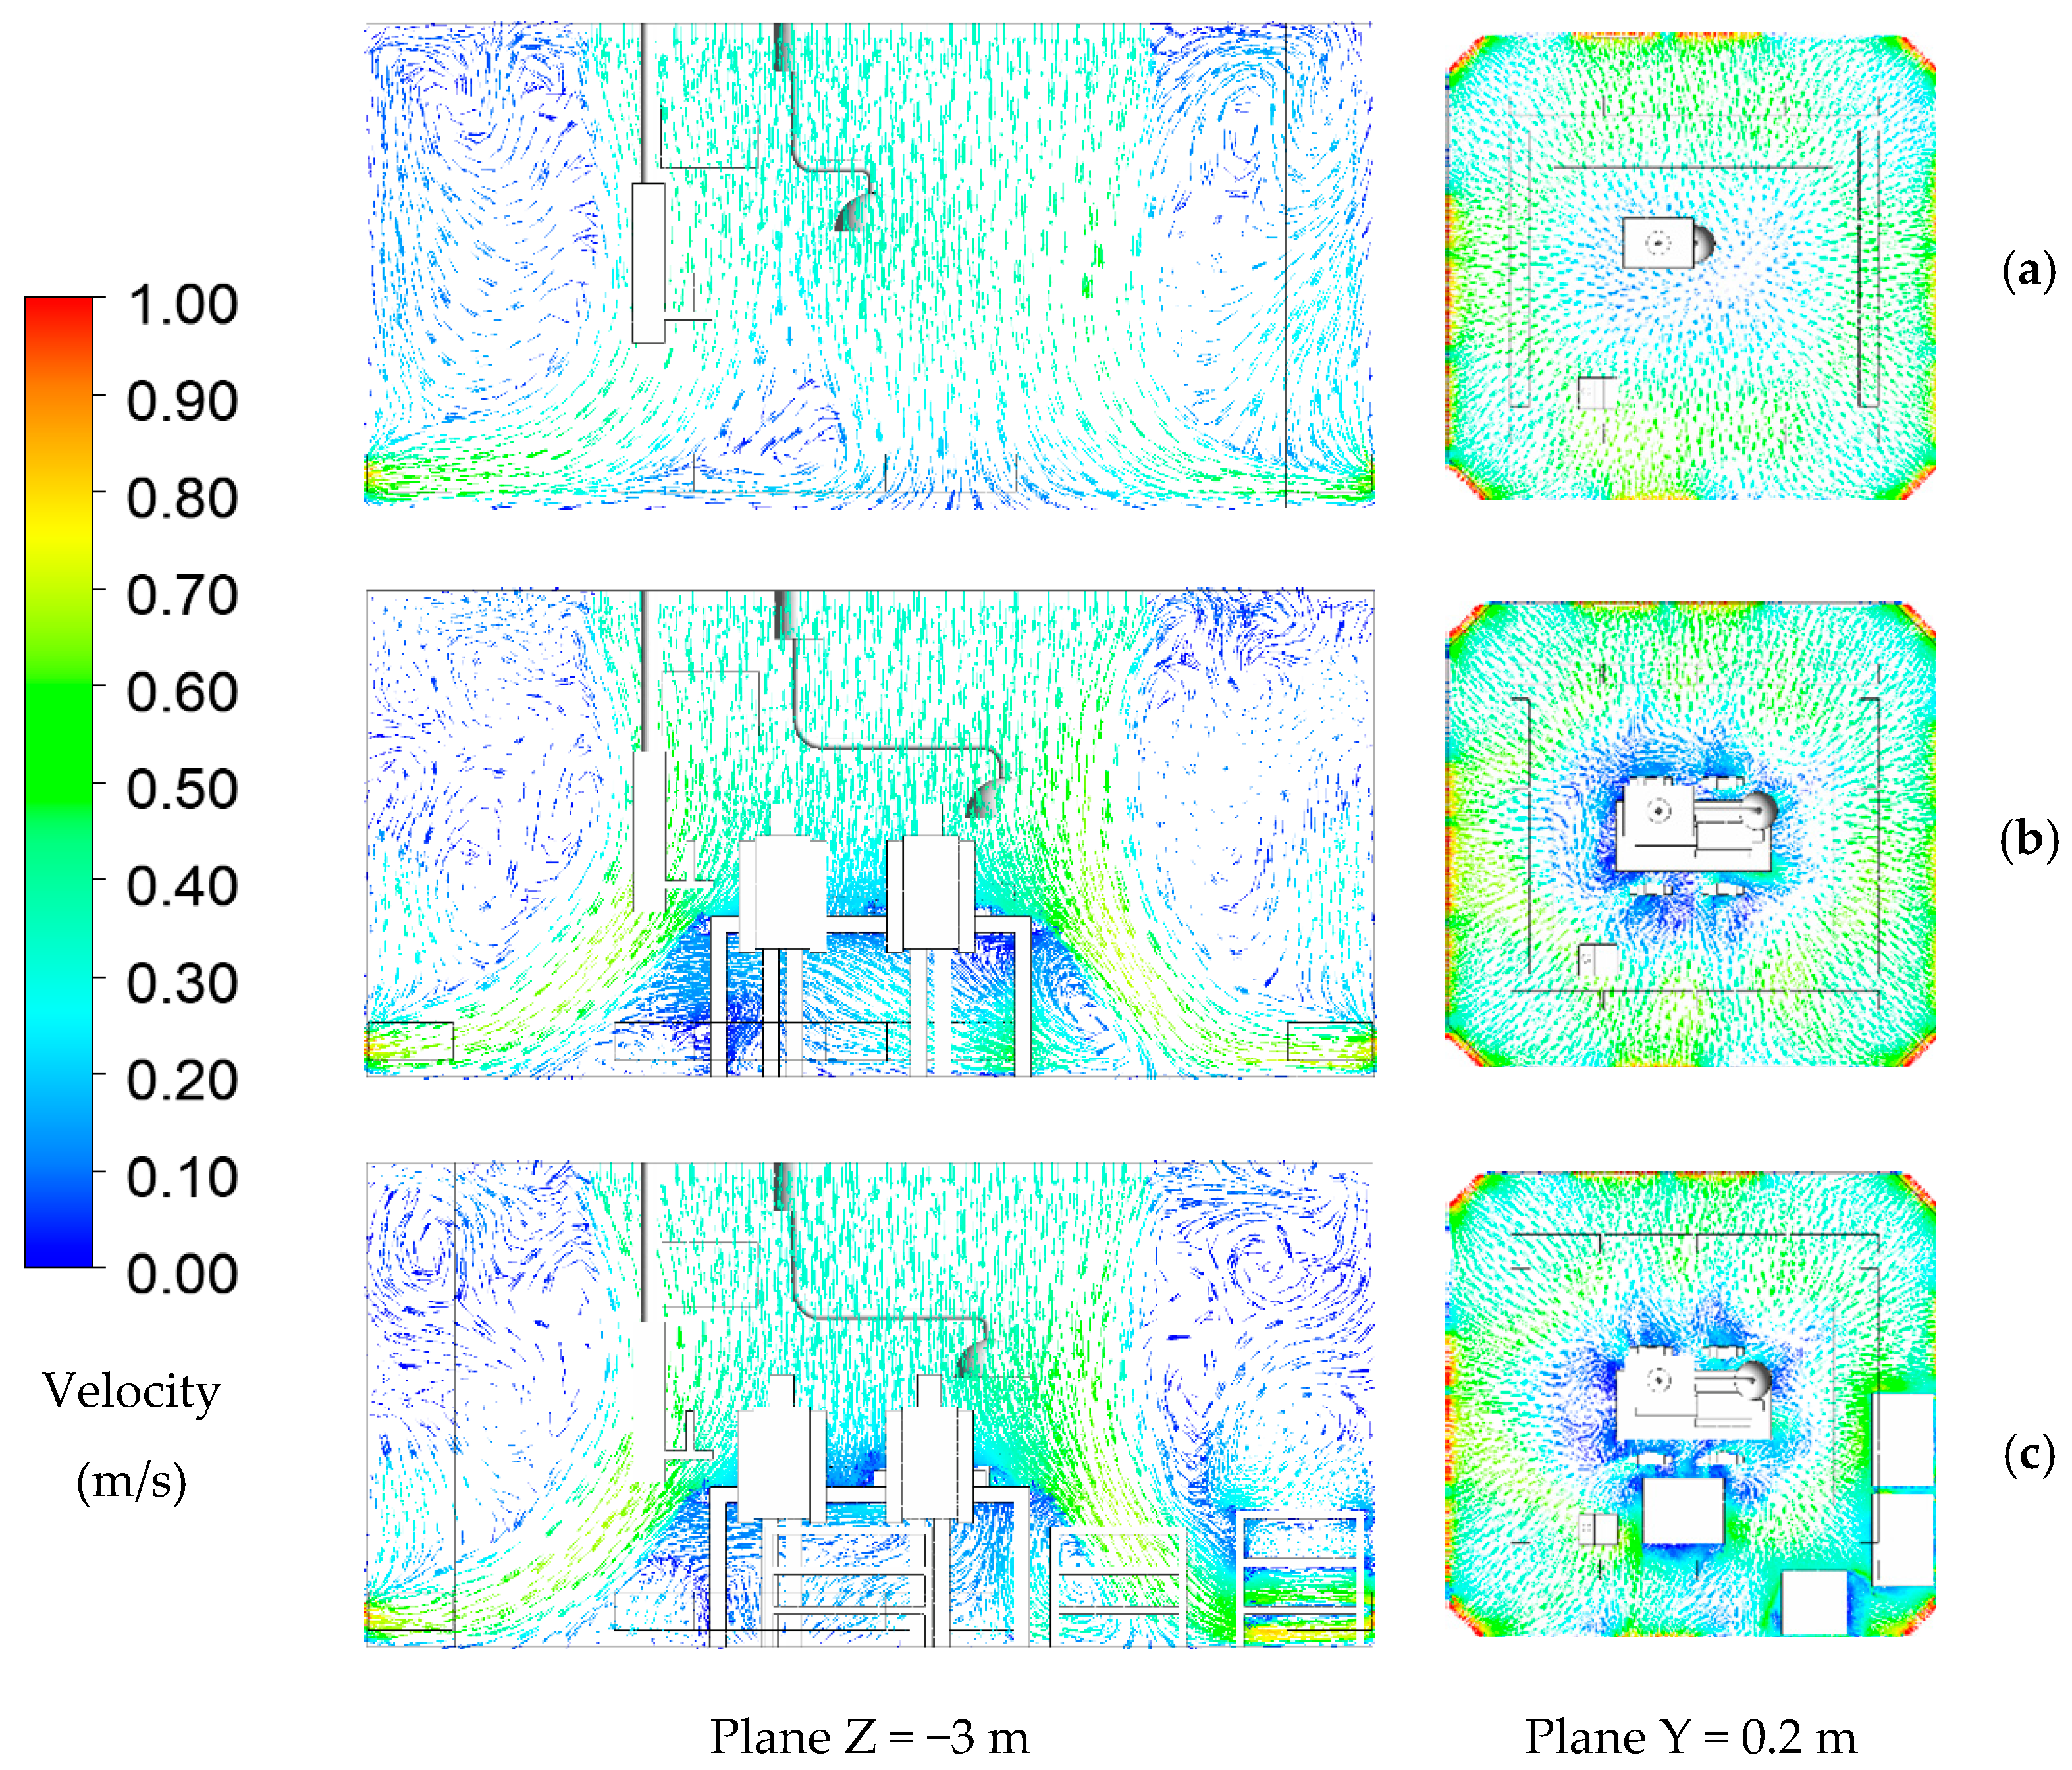
4.2. Airflow Pattern Distribution
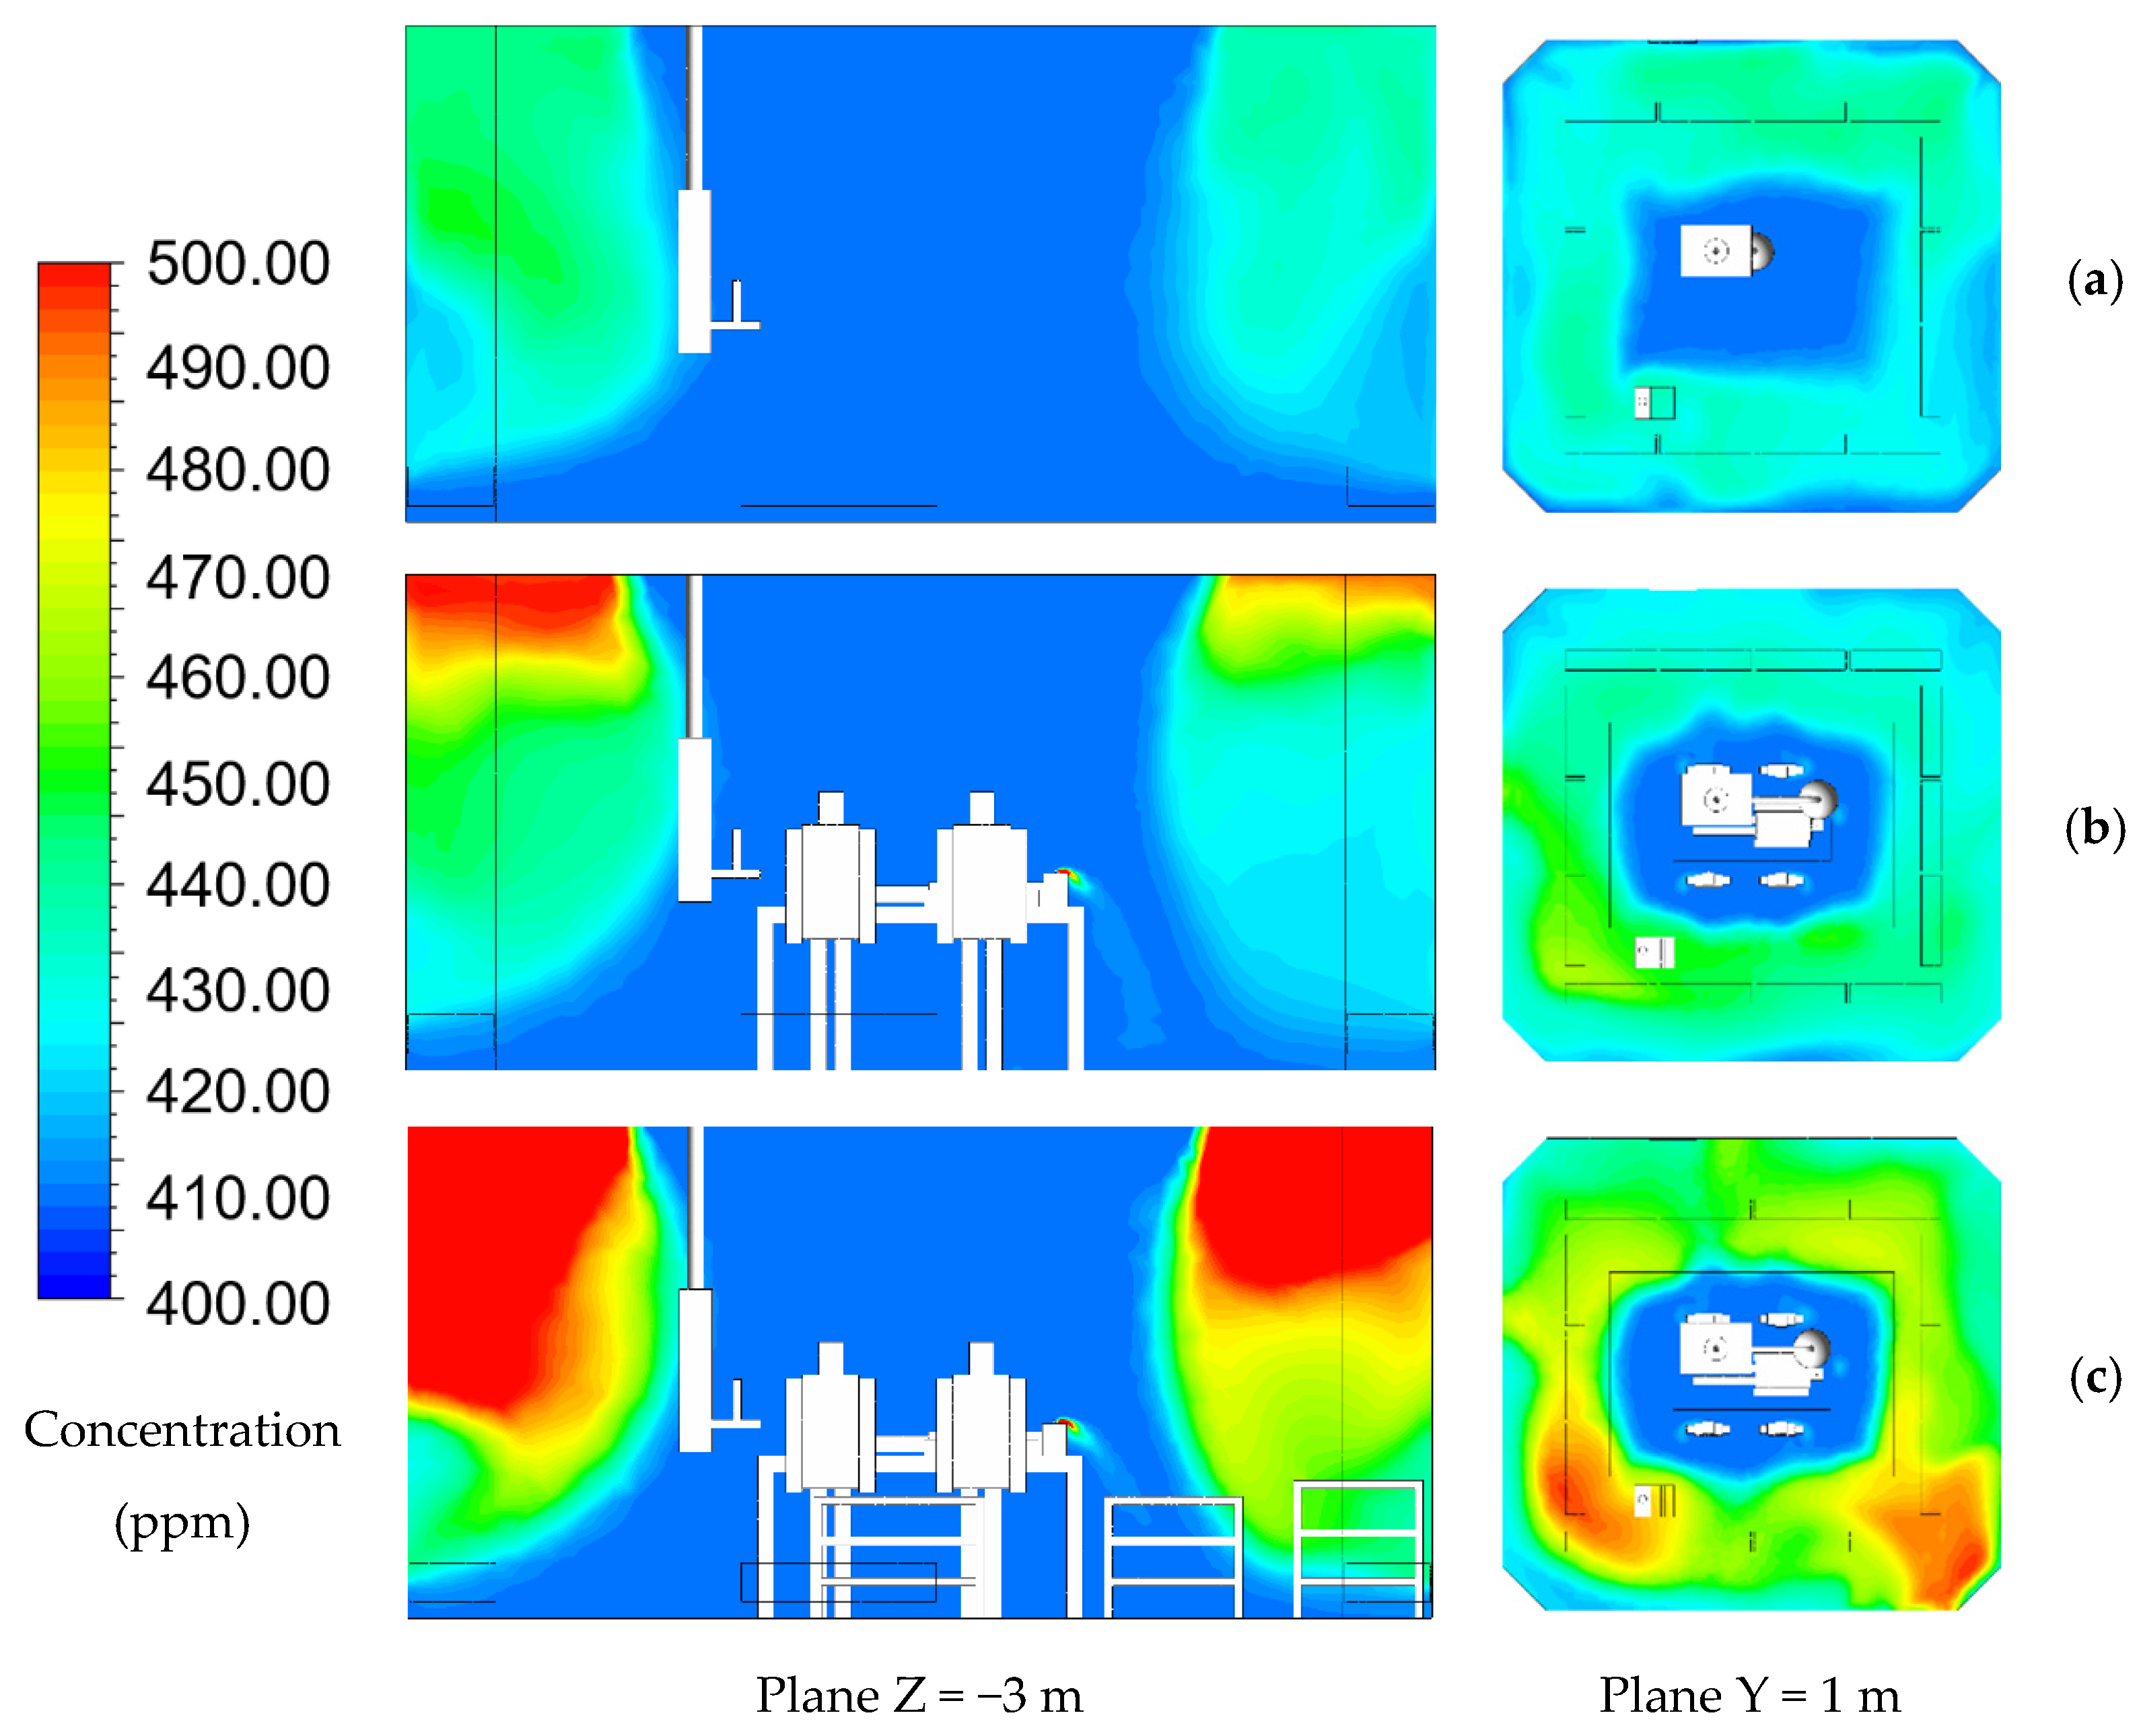
4.3. Contamination Removal Analyses in Different Cases
4.4. Effect of Ventilation Rate on the Operating Room Concentration
4.5. Ventilation Efficiency
4.6. Bioaerosol Flow Path Model
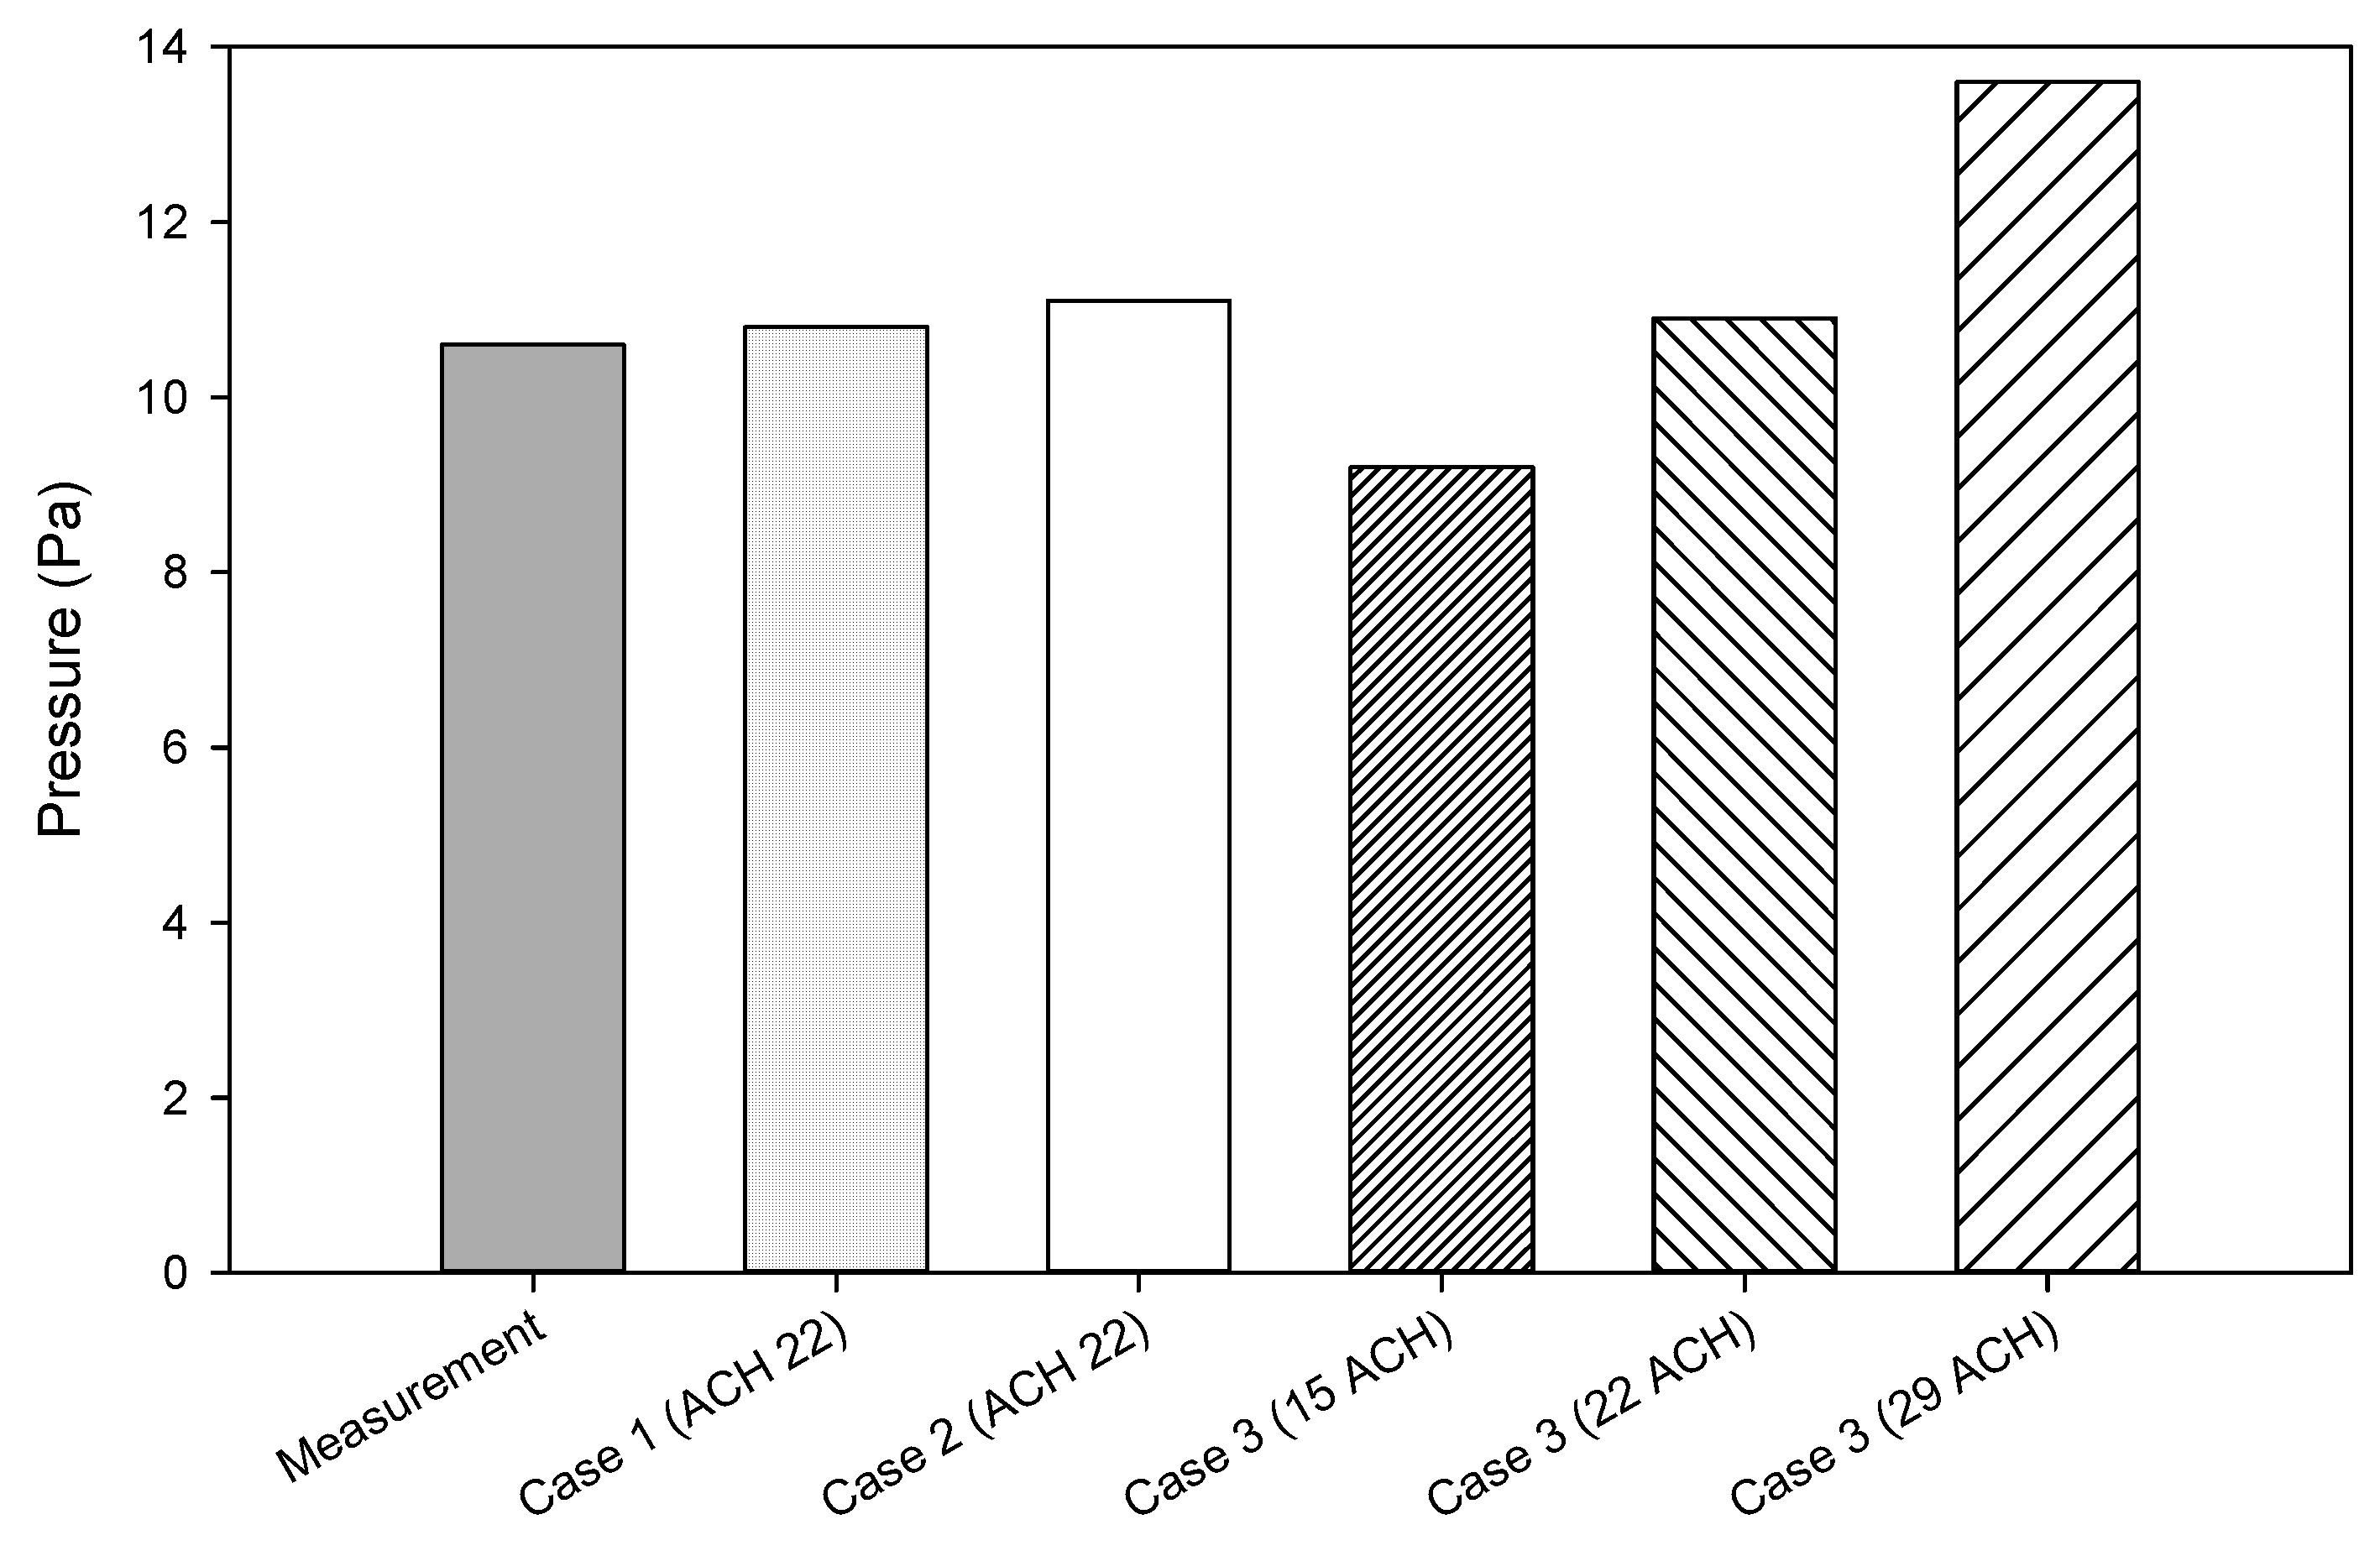
4.7. Pressurization
5. Conclusions
- The experimental data were retrieved during unoccupied conditions (at-rest), and this condition reached the design specification following ASHRAE 170 standard and ISO 14644.
- The results of concentration contamination and bioaerosol flow path revealed that case 1 presents a good airflow distribution and less particle concentration when unoccupied with the average concentration value of 404 ppm, while case 2 generated a higher concentration while performing a surgery with an average concentration value of 420 ppm. Then, some medical equipment blocked the outlet air in case 3, resulting in the highest concentration with an average concentration value of 474 ppm.
- Increasing the ventilation rates could result in a lower concentration. Increasing ventilation rates does not always present a good concentration dilution, but the air distribution pattern could also affect it. Some medical equipment is recommended not to block the outlet air grilles for dilution purposes. The average concentration in case 3 with different ventilation rates: 15 ACH, 22 ACH, and 29 ACH were 495 ppm, 474 ppm, and 446 ppm, respectively.
- According to case 1, the ventilation efficiency in case 2 and case 3 dropped around 6% and 17.91%, respectively. Ventilation efficiency also decreased along with decreasing ACH, while with increasing ACH, the ventilation efficiency in the case 3 actual condition increased, approaching case 2 in an ideal condition.
- The blocked return air also affected the bioaerosol distribution that could not be directly removed or diluted through the outlet. It could obstruct the flow path resulting in the airflow distribution that could carry the particles reaching almost the ceiling corner, and even deposited in behind the surgical table.
- The reduction in ventilation could increase the concentration inside the room and would not be possible to implement when the operating room is performing surgery. The reduction also has a limitation that should be met with the design requirements such as temperature, relative humidity, pressurization, and particle counts. It could be implemented during the unoccupied state condition to achieve energy saving.
Author Contributions
Funding
Institutional Review Board Statement
Informed Consent Statement
Conflicts of Interest
References
- Guo, L. Implementation of a risk management plan in a hospital operating room. Int. J. Nurs. Sci. 2015, 2, 348–354. [Google Scholar] [CrossRef] [Green Version]
- Munoz-Price, L.S.; Birnbach, D.J.; Lubarsky, D.A.; Arheart, K.L.; Fajardo-Aquino, Y.; Rosalsky, M.; Cleary, T.; DePascale, D.; Coro, G.; Namias, N.; et al. Decreasing operating room environmental pathogen contamination through improved cleaning practice. Infec. Cont. Hosp. Epidemiol. 2012, 33, 897–904. [Google Scholar] [CrossRef] [PubMed]
- Koenigshofer, D.; Likhonin, P. HVAC Systems in Hospitals. Engineered Systems Magazine. 2017. Available online: https://www.esmagazine.com/articles/98525-hvac-systems-in-hospitals (accessed on 6 August 2021).
- ANSI/ASHRAE/ASHE Standard 170. Ventilation of Health Care Facilities; American Society of Heating, Refrigerating, and Air-Conditioning Engineers, Inc.: Atlanta, GA, USA, 2017. [Google Scholar]
- ANSI/ASHRAE/ASHE Standard 62.1. Ventilation and Acceptable Indoor Air Quality; American Society of Heating, Refrigerating, and Air-Conditioning Engineers, Inc.: Atlanta, GA, USA, 2019. [Google Scholar]
- Aganovic, A.; Cao, G.; Stenstad, L.I.; Skogås, J.G. Impact of surgical lights on the velocity distribution and airborne contamination level in an operating room with laminar airflow system. Build. Environ. 2017, 126, 42–53. [Google Scholar] [CrossRef]
- Kai, T.; Ayagaki, N.; Setoguchi, H. Influence of the arrangement of surgical light axes on the air environment in operating rooms. J. Healthc. Eng. 2019, 2019, 4861273. [Google Scholar] [CrossRef] [Green Version]
- Chow, T.T.; Lin, Z.; Bai, W. The integrated effect of medical lamp position and diffuser discharge velocity on ultra-clean ventilation performance in an operating theatre. Indoor Built Environ. 2006, 15, 315–331. [Google Scholar] [CrossRef]
- Sadeghian, P.; Wang, C.; Duwig, C.; Sadrizadeh, S. Impact of surgical lamp design on the risk of surgical site infections in operating rooms with mixing and unidirectional airflow ventilation: A numerical study. J. Build. Eng. 2020, 31, 101423. [Google Scholar] [CrossRef]
- Liu, Z.; Zhang, M.; Cao, G.; Tang, S.; Liu, H.; Wang, L. Influence of air supply velocity and room temperature conditions on bioaerosols distribution in a class I operating room. Build. Environ. 2021, 204, 108116. [Google Scholar] [CrossRef]
- Wang, F.J.; Lai, C.M.; Cheng, T.J.; Liu, Z.Y. Performance evaluation of indoor environment parameters for an unoccupied operating room. ASHRAE Trans. 2011, 117, 557–564. [Google Scholar]
- Jarvis, I.; Vahabi, F. Operating Room Ventilation Systems Best Practices Guide for Energy Efficiency, Health and Safety. A Greening Healthcare Research Project. 2017. Available online: https://www.enerlife.com/wp-content/uploads/2017/06/Enerlife-OR-Ventilation-Best-Practices-Guide-April-2017.pdf (accessed on 14 July 2021).
- Wang, F.J.; Hung, J.; Chen, Y.; Hsu, C. Performance evaluation for operation rooms by numerical simulation and field measurement. Int. J. Vent. 2017, 16, 189–199. [Google Scholar] [CrossRef]
- Wang, C. Ventilation Performance in Operating Rooms: A Numerical Assessment. Doctoral Thesis, KTH Architecture and The Built Environment, Stockholm, Sweden, 2019. [Google Scholar]
- Bombač, M.; Novak, G.; Mlačnik, J.; Četina, M. Extensive field measurements of flow in vertical slot fishway as data for validation of numerical simulations. Ecolog. Eng. 2015, 84, 476–484. [Google Scholar] [CrossRef]
- Zhang, Z.; Wei, Y.; Tianwen, W.; Yonghan, L.; Yawen, Z.; Guoqiang, Z. Potential of cross-ventilation channels in an ideal typical apartment building predicted by CFD and multi-zone airflow model. J.Build. Eng. 2021, 44, 103408. [Google Scholar]
- Szczepanik-Scislo, N.; Antonowicz, A.; Scislo, L. PIV measurement and CFD simulations of an air terminal device with a dynamically adapting geometry. Appl. Sci. 2019, 1, 1–9. [Google Scholar] [CrossRef] [Green Version]
- Szczepanik-Scislo, N.; Scislo, L. Comparison of CFD and Multizone Modeling from Contaminant Migration from a Household Gas Furnace. Atmosphere 2021, 12, 79. [Google Scholar] [CrossRef]
- Peng, S.; Chen, Q.; Liu, E. The role of computational fluid dynamics tools on investigation of pathogen transmission: Prevention and control. Sci. Total Environ. 2020, 31, 142090. [Google Scholar] [CrossRef]
- Van Hooff, T.; Blocken, B. CFD evaluation of natural ventilation of indoor environments by the concentration decay method: CO2 gas dispersion from a semi-enclosed stadium. Build. Environ. 2013, 61, 1–17. [Google Scholar] [CrossRef]
- Chung, K.C.; Hsu, S.P. Effect of ventilation pattern on room air and contaminant distribution. Build. Environ. 2001, 36, 989–998. [Google Scholar] [CrossRef]
- Cui, S.; Cohen, M.; Stabat, P.; Marchio, D. CO2 tracer gas concentration decay method for measuring air change rate. Build. Environ. 2015, 84, 162–169. [Google Scholar] [CrossRef]
- ISO 14644-1. Cleanroom and Associated Controlled Environments-Part 1: Classification of Air Cleanliness by Particle Concentration; Vernier: Geneva, Switzerland, 2015. [Google Scholar]
- U.S. General Services Administration Federal Standard 209E. Airborne Particulate Cleanliness Classes in Cleanrooms and Clean Zones; General Services Administration: Washington, DC, USA, 1992.
- ANSYS. Ansys Fluent, Workbench 2020 R2. Available online: https://www.scribd.com/document/478910198/ANSYS-Fluent-Tutorial-Guide-2020-R2-pdf (accessed on 6 March 2021).
- Minnesota Department of Health United States. Carbon Dioxide (CO2). Available online: https://www.health.state.mn.us/communities/environment/air/toxins/co2.html (accessed on 15 June 2021).
- Moreno-Rangel, A.; Musau, F.; Sharpe, T.; McGill, G. Indoor Air Quality Assessment of Latin America’s First Passivhaus Home. Atmosphere 2021, 12, 1477. [Google Scholar] [CrossRef]
- Shih, Y.C.; Chiu, C.C.; Wang, O. Dynamic airflow simulation within an isolation room. Build. Environ. 2007, 42, 3194–3209. [Google Scholar] [CrossRef] [PubMed]
- Brohus, H.; Balling, K.D.; Jeppesen, D. Influence of movements on contaminant transport in an operating room. Indoor Air. 2006, 16, 356–372. [Google Scholar] [CrossRef] [PubMed]
- Suresh, K.; Regalla, S.P. Effect of mesh parameters in finite element simulation of single point incremental sheet forming process. Proc. Mat. Sci. 2014, 6, 376–382. [Google Scholar] [CrossRef] [Green Version]
- Sandberg, M. What is ventilation efficiency? Build. Environ. 1981, 16, 123–135. [Google Scholar] [CrossRef]


| Parameters | Apparatus Model | Operative Range | Accuracy |
|---|---|---|---|
| Velocity, Pressure | TSI PH-731 | 0.125–12.5 (m/s) Differential ± 3735 pa | 3% 2% |
| Particles | Met One 3413 | 0.3, 0.5, 1, 3, 5, 10 µm | 5% |
| Temperature, Humidity | TSI 9565P | −10~60 (°C), 0–100 (%RH) | 0.3 °C 3%RH |
| Parameter | Type | Value |
|---|---|---|
| Supply Air | Velocity Inlet Discrete phase: escape | Velocity: 0.298 m/s Temperature: 20.2 °C Concentration: 400 ppm |
| Return Air | Pressure Outlet Discrete phase: trap | Temperature: 25 °C Pressure: +10.6 Pa |
| CO2 Concentration | Velocity Inlet | Velocity Inlet: 0.18 m/s Exhale: 38,000 ppm [29] |
| Bioaerosol | DPM: Injection | Velocity: 1.5 m/s Flowrate: 0.17 kg/s Particle Size: 1–5 µm, median 2.5 µm |
| Patient | Wall | Heatflux: 17.45 W/m2 [30] |
| Surgeon | Wall | Heatflux: 33.55 W/m2 [30] |
| General Lightings | Wall | Heatflux: 288 W/m2 [30] |
| Operating Lightings | Wall | Heatflux: 320 W/m2 [30] |
| Case Study | C (ppm) | Cs (ppm) | Ce (ppm) | Ventilation Efficiency (%) |
|---|---|---|---|---|
| Case 1 (22 ACH) | 404 | 400 | 403.7 | 92.50 |
| Case 2 (22 ACH) | 420 | 400 | 417.3 | 86.50 |
| Case 3 (22 ACH) | 474 | 400 | 455.2 | 74.59 |
| Case 3 (15 ACH) | 495 | 400 | 465.5 | 68.95 |
| Case 3 (29 ACH) | 446 | 400 | 438.1 | 82.83 |
Publisher’s Note: MDPI stays neutral with regard to jurisdictional claims in published maps and institutional affiliations. |
© 2021 by the authors. Licensee MDPI, Basel, Switzerland. This article is an open access article distributed under the terms and conditions of the Creative Commons Attribution (CC BY) license (https://creativecommons.org/licenses/by/4.0/).
Share and Cite
Wang, F.; Permana, I.; Rakshit, D.; Prasetyo, B.Y. Investigation of Airflow Distribution and Contamination Control with Different Schemes in an Operating Room. Atmosphere 2021, 12, 1639. https://doi.org/10.3390/atmos12121639
Wang F, Permana I, Rakshit D, Prasetyo BY. Investigation of Airflow Distribution and Contamination Control with Different Schemes in an Operating Room. Atmosphere. 2021; 12(12):1639. https://doi.org/10.3390/atmos12121639
Chicago/Turabian StyleWang, Fujen, Indra Permana, Dibakar Rakshit, and Bowo Yuli Prasetyo. 2021. "Investigation of Airflow Distribution and Contamination Control with Different Schemes in an Operating Room" Atmosphere 12, no. 12: 1639. https://doi.org/10.3390/atmos12121639
APA StyleWang, F., Permana, I., Rakshit, D., & Prasetyo, B. Y. (2021). Investigation of Airflow Distribution and Contamination Control with Different Schemes in an Operating Room. Atmosphere, 12(12), 1639. https://doi.org/10.3390/atmos12121639