
Elemental Carbon Observed at a Peri-Urban Forest Site near the Seoul Metropolitan Area as a Tracer of Seasonal Haze Occurrence


Abstract
:1. Introduction
2. Experiment
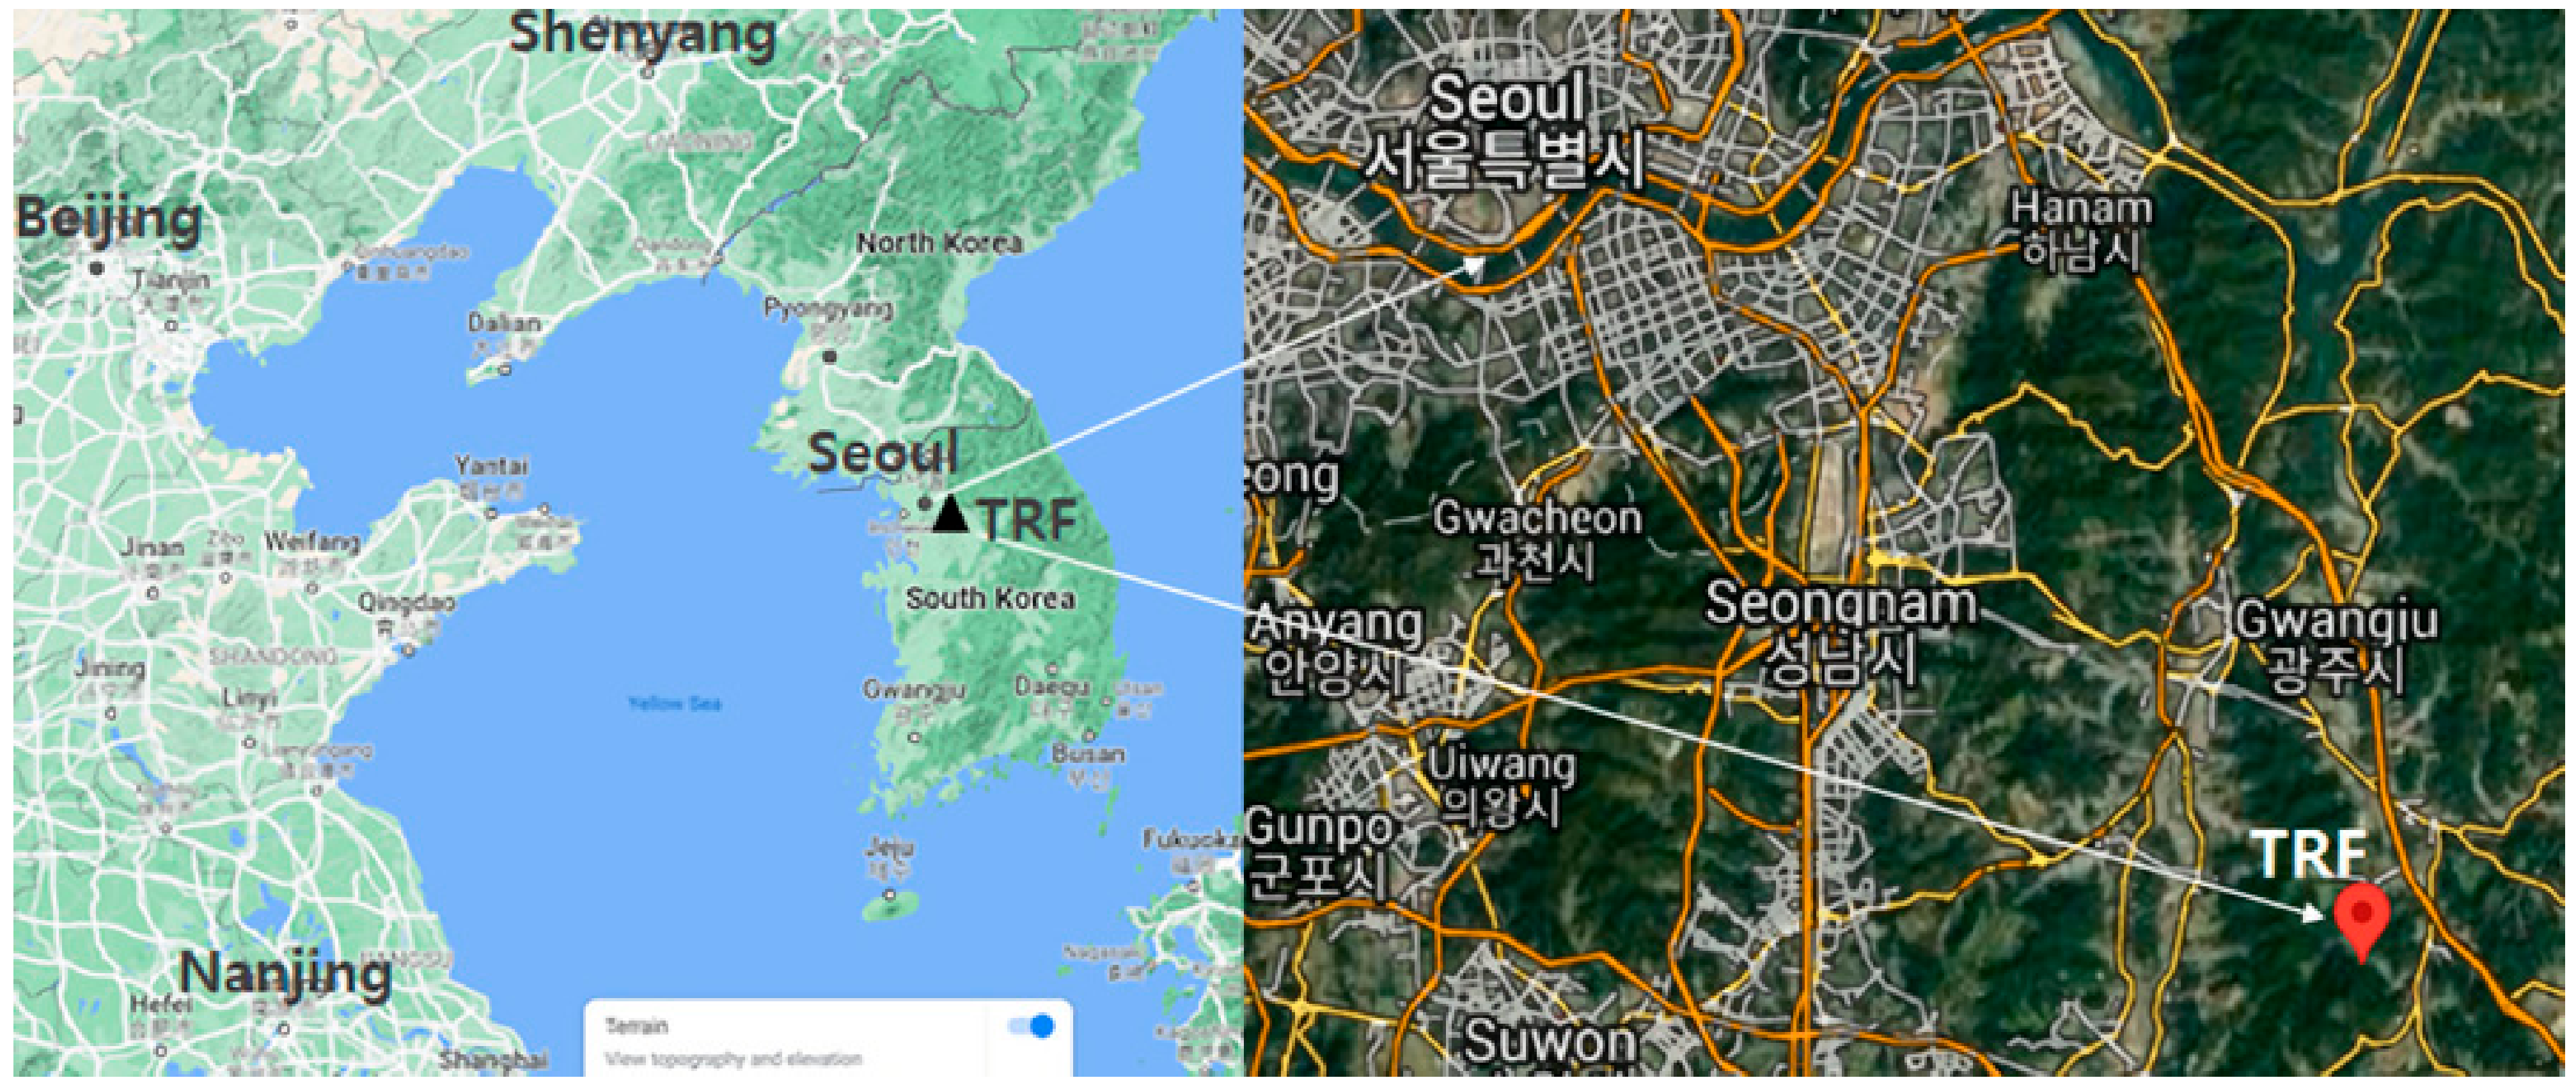
2.1. Measurements
2.2. EC Tracer Method
2.3. Air Mass Back Trajectory Analysis
3. Results and Discussion
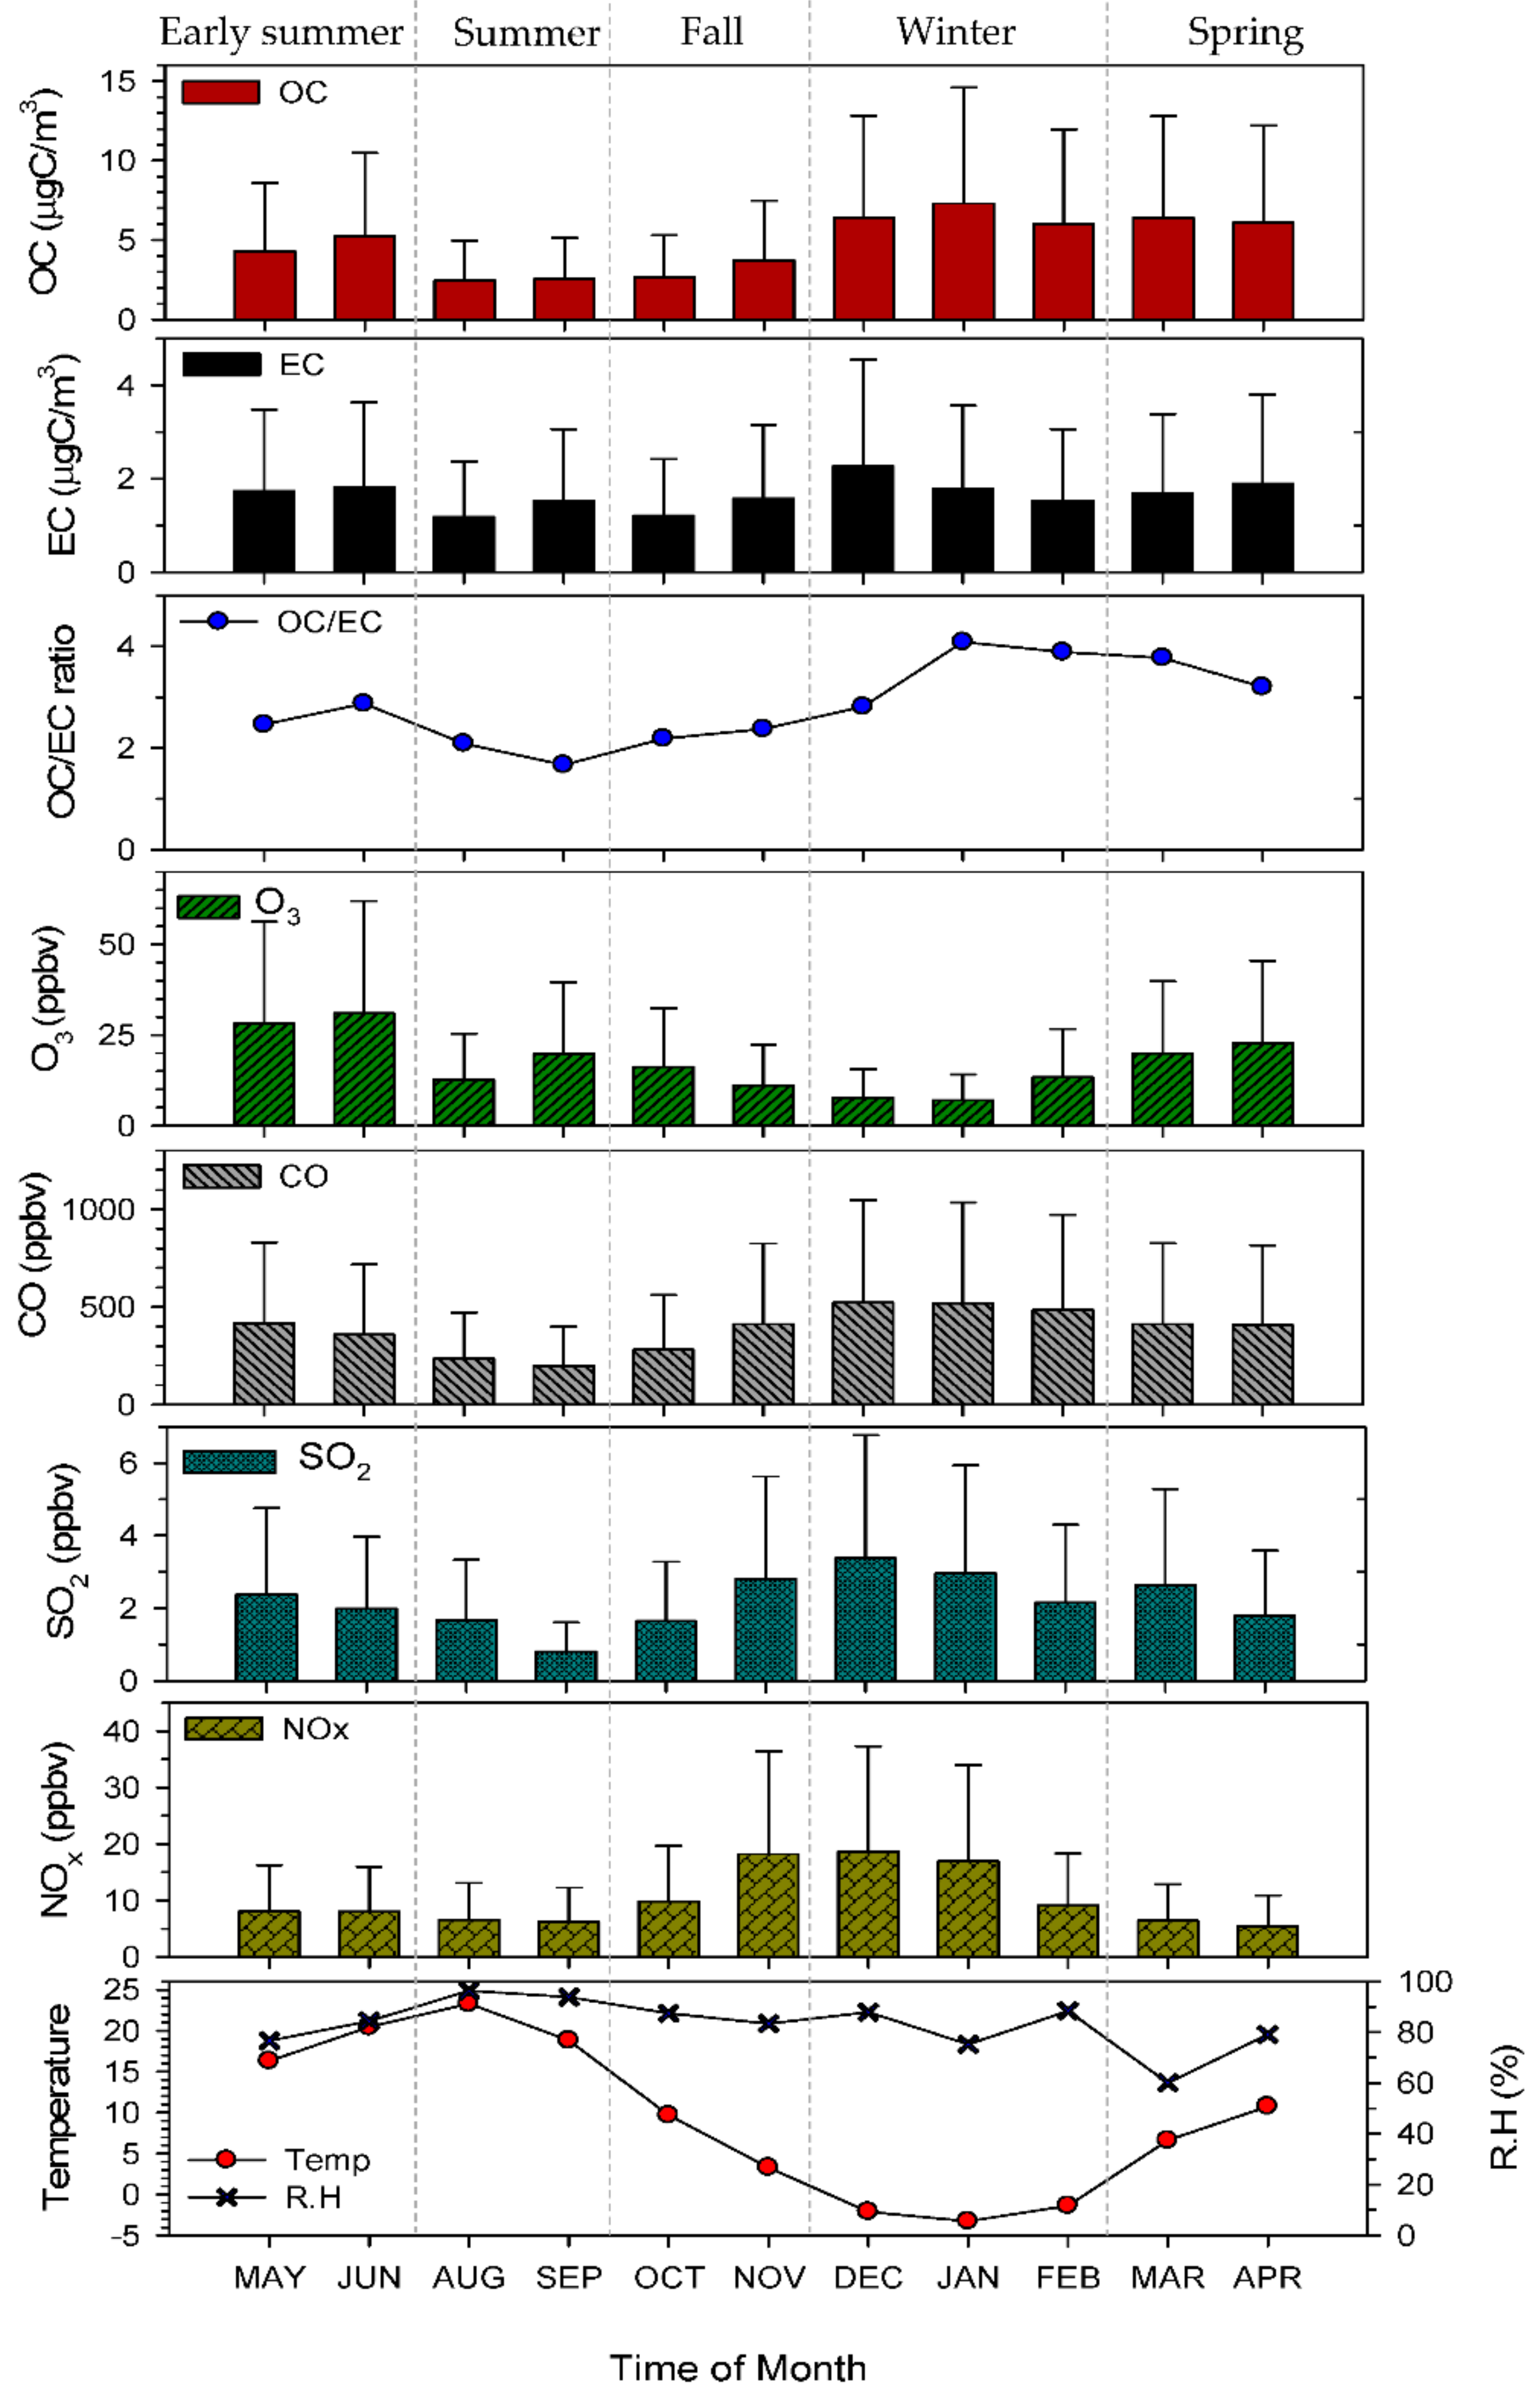
3.1. High OC and EC Concentration in Cold Months
3.2. Seasonal Variability in OC and EC
3.3. High SOC to OC Ratio in Warm Months
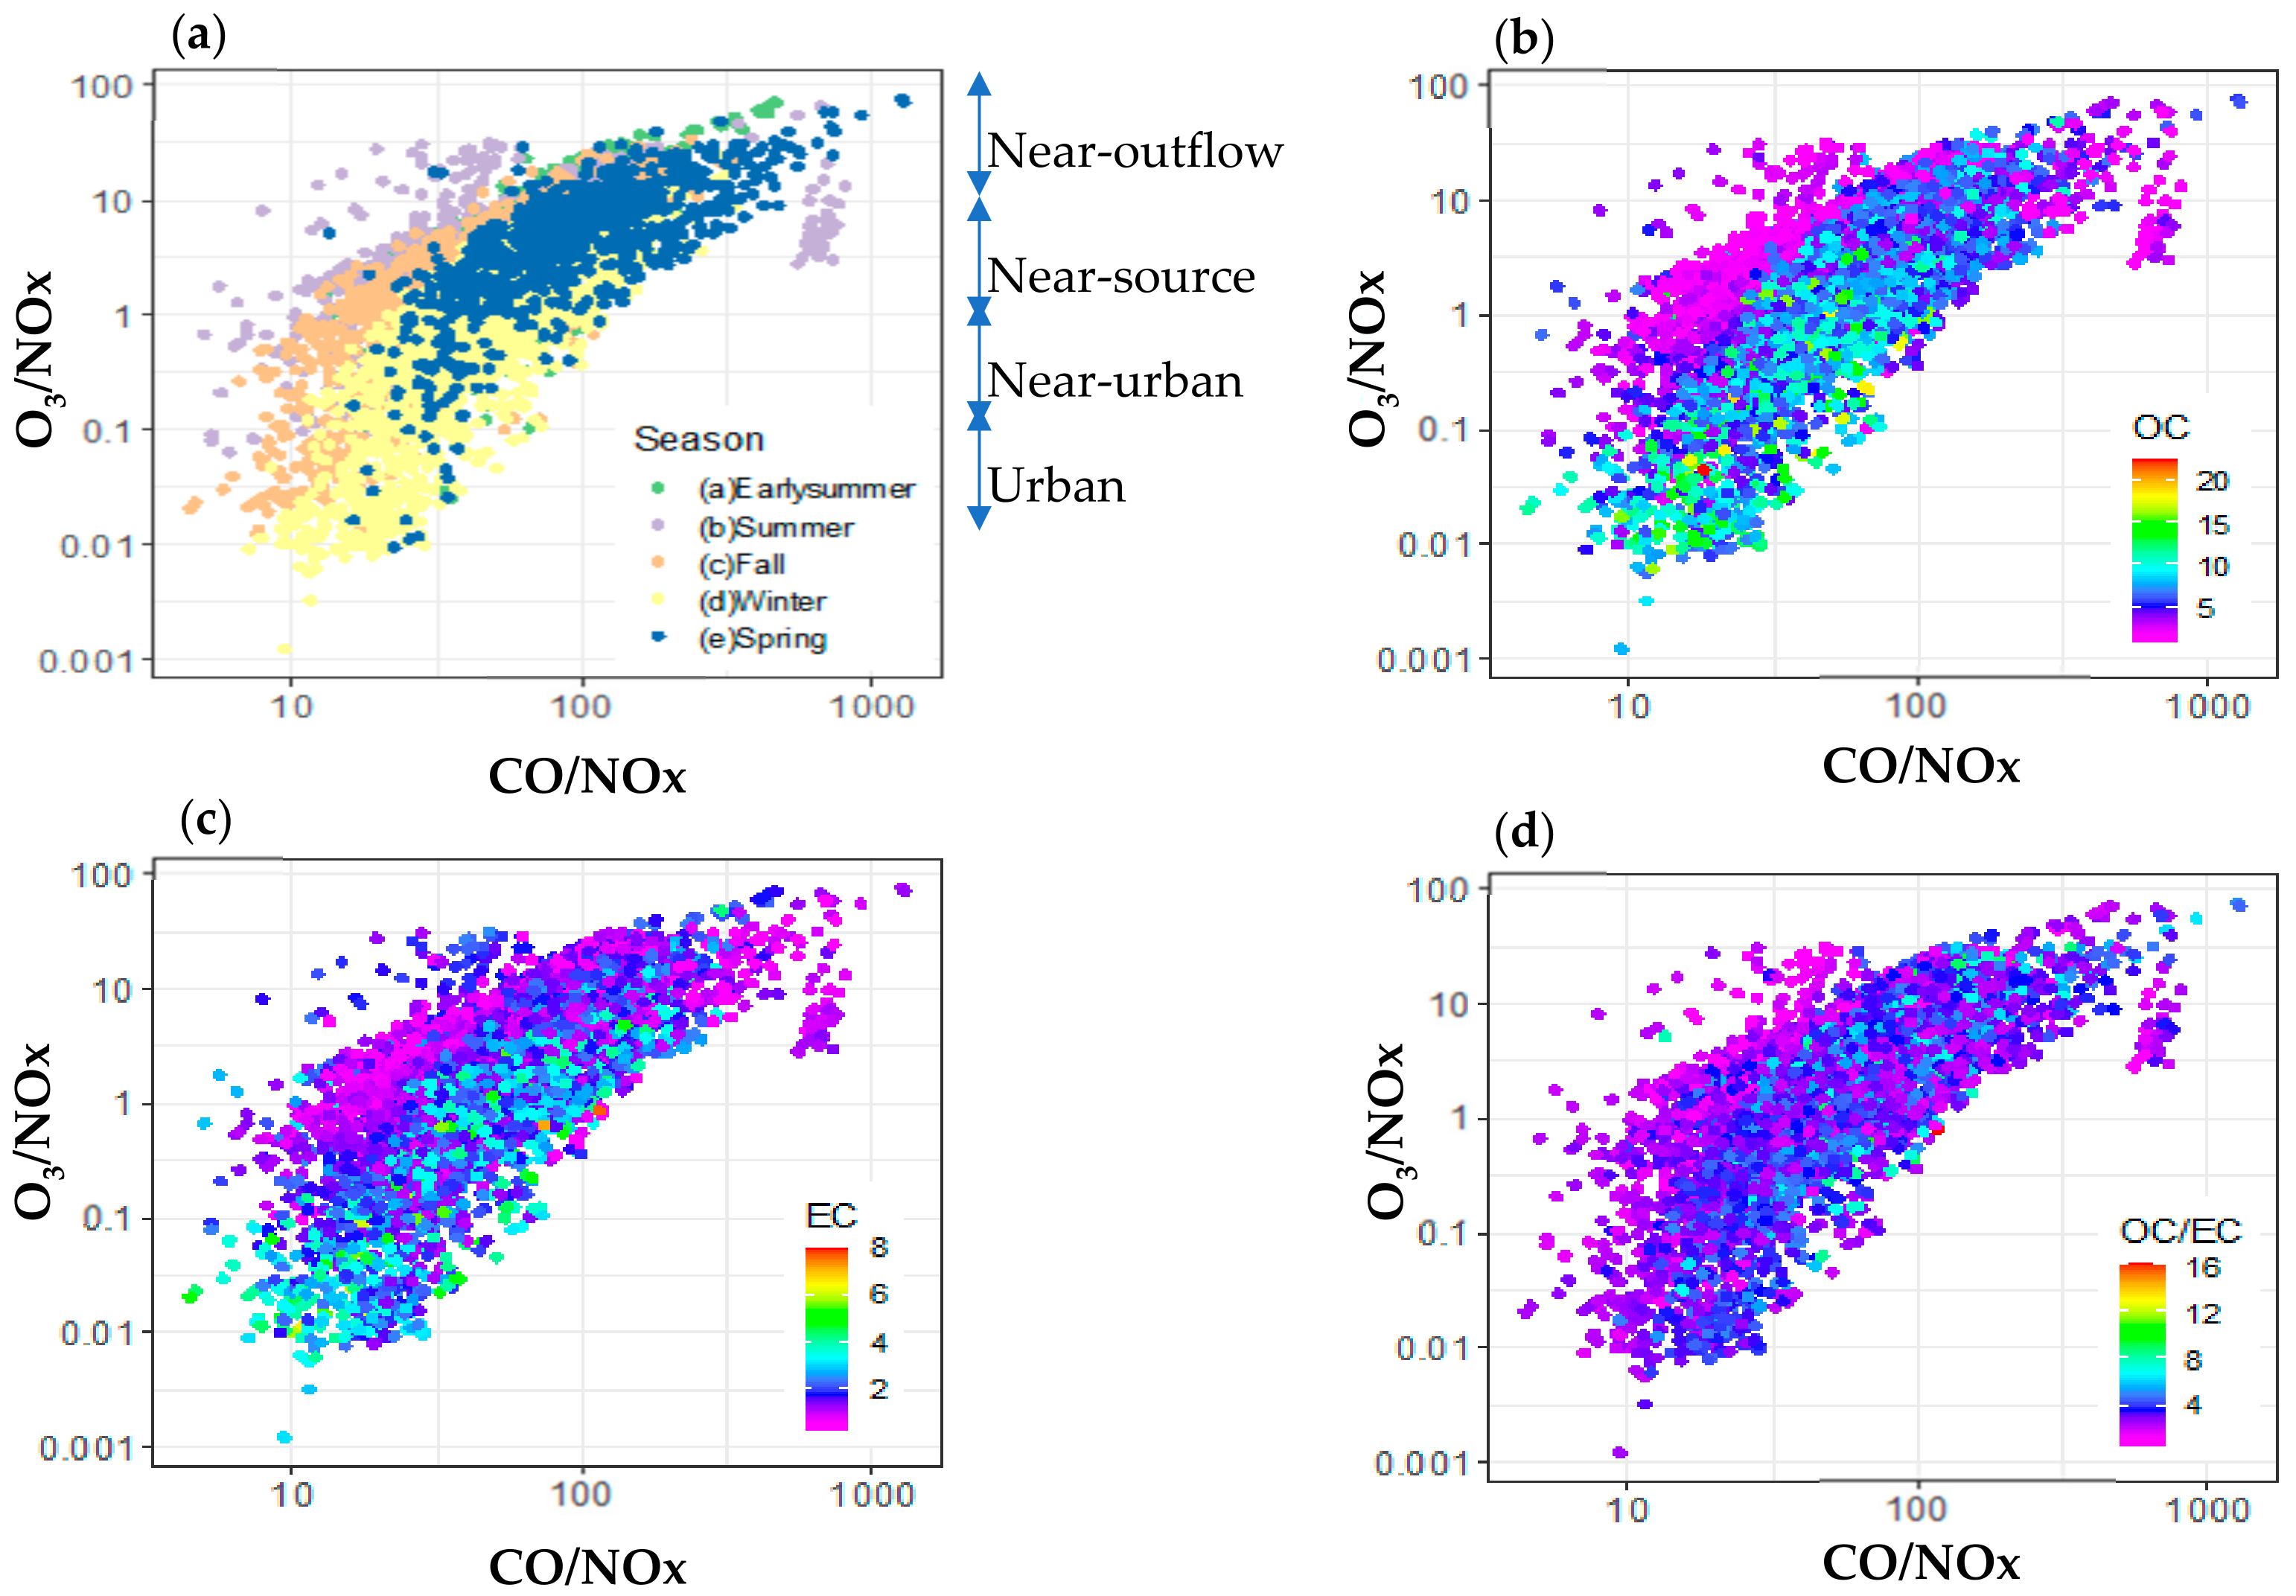
3.4. Chemical Characteristics of TRF Air Masses
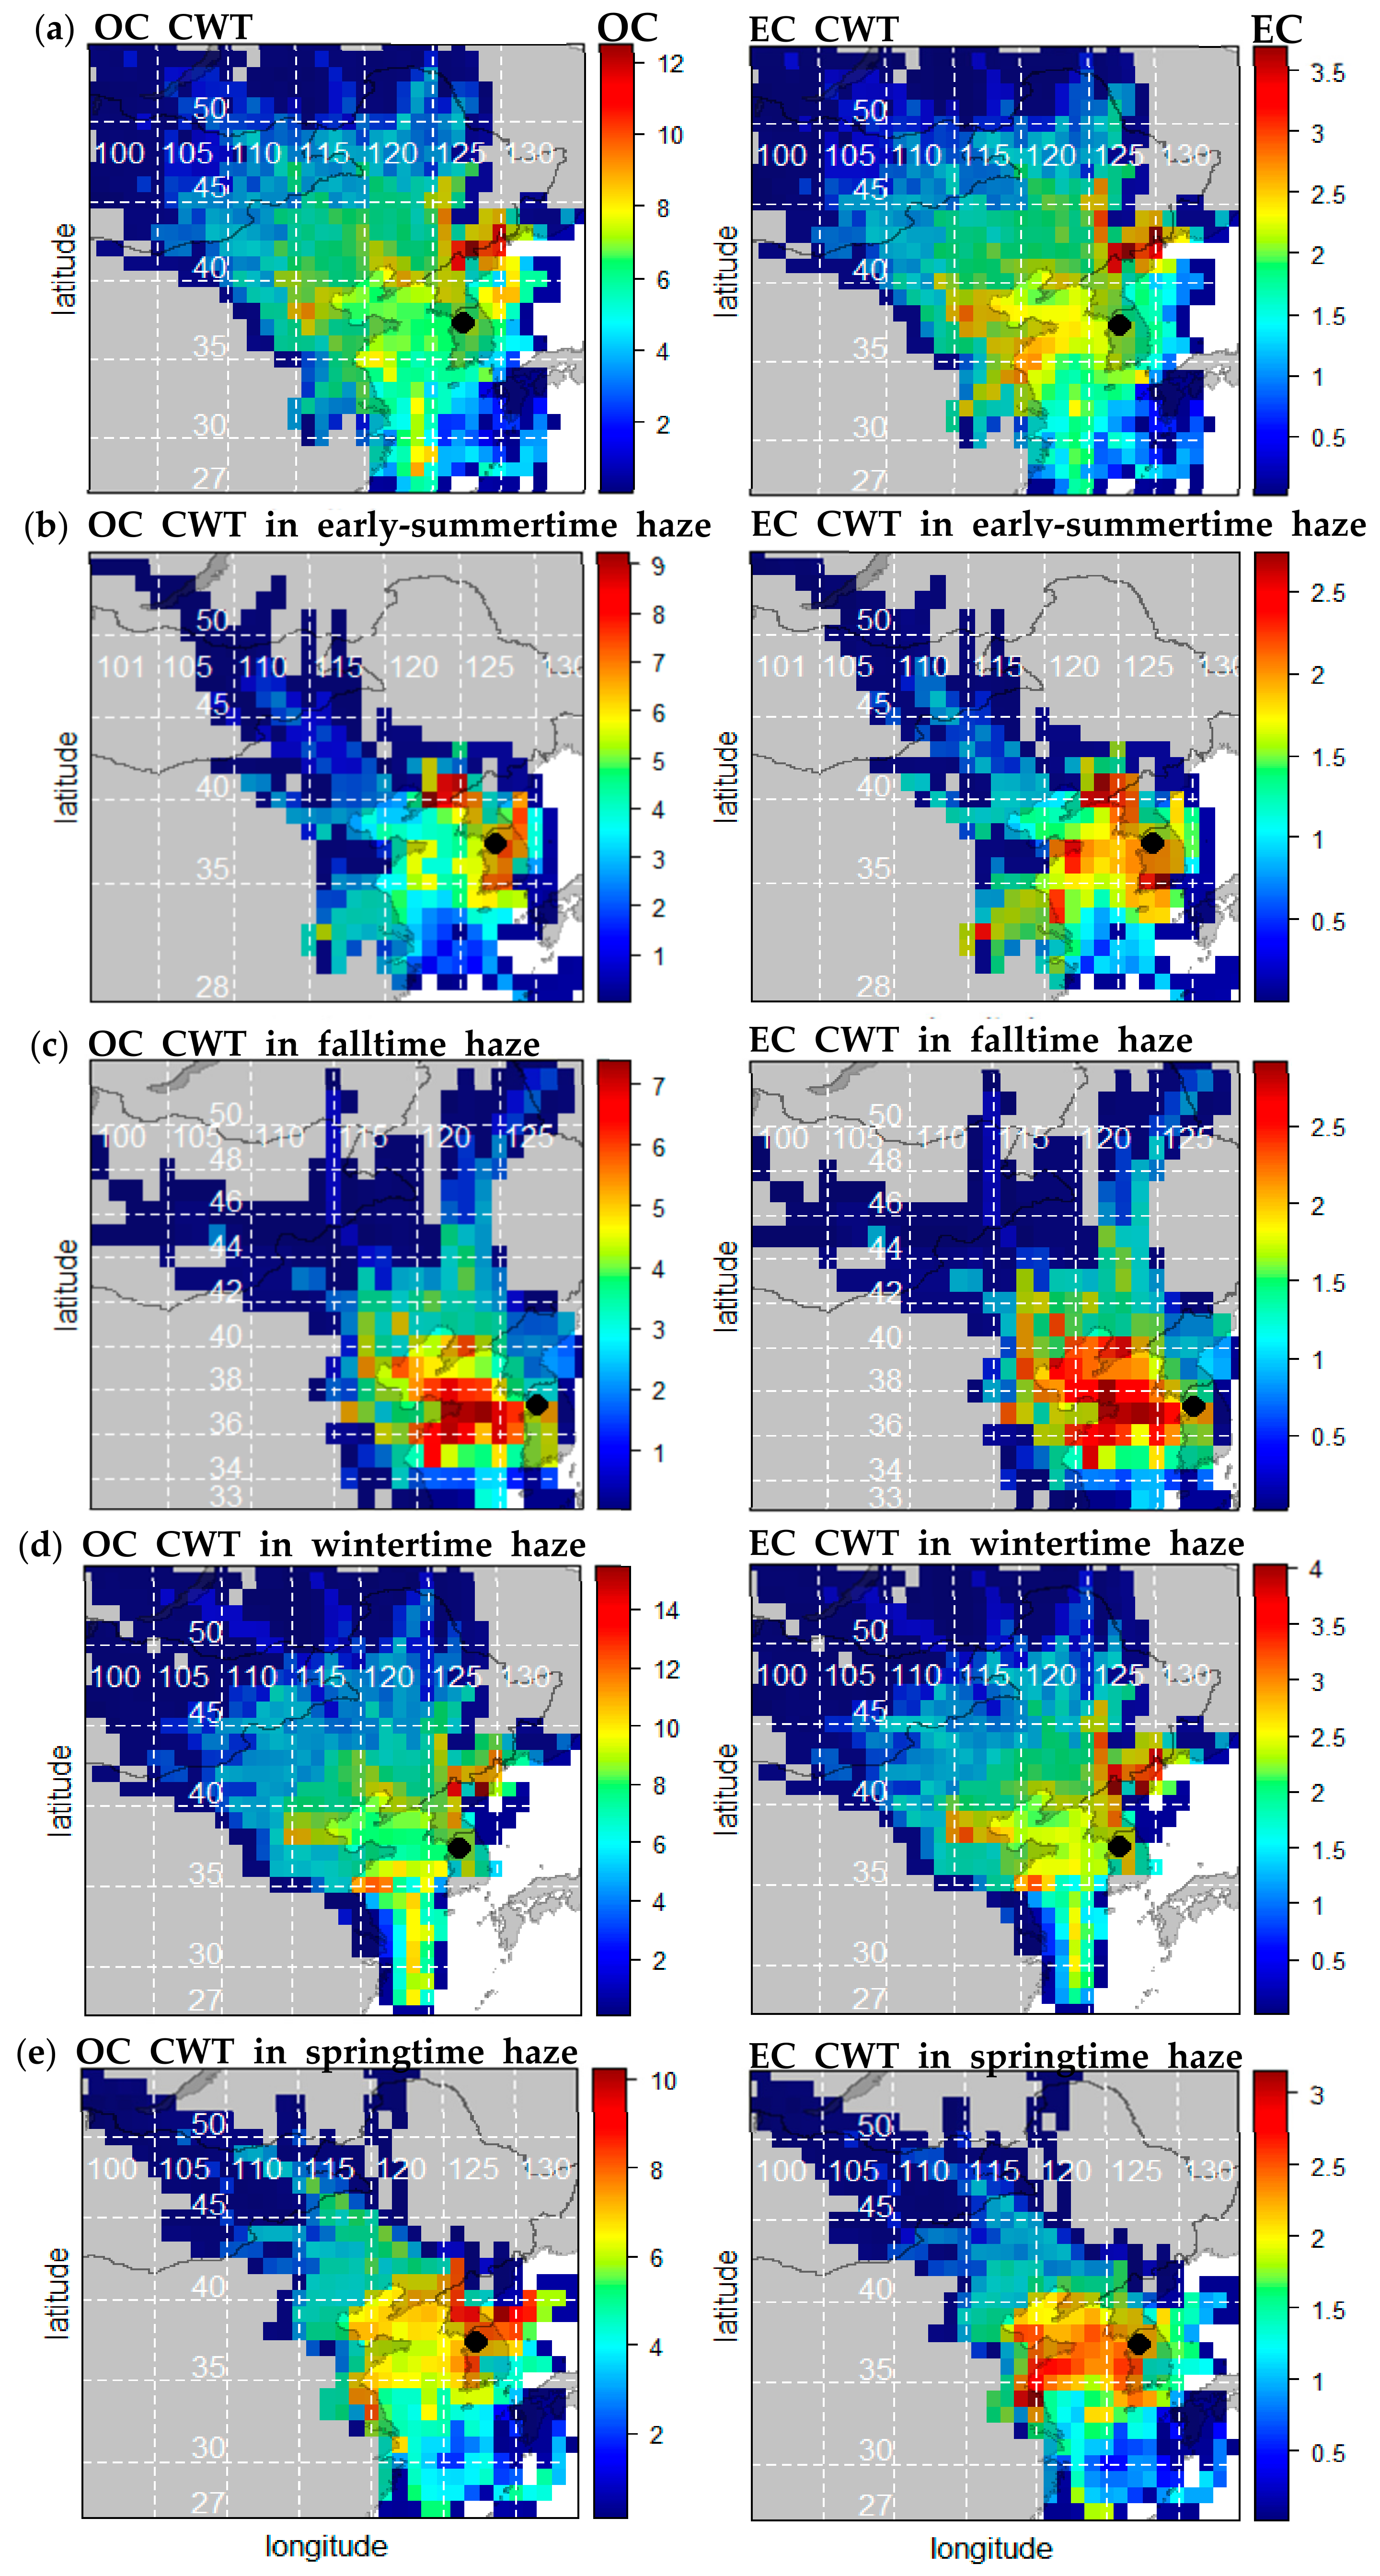
3.5. Source Signatures of OC and EC
3.6. EC as a Tracer for Haze
4. Conclusions
Author Contributions
Funding
Institutional Review Board Statement
Informed Consent Statement
Data Availability
Conflicts of Interest
References
- Hassan, A.; Ilyas, S.Z.; Agathopoulos, S.; Hussain, S.M.; Jalil, A.; Ahmed, S.; Baqir, Y. Evaluation of adverse effects of particulate matter on human life. Heliyon 2021, 7, 2405–8440. [Google Scholar] [CrossRef] [PubMed]
- Raaschou-Nielsen, O.; Andersen, Z.J.; Beelen, R.; Samoli, E.; Stafoggia, M.; Weinmayr, G.; Hoff Mann, B.; Fischer, P.; Nieuwenhuijsen, M.J.; Brunekreef, B.; et al. Air pollution and lung cancer incidence in 17 European cohorts: Prospective analyses from the European Study of Cohorts for Air Pollution Effects (ESCAPE). Lancet Oncol. 2013, 14, 813–822. [Google Scholar] [CrossRef]
- Cohen, A.J.; Anderson, H.R.; Ostro, B.; Pandey, K.D.; Krzyzanowski, M.; Künzli, N.; Gutschmidt, K.; Pope, A.; Romieu, I.; Samet, J.M.; et al. The Global Burden of Disease Due to Outdoor Air Pollution. J. Toxicol. Environ. Health Part A. 2005, 68, 1528–7394. [Google Scholar] [CrossRef] [PubMed]
- Thepnuan, D.; Chantara, S.; Lee, C.T.; Lin, N.H.; Tsai, Y.I. Molecular markers for biomass burning associated with the characterization of PM2.5 and component sources during dry season haze episodes in Upper South East Asia. Sci. Total Environ. 2019, 658, 708–722. [Google Scholar] [CrossRef] [PubMed]
- Lim, H.-J.; Turpin, B.J. Origins of Primary and Secondary Organic Aerosol in Atlanta: Results of Time-Resolved Measurements during the Atlanta Supersite Experiment. Environ. Sci. Technol. 2002, 36, 4489–4496. [Google Scholar] [CrossRef]
- Song, S.-K.; Choi, Y.-N.; Choi, Y.; Flynn, J.; Sadeghi, B. Characteristics of aerosol chemical components and their impacts on direct radiative forcing at urban and suburban locations in Southeast Texas. Atmos. Environ. 2021, 246, 1352–2310. [Google Scholar] [CrossRef]
- Janssen, N.A.H.; Hoek, G.; Simic-Lawson, M.; Fischer, P.; van Bree, L.; ten Brink, H.; Keuken, M.; Atkinson, R.W.; Anderson, H.R.; Brunekreef, B.; et al. Black Carbon as an Additional Indicator of the Adverse Health Effects of Airborne Particles Compared with PM10 and PM2.5. Environ. Health Perspect. 2011, 119, 1691–1699. [Google Scholar] [CrossRef] [Green Version]
- Boniardi, L.; Dons, E.; Longhi, F.; Scuffi, C.; Campo, L.; Poppel, M.V.; Panis, L.I.; Fustinoni, S. Personal exposure to equivalent black carbon in children in Milan, Italy: Time-activity patterns and predictors by season. Environ. Pollut. 2021, 274, 116530. [Google Scholar] [CrossRef] [PubMed]
- Pani, S.K.; Wang, S.-H.; Lin, N.-H.; Chantara, S.; Lee, C.-T.; Thepnuan, D. Black carbon over an urban atmosphere in northern peninsular Southeast Asia: Characteristics, source apportionment, and associated health risks. Environ. Pollut. 2020, 259, 113871. [Google Scholar] [CrossRef] [PubMed]
- Lin, W.; Dai, J.; Liu, R.; Zhai, Y.; Yue, D.; Hu, Q. Integrated assessment of health risk and climate effects of black carbon in the Pearl River Delta region, China. Environ. Res. 2019, 176, 108522. [Google Scholar] [CrossRef]
- Li, Y.; Henze, D.K.; Jack, D.; Henderson, B.H.; Kinney, P.L. Assessing public health burden associated with exposure to ambient black carbon in the United States. Sci. Total Environ. 2016, 539, 515–525. [Google Scholar] [CrossRef] [PubMed] [Green Version]
- Park, J.S.; Song, I.H.; Park, S.M.; Shin, H.J. The Characteristics and Seasonal Variations of OC and EC for PM2.5 in Seoul Metropolitan Area in 2014. J. Environ. Impact Assess. 2015, 24, 578–592. [Google Scholar] [CrossRef] [Green Version]
- Baumgardner, D.; Varela, S.; Escobedo, F.J.; Chacalo, A.; Ochoa, C. The role of a peri-urban forest on air quality improvement in the Mexico City megalopolis. Environ. Pollut. 2012, 163, 174–183. [Google Scholar] [CrossRef] [PubMed]
- Gu, S.; Alex, G.; Celia, F. Effects of Anthropogenic and Biogenic Volatile Organic Compounds on Los Angeles Air Quality. Environ. Sci. Technol. 2021, 55, 12191–12201. [Google Scholar] [CrossRef] [PubMed]
- Kim, S.-Y.; Jiang, X.; Lee, M.; Turnipseed, A.; Guenther, A.; Kim, J.-C.; Lee, S.-J.; Kim, S. Impact of biogenic volatile organic compounds on ozone production at the Taehwa Research Forest near Seoul, South Korea. Atmos. Environ. 2013, 70, 447–453. [Google Scholar] [CrossRef] [Green Version]
- Ham, J.; Lee, M.; Kim, H.S.; Park, H.; Cho, G.; Park, J. Variation of OC and EC in PM2.5 at Mt. Taehwa. J. Korean Soc. Atmos. Environ. 2016, 32, 21–31. [Google Scholar] [CrossRef] [Green Version]
- Kim, H.; Lee, M.; Kim, S.; Guenther, A.; Park, J.; Cho, G.; Kim, H. Measurements of Isoprene and Monoterpenes at Mt. Taehwa and Estimation of Their Emissions. Korean J. Agric. For. Meteorol. 2015, 17, 217–226. [Google Scholar] [CrossRef] [Green Version]
- Gil, J.; Lee, M.; Han, J.; Kim, S.; Guenther, A.; Kim, H.; Kim, S.; Park, H. Peroxyacetyl Nitrate and Ozone Enhancement at Taehwa Research Forest under the Influence of Seoul Metropolitan Area. Aerosol Air Qual. Res. 2018, 18, 2262–2273. [Google Scholar] [CrossRef] [Green Version]
- Lim, S.; Lee, M.; Czimczik, C.I.; Joo, T.; Holden, S.; Mouteva, G.; Santos, G.M.; Xu, X.; Walker, J.; Kim, S.; et al. Source signatures from combined isotopic analyses of PM2.5 carbonaceous and nitrogen aerosols at the peri-urban Taehwa Research Forest, South Korea in summer and fall. Sci. Total Environ. 2019, 655, 1505–1514. [Google Scholar] [CrossRef] [PubMed]
- Sullivan, J.T.; McGee, T.J.; Stauffer, R.M.; Thompson, A.M.; Weinheimer, A.; Knote, C.; Janz, S.; Wisthaler, A.; Long, R.; Szykman, J.; et al. Taehwa Research Forest: A receptor site for severe domestic pollution events in Korea during 2016. Atmos. Chem. Phys. 2019, 19, 5051–5067. [Google Scholar] [CrossRef] [Green Version]
- Chow, J.C.; Watson, J.G.; Pritchett, L.C.; Pierson, W.R.; Frazier, C.A.; Purcell, R.G. The dri thermal/optical reflectance carbon analysis system: Description, evaluation and applications in U.S. Air quality studies. Atmos. Environ. Part A. Gen. Top. 1993, 27, 1185–1201. [Google Scholar] [CrossRef]
- Turpin, B.J.; Huntzicker, J.J. Identification of secondary organic aerosol episodes and quantitation of primary and secondary organic aerosol concentrations during SCAQS. Atmos. Environ. 1995, 29, 3527–3544. [Google Scholar] [CrossRef]
- Cabada, J.C.; Pandis, S.N.; Subramanian, R.; Robinson, A.L.; Polidori, A.; Turpin, B. Estimating the Secondary Organic Aerosol Contribution to PM2.5 Using the EC Tracer Method Special Issue of Aerosol Science and Technology on Findings from the Fine Particulate Matter Supersites Program. Aerosol Sci. Technol. 2004, 38, 140–155. [Google Scholar] [CrossRef] [Green Version]
- Polidori, A.; Turpin, B.J.; Lim, H.-J.; Cabada, J.C.; Subramanian, R.; Pandis, S.N.; Robinson, A.L. Local and Regional Secondary Organic Aerosol: Insights from a Year of Semi-Continuous Carbon Measurements at Pittsburgh. Aerosol Sci. Technol. 2006, 40, 861–872. [Google Scholar] [CrossRef]
- Yuan, Z.B.; Yu, J.Z.; Lau, A.K.H.; Louie, P.K.K.; Fung, J.C.H. Application of positive matrix factorization in estimating aerosol secondary organic carbon in Hong Kong and its relationship with secondary sulfate. Atmos. Chem. Phys. 2006, 6, 25–34. [Google Scholar] [CrossRef] [Green Version]
- Hsu, Y.; Holsen, T.M.; Hopke, P.K. Comparison of hybrid receptor models to locate PCB sources in Chicago. Atmos. Environ. 2003, 37, 545–562. [Google Scholar] [CrossRef]
- Carslaw, D.C.; Ropkins, K. openair—An R package for air quality data analysis. Environ. Model. Softw. 2012, 27–28, 52–61. [Google Scholar] [CrossRef]
- Kim, J.A.; Lim, S.; Shang, X.; Lee, M.; Kang, K.S.; Ghim, Y.S. Characteristics of PM2. 5 Chemical Composition and High-concentration Episodes Observed in Jeju from 2013 to 2016. J. Korean Soc. Atmos. Environ. 2020, 36, 388–403. [Google Scholar] [CrossRef]
- Kim, Y.; Yi, S.-M.; Heo, J. Fifteen-year trends in carbon species and PM2.5 in Seoul, South Korea (2003–2017). Chemosphere 2020, 261, 127750. [Google Scholar] [CrossRef] [PubMed]
- Ji, D.; Zhang, J.; He, J.; Wang, X.; Pang, B.; Liu, Z.; Wang, L.; Wang, Y. Characteristics of atmospheric organic and elemental carbon aerosols in urban Beijing, China. Atmos. Environ. 2016, 125, 293–306. [Google Scholar] [CrossRef]
- Paredes-Miranda, G.; Arnott, W.P.; Moosmüller, H.; Green, M.C.; Gyawali, M. Black Carbon Aerosol Concentration in Five Cities and Its Scaling with City Population. Bull. Am. Meteorol. Soc. 2013, 94, 41–50. [Google Scholar] [CrossRef] [Green Version]
- Lim, S.; Kang, Y.; Lee, M.; Yoo, H.-J.; Lee, S.-S.; Lee, G.-H. Mass Concentration and Size Distribution of Refractory Black Carbon in Seoul during Summer. J. Korean Soc. Atmos. Environ. 2019, 35, 713–725. [Google Scholar] [CrossRef]
- Pio, C.; Cerqueira, M.; Harrison, R.M.; Nunes, T.; Mirante, F.; Alves, C.; Oliveira, C.; Sanchez De La Campa, A.; Artíñano, B.; Matos, M. OC/EC ratio observations in Europe: Re-thinking the approach for apportionment between primary and secondary organic carbon. Atmos. Environ. 2011, 45, 6121–6132. [Google Scholar] [CrossRef]
- Park, S.-S.; Jung, S.-A.; Gong, B.-J.; Cho, S.-Y.; Lee, S.-J. Characteristics of PM2.5 haze episodes revealed by highly time-resolved measurements at an air pollution monitoring Supersite in Korea. Aerosol Air Qual. Res. 2013, 13, 957–976. [Google Scholar] [CrossRef]
- Tian, J.; Ni, H.; Cao, J.; Han, Y.; Wang, Q.; Wang, X.; Chen, L.-W.A.; Chow, J.C.; Watson, J.G.; Wei, C.; et al. Characteristics of carbonaceous particles from residential coal combustion and agricultural biomass burning in China. Atmos. Pollut. Res. 2017, 8, 521–527. [Google Scholar] [CrossRef]
- Day, M.C.; Zhang, M.; Pandis, S.N. Evaluation of the ability of the EC tracer method to estimate secondary organic carbon. Atmos. Environ. 2015, 112, 317–325. [Google Scholar] [CrossRef]
- Morgan, W.T.; Allan, J.D.; Bower, K.N.; Highwood, E.J.; Liu, D.; Mcmeeking, G.R.; Northway, M.J.; Williams, P.I.; Krejci, R.; Coe, H. Airborne measurements of the spatial distribution of aerosol chemical composition across Europe and evolution of the organic fraction. Atmos. Chem. Phys. 2010, 10, 4065–4083. [Google Scholar]
- Takegawa, N.; Kondo, Y.; Koike, M.; Chen, G.; Machida, T.; Watai, T.; Blake, D.R.; Streets, D.G.; Woo, J.-H.; Carmichael, G.R.; et al. Removal of NOx and NOy in Asian outflow plumes: Aircraft measurements over the western Pacific in January 2002. JGR Atmos. 2004, 109, D23S04. [Google Scholar]
- Wang, Y.X.; Mcelroy, M.B.; Wang, T.; Palmer, P.I. Asian emissions of CO and NOx: Constraints from aircraft and Chinese station data. J. Geophys. Res. 2004, 109, D24304. [Google Scholar] [CrossRef] [Green Version]
- Tang, W.; Emmons, L.K.; Arellano, A.F., Jr.; Gaubert, B.; Knote, C.; Tilmes, S.; Buchholz, R.R.; Pfister, G.G.; Diskin, G.S.; Blake, D.R.; et al. Source Contributions to Carbon Monoxide Concentrations During KORUS-AQ Based on CAM-chem Model Applications. J. Geophys. Res. Atmos. 2019, 124, 2796–2822. [Google Scholar] [CrossRef]
- Lim, S.; Lee, M.; Lee, G.; Kim, S.; Yoon, S.; Kang, K. Ionic and carbonaceous compositions of PM10, PM2.5 and PM1.0 at Gosan ABC Superstation and their ratios as source signature. Atmos. Chem. Phys. 2012, 12, 2007–2024. [Google Scholar] [CrossRef] [Green Version]
- Yu, X.; Ma, J.; An, J.; Yuan, L.; Zhu, B.; Liu, D.; Wang, J.; Yang, Y.; Cui, H. Impacts of meteorological condition and aerosol chemical compositions on visibility impairment in Nanjing, China. J. Clean. Prod. 2016, 131, 112–120. [Google Scholar] [CrossRef]
- Tao, J.; Zhang, L.; Gao, J.; Wang, H.; Chai, F.; Wang, S. Aerosol chemical composition and light scattering during a winter season in Beijing. Atmos. Environ. 2015, 110, 36–44. [Google Scholar] [CrossRef]
- Wang, Y.H.; Liu, Z.R.; Zhang, J.K.; Hu, B.; Ji, D.S.; Yu, Y.C.; Wang, Y.S. Aerosol physicochemical properties and implications for visibility during an intense haze episode during winter in Beijing. Atmos. Chem. Phys. 2015, 15, 3205–3215. [Google Scholar] [CrossRef] [Green Version]
- Jordan, C.E.; Crawford, J.H.; Beyersdorf, A.J.; Eck, T.F.; Halliday, H.S.; Nault, B.A.; Chang, L.-S.; Park, J.; Park, R.; Lee, G.; et al. Investigation of factors controlling PM2.5 variability across the South Korean Peninsula during KORUS-AQ. Sci. Anthr. 2020, 8, 1026–2325. [Google Scholar] [CrossRef] [PubMed]


| Site (Type) | PM2.5 (μgC/m3) | OC (μgC/m3) | EC (μgC/m3) |
|---|---|---|---|
| This study, TRF (peri-urban) | - | 5.1 | 1.7 |
| Seoul, South Korea (urban) | 30.6 | 5.9 | 1.2 |
| Jeju, South Korea (background) | 18.6 | 2.9 | 0.8 |
| Beijing, China (urban) | 93.8 | 14.0 | 4.1 |
| Title | Total | Early Summer (May–June) | Summer (August–September) | Fall (October–November) | Winter (December–February) | Spring (March–April) | ||||||||||||
|---|---|---|---|---|---|---|---|---|---|---|---|---|---|---|---|---|---|---|
| All | Haze | Non-Haze | All | Haze | Non-Haze | All | Haze | Non-Haze | All | Haze | Non-Haze | All | Haze | Non-Haze | All | Haze | Non-Haze | |
| Frequency of days | 280 | 136 | 144 | 49 | 41 | 16 | 41 | 5 | 36 | 52 | 15 | 37 | 89 | 48 | 41 | 49 | 35 | 14 |
| OC (μgC/m3) | 5.1 | 6.6 | 3.5 | 4.9 | 5.5 | 3.4 | 2.5 | 3.3 | 2.4 | 3.3 | 4.6 | 2.7 | 6.7 | 7.9 | 4.9 | 6.2 | 6.9 | 4.1 |
| EC (μgC/m3) | 1.7 | 2.1 | 1.3 | 1.8 | 1.9 | 1.5 | 1.4 | 1.3 | 1.4 | 1.4 | 2.0 | 1.1 | 1.9 | 2.3 | 1.4 | 1.8 | 2.1 | 1.0 |
| OC/EC | 3.15 | 3.34 | 2.95 | 2.84 | 3.05 | 2.37 | 1.98 | 2.56 | 1.90 | 2.46 | 2.24 | 2.57 | 3.82 | 3.74 | 3.93 | 3.84 | 3.63 | 4.44 |
| O3 (ppb) | 16.8 | 18.3 | 15.1 | 29.9 | 32.2 | 25.2 | 16.3 | 19.9 | 15.7 | 13.1 | 11.4 | 14. | 8.9 | 8.2 | 9.8 | 21.8 | 22.6 | 19.5 |
| CO (ppb) | 407 | 480 | 323 | 379 | 402 | 332 | 217 | 268 | 209 | 362 | 504 | 287 | 511 | 581 | 424 | 410 | 430 | 357 |
| SO2 (ppb) | 2.3 | 3.0 | 1.6 | 2.1 | 2.3 | 1.7 | 1.2 | 1.6 | 1.2 | 2.4 | 3.2 | 1.9 | 2.9 | 3.8 | 1.8 | 2.1 | 2.5 | 1.0 |
| NOx (ppb) | 10.6 | 11.9 | 9.0 | 7.5 | 7.5 | 7.4 | 5.6 | 6.6 | 5.5 | 14.4 | 21.3 | 10.9 | 15.1 | 17.1 | 12.4 | 5.5 | 5.9 | 4.4 |
| Temp. (°C) | 8.0 | 7.7 | 8.3 | 18.9 | 18.9 | 18.4 | 21.4 | 22.3 | 21.2 | 4.8 | 5.1 | 4.7 | −2.4 | −2.0 | −2.9 | 9.2 | 9.9 | 7.1 |
| RH (%) | 83.4 | 82.9 | 84.0 | 82.3 | 79.5 | 87.9 | 95.3 | 95.7 | 95.3 | 84.3 | 89.0 | 81.6 | 83.0 | 85.6 | 77.3 | 76.2 | 77.4 | 73.8 |
| Period | (OC/EC)primary | b | r2 | SOC (μgC/m3) | SOC/OC (%) |
|---|---|---|---|---|---|
| Early summer (May–Jun) | 0.83 | 0.36 | 0.61 | 3.37 | 70.8 |
| Fall (Oct–Nov) | 0.80 | 0.20 | 0.55 | 1.92 | 60.1 |
| Winter (Dec–Feb) | 1.90 | 0.12 | 0.83 | 3.05 | 45.9 |
| Spring (Mar–Apr) | 1.66 | 0.38 | 0.84 | 3.18 | 51.2 |
| Season | OC | EC | OC/EC | CO | SO2 | NOx | RH | Temp. |
|---|---|---|---|---|---|---|---|---|
| Early Summer | 1.62 | 1.24 | 1.29 | 1.21 | 1.35 | 1.02 | 0.90 | 1.03 |
| Fall | 1.69 | 1.78 | 0.87 | 1.75 | 1.63 | 1.95 | 1.09 | 1.08 |
| Winter | 1.70 | 1.68 | 0.95 | 1.37 | 2.15 | 1.38 | 1.11 | 1.49 |
| Spring | 1.66 | 2.15 | 0.82 | 1.20 | 2.53 | 1.34 | 1.05 | 1.39 |
Publisher’s Note: MDPI stays neutral with regard to jurisdictional claims in published maps and institutional affiliations. |
© 2021 by the authors. Licensee MDPI, Basel, Switzerland. This article is an open access article distributed under the terms and conditions of the Creative Commons Attribution (CC BY) license (https://creativecommons.org/licenses/by/4.0/).
Share and Cite
Ham, J.; Suh, I.; Lee, M.; Kim, H.; Kim, S. Elemental Carbon Observed at a Peri-Urban Forest Site near the Seoul Metropolitan Area as a Tracer of Seasonal Haze Occurrence. Atmosphere 2021, 12, 1627. https://doi.org/10.3390/atmos12121627
Ham J, Suh I, Lee M, Kim H, Kim S. Elemental Carbon Observed at a Peri-Urban Forest Site near the Seoul Metropolitan Area as a Tracer of Seasonal Haze Occurrence. Atmosphere. 2021; 12(12):1627. https://doi.org/10.3390/atmos12121627
Chicago/Turabian StyleHam, Jeeyoung, Inseon Suh, Meehye Lee, Hyunseok Kim, and Soyoung Kim. 2021. "Elemental Carbon Observed at a Peri-Urban Forest Site near the Seoul Metropolitan Area as a Tracer of Seasonal Haze Occurrence" Atmosphere 12, no. 12: 1627. https://doi.org/10.3390/atmos12121627
APA StyleHam, J., Suh, I., Lee, M., Kim, H., & Kim, S. (2021). Elemental Carbon Observed at a Peri-Urban Forest Site near the Seoul Metropolitan Area as a Tracer of Seasonal Haze Occurrence. Atmosphere, 12(12), 1627. https://doi.org/10.3390/atmos12121627