Article

The LAI Coupling Associated with the M6 Luxian Earthquake in China on 16 September 2021

1
Institute of Geophysics and Geomatics, China University of Geosciences, Wuhan 430074, China
2
Institute of Earthquake Forecasting, China Earthquake Administration, Beijing 100036, China
3
China Earthquake Networks Center, Beijing 100045, China
4
Institute of Applied Mechanics, School of Civil Engineering, Hefei University of Technology, Hefei 230009, China
5
Sichuan Earthquake Bureau, Chengdu 610041, China
*
Author to whom correspondence should be addressed.
Atmosphere 2021, 12(12), 1621; https://doi.org/10.3390/atmos12121621
Submission received: 22 November 2021 / Revised: 1 December 2021 / Accepted: 3 December 2021 / Published: 5 December 2021

Abstract

:
Periodic signals replaced noise that was found in continuous seismic data, particularly in the nighttime, from the broadband seismometer at the MVP-LAI (monitoring vibrations and perturbations in the lithosphere, atmosphere and ionosphere) system before the occurrence of the Luxian earthquake on 16 September 2021. A short distance of ~150 km between the MVP-LAI system and the epicenter of the Luxian earthquake suggests the periodic singles as promising seismo-phenomena, due to that the radius of the earthquake preparation zone is ~380 km for an M6 event. Integration of geophysical parameters, including atmospheric pressure, vertical electric field, radon concentration, groundwater level and precipitation, at the MVP-LAI system provides an excellent opportunity for studying the seismo-LAI coupling associated with the Luxian earthquake. Analytical results show that ground vibrations, atmospheric pressure and total electron content varied from ~10−3 to ~10−2 Hz before the Luxian earthquake. The seismo-LAI coupling in the relatively low frequency band (~10−3 Hz) can be referred to as the acoustic-gravity waves triggered by the amplified ground vibrations. In contrast, the seismo-LAI coupling in a relatively high frequency band (~10−2 Hz) would be caused by micro-cracks and/or the high-mode natural frequency that further drives changes of TEC due to the atmospheric resonance.

1. Introduction

A fault at a depth of ~10 km underground dislocated around Luxian in the southeast of Sichuan in China at 04:33 LT on 16 September 2021, and hereafter the event was named the Luxian earthquake. The Luxian earthquake (105.3° E, 29.2° N; Figure 1), with a magnitude of 6, caused more than 100 aftershocks within the following three days. Previous studies [1,2,3,4] reported that areas dominated by earthquake-related stress accumulation in the crust are many times larger than the fault rupture zones of earthquakes. A radius of the earthquake preparation zone can be generally estimated by the formula (R = 100.43 M, where R is the radius of the zone, and M is the magnitude of an earthquake) proposed by Dobrovolsky et al. [5]. Based on the formula, the radius of the zone associated with the M6 Luxian earthquake is ~380 km. A novel instrumental system for monitoring vibrations and perturbations in the lithosphere, atmosphere and ionosphere (MVP-LAI) was established in the Sichuan Basin in 2021 [6]. The MVP-LAI system comprises more than 14 distinct instruments with a short sampling interval (for more details, see Reference [6]) for routinely monitoring vibrations and perturbations in the LAI, utilizing more than 14 distinct geophysical parameters. Most instruments were installed within a place with a size of ~400 (=20 × 20) m2. Meanwhile, the Qinghai-Tibet plateau near the Sichuan Basin yields an obvious discrepancy of ~3000 km in altitude (Figure 1). These provide an excellent opportunity for studying vertical vibrations and perturbations in the LAI coupling. Note that the MVP-LAI system is located ~150 km away from the epicenter of the Luxian earthquake. The distance between the MVP-LAI system and the epicenter is smaller than the radius (i.e., ~380 km) of the earthquake preparation zone estimated by the formula. This suggests that seismo-anomalous phenomena could exhibit a high opportunity existing around the MVP-LAI system.
Hayakawa [7,8] summarized numerous studies and concluded that four promising channels through which seismo-anomalies in the lithosphere can drive changes in the atmosphere and ionosphere. The chemical channel is mainly dominated by releases of air from the underground to the atmosphere changing atmospheric contents near the Earth’s surface [7,8]. Changes in the atmospheric contents can generate local atmospheric electrical anomalies, leading to ionospheric modification over epicenters [9,10,11]. In addition, seismo-thermal anomalies [12,13,14] can also be detected due to the radon variations. The seismo-LAI coupling through the chemical channel can be determined once anomalous phenomena are limited within observation data of radon concentration and the electrical field near the Earth’s surface. Regarding the conductivity channel, variations in groundwater levels [15] and/or accumulation of stress in the crust [16,17] change underlying electrical conductivity that causes downward lightings as upward ones heating the ionosphere [18,19,20]. Once the conductivity channel is the causal mechanism of the seismo-LAI coupling, anomalous phenomena can be found in the groundwater levels and the electrical field near the Earth’s surface. On the other hand, seismo-thermal anomaly and ground vibrations before earthquakes can drive change in the ionosphere through the acoustic-gravity waves [21,22,23,24,25,26]. Chen et al. [2] observed ground vibrations in a wide area before earthquake occurrence from seismograms and ground-based GNSS (Global Navigation Satellite System) data. The ground vibrations exhibit characteristics of the frequency at ~10−4 to ~10−3 Hz [2], which is considered to be the natural frequency, due to the fact that the earthquake-related stress accumulates in a thin crustal plate with a size close to the earthquake preparation zone [27,28]. Ground vibrations can originate changes in atmospheric pressure near the Earth’s surface [29]. Changes in atmospheric pressure would propagate upward to the ionosphere and further cause variations in the total electron content (TEC) [30]. In terms of the electromagnetic channel, the seismo-electromagnetic field with enhancements at the frequency of ~0.01 Hz directly influences TEC in the ionosphere due to seismo-electromagnetic emissions. The seismo-LAI coupling through the electromagnetic channel can be examined by utilizing amplitude of the electromagnetic data via the Fourier transform [31,32,33] and/or the geomagnetic polarization method [34,35,36]. In short, data comprise multiple geophysical parameters that are necessary for the clarification of the channels dominating the seismo-LAI coupling. The power efficiency of the MVP-LAI system, which monitors numerous geophysical parameters in a limited place, creates an excellent chance to clarify the causal mechanisms of the seismo-LAI coupling during the Luxian earthquake.
In this study, groundwater levels in the well with a depth of 5 m from the piezometer (MIK-P260; a sampling interval: 2 s; a resolution of 0.0001 m), ground vibrations from the broadband seismometers (Trillium 120QA; a sampling interval: 0.01 s; environmental noise level: ~200 counts), surface atmospheric pressure from the barometers (PTB330; a sampling interval of 2 s; a resolution of 0.01 hPa), surface vertical electric field from the atmospheric electric field meter (CS110; a sampling interval: 1 s; a resolution of 0.32 V/m), air radon concentration from the emanometer (AlphaGUARD P2000F; a sampling interval of 10 min; a resolution of 0.01 pCi/l), precipitation from the udometer (WS100; a sampling interval of 3600 s; a resolution of 0.01 mm) and the TEC data at 350 km in altitude, which are continuously retrieved from the ground-based station (GR50; a sampling interval of 1 s) located at the northwestern side of the MVP-LAI system and the geostationary satellites of the BeiDou navigation system (BDS) [37], were retrieved from the MVP-LAI system (for more detailed information, please visit the website at http://geostation.top (accessed on 2 December 2021), and also see Reference [6]) during 1 August–16 September 2021. The employee of the BDS geostationary satellite can make sure the monitoring of the TEC at the ionospheric pierce point [38] that is “right” over the MVP-LAI system 24–7, without interruption. All of these retrieved data were compared in both the time and frequency domain, due to the fact that the seismo-LAI coupling through the multiple channels cannot be ruled out. After geophysical parameters without significant anomalies were eliminated, residuals with anomalies were utilized to determine causal mechanisms of the seismo-LAI coupling. Note that it is a pity that the magnetometer at the MVP-LAI system did not function during the Luxian earthquake; thus, examinations of the electromagnetic channel could not be processed in this study.

2. Interpretation

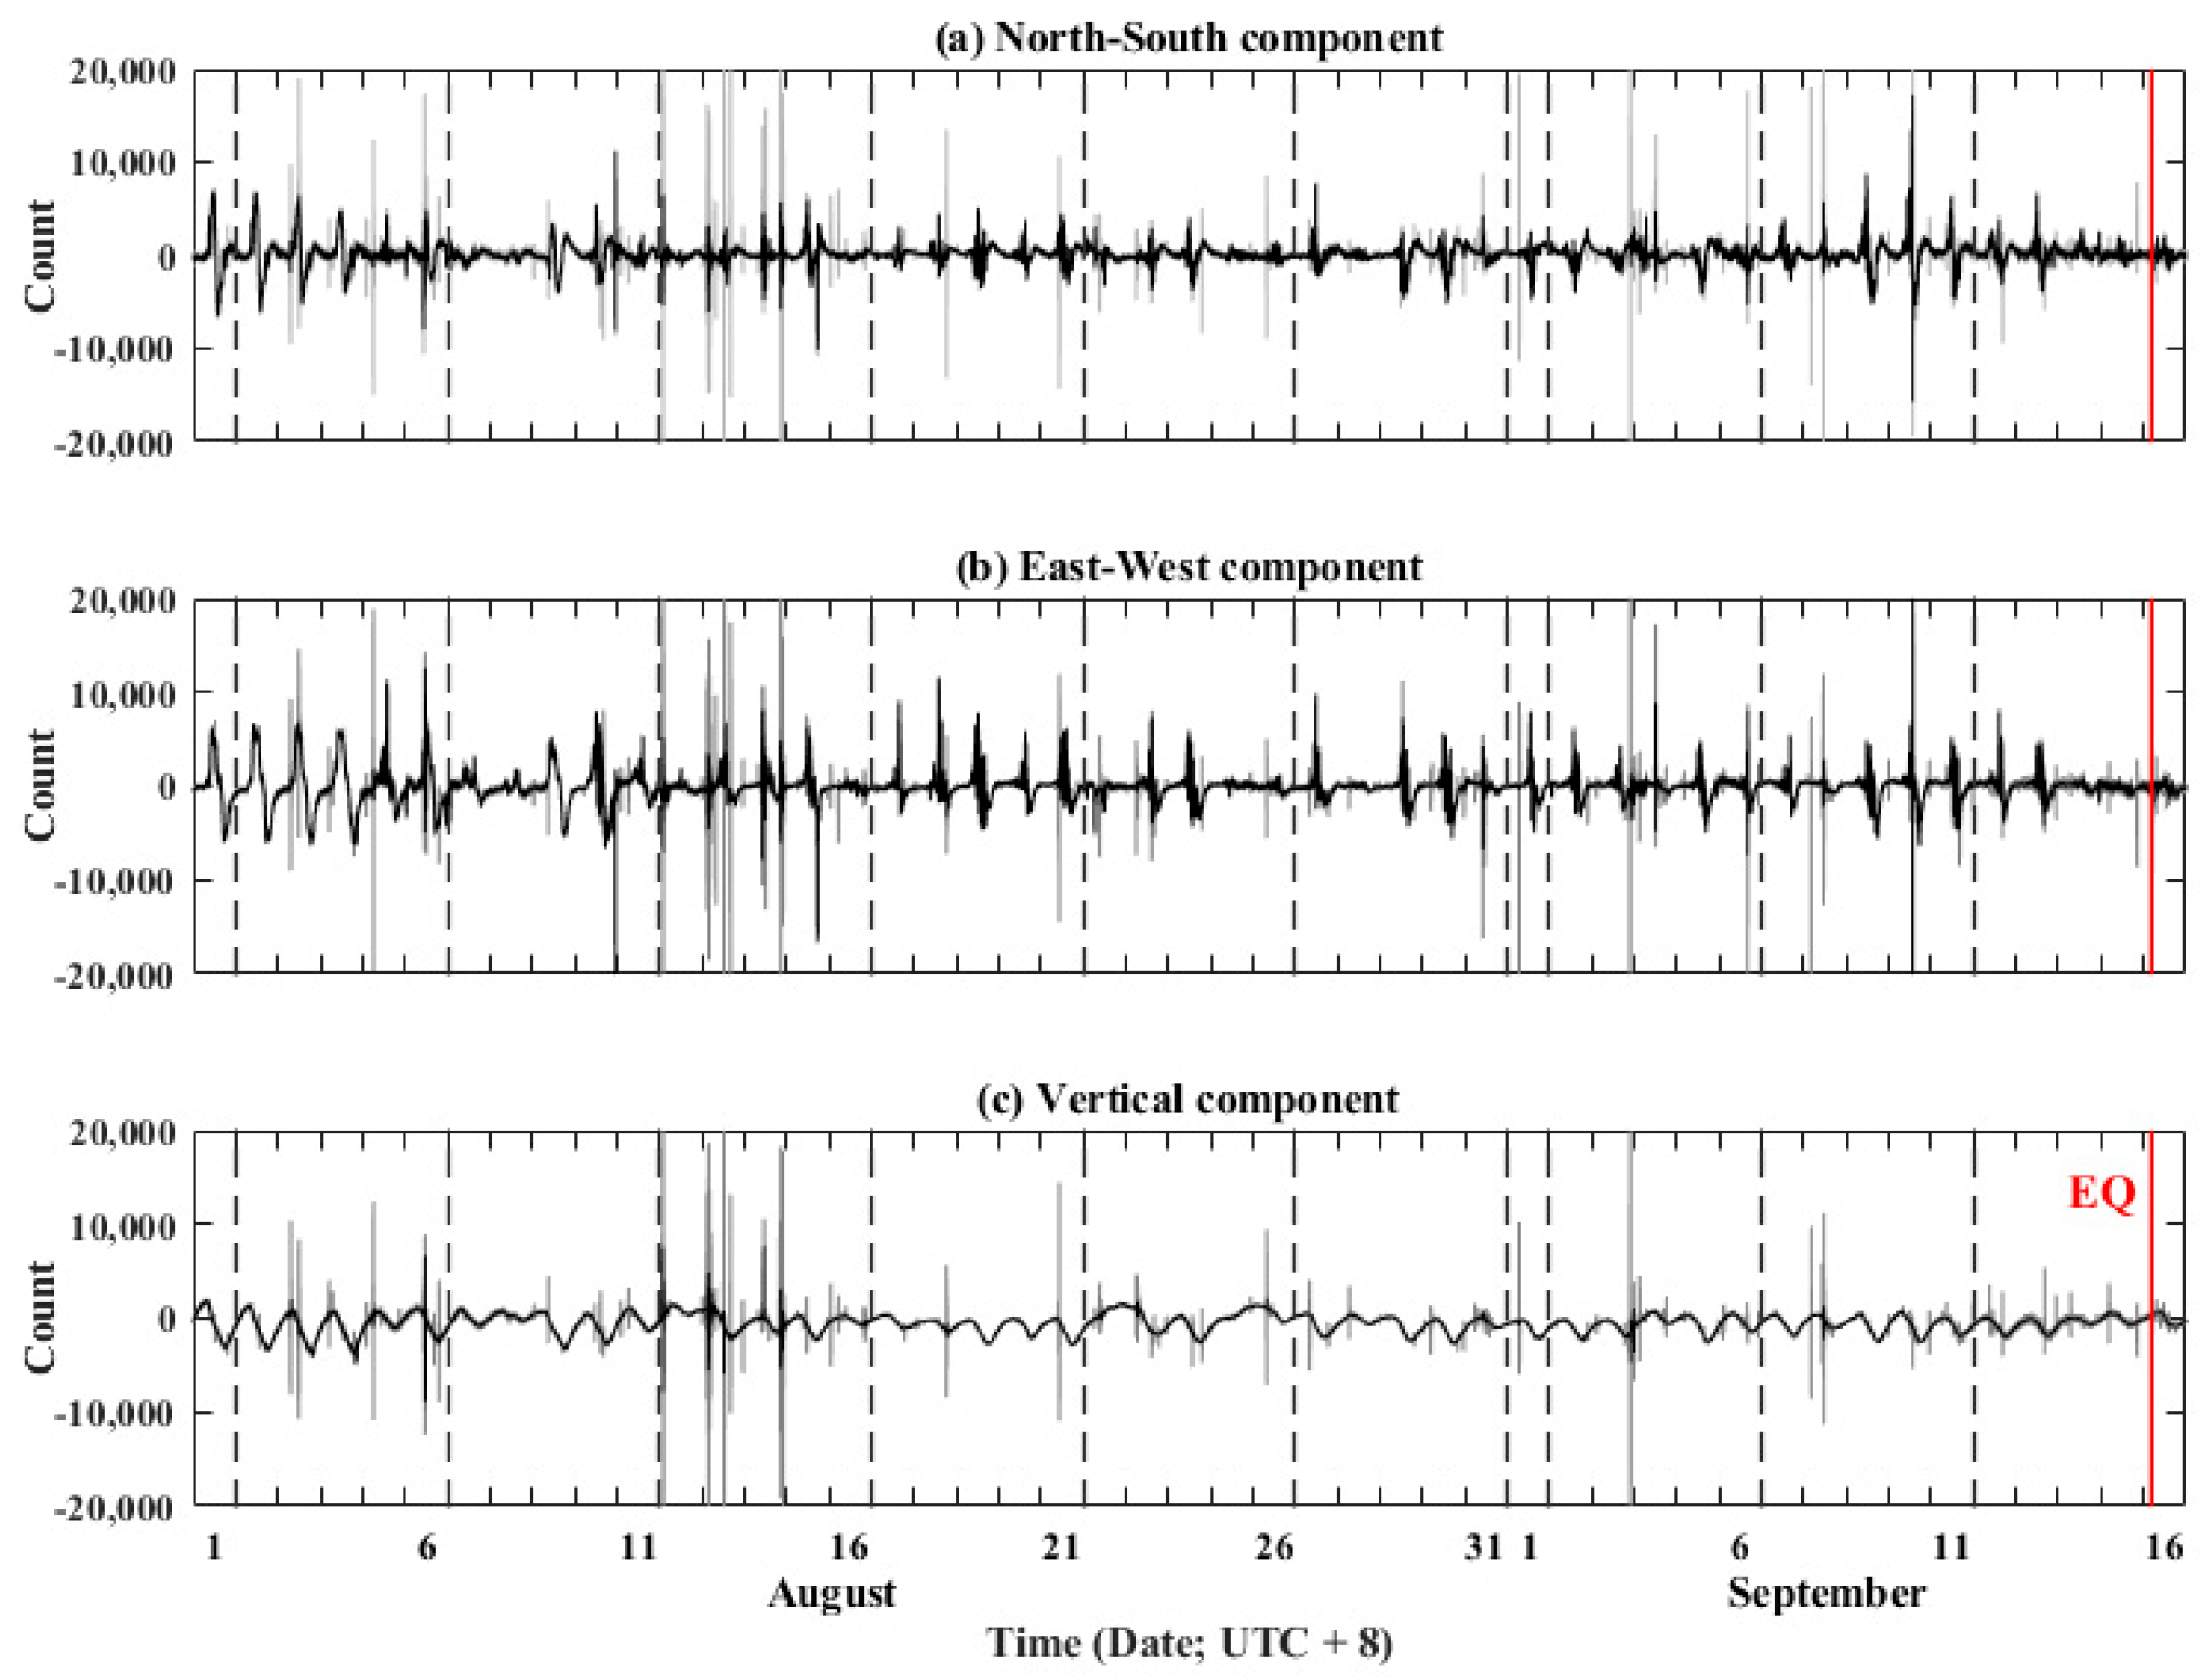
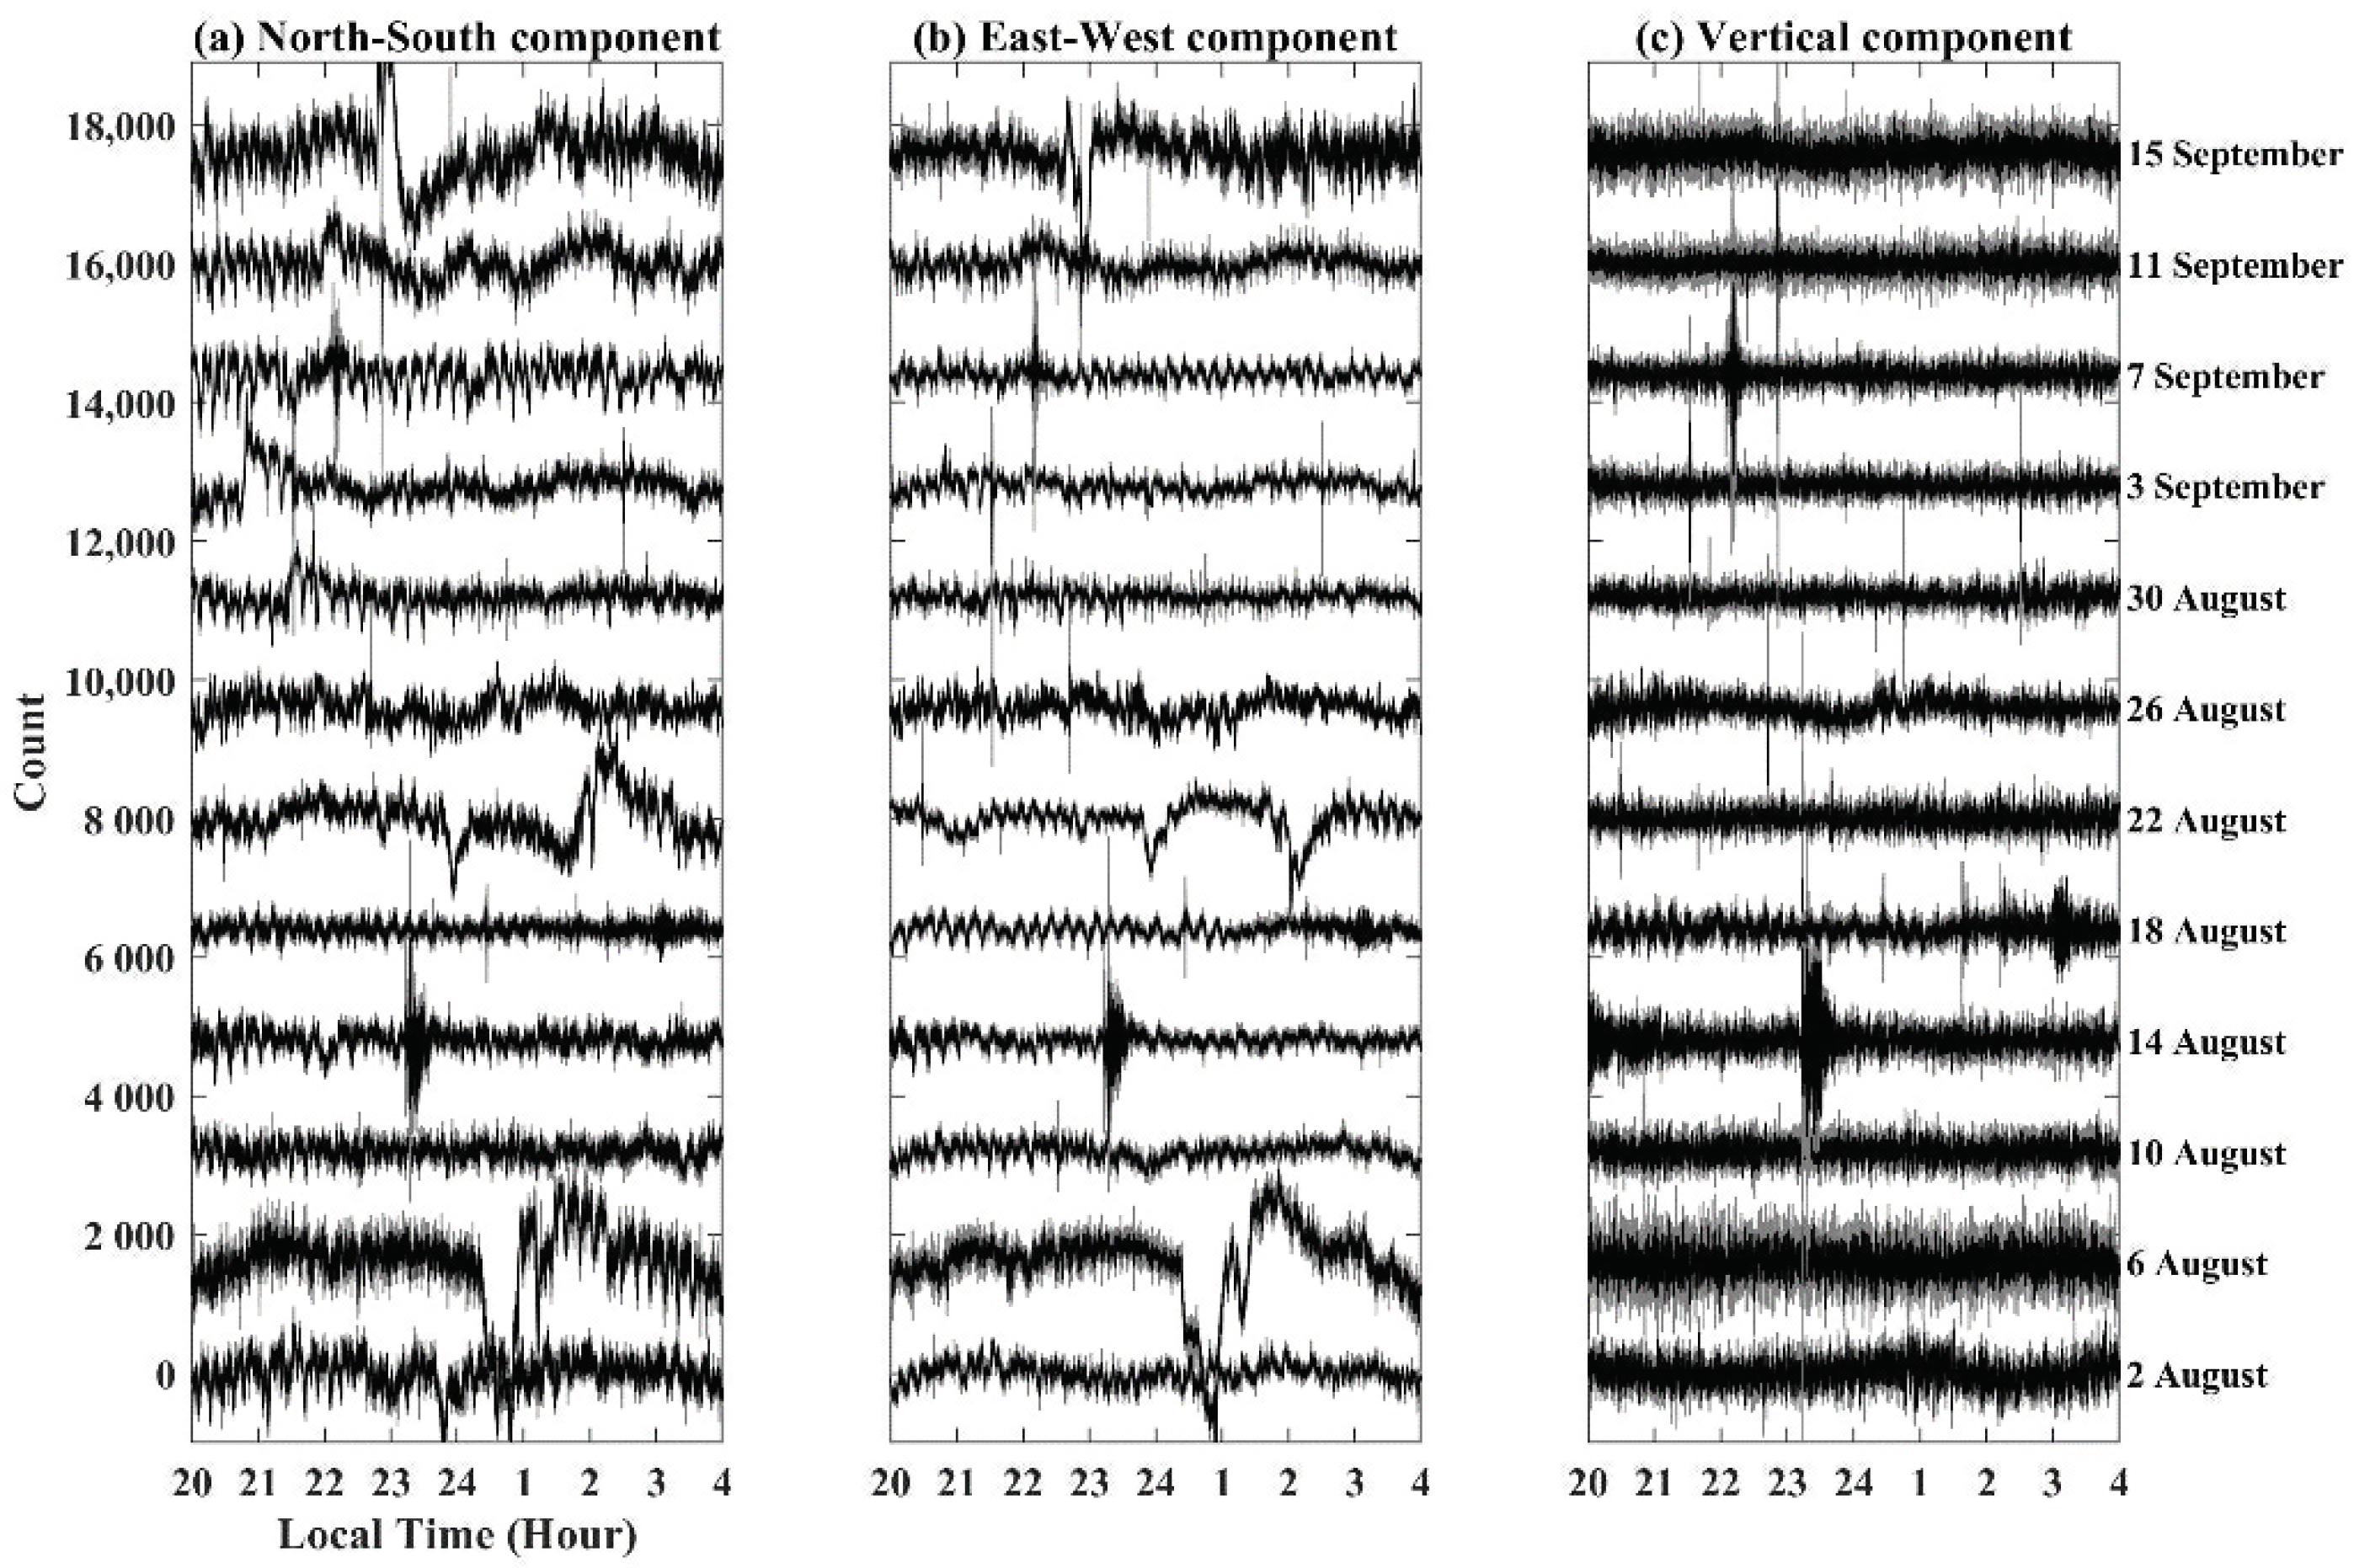
Figure 2 shows variations in ground vibrations at three components from the broadband seismometer at the MVP-LAI system from 1 August to 16 September 2021. Sudden and intensity fluctuations of ground vibrations often appear in the recorded data, as shown in Figure 2a–c. Those are referred to as the arrivals of tele-earthquakes. In addition, long-term fluctuations usually happen at noontime, due to unknown factors. To avoid the influence of human activities and/or unknown factors, Figure 3 shows the ground vibrations in the low-noise time at 20:00–04:00 LT during the study period. Typically, noise is a significant characteristic in the low-noise time, except for arrivals of tele-earthquakes before 14 August 2021 (Figure 3a–c). Periodic signals replace noise that can be found after 14 August 2021, particularly at the north-south component (Figure 3a) and the east-west component (Figure 3b). Amplitude and frequency of the periodic signals become large and tend to be high with the approaches of the Luxian earthquake, respectively (Figure 3a,b). In contrast, ground vibrations at the vertical component exhibit noise characteristics during the study period, except for the day on 18 August 2021 (Figure 3c). The periodic signals mainly observed at the two horizontal components would be caused by a certain distance from the epicenter. The transformation from noise to the periodic signals is a novel phenomenon that attracts our attention for further investigations. Other physical parameters monitored at the MVP-LAI system were collected to examine their relationships. The Fourier transform is utilized to study their frequency characteristics for determining causal mechanisms of the seismo-LAI coupling.
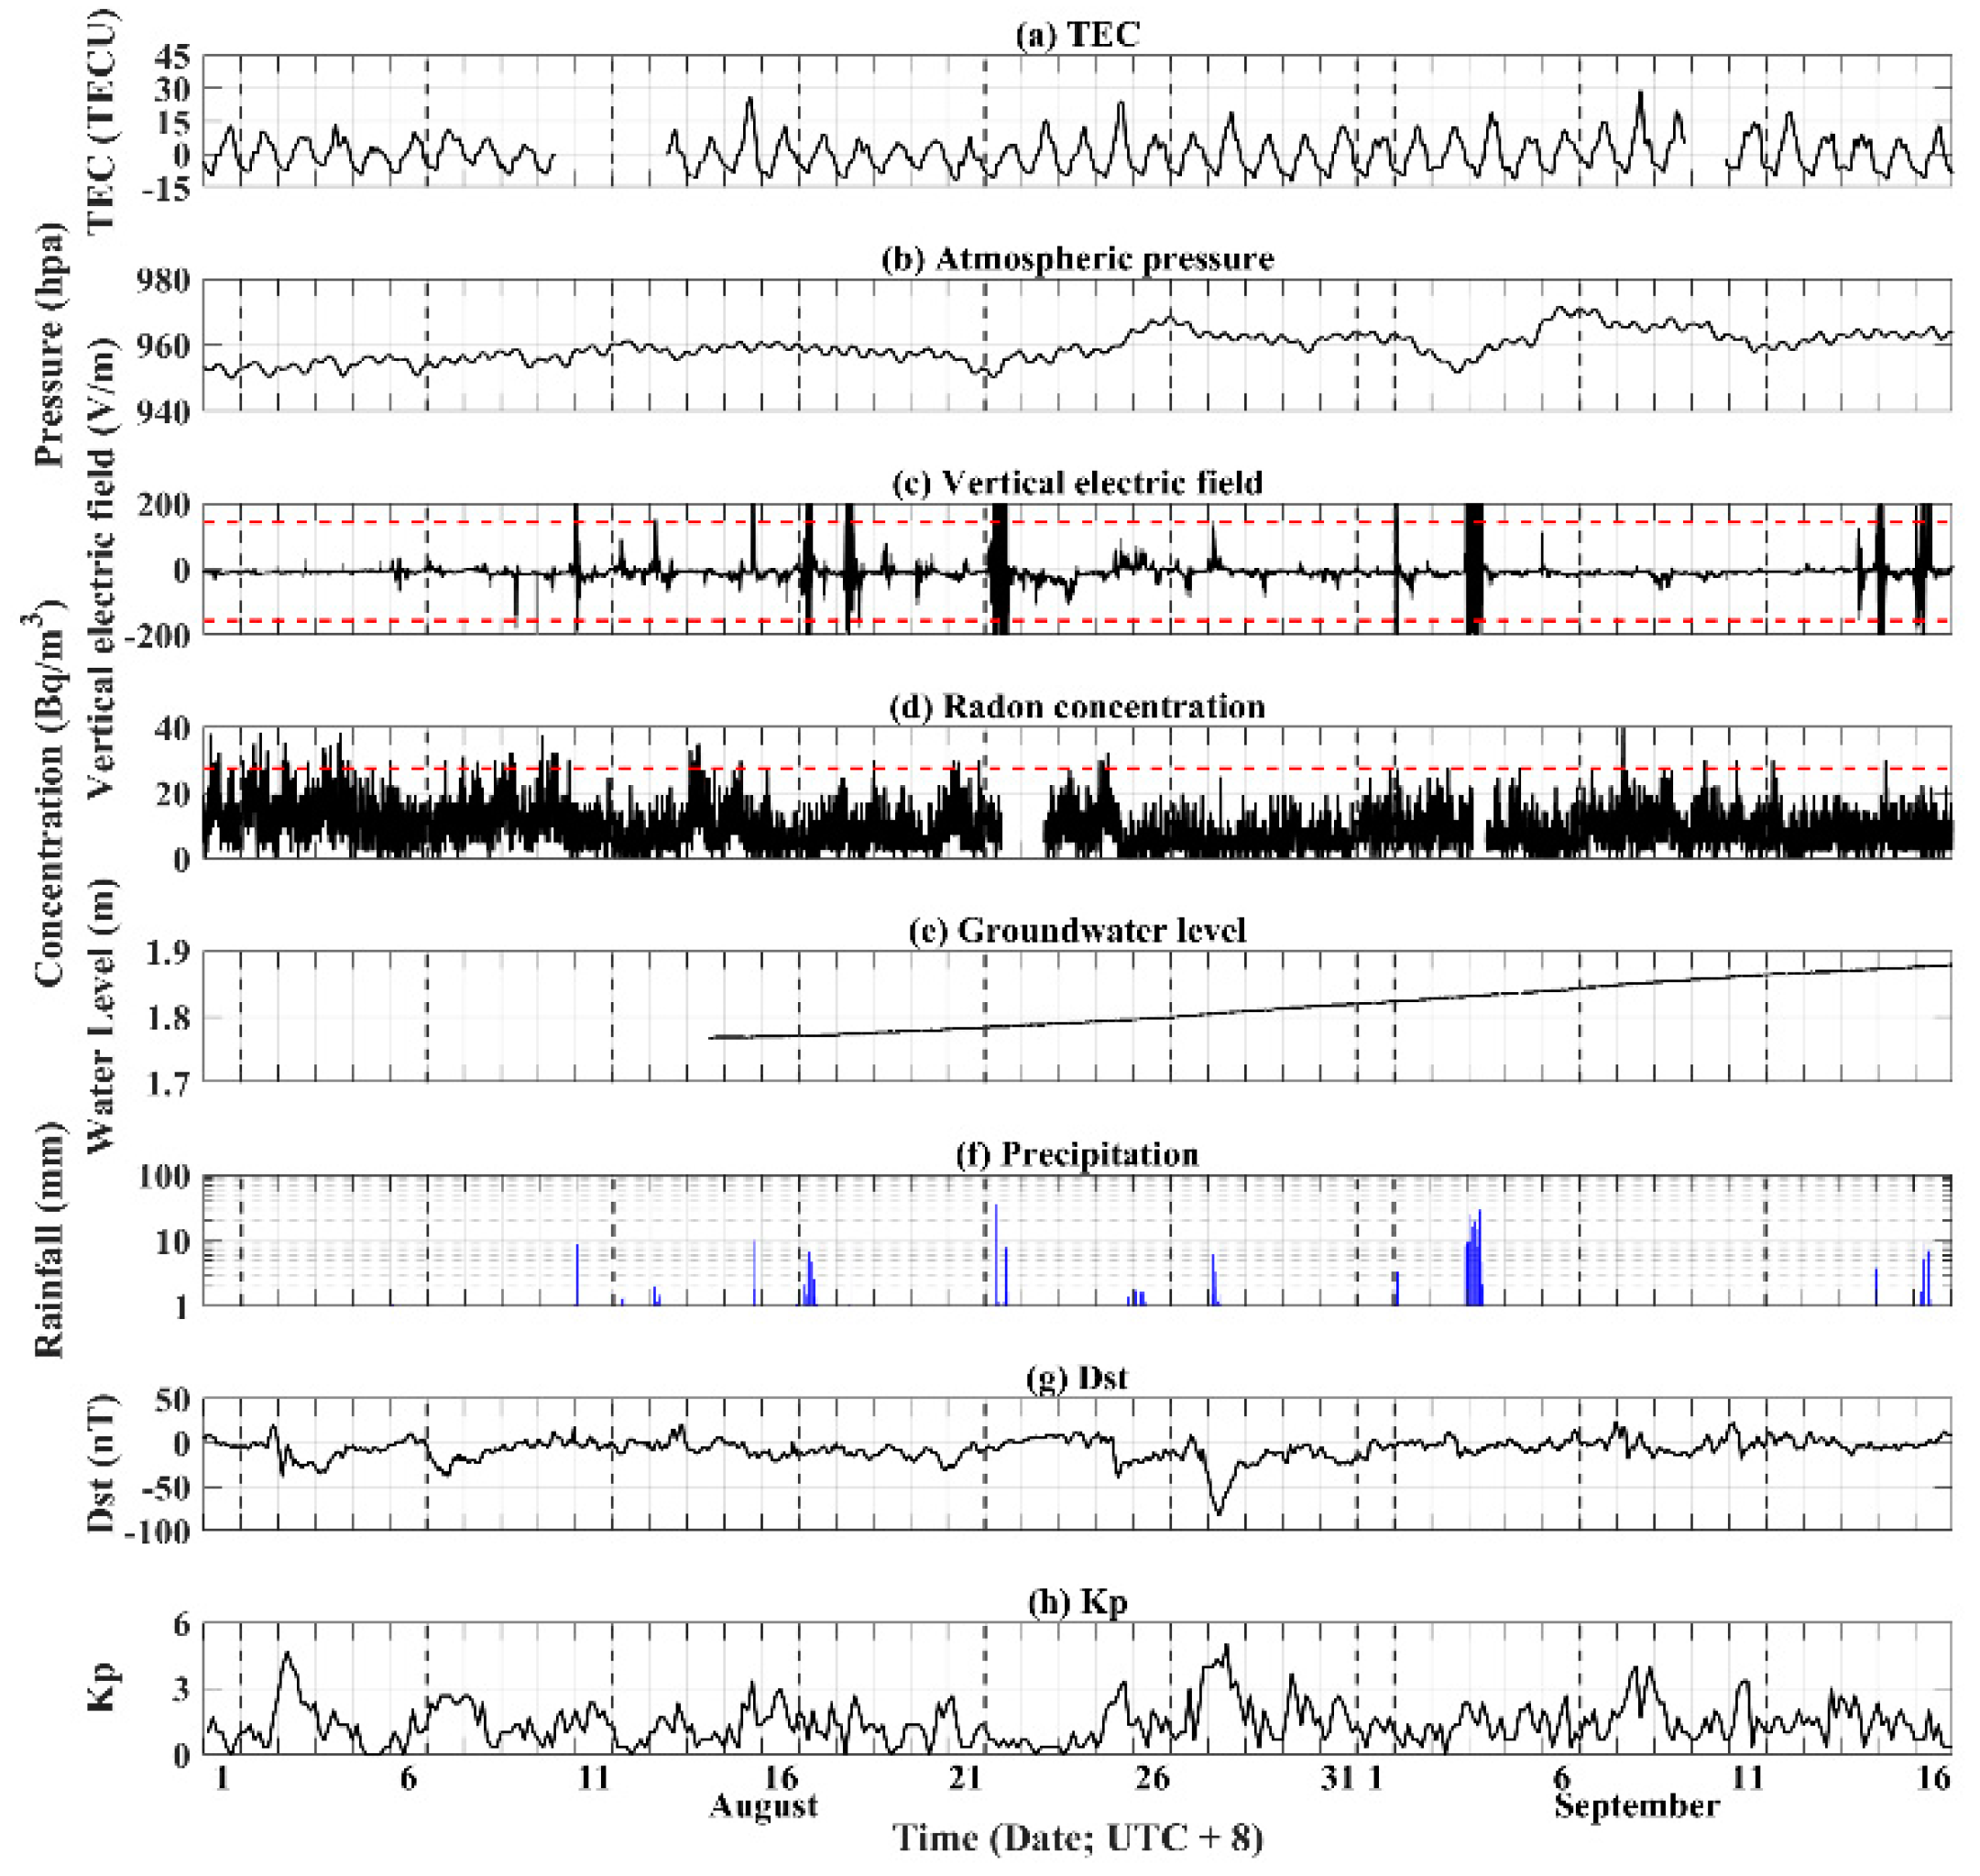
Figure 4 shows variations in TEC (Figure 4a), atmospheric pressure (Figure 4b), vertical electric field (Figure 4c), radon concentration (Figure 4d), groundwater level (Figure 4e) and precipitation (Figure 4f) at the MVP-LAI system during 1 August–16 September 2021. During the study period, pouring precipitation often happened in Leshan, due to the rainy season (Figure 4f). Groundwater levels increase accordingly. No significant anomalous phenomenon can be found straightly in groundwater levels, as shown in Figure 4e. Variations of radon concentration are roughly ranged between 20 and 40 Bq/m3 (Figure 4d). Intensity fluctuations of radon concentration, which are larger than the thresholds of 3σ (standard deviations), mainly happened in August 2021. However, intensity fluctuations were barely observed before the Luxian earthquake. Noticeable fluctuations, which are larger than 3σ (standard deviations), can also be found in the data of the vertical electrical field (Figure 4c). In fact, these obvious fluctuations are related to the clouds with precipitation (Figure 4c,f). The fluctuations are not contributed by the changes in the lithosphere underground but in the atmosphere over the MVP-LAI system. Changes in the atmospheric pressure exhibit diurnal variations due to fluctuations of temperature near the Earth’s surface dominated by solar radiation (Figure 4b). Figure 4a shows the variations in the TEC at 350 km in altitude in the ionosphere. Obvious diurnal variations can also be found in the TEC data due to solar radiation (Figure 4a). The maxima of the TEC generally appear in the afternoon that well agrees with the observation in the previous studies [22]. Variations of the Dst (Disturbance Storm Time) and Kp indices, which reflect solar activities during the study period, are shown in Figure 4g,h for the references. A magnetic storm occurred on 27 August 2021. The Dst and Kp indices show that minor geomagnetic activities occur during the focused period (Figure 4g,h). No obvious anomalous phenomena can be directly found from the atmospheric pressure and the TEC data. The atmospheric pressure and the TEC data in the nighttime (i.e., 00:00–02:00 LT) were chosen for mitigating influence from human activities. The chosen data were further transferred into the frequency domain by utilizing the Fourier transform to examine frequency characteristics associated with the ground vibrations.
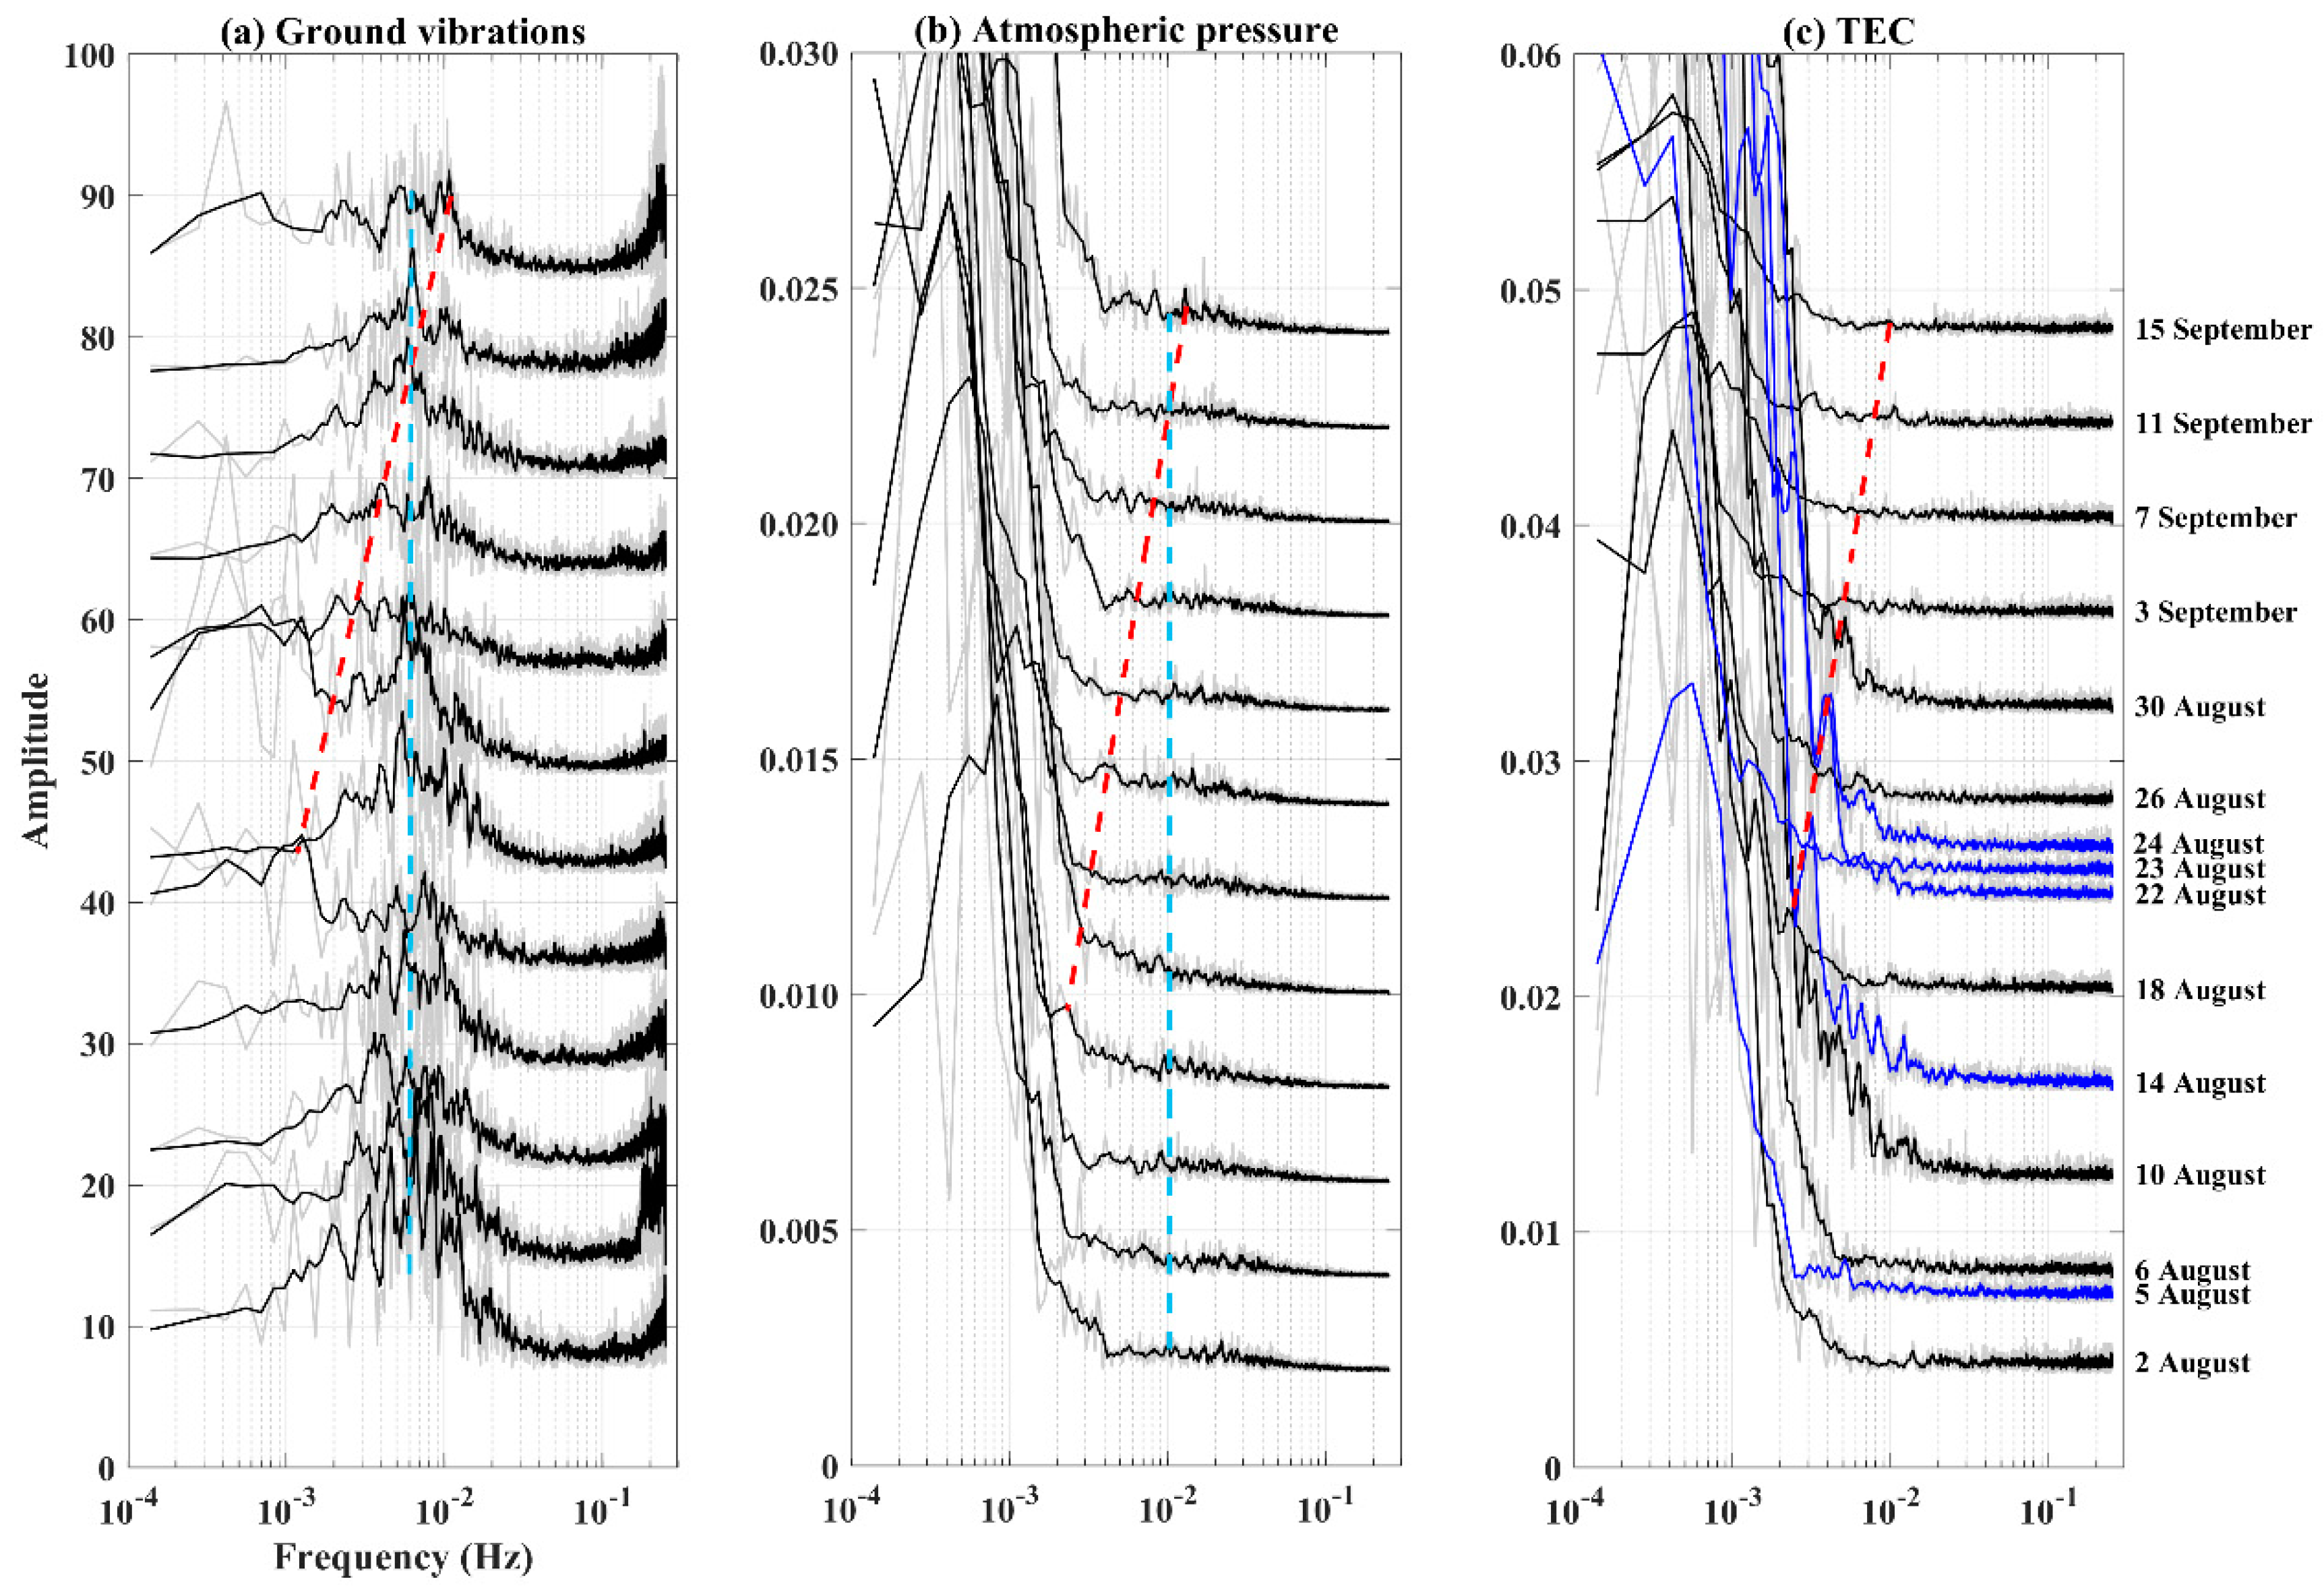
Figure 5 shows the amplitude as a function of frequency for the ground vibrations, atmospheric pressure and TEC from the MVP-LAI system from 2 August to 15 September 2021, with a temporal interval of 3 days. Noticeable enhancements fix at frequencies of ~7 × 10⁻³ Hz and ~2 × 10⁻¹ Hz that can be found from the ground vibrations (Figure 5a). The enhancements appeared during the entire study period and are considered to be contributed from environmental background around the MVP-LAI system. In contrast, an unusual phenomenon of variable frequencies from ~10−3 Hz on 18 August 2021 to ~10−2 Hz on 15 September 2021 can also be found in Figure 5a. The variable frequencies are similar with those dominated by earthquakes observed in the previous study [27], suggesting that the variable frequency would be related to the Luxian earthquake (Figure 5a). Amplitudes versus frequencies for the atmospheric pressure are shown in Figure 5b. Enhancements in amplitudes at frequencies exist at ~10−2 Hz during the study period. In contrast, frequency at ~10−3 Hz on 14 August 2021 tends to ~10−2 Hz on 15 September 2021 that can also be found in the atmospheric data in Figure 5b. Regarding the TEC data in the ionosphere, variable frequencies from ~10−3 Hz to ~10−2 Hz appear from 10 August to 15 September 2021 (Figure 5c). In short, ground vibrations, the atmospheric pressure and TEC share characteristics of variable frequencies mainly ~10−2 Hz from ~10−3 Hz on 14 August 2021 to ~10−2 Hz on 15 September 2021 before the Luxian earthquake. Disturbances for the solar activities occurred on 27 August 2021, which is obviously shorter than the 1.5-month study period. Under minor geomagnetic activities (from the Dst and Kp indices shown in Figure 4g,h during the study period) at the solar minimum, Cai et al. [39] reported TEC variations happen mainly in the areas of > ~40° N in the US sector (~50° N geomantic latitude). The perturbations at the MVP-LAI system and the Luxian earthquake in this study are located at the latitude of ~29° N in the Asia sector (~19° N geomantic latitude) that is away from the auroral latitude. Note that the amplitudes of TEC on the 5 quietest days determined from the Kp index during the study period are also shown in Figure 5c for further examining whether the analytical results are dominated by solar activities. No significant anomaly can be found in the amplitudes of TEC on 5 and 22 August 2021 (Figure 5c). The TEC Amplitudes with the enhancements at frequencies of ~2 × 10⁻³ Hz can be consistently found on 14, 23 and 24 August 2021. The seismo-characteristics of the variable frequencies (denoted by the red dashed line in Figure 5c) can also be found in the amplitudes of TEC on the 5 quietest days, except for on 22 August 2021. This suggests that the seismo-characteristics of the variable frequencies before the earthquake are solid, regardless of the influence of solar activities on TEC. Therefore, the ground vibrations, atmospheric pressure near surface and TEC share the variable frequencies that are not dominated by the solar activities from the space but the ground variations in the lithosphere associated with the Luxian earthquake. Ground vibrations would be the major factor dominating changes in the atmospheric pressure and TEC.

3. Discussions

Based on variations of the time-series data and the statistical analysis, no significant anomaly can be found in the radon concentration during the study period in Figure 4d. Although intensity fluctuations can be found in vertical electrical field in Figure 4c, contributions of the heavy precipitation cannot be ruled out. Therefore, the chemical channel is not the primary factor dominating the seismo-LAI coupling during the Luxian earthquake. In contrast, groundwater levels permanently increased due to the precipitation during the study period. Even if the TEC anomaly appeared during the Luxian earthquake that would be caused by the increase of the electrical conductivity underground via the conductivity channel, the influence from the precipitations cannot be entirely removed. Therefore, the seismo-LAI coupling via the conductivity channel cannot be proved during the Luxian earthquake. In terms of the seismo-LAI coupling via the acoustic-gravity channel, the ground vibrations could be the potential source in the lithosphere. Chen et al. [2] observed large-scale common-mode ground vibrations before major earthquakes from data recorded by seismometers and ground-based GNSS receivers. Chen et al. [27] estimated seismogeneric areas utilizing spatiotemporal distributions of seismicity from relatively small events associated with major earthquakes. A radius of seismogeneric areas for an earthquake with a magnitude of ~5 would be larger than ~200 km. Seismogeneric areas are larger than fault rupture zones that can also be supported by the observation from the seismo-crustal deformation [2,4]. Meanwhile, frequencies at ~10−3 Hz would be the natural frequency calculated from a promising model of material broken for a mage-size (hundreds by hundreds km) thin plate [27,28]. Ground vibrations in such a particular frequency band are close to the frequency characteristics of acoustic-gravity waves [40,41] that could trigger variations in atmospheric pressure and drive changes of TEC in the ionosphere. Atmospheric pressure from the barometer in Figure 4b and Figure 5b are taken into consideration because the variations in it are the most important evidence to prove the upward propagation of the acoustic-gravity waves from the lithosphere up to the ionosphere. Atmospheric pressure changes accordingly while the frequency of the ground vibrations is ~10−3 Hz, suggesting that the acoustic-gravity waves excited by ground vibrations at ~10−3 Hz would be the promising candidate driving changes of TEC in the ionosphere. The acoustic-gravity channel is the promising candidate for the seismo-LAI coupling during the Luxian earthquake. It is worth mentioning that the enhancements of the amplitude at frequency of ~10−3 Hz become small at a frequency of >5 × 10⁻³ Hz in TEC on 3 September 2021 (Figure 5c). The obvious transformation of the amplitude would suggest the other causal mechanism that dominates the seismo-LAI coupling in the relatively high frequency (~10−2 Hz).
The variable frequency from low to high near the Earth’s surface can be referred to as developments and/or increases of microcracks [27] and a substitute of the high-mode nature frequency with the approaching of forthcoming earthquakes. A few days before the Luxian earthquake, the amplifications of the ground vibrations exhibited the relatively high frequency characteristics of ~10−2 Hz. Amplitudes of the atmospheric pressure and the TEC enhanced at the frequency of ~10−2 Hz, accordingly. The frequency is slightly higher than it associated with the acoustic-gravity waves. This results in difficulty for the upward propagation of the acoustic-gravity waves through the atmosphere driving changes in the TEC accordingly. The other mechanism would dominate the seismo-LAI coupling at the relatively high frequency. Dautermann et al. [42] reported that volcano eruption emits gas and causes intensity ground motion that can result in resonance in the atmosphere and ionosphere. The observation and numerical simulation suggest that the frequency band of the resonance is mainly larger than >5 × 10⁻³ Hz [42]. Alternatively, instead of the intensity of ground vibrations during volcano eruptions, large-scale ground motion with the particular frequency (>5 × 10⁻³ Hz) is the other promising factor causing the resonance. TEC can be changed by the existence of large-scale vertical motion in the lithosphere, such as tsunami and Rayleigh waves [43,44,45,46]. Ground vibrations before earthquakes happen in a wide area (hundreds of kilometers × hundreds of kilometers) [1,2,3,4] that would lead to waves and/or vibrations upward propagating into the ionosphere driving changes in TEC [21,22,23,24,25,26,30], particularly in place around epicenters of forthcoming earthquakes. Once a resonance resides around the epicenter, ground vibrations at a relatively high frequency band could be carried by the resonance changing the atmospheric pressure and TEC at the high-frequency band, accordingly. This would have been a promising mechanism with which the relatively high frequency anomalies could have been observed from ground vibrations in the lithosphere, atmospheric pressure in the atmosphere and TEC in the ionosphere during the Luxian earthquake. Note that the upward and downward resonance motion can also modulate the level of the Schumann resonances prior to earthquakes [47]. In short, high-mode natural frequency ground vibrations would be the causal mechanism dominating ground vibrations at a relatively high frequency. The ground vibrations in a large-scale area at a relatively high frequency drive the changes of the TEC via the atmospheric resonance. If the high-mode natural frequency ground vibrations and the atmospheric resonance are accurate, then methods that can retrieve high-mode and/or resonant signals from multiple geophysical parameters are essential. Correlations of the resonant signals in the seismo-LAI coupling can be examined by multiple geophysical parameters in LAI, utilizing the associated methods, in the near future.

4. Conclusions

Multiple geophysical parameters from the novel instrumental system for the monitoring vibrations and perturbation in the lithosphere, atmosphere and ionosphere provide an excellent opportunity to examine the seismo-LAI coupling associated with the M6 Luxian earthquake, due to the fact that a distance from the epicenter is less than the radius of the earthquake preparation zone. No significant anomalous phenomena can be observed in the vertical electrical field, radon concentration and groundwater level. In contrast, ground vibrations, atmospheric pressure and TEC share the frequency varying from ~10−3 Hz to ~10−2 Hz before the earthquake. The acoustic-gravity channel is a promising candidate dominating the seismo-LAI coupling associated with the Luxian earthquake at a frequency band of ~10−3 Hz. Meanwhile, ground vibrations in a wide area can result in atmospheric resonance residing around the epicenter that can trigger changes at the relatively-high frequency of ~10−2 Hz in the atmosphere and the ionosphere. The retrieval of the resonance values from the multiple geophysical parameters would shed light on practices of earthquake forecasts.

Author Contributions

C.-H.C., writing, methodology, formal analysis and revision; Y.-Y.S., writing, methodology, discussion and revision; K.L., data collection and discussion; J.L., discussion; Y.W. contributed to discussion; Y.G., data collection and discussion; D.Z., data collection and discussion; R.X., data collection and discussion; C.C., data collection and discussion. All authors have read and agreed to the published version of the manuscript.

Funding

This research was funded by the Joint Funds of the National Natural Science Foundation of China (Grant No. U2039205), National Natural Science Foundation of China (Grant No. 42174211, 91858205, 41774048, 11805166, 42074023 and 42174084), and the Sichuan earthquake Agency-Research Team of GNSS based on geodetic tectonophysics and mantle-crust dynamics in the Chuan-Dian region (Grant No. 201803).

Institutional Review Board Statement

Not applicable.

Informed Consent Statement

Not applicable.

Data Availability Statement

The data presented in this study are available on request from the corresponding author.

Acknowledgments

We thank everyone who supported the establishment of the MVP-LAI system and appreciate the interest in the data retrieved from the MVP-LAI system.

Conflicts of Interest

The authors declare that they have no known competing interests that could have appeared to influence the work reported in this paper.

References

  1. Chen, C.-H.; Yeh, T.-K.; Liu, J.-Y.; Wang, C.-H.; Wen, S.; Yen, H.-Y.; Chang, S.-H. Surface Deformation and Seismic Rebound: Implications and Applications. Surv. Geophys. 2011, 32, 291–313. [Google Scholar] [CrossRef]
  2. Chen, C.-H.; Lin, L.-C.; Yeh, T.-K.; Wen, S.; Yu, H.; Yu, C.; Gao, Y.; Han, P.; Sun, Y.-Y.; Liu, J.-Y.; et al. Determination of Epicenters before Earthquakes Utilizing Far Seismic and GNSS Data: Insights from Ground Vibrations. Remote Sens. 2020, 12, 3252. [Google Scholar] [CrossRef]
  3. Chen, C.-H.; Yeh, T.-K.; Wen, S.; Meng, G.; Han, P.; Tang, C.-C.; Liu, J.-Y.; Wang, C.-H. Unique Pre-Earthquake Deformation Patterns in the Spatial Domains from GPS in Taiwan. Remote Sens. 2020, 12, 366. [Google Scholar] [CrossRef] [Green Version]
  4. Bedford, J.R.; Moreno, M.; Deng, Z.; Oncken, O.; Schurr, B.; John, T.; Báez, J.C.; Bevis, M. Months-long thou-sand-kilometre-scale wobbling before great subduction earthquakes. Nature 2020, 580, 628–635. [Google Scholar] [CrossRef]
  5. Dobrovolsky, I.P.; Zubkov, S.I.; Miachkin, V.I. Estimation of the size of earthquake preparation zones. Pure Appl. Geophys. 1979, 117, 1025–1044. [Google Scholar] [CrossRef]
  6. Chen, C.-H.; Sun, Y.-Y.; Lin, K.; Zhou, C.; Xu, R.; Qing, H.; Gao, Y.; Chen, T.; Wang, F.; Yu, H.; et al. A New Instrumental Array in Sichuan, China, to Monitor Vibrations and Perturbations of the Lithosphere, Atmosphere, and Ionosphere. Surv. Geophys. 2021, 1–18. [Google Scholar] [CrossRef]
  7. Hayakawa, M. Earthquake Prediction with Radio Techniques; John Wiley & Sons, Singapore Pte Ltd.: Singapore, 2015; p. 294. [Google Scholar]
  8. Hayakawa, M. Earthquake prediction with electromagnetic phenomena. In AIP Conference Proceedings; AIP Publishing: Melville, NY, USA, 2016; Volume 1705, p. 20002. [Google Scholar]
  9. Pulinets, S.A.; Boyarchuk, K. Ionospheric Precursors of Earthquakes; Springer: Berlin, Germany, 2004. [Google Scholar]
  10. Sorokin, V.; Yaschenko, A.; Chmyrev, V.; Hayakawa, M. DC electric field amplification in the mid-latitude ionosphere over seismically active faults. Phys. Chem. Earth Parts A/B/C 2006, 31, 447–453. [Google Scholar] [CrossRef] [Green Version]
  11. Pulinets, S.A.; Ouzounov, D. Lithosphere– atmosphere–ionosphere coupling (LAIC) model—a unified concept for earthquake precursors validation. J. Asian Earth Sci. 2011, 41, 371–382. [Google Scholar] [CrossRef]
  12. Pulinets, S. The synergy of earthquake precursors. Earthq. Sci. 2011, 24, 535–548. [Google Scholar] [CrossRef] [Green Version]
  13. Fu, C.-C.; Wang, P.-K.; Lee, L.-C.; Lin, C.-H.; Chang, W.-Y.; Giuliani, G.; Ouzounov, D. Temporal variation of gamma rays as a possible precursor of earthquake in the Longitudinal Valley of eastern Taiwan. J. Asian Earth Sci. 2015, 114, 362–372. [Google Scholar] [CrossRef]
  14. Ouzounov, D.; Pulinets, S.; Kafatos, M.C.; Taylor, P. Thermal Radiation Anomalies Associated with Major Earthquakes. In Pre-Earthquake Processes: A Multidisciplinary Approach to Earthquake Prediction Studies, Geophysical Monograph 234, 2018 American Geophysical Union; Wiley: Hoboken, NJ, USA, 2018; pp. 259–274. [Google Scholar]
  15. Chen, C.H.; Tang, C.C.; Cheng, K.C.; Wang, C.H.; Wen, S.; Lin, C.H.; Wen, Y.Y.; Meng, G.; Yeh, T.K.; Jan, J.C.; et al. Groundwater-strain coupling before the 1999 Mw 7.6 Taiwan Chi-Chi earthquake. J. Hydrol. 2015, 524, 378–384. [Google Scholar] [CrossRef]
  16. Chen, C.H.; Hsu, H.L.; Wen, S.; Yeh, T.-K.; Chang, F.Y.; Wang, C.H.; Liu, J.Y.; Sun, Y.Y.; Hattori, K.; Yen, H.Y.; et al. Evaluation of seismo-electric anomalies using magnetic data in Taiwan. Nat. Hazards Earth Syst. Sci. 2013, 13, 597–604. [Google Scholar] [CrossRef] [Green Version]
  17. Mao, Z.; Chen, C.-H.; Zhang, S.; Yisimayili, A.; Yu, H.; Yu, C.; Liu, J.-Y. Locating Seismo-Conductivity Anomaly before the 2017 MW 6.5 Jiuzhaigou Earthquake in China Using Far Magnetic Stations. Remote Sens. 2020, 12, 1777. [Google Scholar] [CrossRef]
  18. Rodger, C.J. Red sprites, upward lighting and VLF perturbations. Rev. Geophys. 1999, 37, 317–336. [Google Scholar] [CrossRef]
  19. Takahashi, Y.; Miyasato, R.; Adachi, T.; Adachi, K.; Sera, M.; Uchida, A.; Fukunishi, H. Activities of sprites and elves in the winter season, Japan. J. Atmos. Solar-Terr. Phys. 2003, 65, 551–560. [Google Scholar] [CrossRef]
  20. Hayakawa, M.; Nakamura, T.; Hobara, Y.; Williams, E. Observation of sprites over the Sea of Japan and conditions for light-ning-induced sprites in winter. J Geophys. Res. Space Phys. 2004, 109, A01312. [Google Scholar] [CrossRef]
  21. VanZandt, T.E. A model for gravity wave spectra observed by Doppler sounding systems. Radio Sci. 1985, 20, 1323–1330. [Google Scholar] [CrossRef] [Green Version]
  22. Davies, K. Ionospheric Radio; Peter Peregrinus: London, UK, 1990; p. 580. [Google Scholar]
  23. Miyaki, K.; Hayakawa, M.; Molchanov, O.A. The role of gravity waves in the lithosphere-ionosphere coupling, as revealed from the subionospheric LF propagation data. In Seismo-Electromagnetics: Lithosphere–Atmosphere–Ionosphere Coupling; Hayakawa, M., Molchanov, O.A., Eds.; Terra Scientific: Tokyo, Japan, 2002. [Google Scholar]
  24. Shvets, A.; Hayakawa, M.; Molchanov, O.; Ando, Y. A study of ionospheric response to regional seismic activity by VLF radio sounding. Phys. Chem. Earth Parts A/B/C 2004, 29, 627–637. [Google Scholar] [CrossRef]
  25. Korepanov, V.; Hayakawa, M.; Yampolski, Y.; Lizunov, G. AGW as a seismo-ionospheric coupling responsible agent. Phys. Chem. Earth Parts A/B/C 2009, 34, 485–495. [Google Scholar] [CrossRef]
  26. Kasahara, Y.; Nakamura, T.; Hobara, Y.; Hayakawa, M.; Rozhnoi, A.; Solovieva, M.; Molchanov, O.A. A statistical study on the AGW modulation in subionospheric VLF/LF propagation data and consideration of the generation mechanism of seis-mo-ionospheric perturbations. J. Atmos. Electr. 2010, 30, 103–112. [Google Scholar] [CrossRef] [Green Version]
  27. Chen, C.-H.; Sun, Y.-Y.; Wen, S.; Han, P.; Lin, L.-C.; Yu, H.; Zhang, X.; Gao, Y.; Tang, C.-C.; Lin, C.-H.; et al. Spatiotemporal changes of seismicity rate during earthquakes. Nat. Hazards Earth Syst. Sci. 2020, 20, 3333–3341. [Google Scholar] [CrossRef]
  28. Leissa, A.W. Vibrations of Plates; Ohio State University: Columbus, OH, USA, 1969. [Google Scholar]
  29. Chen, C.-H.; Sun, Y.-Y.; Lin, L.-C.; Han, P.; Yu, H.-Z.; Zhang, X.; Tang, C.-C.; Chen, C.-R.; Yen, H.-Y.; Lin, C.-H.; et al. Large air pressure changes triggered by P-SV ground motion in a cave in northern Taiwan. Sci. Rep. 2021, 11, 12850. [Google Scholar] [CrossRef] [PubMed]
  30. Liu, J.Y.; Chen, C.H.; Sun, Y.Y.; Tsai, H.F.; Yen, H.Y.; Chum, J.; Lastovicka, J.; Yang, Q.S.; Chen, W.S.; Wen, S. The vertical propagation of disturbances triggered by seismic waves of the 11 March 2011 M 9.0 Tohoku earthquake over Taiwan. Geophys. Res. Lett. 2016, 43, 1759–1765. [Google Scholar] [CrossRef] [Green Version]
  31. Fraser-Smith, A.C.; Bernardi, A.; McGill, P.R.; Ladd, M.E.; Helliwell, R.A.; Villard, O.G. Low-frequency magnetic field meas-urements near the epicenter of the MS7.1 Loma Prieta earthquake. Geophys. Res. Lett. 1990, 17, 1465–1468. [Google Scholar] [CrossRef]
  32. Molchanov, O.A.; Mazhaeva, O.A.; Goliavin, A.N.; Hayakawa, M. Observations by the intercosmos-24 satellite of ELF-VLF electromagnetic emissions associated with earthquakes. Ann. Geophys. 1993, 11, 431–440. [Google Scholar]
  33. Molchanov, O.A.; Hayakawa, M.; Rafalsky, V.A. Penetration characteristics of electromagnetic emissions from an under-ground seismic source into the atmosphere, ionosphere and magnetosphere. J. Geophys. Res. 1995, 100, 1691–1712. [Google Scholar] [CrossRef]
  34. Hayakawa, M.; Kawate, R.; Molchanov, O.A.; Yumoto, K. Results of ultra-low-frequency magnetic field measurements dur-ing the Guam earthquake of 8 August 1993. Geophys. Res. Lett. 1996, 23, 241–244. [Google Scholar] [CrossRef]
  35. Gotoh, K.; Akinaga, Y.; Hayakawa, M.; Hattori, K. Principal component analysis of ULF geomagnetic data for Izu islands earthquakes in July 2000. J. Atmos. Electr. 2002, 22, 1–12. [Google Scholar] [CrossRef]
  36. Hattori, K.; Takahashi, I.; Yoshino, C.; Isezaki, N.; Iwasaki, H.; Harada, M.; Kawabata, K.; Кopytenko, E.; Maltsev, P.; Korepanov, V.; et al. ULF geomagnetic field measurements in Japan and some recent results associated with Iwateken Nairiku Hokubu earthquake in 1998. Phys. Chem. Earth Parts A/B/C 2004, 29, 481–494. [Google Scholar] [CrossRef]
  37. Su, X.; Meng, G.; Sun, H.; Wu, W. Positioning Performance of BDS Observation of the Crustal Movement Observation Network of China and Its Potential Application on Crustal Deformation. Sensors 2018, 18, 3353. [Google Scholar] [CrossRef] [PubMed] [Green Version]
  38. Liu, J.Y.; Tsai, H.F.; Jung, T.K. Total Electron Content Obtained by Using the Global Positioning System. Terr. Atmospheric Ocean. Sci. 1996, 7, 107. [Google Scholar] [CrossRef]
  39. Cai, X.; Burns, A.G.; Wang, W.; Qian, L.; Pedatella, N.; Coster, A.; Zhang, S.; Solomon, S.C.; Eastes, R.W.; Daniell, R.E.; et al. Variations in Thermosphere Composition and Ionosphere Total Electron Content Under “Geomagnetically Quiet” Conditions at Solar-Minimum. Geophys. Res. Lett. 2021, 48, 2021–093300. [Google Scholar] [CrossRef]
  40. Hines, C.O. Internal atmospheric gravity waves at ionospheric heights. Can. J. Phys. 1960, 38, 1441–1481. [Google Scholar] [CrossRef]
  41. Chou, M.Y.; Lin, C.C.H.; Yue, J.; Tsai, H.F.; Sun, Y.Y.; Liu, J.Y.; Chen, C.H. Concentric traveling ionosphere disturbances triggered by Super Typhoon Meranti (2016). Geophys. Res. Lett. 2017, 44, 1219–1226. [Google Scholar] [CrossRef]
  42. Dautermann, T.; Calais, E.; Lognonné, P.; Mattioli, G.S. Lithosphere—Amosphere—Ionosphere coupling after the 2003 explosive eruption of the Soufriere Hills Volcano, Montserrat. Geophys. J. Int. 2009, 179, 1537–1546. [Google Scholar] [CrossRef] [Green Version]
  43. Liu, J.Y.; Tsai, Y.B.; Chen, S.W.; Lee, C.P.; Chen, Y.C.; Yen, H.Y.; Chang, W.Y.; Liu, C. Giant ionospheric disturbances excited by the M9.3 Sumatra earthquake of 26 December 2004. Geophys. Res. Lett. 2006, 33, 02103. [Google Scholar] [CrossRef] [Green Version]
  44. Liu, J.-Y.; Chen, C.-H.; Lin, C.C.H.; Tsai, H.-F.; Chen, C.-H.; Kamogawa, M. Ionospheric disturbances triggered by the 11 March 2011M9.0 Tohoku earthquake. J. Geophys. Res. Space Phys. 2011, 116, 06319. [Google Scholar] [CrossRef]
  45. Kakinami, Y.; Kamogawa, M.; Tanioka, Y.; Watanabe, S.; Gusman, A.R.; Liu, J.Y.; Watanabe, Y.; Mogi, T. Tsunamigenic ion-ospheric hole. Geophys. Res. Lett. 2012, 39, L00G27. [Google Scholar] [CrossRef]
  46. Chum, J.; Liu, J.-Y.; Laštovička, J.; Fišer, J.; Mošna, Z.; Baše, J.; Sun, Y.-Y. Ionospheric signatures of the April 25, 2015 Nepal earthquake and the relative role of compression and advection for Doppler sounding of infrasound in the ionosphere. Earth Planets Space 2016, 68, 24. [Google Scholar] [CrossRef] [Green Version]
  47. Hayakawa, M.; Izutsu, J.; Schekotov, A.Y.; Nickolaenko, A.P.; Galuk, Y.; Kudintseva, I.G. Anomalies of Schumann reso-nances as observed near Nagoya associated with two huge (M∼7) Tohoku offshore earthquakes in 2021. J. Atmos. Solor-Terr. Phys. 2021, 225, 105761. [Google Scholar] [CrossRef]
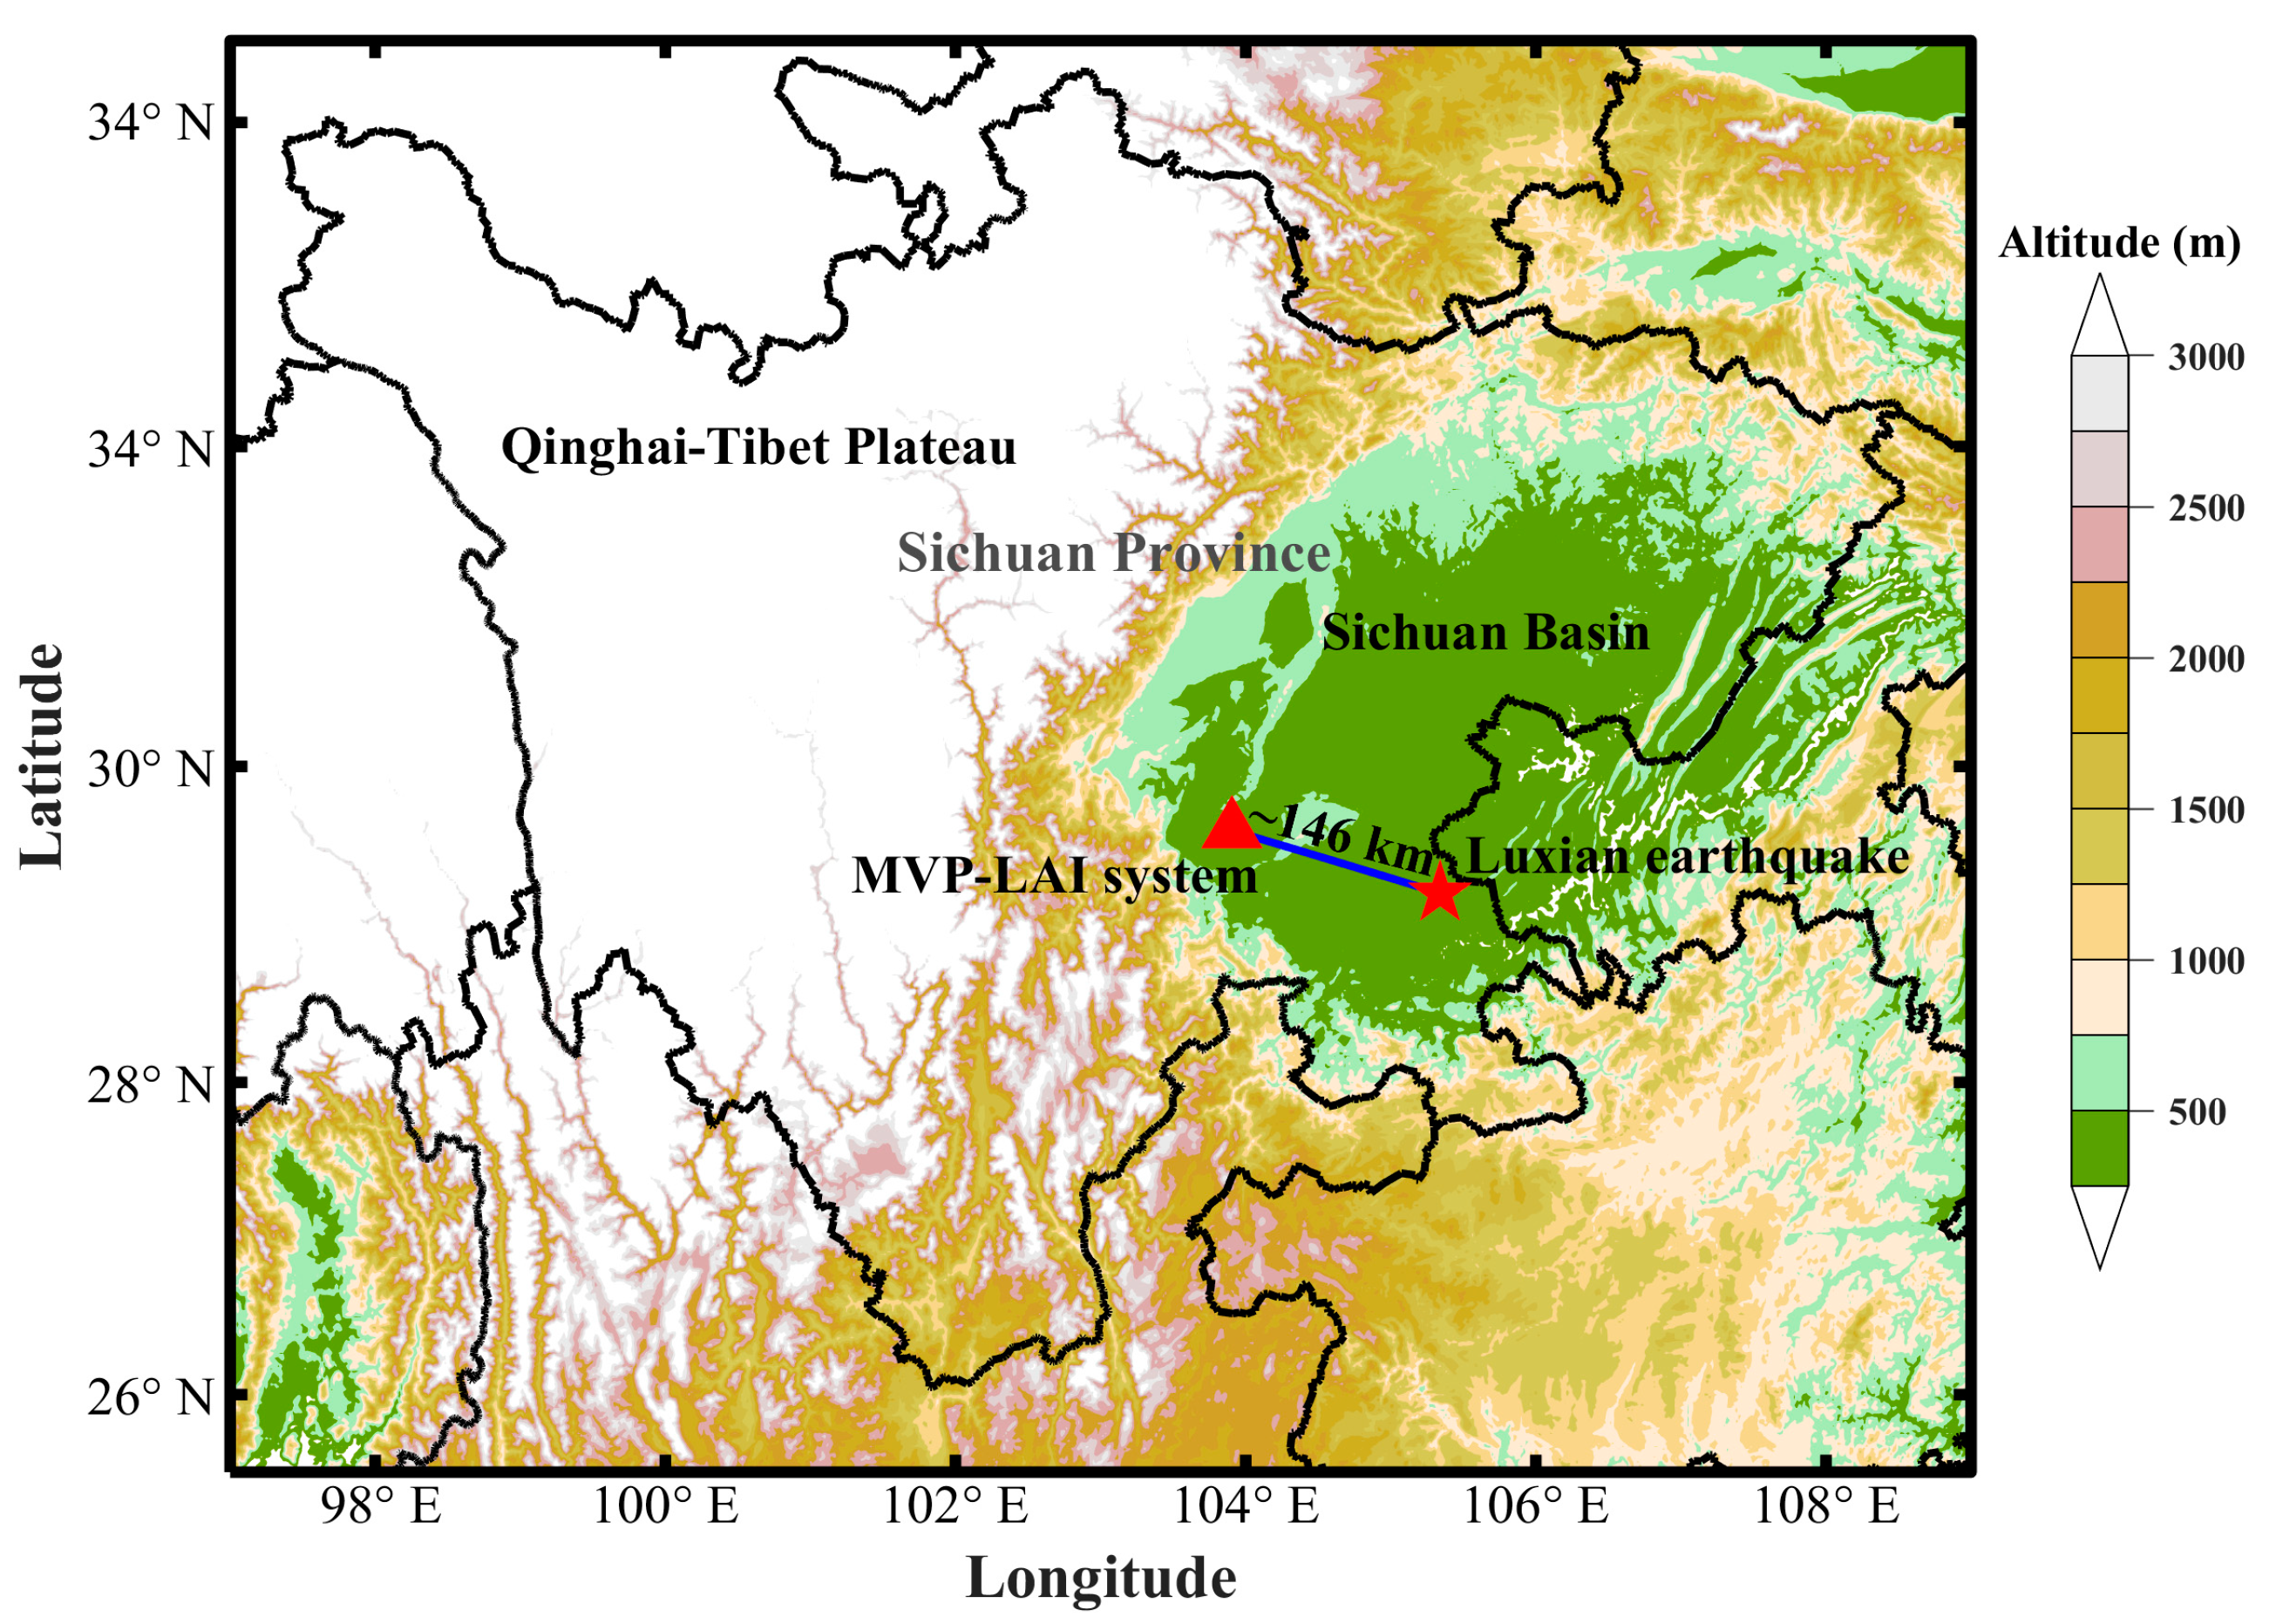
Figure 1. Locations of the Luxian earthquake and the MVP-LAI system in the Sichuan Province, China. The Qinghai-Tibet plateau and Sichuan Basin are located in the western and eastern parts of the Sichuan Province. An obvious difference of ~3000 m in altitude can be found between the western and eastern parts of Sichuan. The red star and triangle denote the locations of the Luxian earthquake and the MVP-LAI system, respectively. The distance between the earthquake and the MVP-LAI system is ~146 km.
Atmosphere 12 01621 g001
Figure 2. Raw data of ground vibrations from the broadband seismometer at the MVP-LAI system from 1 August to 16 September 2021. Gray lines show the raw data of ground vibrations at the north-south, east-west and vertical components in (ac), respectively. The 1-min moving median of the raw data is also plotted by the black lines for references. The red vertical lines indicate the occurrence time of the Luxian earthquake.
Atmosphere 12 01621 g002
Figure 3. Variations of ground vibrations at 20:00–4:00 LT from the seismometer at the MVP-LAI system from 2 August to 15 September, with an interval of 3 days. Gray lines show raw data of ground vibrations at the north-south, east-west and vertical components in (ac), respectively. The 5 s moving median of the raw data is also plotted by the black lines for references. Data at the vertical component are twice the amount of the original raw data for demonstration.
Atmosphere 12 01621 g003
Figure 4. Variations of the TEC, atmospheric pressure, vertical electric field, radon concentration, groundwater level, precipitation, Dst and Kp indices from 1 August to 16 September 2021. TEC at the piece point with an altitude of 350 km over the MVP-LAI system is retrieved from electromagnetic signals emitted from the BDS stationary satellite is shown in (a). Atmospheric pressure, vertical electric field, radon concentration, groundwater level and precipitation are retrieved from the instruments at the MVP-LAI system are shown in (bf), respectively. (g,h) Variations of the Dst and Kp indices, respectively, for the references of the disturbances from solar activities during the study period. Horizontal red dashed lines in (c,d) are the thresholds computed by utilizing an average value adding 3σ (standard deviations) from the entire date from 1 August to 16 September 2021.
Atmosphere 12 01621 g004
Figure 5. Amplitude as a function of frequency of the ground vibrations at the vertical component, atmospheric pressure and TEC at 00:00–02:00 LT from 2 August to 15 September 2021. The amplitude of the vertical component of the ground vibrations, atmospheric pressure and TEC are shown in (ac), respectively. Observation data are downsampled as a temporal interval of 2 s for mitigating short-term sudden and intensity fluctuations. Meanwhile, influence from the long-term period is removed by using the running median with a 1 h window and a linear trend. Red dashed lines indicate the variable frequencies associated with the Luxian earthquake. Blue vertical dashed lines reveal influences associated with the environmental background that fixes at particular frequencies. Note that the blue lines in (c) indicate the amplitudes from TEC on the 5 quietest days from the Kp index during the study period.
Atmosphere 12 01621 g005
Publisher’s Note: MDPI stays neutral with regard to jurisdictional claims in published maps and institutional affiliations.