1. Introduction
Light negative ions exert a positive influence on human health, and their deficiency embodies a cause of fatigue, health problems, and reduced work performance, as proven within dedicated medical research (for example, studies [
1,
2,
3,
4,
5,
6,
7,
8,
9,
10]). In addition to having an impact on the human organism, light negative ions play a major role in the elimination of spurious bacteria [
7,
8] and viruses [
9]; in caves, for example, they thus help to create an environment with an increased degree of sterility to suit patients who face respiratory problems. Specialists from the Institute for Theoretical and Experimental Biophysics, Russian Academy of Sciences, have tested ionisers that utilise high-voltage stimulation of plants in saline solutions; in their study [
11], the effect of such ions on the tracheae of laboratory rats was evaluated via blood tests. The concentration of air ions is commonly measured to facilitate air pollution monitoring [
12,
13,
14,
15,
16,
17], workplace hygiene inspections [
18,
19,
20], curative procedures such as cave therapy [
21,
22,
23,
24,
25,
26], the investigation of atmospheric electricity, and, more recently, also the prediction of earthquakes or weather anomalies [
27]. In this context, the generation of atmospheric electricity in the troposphere and the relevant impacts on the environment are described by, for instance, K. Aplin [
28,
29,
30,
31]. The area of interest overlaps into astrophysics, comprising the research of atmospheric charges and ionisation on the gas planets of the solar system. Knowing the physical parameters of respiratory therapy caves constitutes an important precondition for a successful completion of the applied treatment; one of the major parameters then lies in the concentration of light air ions [
32,
33,
34,
35].
Measuring the properties of air ions is a topical problem that has been analysed by multiple laboratories [
22,
29,
36]. At present, the concentration of air ions is frequently assessed with gerdien tubes (GT). This approach provides the benefit of utilising, with a high degree of accuracy, the measured spectra to evaluate the mobility (spectral characteristics) of air ions; other techniques, such as those introduced in articles [
37,
38,
39], do not allow this option. The functional principles of measuring devices that employ gerdien tubes are characterised by Tammet in the referenced source [
40]. The mobility spectra of air ions, including related data analyses accompanied by interpretations of the size of the ions, are discussed in articles and theses by J. J. Nolan and P. J. Nolan [
41,
42,
43]. Most of the spectrometers designed or applied in the above-cited studies are stationary, convenient for weather stations to measure the conditions in air-conditioned buildings. Other interesting devices of this type that serve meteorological purposes can be found in monographs [
37,
39]. In terms of determining the mobility of air ions, measurement with a gerdien tube having a split inner electrode is faster but less accurate [
32,
44]. All of the configurations mentioned herein exploit data that relate to the concentration of light air ions, mobility spectra of air ions measured with a relevant accuracy, and information acquired in a metrologically correct manner. The entire measuring procedure and methodology then have to be preset such that the analysis and evaluation of the monitored or derived effects remain feasible [
32].
The investigation outlined in source [
45], which focuses on determining the air ion concentration in a given space, produced an automated measurement system (code AK-UTEE-v2) based on a gerdien tube with a low specific air flow rate; the setup offers long-term operability and facilitates the computation of spectral ion characteristics. From the instrumental perspective, the distinctive features comprise the structure of the gerdien tube, active shielding, and design of the electrometric amplifier; moreover, a specific method for computing spectral ion characteristics is employed. The actual measuring procedure is fully automated, including calibration [
22].
Generally, the measurement of air ions in respiratory therapy caves involves large uncertainties caused by the high air humidity and small flow volumes with major ion fluctuation in a strongly radon-ionised environment [
22,
46]. The corresponding conditions place extreme demands on the design and structure of the measuring setup, the gerdien tube and amplifier electronics in particular [
45,
46]. A substantial disadvantage of current ion meters rests in their not functioning or being capable of only very limited operation in environments that are characterised by very high humidity rates [
22,
33,
38], ones of up to 100%. The measurement indeterminacy is also markedly influenced by the presence and movement of persons in the given cave during the therapy and measuring procedures [
32].
2. Respiratory Therapy in Císařská Cave (the Moravian Karst, Moravia, the Czech Republic)
Natural caves are significantly utilised for the treatment of children suffering from asthma [
34,
47,
48,
49,
50,
51], an inflammatory disease diagnosed in up to 8–10% of children in the Czech Republic [
52], according to medical reports. The set of renowned healing facilities comprises, above all, the Eden health center in the town of Zlaté Hory (the Jesenik Mountains) and the children’s resort in the municipality of Ostrov u Macochy (the Moravian Karst); our experimental measurement cycle using the proposed methodology was conducted at the latter of these locations [
52].
The children’s therapy resort in Ostrov u Machochy has traditionally practised curative procedures in youngsters afflicted with respiratory problems, and Císařská Cave, as a cold karst cave site [
47], has been specially adapted for the given medical purposes [
32,
53].
The curative effects of the cave have been examined within multiple investigations. In this connection, relatively recent results have shown that the treatment is made possible predominantly by the cave’s microclimate [
47,
54] together with the high concentration of light negative ions [
32]. In dedicated experiments at the Department of Theoretical and Experimental Electrical Engineering, Brno University of Technology, bacterial colonies decreased quantitatively after being exposed to light negative ions [
55]; such an outcome helps us to explain the low concentration of bacteria in the cave. This finding is in agreement with studies performed at other laboratories worldwide [
7,
8,
9,
49].
The previously favoured, climate-based theory in speleotherapy [
35,
47,
54] has been gradually substituted with the environmental concept, which associates the relevant curative effects with a broad corpus of components, factors, and processes at play in a cave, emphasising their clinically verifiable interaction and influence on the human organism. The effects that demonstrably affect the patients‘ health can be outlined as follows [
32,
52,
56]:
Stable temperature of 7–8 °C;
Relative air humidity of 100% throughout most of the year;
High content of light negative ions due to the air being ionised by radon generated from limestone radionuclides (uranium, thorium, and radioactive potassium);
Calcium and magnesium ions in the aerosol;
Limited air flow;
Low dustiness rate and a lack of allergens and bacteria.
We can then stress that the high relative humidity cleans the air in the cave from dust and pollen to ensure a higher concentration of light negative ions, which further clean the air through positive feedback; that a higher concentration of air ions is usually found in locations with lower air flow rates; and that light negative ions eliminate the bacteria [
8,
55] circulating in the air and exert a positive influence on the human respiratory system [
14,
15,
32]. The mechanism of reducing dustiness in a humid environment can be interpreted as resulting from sufficiently small droplets of water floating in the air. The relative permittivity of water is normally in the region of
εr = 80; near a small droplet, the intensity of the electric field
E (if such a field is present) increases,
Enear = 3Eo/(
εr+2), [
57]. This effect produces more intensive electrostatic forces on a dust particle in the vicinity, and this particle is then attracted to the droplet.
The environment of the cave is isolated from external electric fields. As regards CO
2, whose concentration embodies a significant parameter in the discussed respect [
58], some researchers [
47] emphasise the favourable impact of an increased content of the gas on the depth of breathing; interestingly, however, such conditions do not materialise in Císařská Cave, because the sufficient ventilation maintains the concentration at common levels, below 1000 ppm [
32,
59]. The values are monitored on a regular basis by the State Mining Authority of the Czech Republic and were also verified during an experimental measurement with the AK-UTEE-v2 ionmeter [
32]. The proportion of calcium and magnesium ions in the speleo-atmospheric aerosol is subject to strong fluctuations in the course of the year, as proposed by Faimon [
60]. According to recent investigations [
32,
60], the central difference between an external environment and an internal microclimate rests in the higher content of light negative ions in the latter case; such a finding then leads to the requirement for long-term, accurate sensing of the concentration of air ions in caves, including the spaces that are described in this article.
Another task within characterising the given location was to determine the radioactivity of the rock. In the period between 2001 and 2009, Štelcl and Zimák [
61,
62] measured the volume of radionuclides
238U,
232Th, and
40K in the devonian limestone formations surrounding Císařská Cave [
61], using a GS-256 gamma-ray spectrometer manufactured by GF Instruments (Brno, Moravia, the Czech Republic). The area of the cave, despite exhibiting rates (60 Bq/kg) [
61] above the average of the region, ranks with the standard radioactivity band if the Czech Republic is considered as a whole [
63].
The mutual relationship between radon and its products adhering to aerosols was characterised in an essential study by Porsterdoerfer [
64]. Within the Czech Republic, the
222Rn concentration variances in several caves during a year were discussed in dedicated papers [
65,
66,
67], which considered the climatic conditions and content of CO
2. These sources, however, did not examine the concentration of light negative ions. The volumetric concentrations of radon and thoron are mostly influenced by the ventilation of the cave over the course of the year. The Císařská Cave air flows were analysed by Faimon and Lang [
68,
69]. If ventilated through both of the small windows in the doors guarding the entrances, the cave is a dynamic one, having certain characteristics of the static type. The two individual entrances are located at various elevations. The upper door vent is left slightly open only during respiratory therapy sessions, whereas the lower gate window remains in such a position all year long.
Figure 1 (below, p. 5) displays a drawing by Karel Absolon that represents the cave as known in 1950; the illustration was revised according to references [
70,
71]. Exploiting the conclusions outlined within Lang’s thesis [
69], the modified version of the drawing indicates two main air flow directions, namely those between the upper and the lower entrances and across the currently defunct estavelle [
72]; the latter direction is merely assumed. To demonstrate these flow dispositions in relation to parts of the cave and their functions, we can propose the following description: Nagel’s Lake, now filled with earth and used as a natural gym, is situated near the upper gate, thus enjoying more intensive ventilation; conversely, the Dome of Chaos, a chamber located in the deeper zone, halfway between the entrances, accommodates a relaxation room and does not—nor is required to—allow for major draughts. As some of the cave’s sections are below the lower entrance, the cave shows also static attributes, with the ventilation (characterised as the DAF, or downward airflow ventilation mode) becoming rather less effective in summer months. At present, this particular issue is being investigated by J. Faimon at Masaryk University, Brno.
The air flows embody a substantial influence on the concentration of light negative ions, and their measurement therefore enables us to indirectly determine the possible patterns of air exchange within the cave. An accurate scheme to assess the rock radioactivity and air distribution in the examined subterranean spaces is nevertheless still lacking, despite the efforts of several research teams and the partial results obtained thus far; the approach to correct this deficiency could then consist in measuring the concentration of light negative ions on a direct basis, establishing the correlation with the ambient temperature, pressure, moisture, and the number of patients being treated [
73].
The air ion concentration sensing cycles performed in 1999 were markedly impacted by the high moisture and water condensation rates [
32,
46]. The acquired saturation characteristics did not represent the ion properties satisfactorily, as they had to be measured several times, while the concentration of ions in the cave varied according to the meteorological conditions. Thus, the cycles that have been carried out to date have not brought dependable information on the mobility of light air ions in the cave.
3. Methodology for Measuring the Concentration of Air Ions in Caves
The approach to measuring the concentration of air ions [
32] in respiratory therapy caves differs substantially from those applied in measurements at regular surface levels. The methods and methodologies used to date have exhibited technical shortcomings in the area of assessing the concentration of ions in spaces with high air humidity rates [
73,
74]. One of such shortcomings is the instability of the measured quantity due to the connection of the sensor in the tested part of the cave. As described below, a stable configuration of the gerdien tube was identified, designed, and experimentally tested, making the measurement more precise and improving the validity of the results obtained. Measuring systems that are modified in this manner generally ensure higher precision and credibility in determining the spectral characteristics of the ion spectrum of the space being examined. In our case, adjusting the sensor yielded major enhancement in the long-term stability of the quantity of interest. The upgraded methodology, which, together with the modified system, allows evaluating at high quality the changes in and the state and distribution of the air ion concentration in the cave, was employed to produce dependable results.
A sensing system to be used for such atypical purposes (i.e., the estimation of a therapy cave environment) [
32] must offer a suitable operating mode to eliminate critical factors and effects, including the electrostatic field in the measured space; the leakage current of the gerdien tube; earthing; and the dynamics of changes in the concentration of air ions in time. In addition, the complete cycle needs to be executed automatically, without the operator or other persons at the location.
The Císařská Cave measurements were performed using the AK-UTEE-v2 system (Brno, Moravia, the Czech Republic) (
Figure 2), a compact device with an electrometric amplifier on the gerdien tube casing. The electrometric amplifier comprises also a polarisation capacitor periodically charged from a high-voltage power supply. The zero offset of the amplifier is set by means of a D/A converter, with the gerdien tube fan switched off. The voltage value measured at the output of the amplifier is digitised via a 16-bit successive approximation A/D converter and processed in a microcontroller.
To support the long-term (over 7 days) measurement of the concentration of air ions in a humid environment, we designed a special method characterised by regular sensing of the leakage currents and their usage within the automatic calibration mode. Such a technique enables long-term measurement cycles while eliminating the uncertainties due to the presence of the operator. From the instrumental perspective, the properties of interest are the low volumetric air flow rate; gerdien tube structure; unique active shielding; and suitable connection of the electrometric amplifier.
Generating the desired air ion concentration to verify the accuracy of the novel measuring system constitutes a problematic task; the AK-UTEE-v2 meter was therefore experimentally compared with a similar device, the AK MGK-01 (Kathrein) utilised by the National Institute of Public Health (Prague, the Czech Republic). According to the obtained results, the AK-UTEE-v2 measures a smaller concentration of air ions and provides a lower standard deviation than the AK MGK-01, with the average value of the correction coefficient being Kion = 1.52.
As already mentioned above, a major advantage of the AK-UTEE-v2 rests in the low volumetric air flow rate M, rendering the meter highly suitable for measurement in caves that allow for only a very reduced draught. The spurious effects exerted by the instrument on the measured space are then minimal. Importantly, the actual design of the AK-UTEE-v2 facilitates the research and long-term monitoring of the concentration of light negative ions in relation to the climatic conditions and ion mobility in the respiratory therapy cave.
4. Measuring the Concentration and Distribution of Light Air Ions and Estimating the Coefficient Unipolarity in Various Parts of the Cave
To assess the distribution of the ion field in the cave, we carried out measurements at several points characterised by varying degrees of ventilation and diverse radioactivities of the calcareous massif; the measuring cycles were performed on 19 November 2015. All the measuring points were placed at a level of 120 cm above the cave surface; their exact locations are indicated in the relevant customised layout of Císařská Cave,
Figure 3. After being triggered, the cycles continued throughout the day, with comparable measurements at different spots (only minimally influenced by the meteorological conditions in Ostrov Valley) running between 8:47 and 10:56. The collected concentrations of ions of both polarities are summarised in
Table 1. Although the ions are diffused in the air inside the given space, the less ventilated sections of the cave, such as Ostrov Chambers and the table tennis hall, exhibit discernibly higher concentrations of light ions of both polarities. At those measuring spots that were located in the smaller sections of the cave and/or close to the limestone walls, the unipolarity coefficient
P approaches the value
P = 1; however, at points more distant from the walls the coefficient fluctuates within the usual range of
P = (1.12–1.18).
The afternoon measurement cycles were affected by changes in the average concentration of light ions at some of the measurement spots; such variation had arisen from lower air temperatures in the surrounding Ostrov Valley. Interestingly, we detected an increased value of the unipolarity coefficient P in the vicinity of the medical chaise lounges placed on metal floor grates in the relaxation room at Niphargus Lake. The location is distinguished by minimum air flow, and the concentration of light negative ions continued to rise during the measurement cycles with the GT fan switched on. The sharp separation of the cave’s microclimate from the external environment was confirmed through assessing the conditions at the lower entrance, where we found that—although spot No. 8 was situated only 3 m from the door—the obtained concentration of light ions of both polarities almost equalled that inside the relaxation room and Nagel’s Dome.
In terms of the methodology, it appears beneficial to compare the data collected in individual sectors of the cave. The pattern acquired in Nagel’s Dome at spot No. 1 (
Figure 4), similarly to those from the morning cycles in Ostrov Chambers 2 (
Figure 4), did not exhibit a marked air ion concentration change during the measurement interval of
tmeas = 300 s with the fan on; however, in the poorly ventilated zones of Císařská Cave we already detected an impact of the gerdien tube on the concentration of light negative air ions. In this context, as the measuring sequence is identical in ions of both polarities and the preceding zero value calibration has the same duration, we can exclude the fan start-up effect; thus, it is possible that the air flow sucked into the gerdien tube influences the concentration of light negative air ions in the small space. Such an effect is most probable to occur during measurement in the lower relaxation room at point No. 5 (the first pattern in
Figure 5) and the head section of Deep Lake at spot No. 7 (the second pattern in
Figure 5).
The mouth of the gerdien tube was positioned such that the air could not be sucked in against the steady draught in the cave sector being tested. The temperature sensed outside the cave was higher than that measured inside (T = 8.1 °C), and we therefore assumed the air flow path from the lower entrance to the estavelle. The assumption was later confirmed through a follow-up measurement with a TA 888 hot wire anemometer. In the unventilated spaces of Ostrov Chambers, the air was sucked into the GT in the direction towards Nagel’s Dome.
The relationship between the concentration of light negative ions and the level above the ground in Nagel’s Dome was examined on 11 July 2015; the outcomes (
Figure 6, up) did not reveal any major dependence of the aggregation on the distance from the lowest point of the base. Interestingly, Nagel’s Dome formed only after the infilling of the location previously occupied by Nagel’s Lake, and the rock and soil backfill had been extracted from the then newly tunnelled Gothic passage as well as a quarry outside the area. The floor is therefore not directly supported by the original limestone mass.
Within the same measurement series, we also investigated the influence of the cave walls on the concentration of light negative ions, employing a cross section through the cave profile; this cross section, whose actual position is displayed in
Figure 3, had been planned to include the limestone walls covered by the Lake before its conversion into a dry sector. The results (
Figure 6, bottom) exhibit a moderately elevated—by about 500 ions/cm
3—ion aggregation rate at the walls. At the distance
d = 90 cm from the reference wall, the sensing spot was situated in a recess, with the limestone on the sides and above. The concentration of light negative ions was established at two points: in the middle of the profile and at one of the walls. Towards the center of the Dome, the unipolarity coefficient approached the usual value of
P = 1.25, whereas the spaces closer to the wall were characterised by prevailing negative ions. The role of the walls in the distribution and dynamics of ion concentration inside the cave will be subjected to further intensive research; currently, however, the evaluated measurements indicate a dominating diffusion effect or, in other words, light ions spreading evenly in the area.
5. Impact of the Gerdien Tube Earthing on the Measured Concentration of Light Air Ions in the Cave
Another working cycle of interest targeting Císařská Cave had been carried out on 12 May 2013. In this case, the ion meter was placed on an adjustable camera tripod to read the air ion concentration at the height of
h = 120 cm, corresponding to the breathing level of the child patients of normal stature who pursued their therapy in Nagel’s Dome. We then experimentally determined the impact exerted by earthing the gerdien tube-based measuring set on the standard deviation of the obtained air ion concentration values (low-level measurements and methodologies [
73,
74]). The earthed and unearthed measurement cycles are compared in
Table 2,
Figure 7.
Comparing the histograms of the patterns (
Figure 7, bottom) will reveal a minor standard deviation in the earthed device and a higher air ion concentration value yielded by the arithmetic averaging of the measured data,
Table 2. In the unearthed mode, a portion of the ions impinging on the outer electrode affected the measurement accuracy, and the results then exhibited a relevant deviation; with the ion meter setup earthed, however, the moving free ions impinged correctly on the collecting inner electrode, thus eliminating the effect of the ion meter connection error in the final results. All the air ion concentrations within this article were invariably obtained with the system earthed.
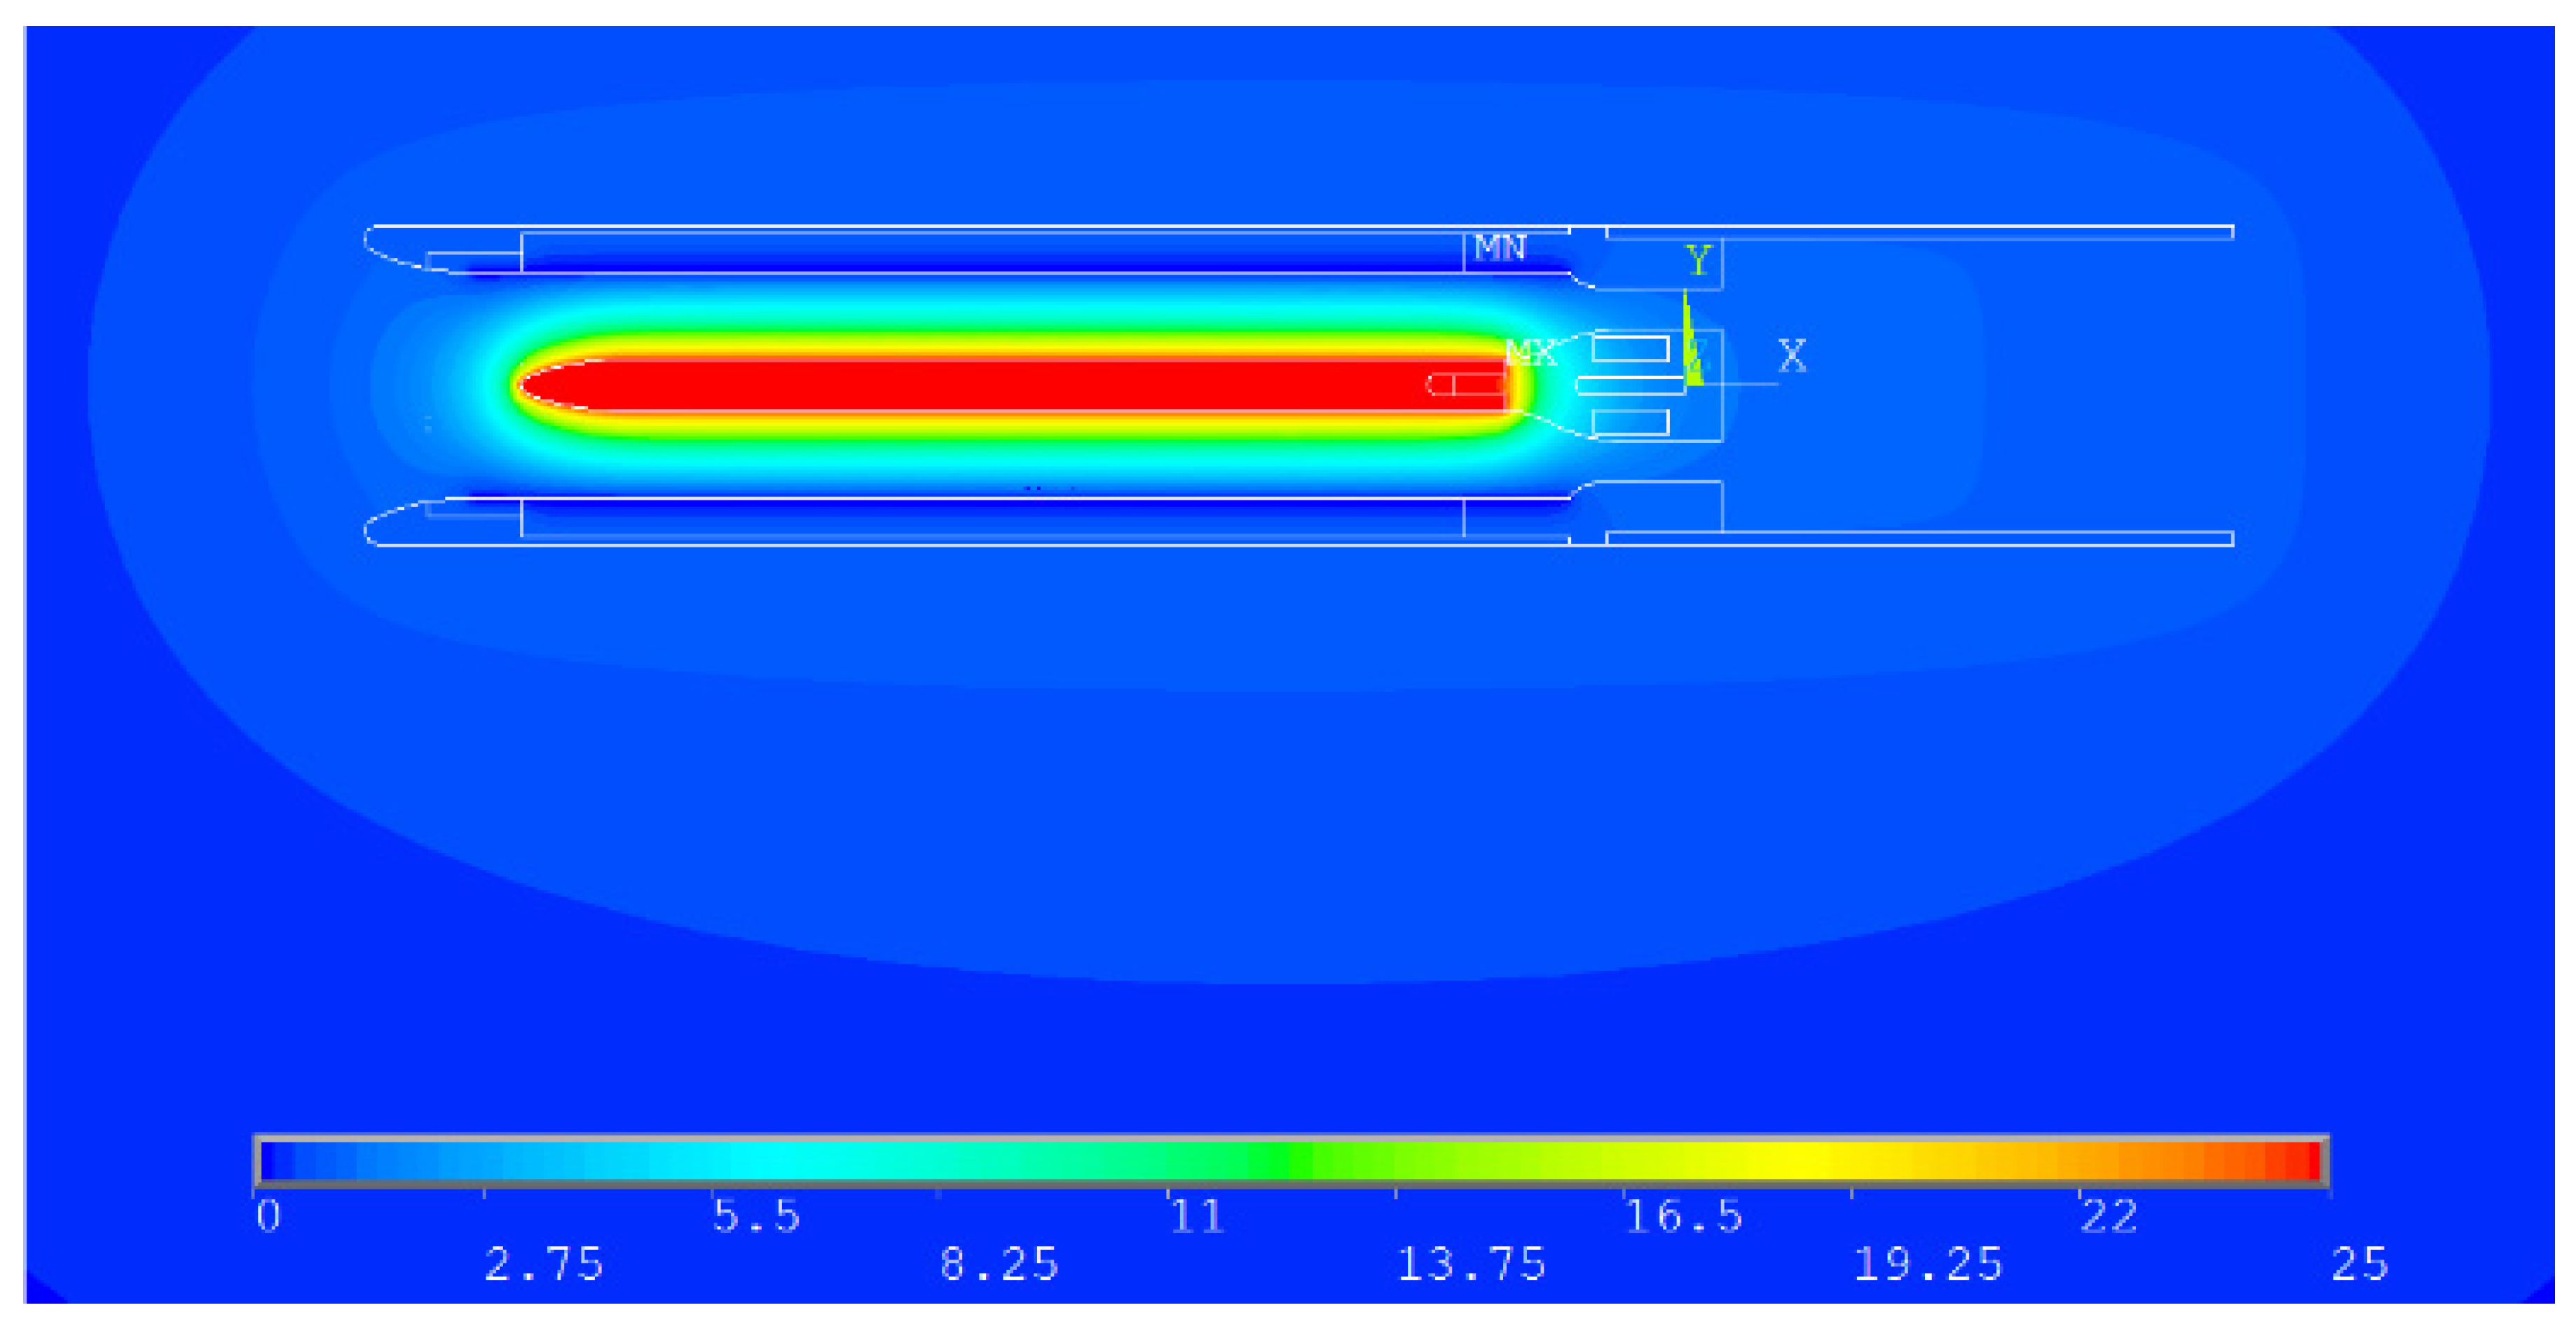
The oscillations in an unearthed measuring configuration can be explained via a FEM-based simulation of the distribution of the electrostatic field in the vicinity of the gerdien tube. With the gerdien tube unearthed and a floating power supply electrometric amplifier wired, a stray voltage potential may appear at the device’s casing. Such a situation was simulated through applying a shielding electrode with the potential ψ =1 V,
Figure 8. A similar condition may appear when the gerdien tube is earthed using a common protective and zero conductor, where voltage drops occur due to the electric current passing to the load.
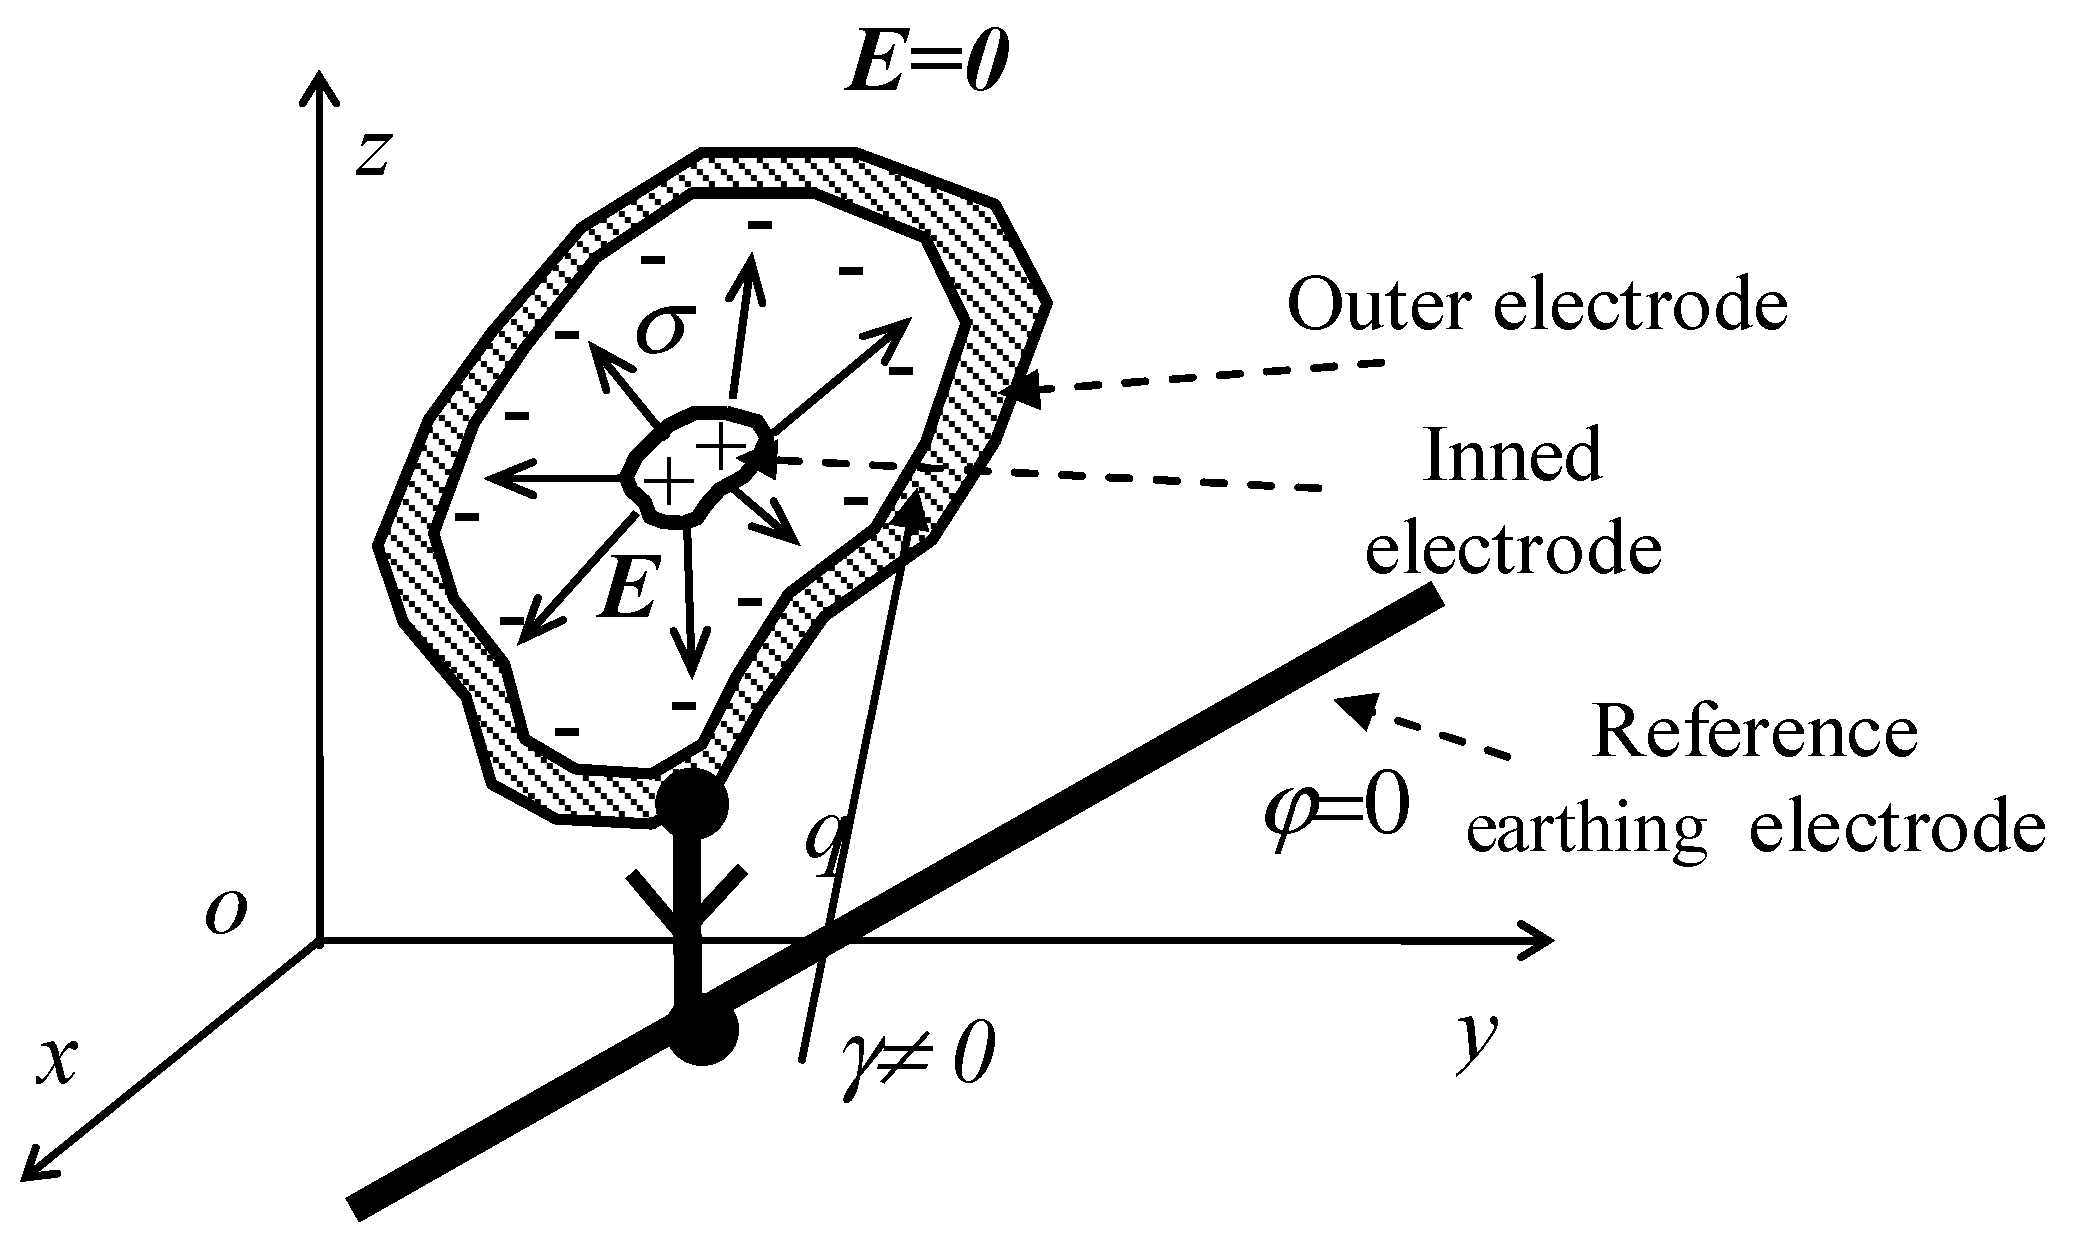
If connected as shown in
Figure 9, the sensor (the gerdien tube) is not earthed, and a state arises when, due to the design of the measuring capacitor (see the model in
Figure 8), the respective type of the electric charge
qout from the air in the cave is captured on the outer electrode. This electric charge has very small magnitudes, ones in the order of pC, and varies on the outer electrode according to the size of the elements of the equivalent model from
Figure 9. The electric current produced by the electric charge
q impinging on the outer side of the electrode can be written as
where
ρ is the volume density of electric charge,
v denotes the speed of the electric charge movement, and Δ
S represents an element of the area vector passing through the electric charge
q.Then, on the assumption of a change in or termination of the incidence of the electric charge on the outer electrode of the measuring capacitor, there will occur a change in the electric charge (and thus also in the signal
u(
t) measured and evaluated by the sensor
us(
t)):
where
u(
q,
t)
out is the evaluated output signal of the measurement, and
A stands for the gain of the measuring system. The time constant of the process will depend on the instantaneous placement of the sensor, humidity, and conductance of the air environment:
The connected capacitive sensor with a floating capacitive input,
Figure 9, modulates the output signal
us(
t) and introduces a considerable measuring error into the evaluated signal
u(
q,
t)
out. This effect can be eliminated via the connection represented in
Figure 10, namely by earthing the sensing capacitor. This step will phase out the low-frequency signals (input signal fluctuation) and their amplified form in the signal being evaluated,
u(
q,
t)
out.
In a fully floating shielding (
Figure 11) without a pre-defined relationship to the potential of the earth, assuming the initial positive potential ψ = 1 V, the incident negative ions progressively introduce the shielding electrode to the opposite, negative potential. The electrode then attracts positive ions,
Figure 7 (bottom), to exhibit positive potential again. Thus, progressive potential oscillations are generated on the external shielding electrode, and these affect the electric current measured by the collecting electrode. The follow-up measurements enabled us to specify the frequency of the oscillations in the older AK UTEE ion meter (fitted with only an unearthed external electrode) at
f = 0.02 Hz. This measured frequency corresponds to the above calculation from the theoretical values and confirms the correctness of the proposed model with concentrated parameters.
Overall, undesired impacts of the environment were resolved via earthing the sensing capacitor (
Figure 12), and appropriate adjustments then allowed us to minimise the influence of charging and discharging the outer electrode.
6. Determining the Mobility Spectrum of Light Air Ions and Its Season-Related Changes
The previous short-term measurements allowed us to form an idea of the air ion concentration in the spaces to be tested. In order to establish the saturation characteristics relevant for Císařská Cave and to define the mobility of the negative and positive ions, the measuring cycles were conducted repeatedly over the course of six months, at regular weekly intervals.
In 2015, the second half of the summer was very dry, influencing, through factors such as lower water level in the lakes or interrupted dripping from the ceiling, the natural humidity and ionisation. The relative air humidity nevertheless still approached 100%. To determine the inner and the outer temperatures T and the moistures h, we employed a GFTH 95 manual meter, which ensures the temperature and relative humidity measurement accuracies ΔTmeas = ±0.3 °C and Δh = ±3% RH, respectively; for continuous recording of the same quantities during long-term cycles, we then used an AXIOMet AX-DT100 datalogger, whose relevant accuracy capabilities correspond to ΔTmeas ± 1 °C and Δh = ±3.5% RH.
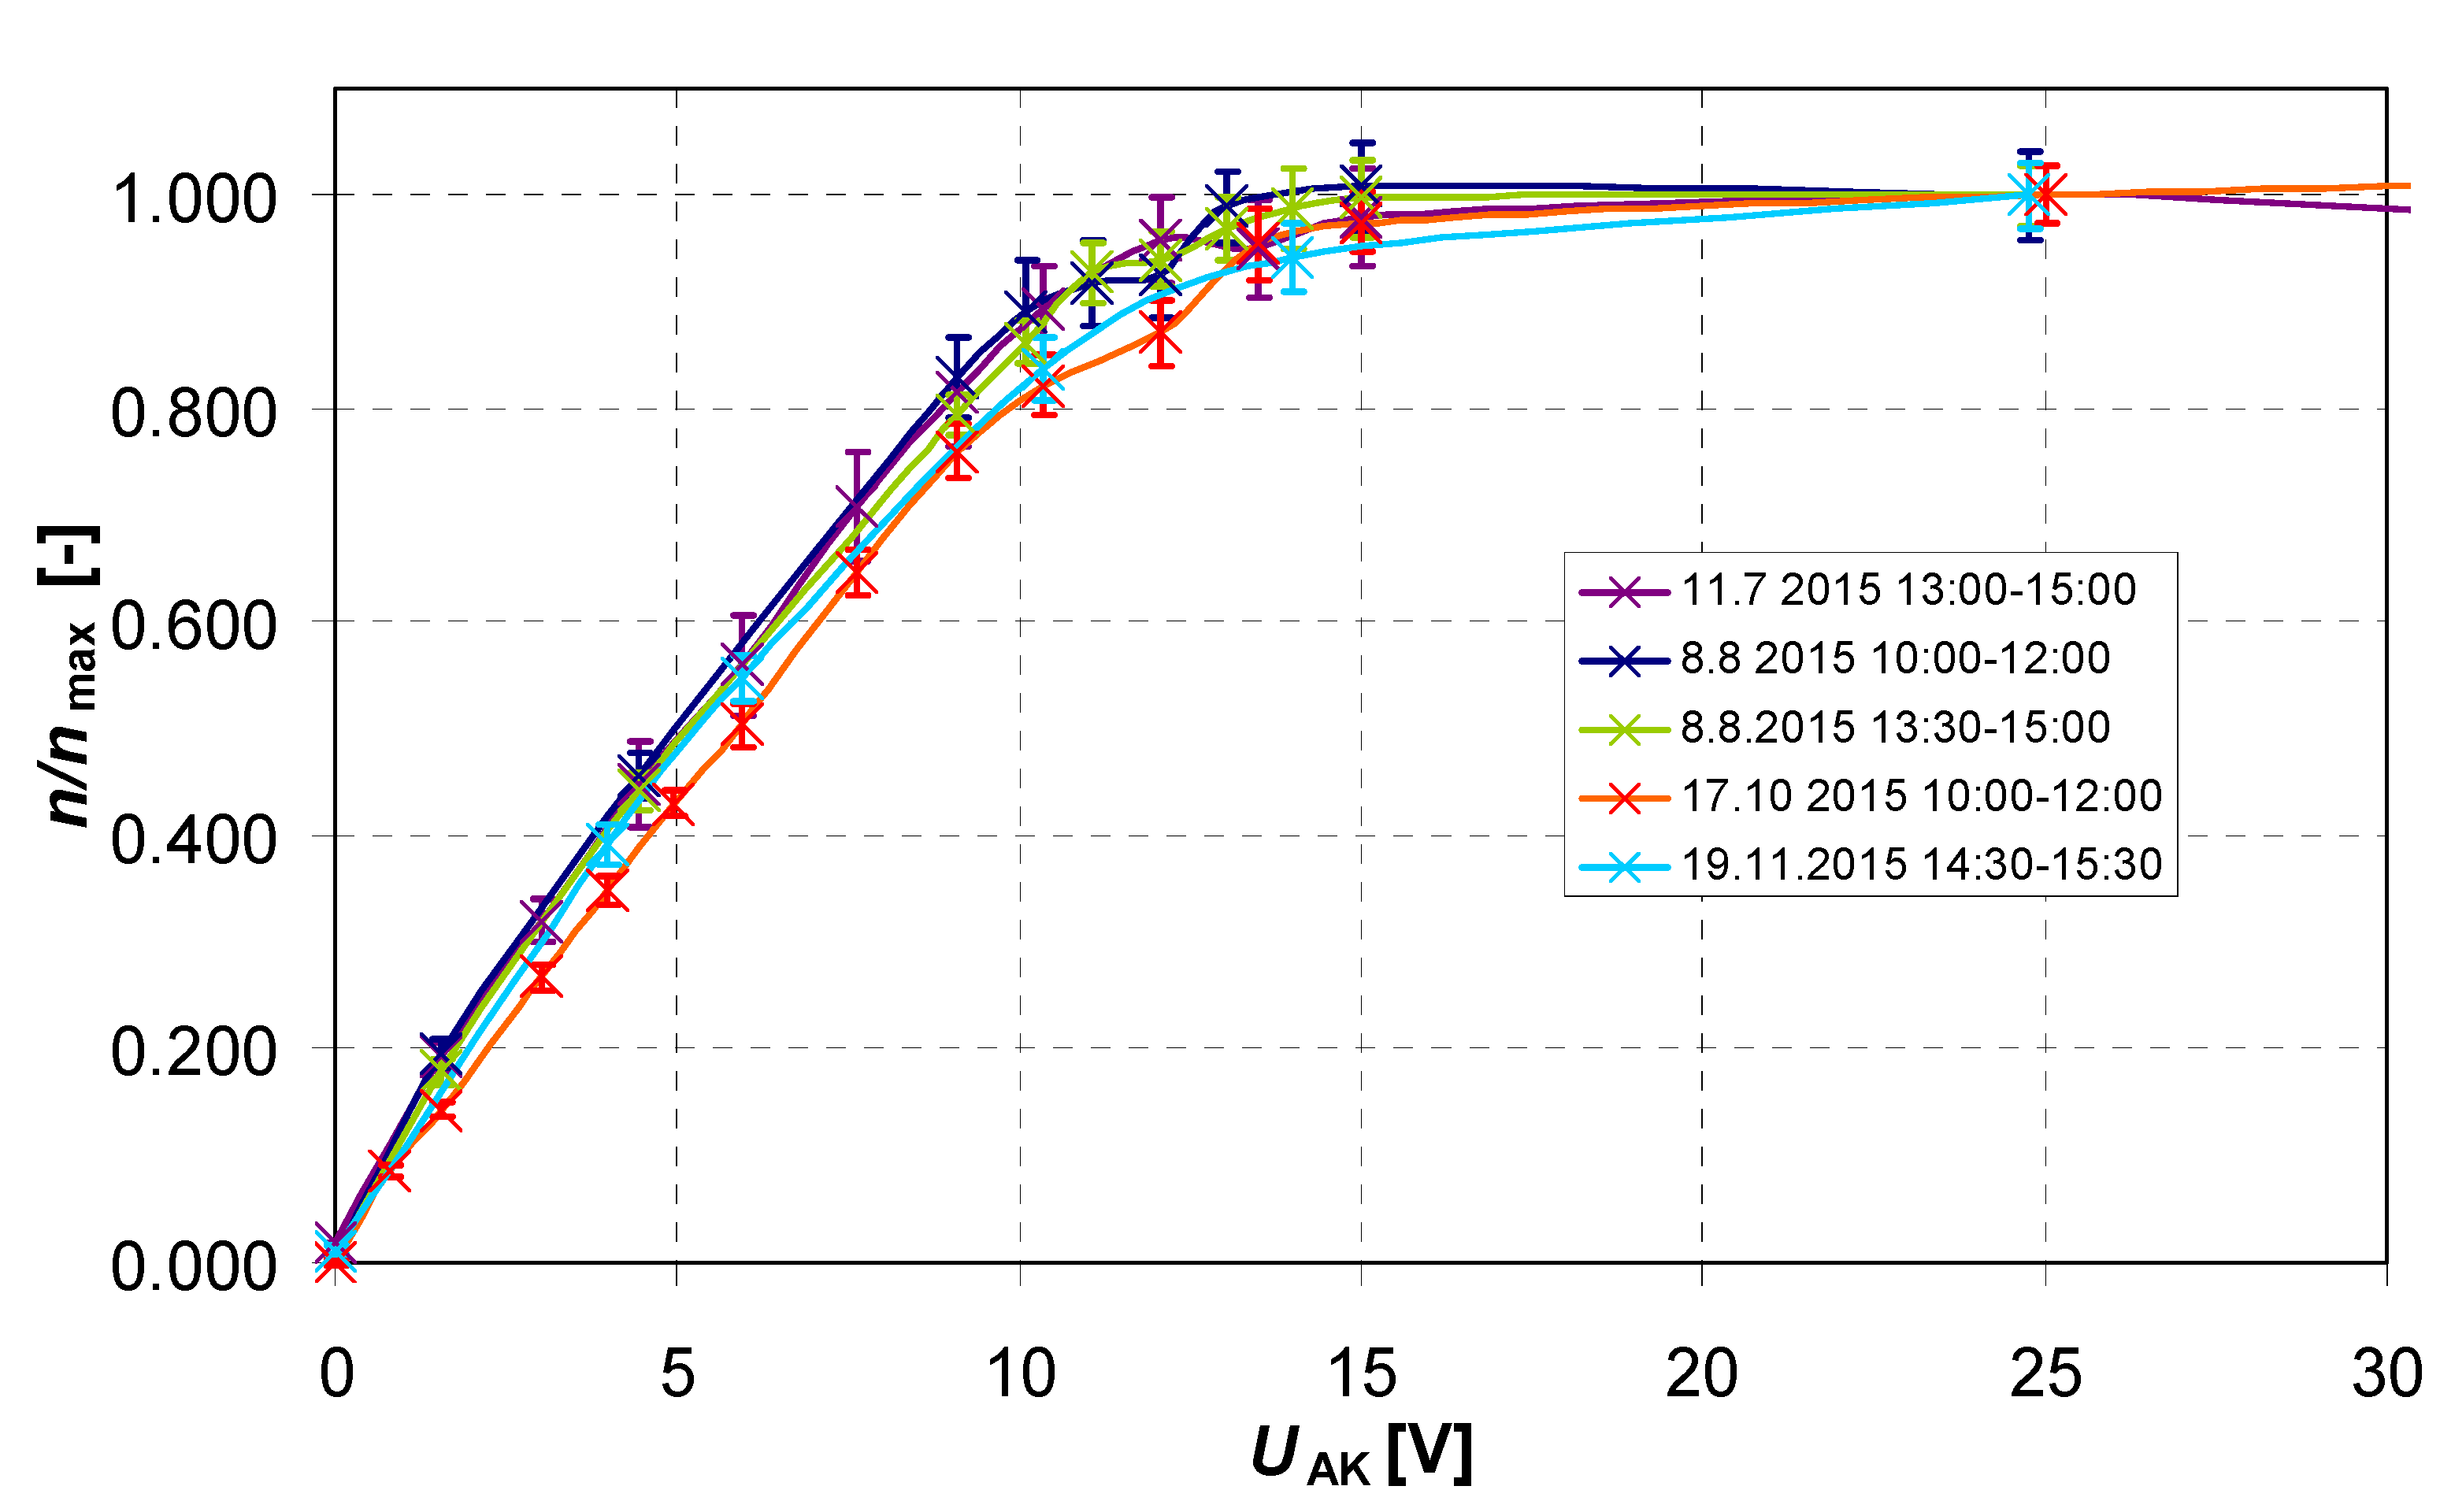
The assessment cycles to define the saturation characteristics of light negative ions were executed on 11 July, 8 August, 17 October, and 19 November 2015. To achieve the given purpose, we had to find a compromise between the number of measured points, the total time required to obtain a saturation characteristic, and the measurement period length per point. The length of a period then equalled ts = 200 s, with the fan on; the entire cycle, including the zero calibration, ran for tzer = 240 s. A 60 min cycle encompassed approximately six measured spots.
A better comparison can be obtained by normalising the characteristics with respect to the maximum value in the saturation domain, namely
UAK = 25 V in the AK UTEE device; the basic and the normalised data are represented in
Figure 13 below.
When being evaluated, the saturation characteristics revealed a certain fluctuation in the dominant break point region of the air ion concentration value; the effect was then eliminated using an approach where three dominant break points are considered to determine the ion mobility spectrum. Generally, the conversion of the characteristics to air ion mobility spectra is outlined in source [
32]; the procedure exploits the numerical method of least squares, where the Levenberg–Marquardt algorithm is fundamentally utilised. The main benefit of the applied technique consists in eliminating the problem of a decrease in the saturation characteristics function; otherwise, using the traditional algorithm described by Israel [
75] would lead to computation divergence [
76,
77,
78,
79]. In a more intensive air flow, there prevail ions having the mobility
k = (2.26 to 2.84) cm
2·V
−1·s
−1. Further, a comparatively steady concentration of high mobility ions is discernible, with
nstab = 570 ions/cm
3 and
k = (9.0 ÷ 14) cm
2·V
−1·s
−1; their formation probably relates to the permanent ventilation of the cave and the development of ions from fragmented fine water droplets and aerosol (
Table 3). This is in agreement with a study establishing the mobility spectrum of light air ions formed by spraying distilled water [
42]. A comparison of the measured and the approximated saturation characteristics sensed in Nagel’s Dome on 8 August 2015 is shown in
Figure 14.
In unventilated conditions, the concentration of air ions rises markedly, up to 10,000 ions/cm
3, and lower mobility ions ranging within
k = (1.54 ÷ 1.85) cm
2·V
−1·s
−1 begin to prevail. Light positive ions were not monitored in as much detail as negative ones, because a favourable impact on human health is not assumed in the former [
1,
2,
5]. For comparison purposes, we measured the saturation characteristics on 8 August 2015 (shown in
Figure 15) and then computed the ion mobility spectrum introduced in
Table 4; this phase enabled us to confirm the assumption that light positive ions are less mobile than their negative counterparts. As can be seen from the measured saturation characteristic in
Figure 13, and in agreement with an earlier study of the mobility spectrum of ions formed from sprayed distilled water [
42], no positive air ions of high mobility were established.
8. Correlations between the Presence of Patients, Ambient Temperature, and Concentration of Light Ions
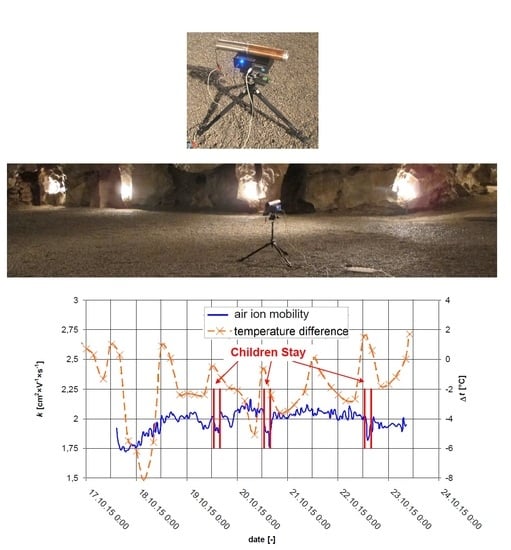
Another factor of major importance for the aggregation of air ions in Nagel’s Dome consists in the presence of child patients. To conduct the relevant week-long assessment (Saturday 17 October 2015 to Friday 23 October 2015) seamlessly, we chose sensing point No. 9, i.e., the spot in the vicinity of the upper entrance, where the patients could not impair the measurement or damage the devices during therapy-related activities, such as ball games. Long-term cycles centered on the impact of the children’s presence are performable under a convenient operational methodology and mode. Automatic compensation was carried out at intervals of tseq = 30 min, a period in which the polarisation condenser does not discharge and the leakage current of the gerdien tube remains unchanged.
The relationship between air density and four applicable quantities, namely temperature
T, atmospheric pressure
p, relative air humidity
h, and content of CO
2, can be determined using the experimentally verified equation of state [
80] published by the Sèvres-based International Bureau of Weights and Measures. In our case, the equation was employed (for common values of the quantities) to draw the chart in
Figure 16. Further, the bulk concentration of radon in the cave is influenced by ventilation depending on the chimney effect. The air movement then occurs due to air density differences [
69]. The equation of the state for the point of usual properties of air in the discussed spaces (temperature 8.1 °C; absolute pressure 980 hPa; and relative humidity
h = 100%) yields the air density sensitivity to the atmospheric pressure Δ
ρ/Δ
p = 1.25 × 10
−3 kg·m
−3·hPa
−1 and temperature Δ
ρ/Δ
T = −4.65 × 10
−3 kg·m
−3·K
−1, showing that the temperature is a dominant effect because its value inside may differ from that outside by as much as 20 °C. The static pressure variation between the upper and the lower entrances equals
pu = 1.25 hPa, and between the estavelle and the lower entrance it corresponds to
pd = 0.75 hPa; thus, the impact of pressure difference compensation can be ignored temporarily, for the next measurement cycle. In our experiments, variations in the temperature
T are significantly faster than those of the pressure
p. The light negative ion concentrations acquired during the measurement week are presented in
Figure 17.
Organisationally, each instalment of the healing program comprises a group of 30 children in two clusters, one resting or sleeping in the relaxation room and one exercising physically (playing) in Nagel’s Dome [
32,
53,
56]; halfway through the allocated time, the clusters swap their tasks. The patients usually arrive at 13:00 and leave three hours later. Before the long-term measurement scheme began on Saturday 17 October 2015, the temperature
T had been stable both inside and outside the cave for several days, and the concentration of light negative ions approached
n- = 10,000 ions/cm
3. The night from the Saturday to the Sunday brought cold weather, with the outside temperature dropping to 0 °C. On Sunday 18 October 2015, intensive ventilation of the spaces caused the ion concentration rate to fall to
n- = 6600–7000 ions/cm
3. The ion aggregation pattern changes clearly reflected the actual presence of patients on Monday 19 October 2015, Tuesday 20 October 2015, and Thursday 22 October 2015. On the Monday, the ion density decreased by about Δ
ρ = 800 ions/cm
3 during the three-hour stay of the children; the air in Nagel’s Dome then regenerated to the original state within 2 to 3 h.
At the end of the stay (16:00), the difference between the outside and the inside temperatures equalled ΔT = −1.2 °C. On the Tuesday, the number of light negative ions declined by Δρ = 520 ions/cm3 after the three-hour therapy; however, the original rate was not restored until the following day, 21 October 2015. The temperature difference amounted to ΔT = −2.4 °C when the patients left at 16:00 (the cave was already being suitably ventilated). On Thursday 22 October 2015, the concentration dropped by Δρ = 840 ions/cm3 in the course of the three hours, and the air recovered in another 3.5 h; the temperature difference corresponded to ΔT = 0.6 °C at the end of the patients’ stay.
The measured and evaluated data exhibit correlations between the negative ion concentration parameters and the recovery, flow mode, and quality of exchange of the air in the cave. According to Faimon [
68,
69], more intensive air flow is generated at higher temperature differences, namely when Δ
T ≥ 2 °C.
The effect of child patients on the concentration of light air ions is related to the number of condensation nuclei in Nagel’s Dome. During the time the children play ball games or do other exercises, they raise tiny dust particles from the ground (as confirmed through measuring the number of aerosol particles before and after the activities,
Figure 18); light air ions then adhere to this dust, and their concentration becomes reduced (this process is in agreement with the theory of the formation and disappearance of air ions as described in sources [
36,
39]). By extension, the mobility of the ions is also affected. Interestingly, we conducted a two-day measurement session utilizing a P611 particle counter, a device that exploits the light scattering principle. The measurement was to confirm the hypothesised time a fine aerosol particle requires to settle. The P611 was mounted on a camera tripod at a sufficient distance from the operator; this configuration enabled us to protect the results from being affected by the presence of the operator. Overall, the proposed methodology consists in five measurements, each lasting one minute; the lowest and the highest values are eliminated from the results, and the arithmetic mean is calculated from the remaining three values. The results are shown in
Figure 18.
The bar graph shows that very fine aerosol particles—or, more concretely, ones sized 0.3 μm and less—require over a day to settle. Regarding the correlation between the size and the time, we can claim that the larger the aerodynamic radius of an aerosol particle, the shorter the settling period [
81,
82]. A more detailed, two-hour measurement procedure immediately following the physical exercises revealed intensive settling of particles with the radii of 5 μm and 10 μm (
Figure 19, left-hand image); particles having the radii of 1 μm and 2.5 μm constantly floated through the air (
Figure 19, right-hand image).
At the next stage, for comparison, we conducted a measurement cycle after the performance tests, during which the patients are usually not organised into two separate groups but all play games together in Nagel’s Dome; in this case, the programme involved 30 children (
Figure 20). The monitoring showed that the number of particles detected upon the end of the exercises was twice that found in the scenario with two independent groups.
Based on the programme presented in
Figure 14, we calculated the air ion mobility. The measuring sequence of ion meter No. 1 periodically sensed the concentration of air ions and assessed the electric conductance of air. Subsequently, the saturation characteristics were approximated to allow calculating the the air ion mobility.
The patterns in
Figure 21 indicate different regeneration periods to restore the concentration and balanced mobility of the air ions: While the usual mobility value of
k = 2 cm
2 V
−1 s
−1 is reached almost directly after the children have left Nagel’s Dome, the original concentration levels need a longer time to recover, depending on the external weather conditions (as already outlined above).
A follow-up, control measurement procedure took place between 10 and 14 November 2015 to characterise the environment of an empty Nagel’s Dome (
Figure 22). During intensive ventilation, from the night of 12 November 2015 till through the morning of 13 November 2015, the cave exhibited a lower concentration and a moderately reduced air ion mobility; the latter effect (
Figure 23) had been caused by stirred-up dust particles. Interestingly, the ions appear to be slightly less mobile in wintertime than in summer, see
Figure 23.
A further assessment was executed by using sequence No. 2, including the measurement of positive air ions. This step then enabled us to determine the time variation of the unipolarity coefficient
P. The measurement was performed between 19 and 24 November 2015, with the cave being ventilated intensively due to low outside temperatures from the morning of 20 November till that of 22 November. Such a condition produced a substantial decrease in the quantity of light negative ions, which fell sharply from 10,000 ions/cm
3 to the minimum value of 4000 ions/cm
3 (
Figure 24). Importantly, in the Dome, the concentration of the ions does not drop below the indicated boundary value even in the most severe frost. Regarding the mobility of light negative ions, no major trend was observed. The temperature declined slowly at the initial stages of the measurement, and the dust particles in the Dome were not stirred up. A slight decrease in the mobility (
Figure 25) occurred only with the rather rapid temperature change between the midday of 22 November and the morning of 23 November 2015.
A more interesting factor consists in the correlations relevant to the unipolarity coefficient P (
Figure 26). As revealed by the measuring cycles, at higher concentrations of light negative ions the coefficient value approaches
P = 1, beneficially for speleotherapy purposes; more intensive ventilation and low outer temperatures, however, cause the value to rise up to the common level of
P = 1.15. Such an effect then points to the essential influence of the limestone walls and the microclimate, both unique among karst caves, on the entire set of processes.
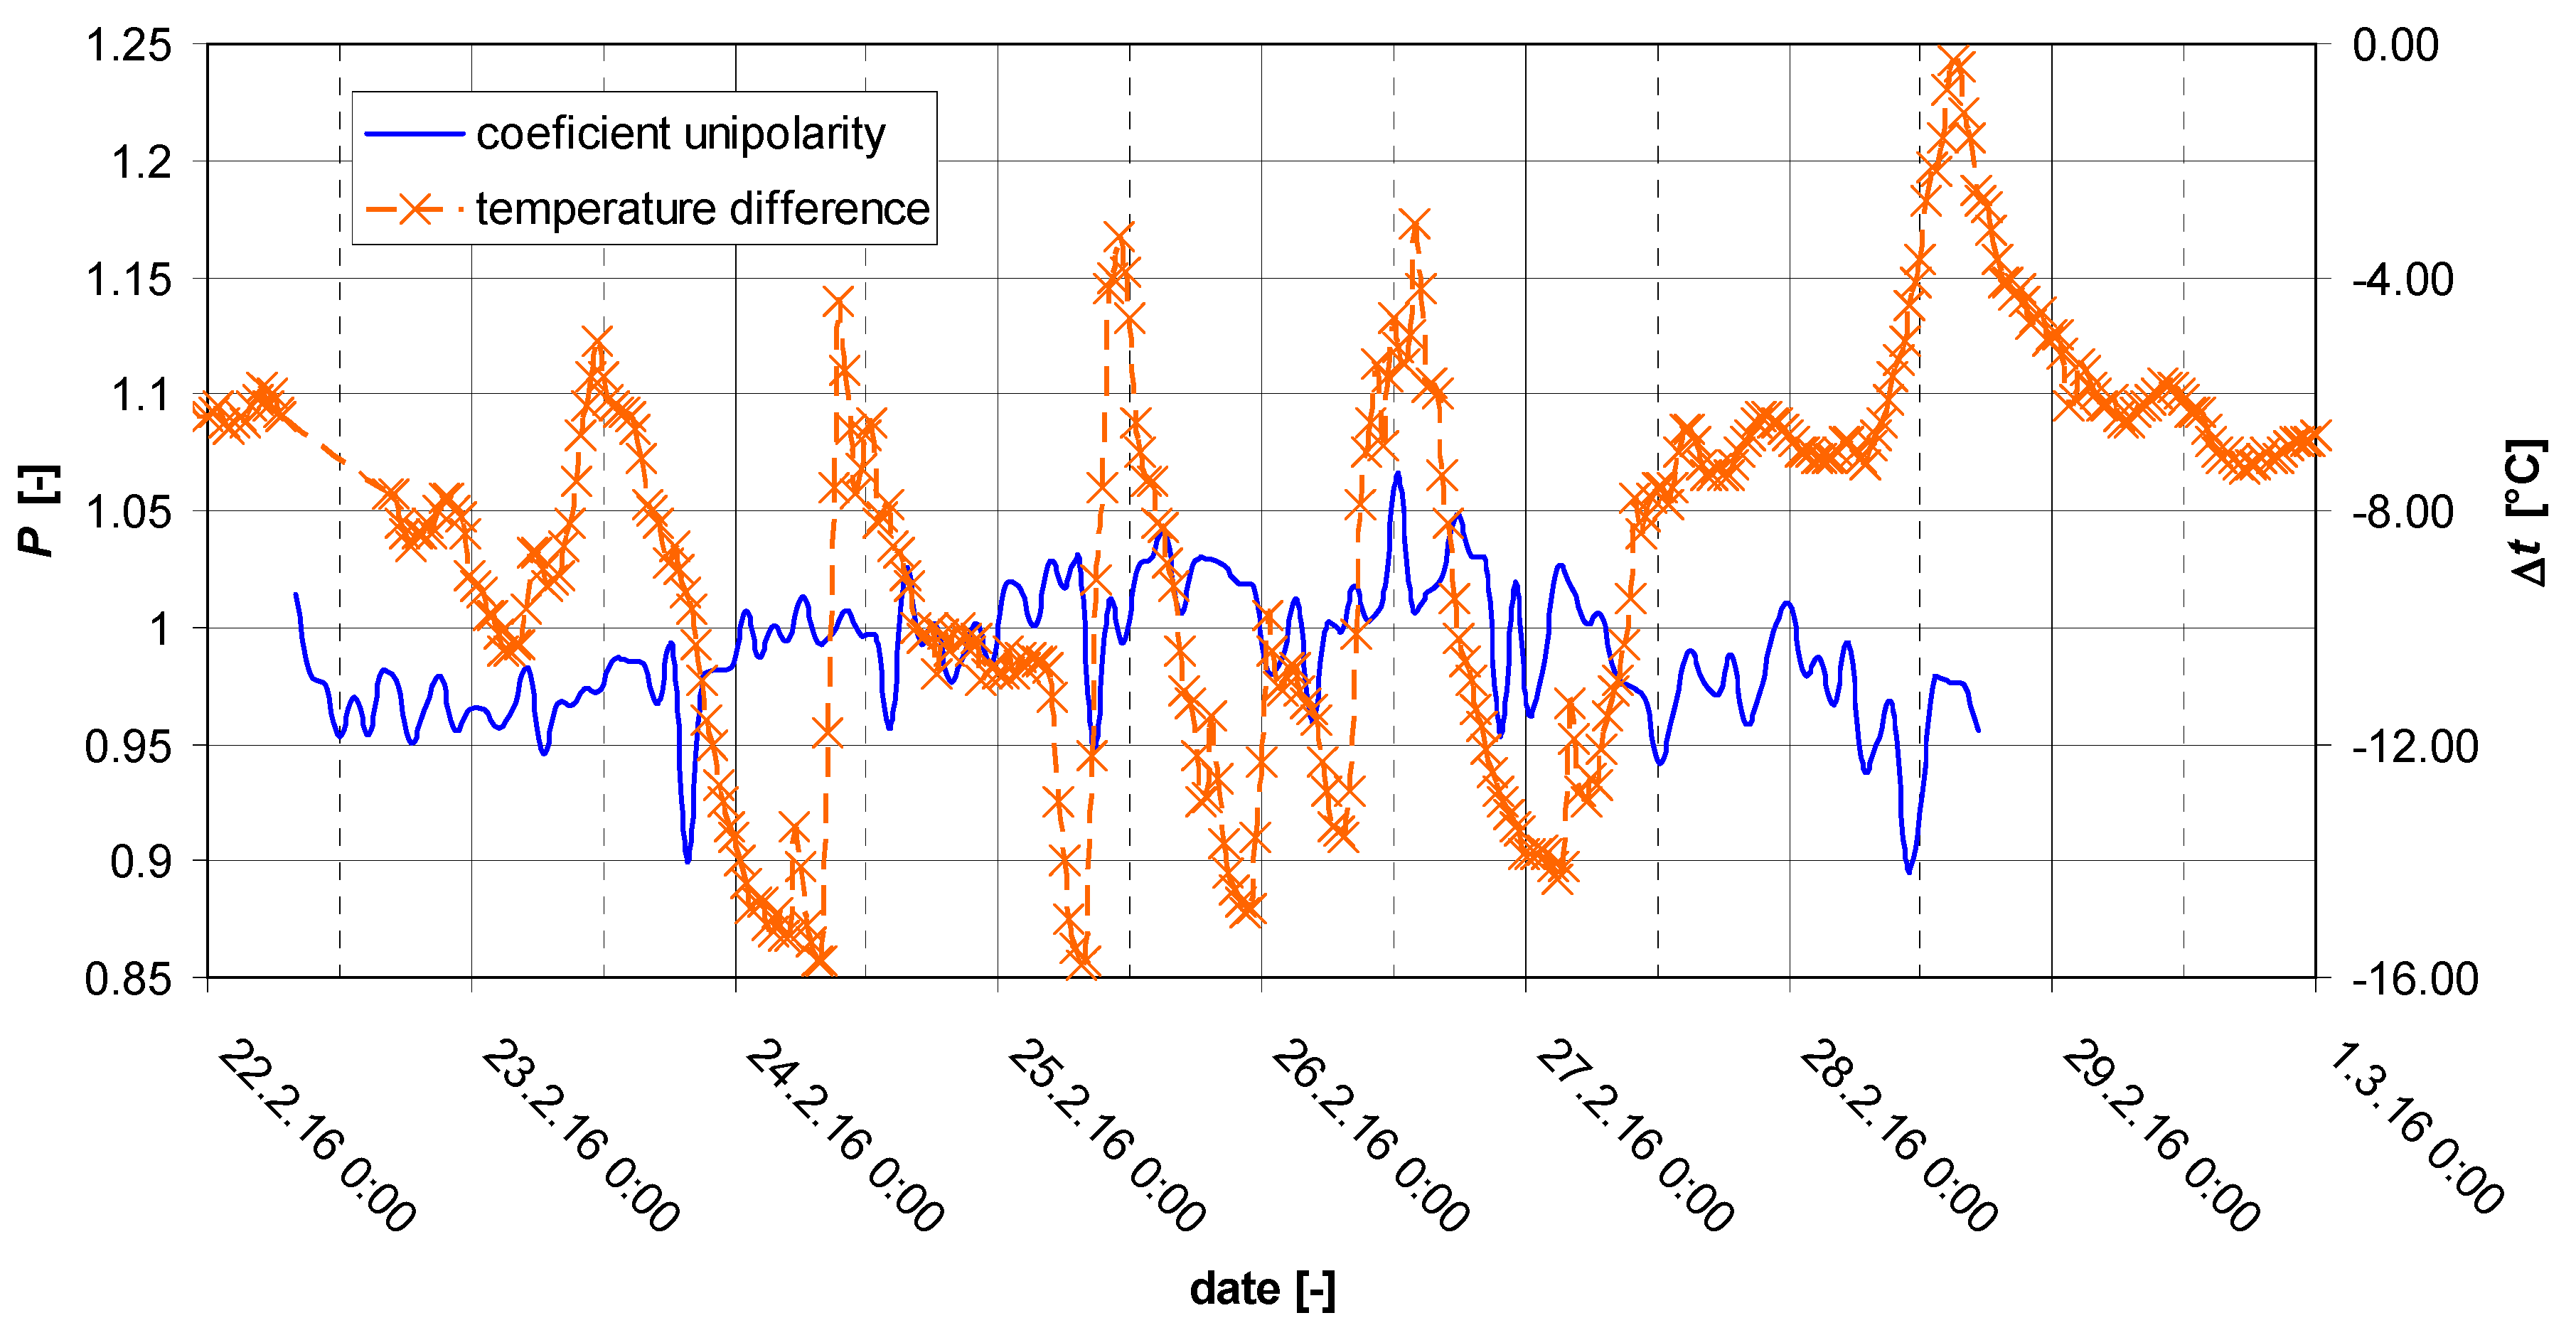
The January to February 2016 measuring cycles were executed with the upper gate window closed and the bottom one open. This configuration had a positive impact on the unipolarity coefficient, which maintained a low value (
P = 0.95 to
P = 1); moreover, in more severe frosts, the concentrations of light negative ions were higher. The mobility of air ions
k, however, did not reach the levels established during the summer to autumn measurements. Relevant details are visualised in
Figure 27,
Figure 28 and
Figure 29.
10. Conclusions
This article documents specialised measurement cycles (involving a novel methodology and measuring methods improved with respect to the previous ones) conducted repeatedly in Císařská Cave, a major Moravian Karst formation dedicated to respiratory therapy. In the procedural context, the central activities outlined herein involve sensing and evaluating the concentrations and states of air ions, namely factors determined by essential preconditions such as the overall humidity, outer temperature, air flow, and presence of patients inside. This unique programme was carried out with a Gerdien tube-based device designed to perform long-term, comprehensive measurements in difficult climates and conditions, prominently including high, almost 100% humidity; we operated the meter in both the earthed and the unearthed modes. The capabilities of the apparatus are not fully matched by standard experimental or commercial meters, which, especially due to their tendency to absorb moisture, mostly offer only considerably less flexible measurement timing and shorter duration and do not allow adjusting the ion spectra. The value of the unipolarity coefficient
P in the heavy ventilation periods turned out to be higher than that detected during the no ventilation intervals. Surprisingly, the performed cycles revealed highly mobile negative ions with
k = (9.0 ÷ 14) cm
2·V
−1·s
−1; these are probably generated through fragmenting droplets of very clean water (the Lenard effect). Such an effect agrees with the outcomes of earlier reports that examined the properties of ions formed due to dispersed distilled water [
42]. In this sense, a certain connection with the ventilation and relative humidity of air in the cave is apparent, meaning that not all of the air ions originate via the action of
222Rn; such an assumption (related to caves) has not been formulated elsewhere in the literature to date.
In general terms, the obtained results expose comprehensive changes in the concentration of light air ions, their mobility, and unipolarity coefficient P during both the temporary presence of the children and an entire season of the year. By extension, light negative air ions and high relative humidity are identified as factors of fundamental importance for the overall quality of underground respiratory therapy spaces. The data may constitute a guide to determine the maximum speleotherapeutic capacity of Císařská Cave: For instance, the monitoring of the particles showed that the time the spaces need to regenerate is approximately one day, assuming the usual amount of patients. No comparative sensing of light air ions, aerosols, and their mutual relationships in this type of cave has been performed thus far.
Regarding the actual impact and benefits, the entire sensing programme demonstrated that, in speleotherapy, light negative ions and high relative humidity indeed influence decisively the suitability of a cave. These two factors are strongly interrelated and improve the medical value of the spaces. In view of the criteria, and according to the above measurements, Císařská Cave has proved to be an outstanding location.
The outcome of the repeated sensing cycles and evaluations embodies a functional complement to the corpus of earlier published findings concerning the environment in individual sectors of Císařská Cave. In the given context, the investigation presented within this article continues the previous attempts to consider the main problem thoroughly, assuming, as proposed above, the impact of determinants such as the cave walls or air flow and temperature on the actual concentration of ions, humidity, and restoration of a stable inner environment. The follow-up research phases are planned to analyse other parameters involved in evaluating the concentration and status of light air ions as related to radon, dust, and external weather conditions.


 ,
, 


