Article

Plant Organic Matter in Palsa and Khasyrei Type Mires: Direct Observations in West Siberian Sub-Arctic

by
Natalia P. Kosykh
1,
Nina P. Mironycheva-Tokareva
1,
Evgeniya K. Vishnyakova
1,
Natalia G. Koronatova
1,
Vera A. Stepanova
1,
Larisa G. Kolesnychenko
2,
Aldynai O. Khovalyg
3 and
Anna M. Peregon
1,3,*
1
Institute of Soil Science and Agrochemistry, Siberian Branch of the Russian Academy of Sciences (ISSA SB RAS), Pr. Akademika Lavrentyeva, 8/2, 630090 Novosibirsk, Russia
2
Research Institute of Biology and Biophysics, Tomsk State University, 36/13 Lenina Pr., 634050 Tomsk, Russia
3
Research Organization Department, Tuvan State University, Lenina St., 36, 667000 Kyzyl, Russia
*
Author to whom correspondence should be addressed.
Atmosphere 2021, 12(12), 1612; https://doi.org/10.3390/atmos12121612
Submission received: 30 September 2021 / Revised: 27 November 2021 / Accepted: 29 November 2021 / Published: 2 December 2021
(This article belongs to the Special Issue Permafrost Peatlands under Rapid Climate Warming)

Abstract

:
This article presents the first results of long-term direct measurements of a few major components of carbon cycle in permafrost mire landforms in the sub-Arctic region of Western Siberia, Russia. It reveals the main features of geographical distribution of plant organic matter, including both the above-ground and below-ground fractions of live biomass, the biomass of dead roots (mortmass), and net primary production (NPP) in peat-accumulating flat palsa mires and in “khasyrei”—ecosystems of drained lakes in thermokarst depression on epigenetic permafrost. The study based on original methods of direct field measurements elaborated by authors for northern peatlands. In northern taiga, the NPP of palsa mires was found in the range of 300–580 g m−2 yr−1 and an average biomass of 1800 g m−2; in khasyrei, it accounts for 1100 g m−2 yr−1 and 2000 g m−2 of NPP and live biomass, respectively. In forest tundra, the live biomass of palsa mires was found in the range of 1000–1800 g m−2, and in khasyrei it was 2300 g m−2. The NPP of palsa mires were in the range of 400–560 g m−2 yr−1, and in khasyrei it was 800 g m−2 yr−1. Overall, we conclude that the south–north climatic gradient in Western Siberia is the main driver of plant organic matter accumulation. It was found different across mire ecosystems of the same types but located in different bioclimatic regions.

1. Introduction

The Northern peat accumulating wetlands (i.e., peatlands) were estimated to cover the area of ~3% of land surface, but they are often considered as huge reservoirs (up to 562 Gt) of soil organic carbon [1,2,3]. Almost half of this carbon attributed to peatlands in Russia [4]. Since the Last Glacial Maximum, about 51.7–70.2 Gt of carbon has been accumulated in West Siberian peatlands [5,6,7,8], then it accounts for about 36% of the total pool of soil carbon in Russia [9,10,11].
The zone of flat palsa mires (here, we use the term “palsa” as it is conventional in Russian literature) in Western Siberia coincides with wide spread of permafrost. It is located to the north of Siberian Uvaly and its area accounts for 30% of the entire West Siberian region [12]. Some researchers consider the mires on the southern border of northern boreal (taiga) region as specific type of “high palsa” mires [13,14]. The term “palsa” comes from Lapland, where it was used by Sami and northern Finns to refer to “hummock” rising out of a bog with a core of ice [15]. In Fennoscandia, this term is used commonly for all main types, ridges, mounds, and plateau palsas, whereas in North America the more common terms are either “peat or permafrost plateau” or “wooded palsa” depending on the shape and vegetation cover of the feature [16]. In this study, we adopt the conception of using the term “palsa” for the frozen hummocks (or elevated micro-landscapes) and the conception of use the term “hollow” for collapse scar and pools (or landscapes in micro-depressions).
In the forest tundra with continuous permafrost, the peat-accumulating wetlands (or peatlands) occupy 3.8 million hectares; whereas, in the northern taiga with discontinuous permafrost, it accounts for 17.8 million hectares. Overall, the areal extent of peatlands was found in the range of 27–31% of land surface [17].
Both climate change and change in water balance were found to affect productivity of grasslands [18,19]. The permafrost also affects productivity of northern ecosystems [20,21,22,23,24,25,26]. It was found in the range of different ecosystems, such as in frozen hummocks/palsa, hollow, and khasyrei (the last refers to ecosystems of drained lakes formed after thermokarst depression on epigenetic permafrost), and the main features of plant biomass are driven by main properties of underlying soils as well as the species composition of plant community, which in turn are largely constrained by meso-topography and micro-topography [27,28,29,30,31].
Further work is required to provide quantitative assessment of carbon cycle in the northern peatlands of Western Siberia in order to provide robust input data for ecosystem modeling under different scenarios of climate change. Consequently, it becomes important to assess ongoing changes in the plant organic matter, also related to land cover changes in different geographical locations of Siberian sub-Arctic. To date, there are relatively few assessments based on direct measurements of the plant biomass and net primary production (NPP) available in published sources [23,24,32,33].
In this study, we test the hypothesis that (i) the climate affects the same types of mire ecosystems in different geographical locations along south-north transect in Western Siberia and (ii) a decrease in temperature results in a decrease in net primary production (NPP) of plant communities in the north.

2. Materials and Methods

2.1. Location of Field Sites

The test sites of direct field measurements of plant organic matter are located in the area of widespread palsa mires: one in the north of this zone (Pangody) and one in the south (Noyabrsk). “Pangody” is located in the zone of continuous permafrost in the forest-tundra. “Noyabrsk” is located near Sibirskye Uvaly, in the northern taiga region with discontinuous permafrost; it belongs to the Ob-Taz region of frozen peat bogs/mires [34], where the different types of wetlands cover about 50% of land area. Large wetland areas in the region are contributed by ridge-hollow-lake patterned bogs with frozen peat layers. Large massifs of flat-palsa mires are widespread next to small rivers and local in-wetland streams. The water level in the center of wetlands could stay at the upper 5–10 m, but at the periphery of wetlands it could stay at 2–3 m. Close location of large wetlands all around the area keeps the water level at a permanent high level. The permafrost and cryogenic processes affect quaint developments of the local meso-topography, micro-topography, and nano-topography, and it makes a compound mosaic of soil cover [35,36]. The frozen mounds reach 4–6 m at some locations, but normally its height is about 1–2 m. Elevated micro-landscapes are flat-topped hummocks/palsa and ridges (1 to 2 m high), in complex with wetland micro-depressions and often with lakes. All these landforms create a system of flat-palsa mire.
At the current state of developments, the growth of peat deposits (and peat sequestration) is largely constrained by micro-topography, which includes both the natural features and designed by thermokarst. The presence of excessive moisture in hollows and in “khasyrei” is favorable for peat accumulation. In the automorphic position, the process of peat accumulation is limited by a shallow depth of thaw horizon and drying of upper peat layers in the summer season when the permafrost is close to land surface and creates unfavorable conditions for root systems. Barren (oligotrophic) peat soils are formed on frozen permafrost peatlands.

2.2. The Climate at Field Sites

Over the study area, the climate is continental. The average annual air temperature in the northern taiga is −3.5 °C, and in the forest-tundra it is −5.8 °C. Annual precipitation is 580 mm in the Noyabrsk region; it decreases to 430 mm in the forest tundra (Nadym weather station), with the main pool of precipitation in the warm season (from April to October). The winter is cold, with the mean daily air temperature ranging from −20 °C to −26 °C. The summer is relatively warm, but the air temperature in June is in a range +4 °C to +20 °C. The first half of summer is dry, but the second is excessively wet. The autumn is cold, with very unstable temperatures in September (notably from −5 °C to +10 °C). The air temperature becomes negative in October in the northern taiga region (Noyabrsk), but it occurs already in September in the forest tundra (Pangody) [37].

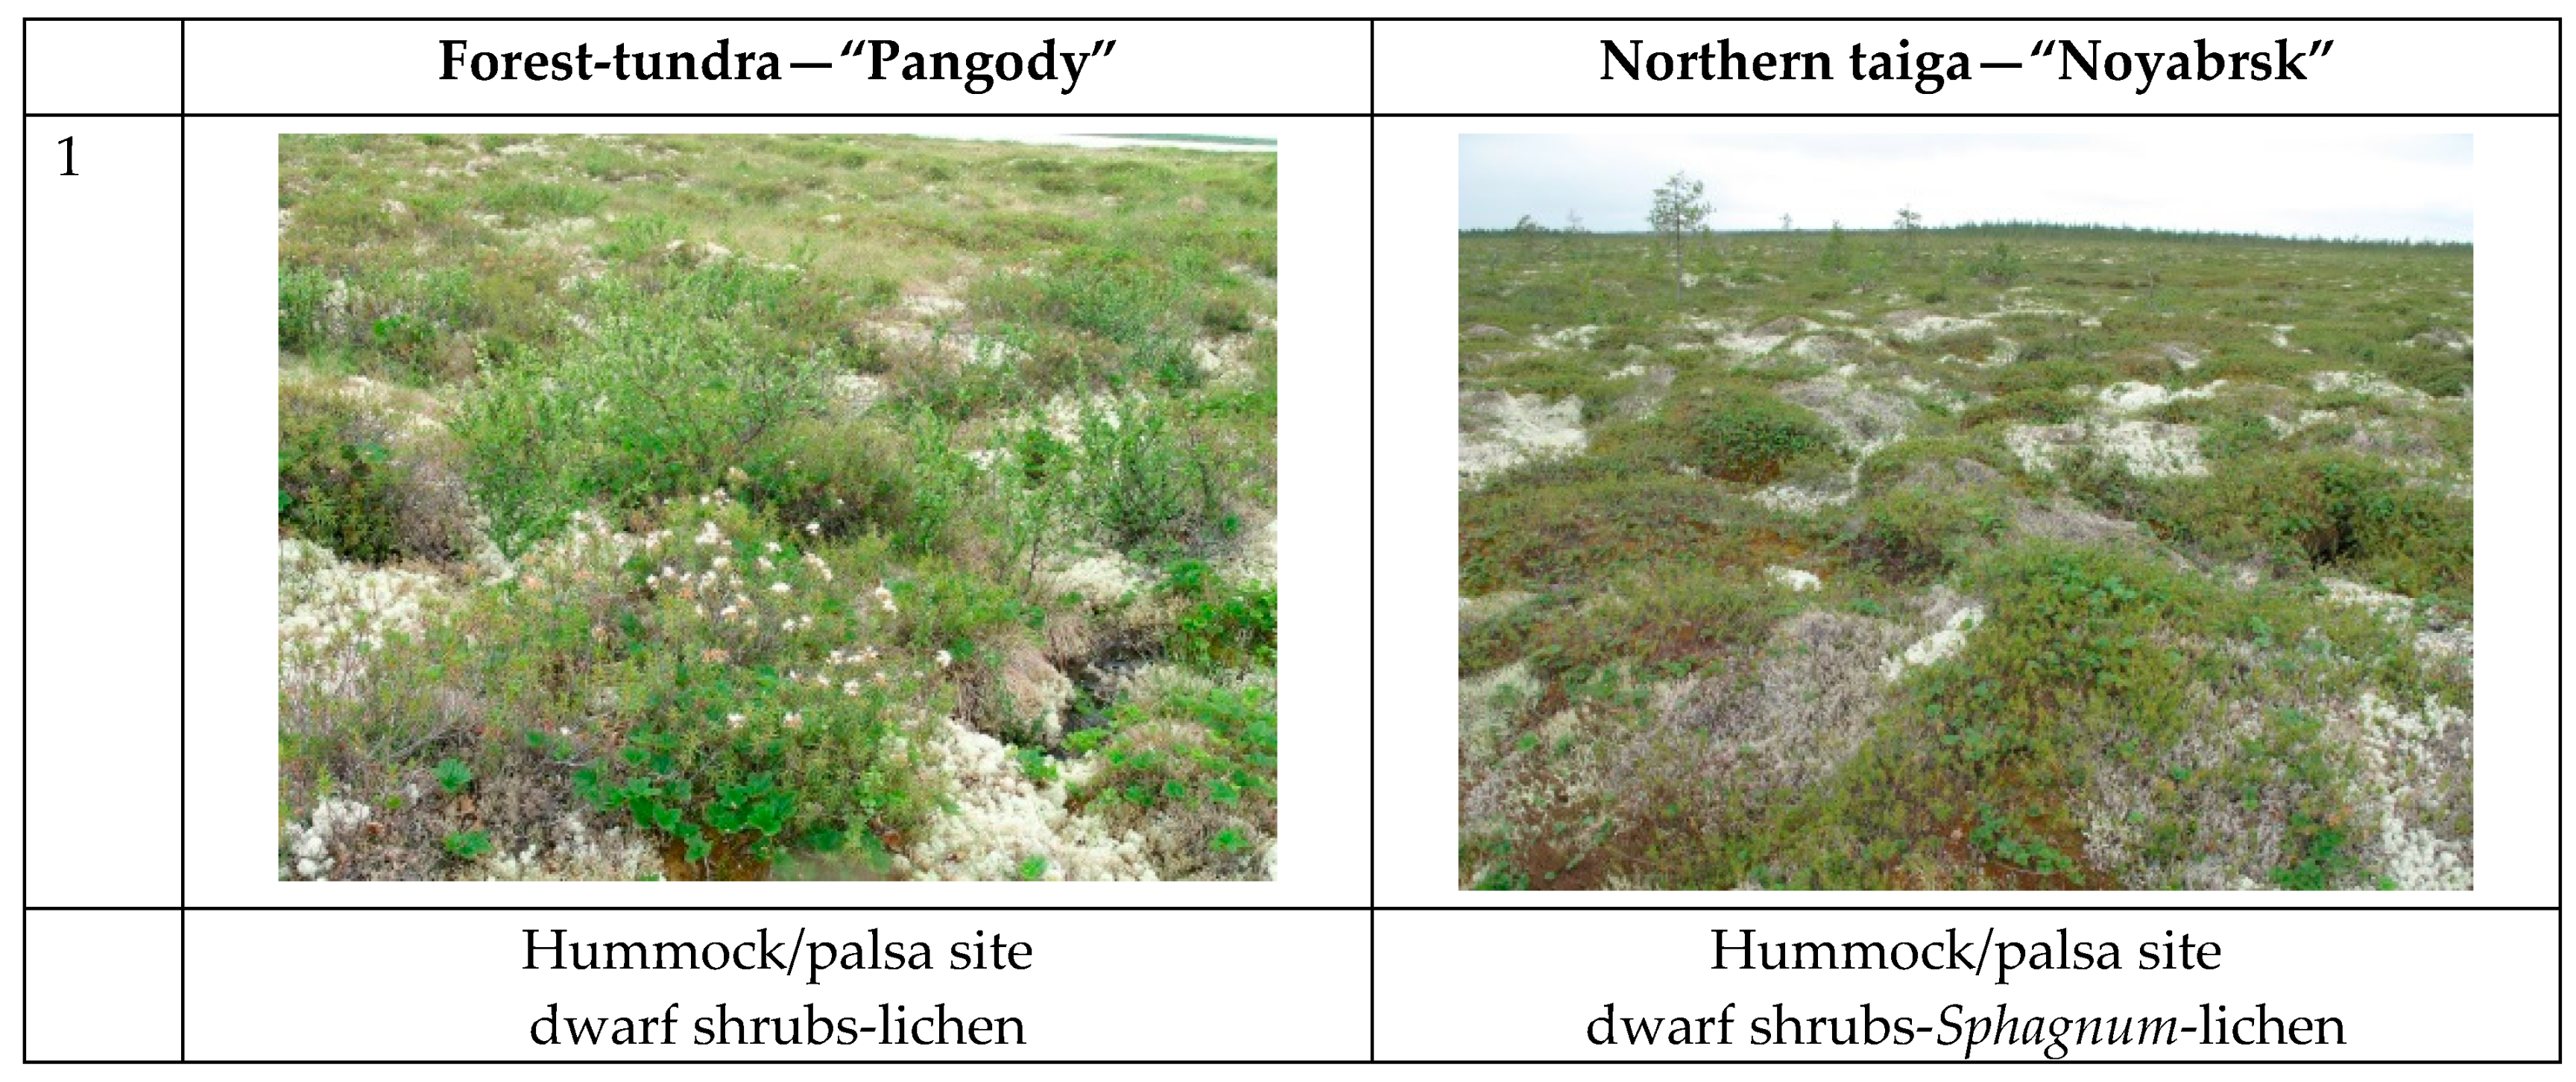
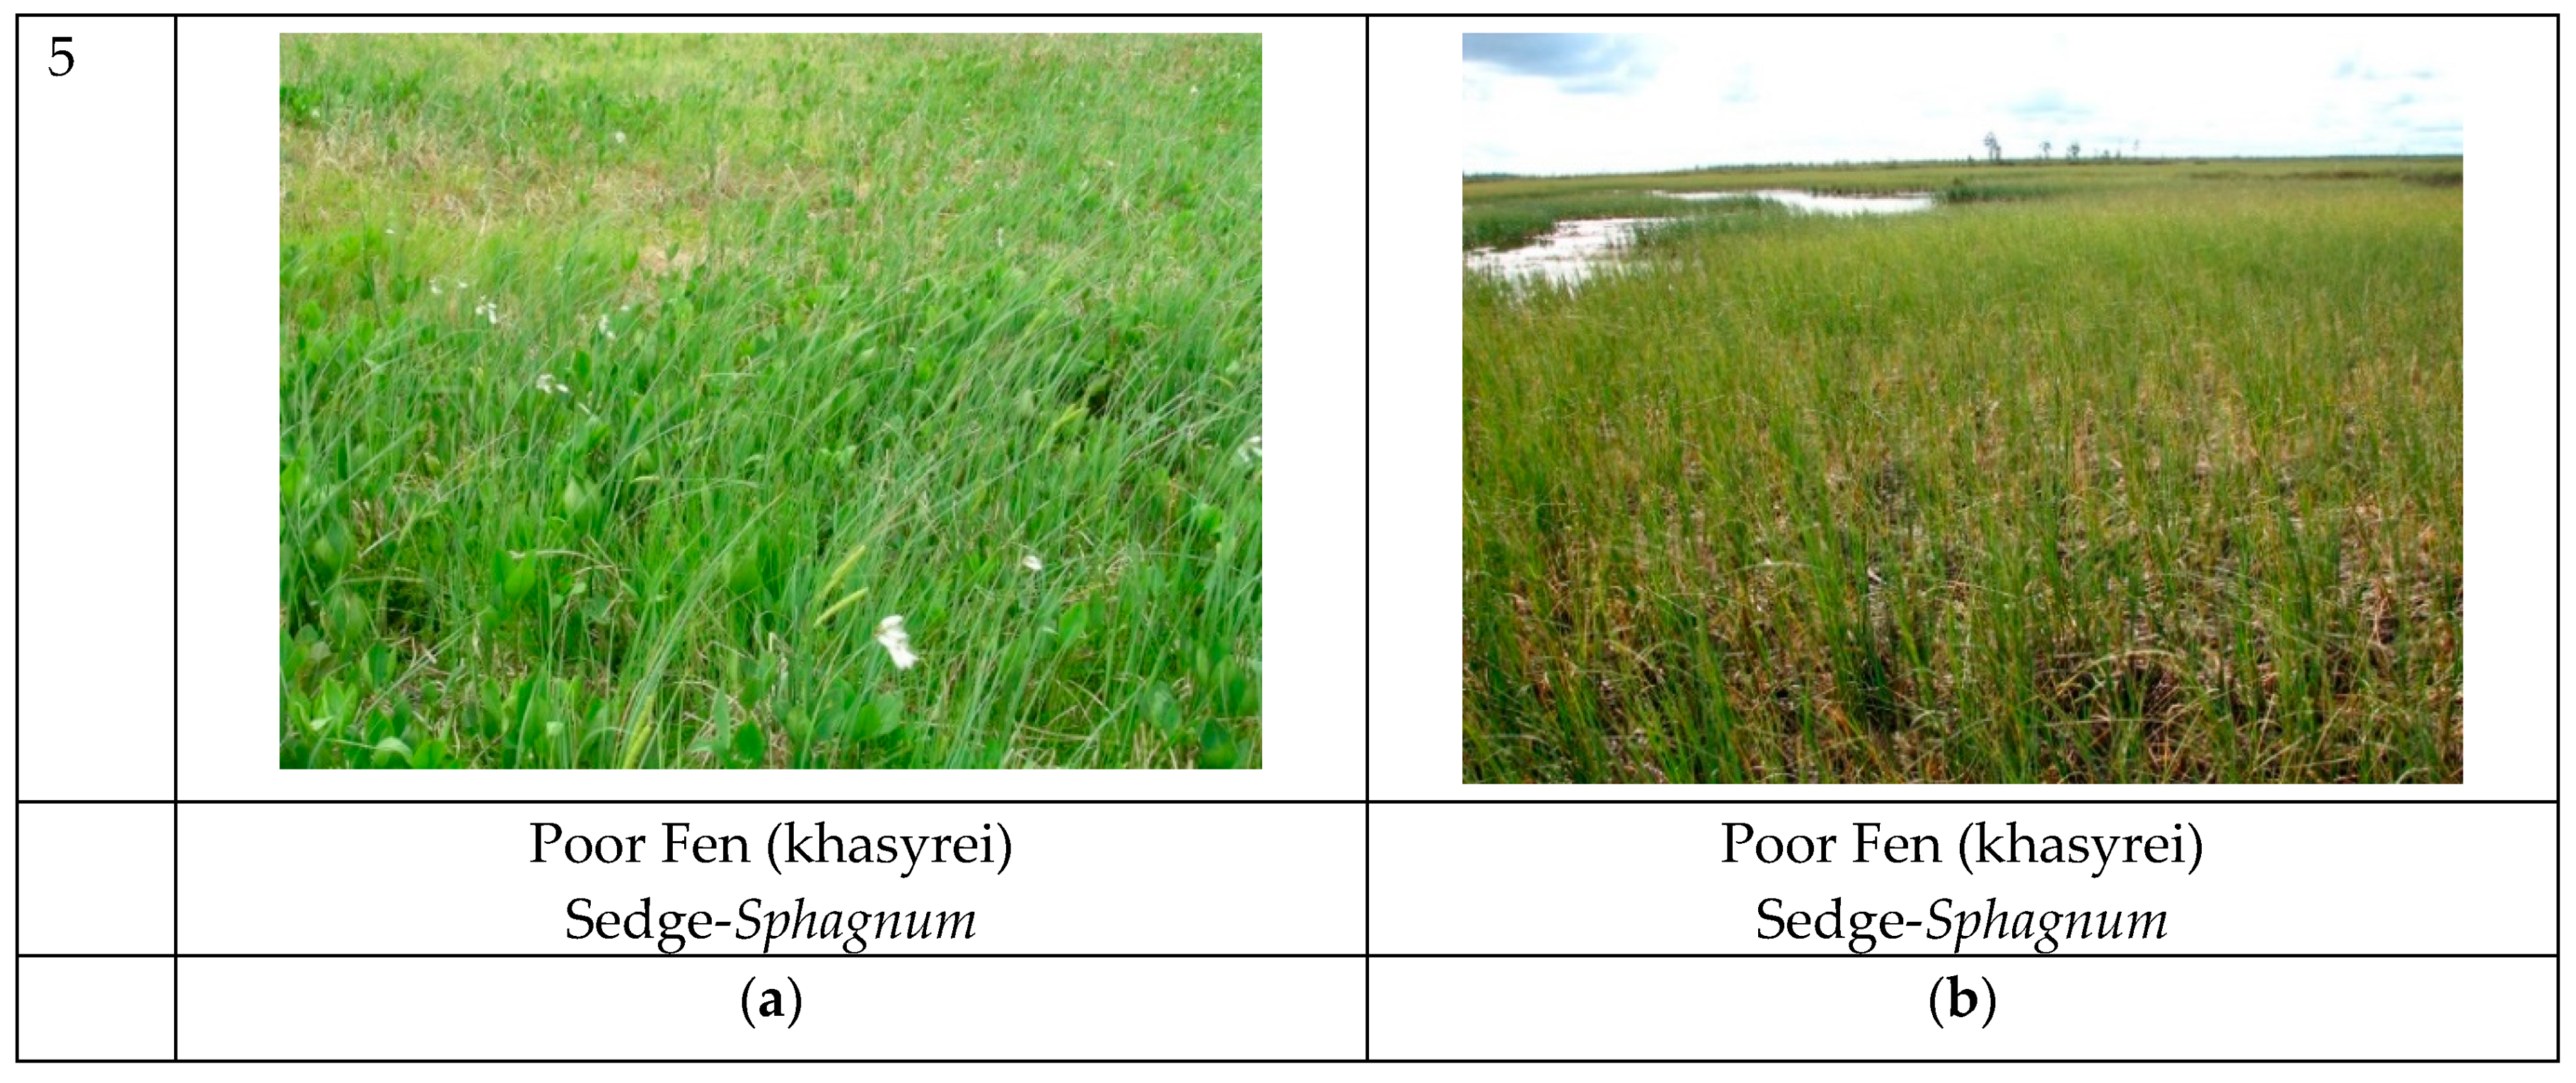
2.3. Land Cover/Plant Communities at Test Sites

The dynamics of land cover at test sites were studied since 1997 in “Noyabrsk” and since 2004 in “Pangody.” The samples of plant organic materials were taken in August during the period of maximum harvest. This article provides the average data for the long observation periods at both test sites (Table 1).
Direct field measurements of plant organic matter, wetland biomass, and net primary production (NPP) were carried out in different micro-landscapes (hummocks/palsa and hollows) at flat palsa mires and both are widespread in the northern regions of Western Siberia in khasyrei ecosystems.
The flat palsa mires have compound topography, with a large number of micro-depressions. The height of elevated elements (frozen hummocks/palsa) is 10–15 cm. The depth of seasonal thawing on palsa is 50–60 cm in Noyabrsk (southern test site) and 40–45 cm in Pangody (northern test site) (Figure 1). Dwarf shrubs-lichen and dwarf shrubs-moss-lichen vegetation communities are presented on palsa sites; dwarf shrubs-sedge and cotton grass-Sphagnum vegetation communities are presented in hollows (Table 2). There could be a well-developed layer of cedar trees (Pinus sibirica Du Tour) and pine trees (Pinus sylvestris L.) up to 2–2.5 m of height in Noyabrsk (northern taiga), while the only single larch trees (Larix sibirica Ledeb.) could be found in Pangody (forest tundra).
The dominant shrub species is Ledum decumbens (land cover about 40%), with a number of co-dominants: Betula nana L. and Vaccinium vitis-idaea L. and Vaccinium uliginosum L. The total projective cover (TPC) of dwarf shrubs is 60%, but it decreases to 40% in the north. The other dominant species are as follows: Andromeda polifolia, Empetrum nigrum L., and also Rubus chamaemorus L. (1–5% of the TPC, each species).
The lichens dominate on-surface: they contribute up to 95% of TPC in the north and 60–70% of TPC in the south; the rest of the lichens are contributed by Sphagnum mosses. The main species are as follows: Cladonia stellaris and C. stygia (Fr.) Ruoss. Some less abundant species are as follows: Flavocetraria nivalis (L.) Kärnefelt et A. Thell, Flavocetraria cucullata (Bellardi) Kärnefelt et A. Thell, Cetraria islandica (L.) Ach., Cladonia rangiferina (L.) F.H. Wigg., C. amaurocrea (Flörke) Schaer., Alectoria ohroleuca (Hoffm) A. Massal. The mosses are: Sphagnum fuscum, S. capillifolium (Ehrh.) Hedw. at both test sites, and S. lenense H.Lindb.ex Savicz in the north.
The soils in the forest tundra and in the northern taiga develop under the constraints of low temperatures and high humidity, with pressure of permafrost that prevented penetration of water into deep soil horizons, resulting in permanent oversaturation that acts to prevent circulation of oxygen in deep soil horizons, providing anaerobic conditions. On hummock/palsa sites, oligotrophic permafrost peat soil is observed: Dystric Hemic Epicryic Histosols in the forest-tundra (Figure 1a(2)) and Dystric Hemic Cryic Histosols in the northern taiga (Figure 1b(2)).
At the same mire spot, along with hummocks (frosen palsa sites), we describe oligotrophic hollows with contrast type of plant communities; the hummocks/palsas and hollows replace each other within one palsa mire landform depending on the level of ground water (see Figure 1(3)). The Eriophorum and Sphagnum-dominated communities occupy the most depressed elements of micro-topography with the lowest level of ground water (about 15 cm). These kinds of communities are common at the edges of large hollows or in between hummocks/palsas. The herbaceous species are as follows: cotton grass (Eriophorum russeolum) with TPC of up to 10% and Carex rotundata. Often, the Andromeda polifolia shrubs grow next to the cotton grass. The moss cover is dominated by Sphagnum balticum. The water table rises when moving to the center of large round-shaped hollows that causes less cover of dwarf shrubs but propagation of sedges (Carex rotundata), which turn to make 5–7% of the projective land cover. In the moss layer, the change of dominants also occurs—Sphagnum lindbergii and S. balticum, Warnstorfia fluitans (Hedw.). Loeske becomes the main dominant. Sedge-Sphagnum communities can make complete cover in the central parts of large hollows, or they can border the open water bodies (small lakes) located in the central parts of the hollow [39].
Vegetation cover of “khasyrei” is the richest of species among all studied ecosystems. It is represented by Eriophorum-sedge-Sphagnum and grass-sedge-Sphagnum communities (Figure 1(5) and Figure 2). The main dominants are as follows: Carex rostrata (10%), C. lasiocarpa, Eriophorum angustifolium (5%), and E. russeolum (5%). The grasses are presented by Comarum palustre L. and Menyanthes trifoliata L., but their contribution does not exceed 3%. The shrubs are Andromeda polifolia (10%) and Betula nana. The mosses that cover up to 90% of land surface are presented by Sphagnum lindbergii (40%), S. balticum (40%), S. compactum DC. in Lam. et DC., and S. squarrosum, S. riparium.

2.4. Experimental Design

Estimation of carbon stock and different fractions of plant organic matter, including the biomass and net primary production (NPP), is implemented by direct measurements based on standard methods developed by the authors for the northern peatlands with minor modifications [24].
The soils classified is based on “Classification of soils in Russia” [40] and the IUSS Working Group WRB [41].
In all ecosystems, the structure of plant organic matter was studied by the separation of live and dead below-ground fractions at 5–7 test plots (50 × 50 cm) chosen to represent an entire range of micro-topography. At the test plots, the above-ground biomass (i.e., phytomass) was sampled at the level of the moss heads, and dead leaves of grasses and dwarf shrubs were collected. The rags were separated from the green phytomass; the last was sorted out by species and then by fractions of increments corresponding to the current year, the last year, and perennial shoots. All above-ground and below-ground phytomass were dried at 60 °C and then weighed. In order to measure the features of organic matter in moss layers, the set of cubic monoliths (10 × 10 × 10 cm) were taken to a depth of 30 cm at the same test plots.
The total net primary production (NPP) consists of above-ground NPP of grasses, dwarf shrubs, and mosses (ANP) and net primary production of below-ground organs (BNP). The ANP of grasses represents the fraction of phytomass responsible for photosynthesis (so-called green biomass). ANP of shrubs consists of increment of shoots of the current year with its foliage [42]. The NPP of Sphagnum mosses was determined by the method of “individual tags” [43]; NPP of lichens was determined by sorting out plant materials manually by changes in the morphological characteristics of stems and branches [44]. The below-ground fractions of grasses and shrubs were sorted manually by the growth of roots, rhizomes, and tillers of the current year [24].
Data analysis implemented in this study is based on a standard package of statistics in MS Excel as well as the PAST and R softwares. RStudio package was used to prepare illustrations and figures. The majority of our data did not conform to normal distribution, with the exception of logarithmic transformation; we then applied nonparametric tests by using Kruskal–Wallis and Mann–Whitney for data analysis.

3. Results

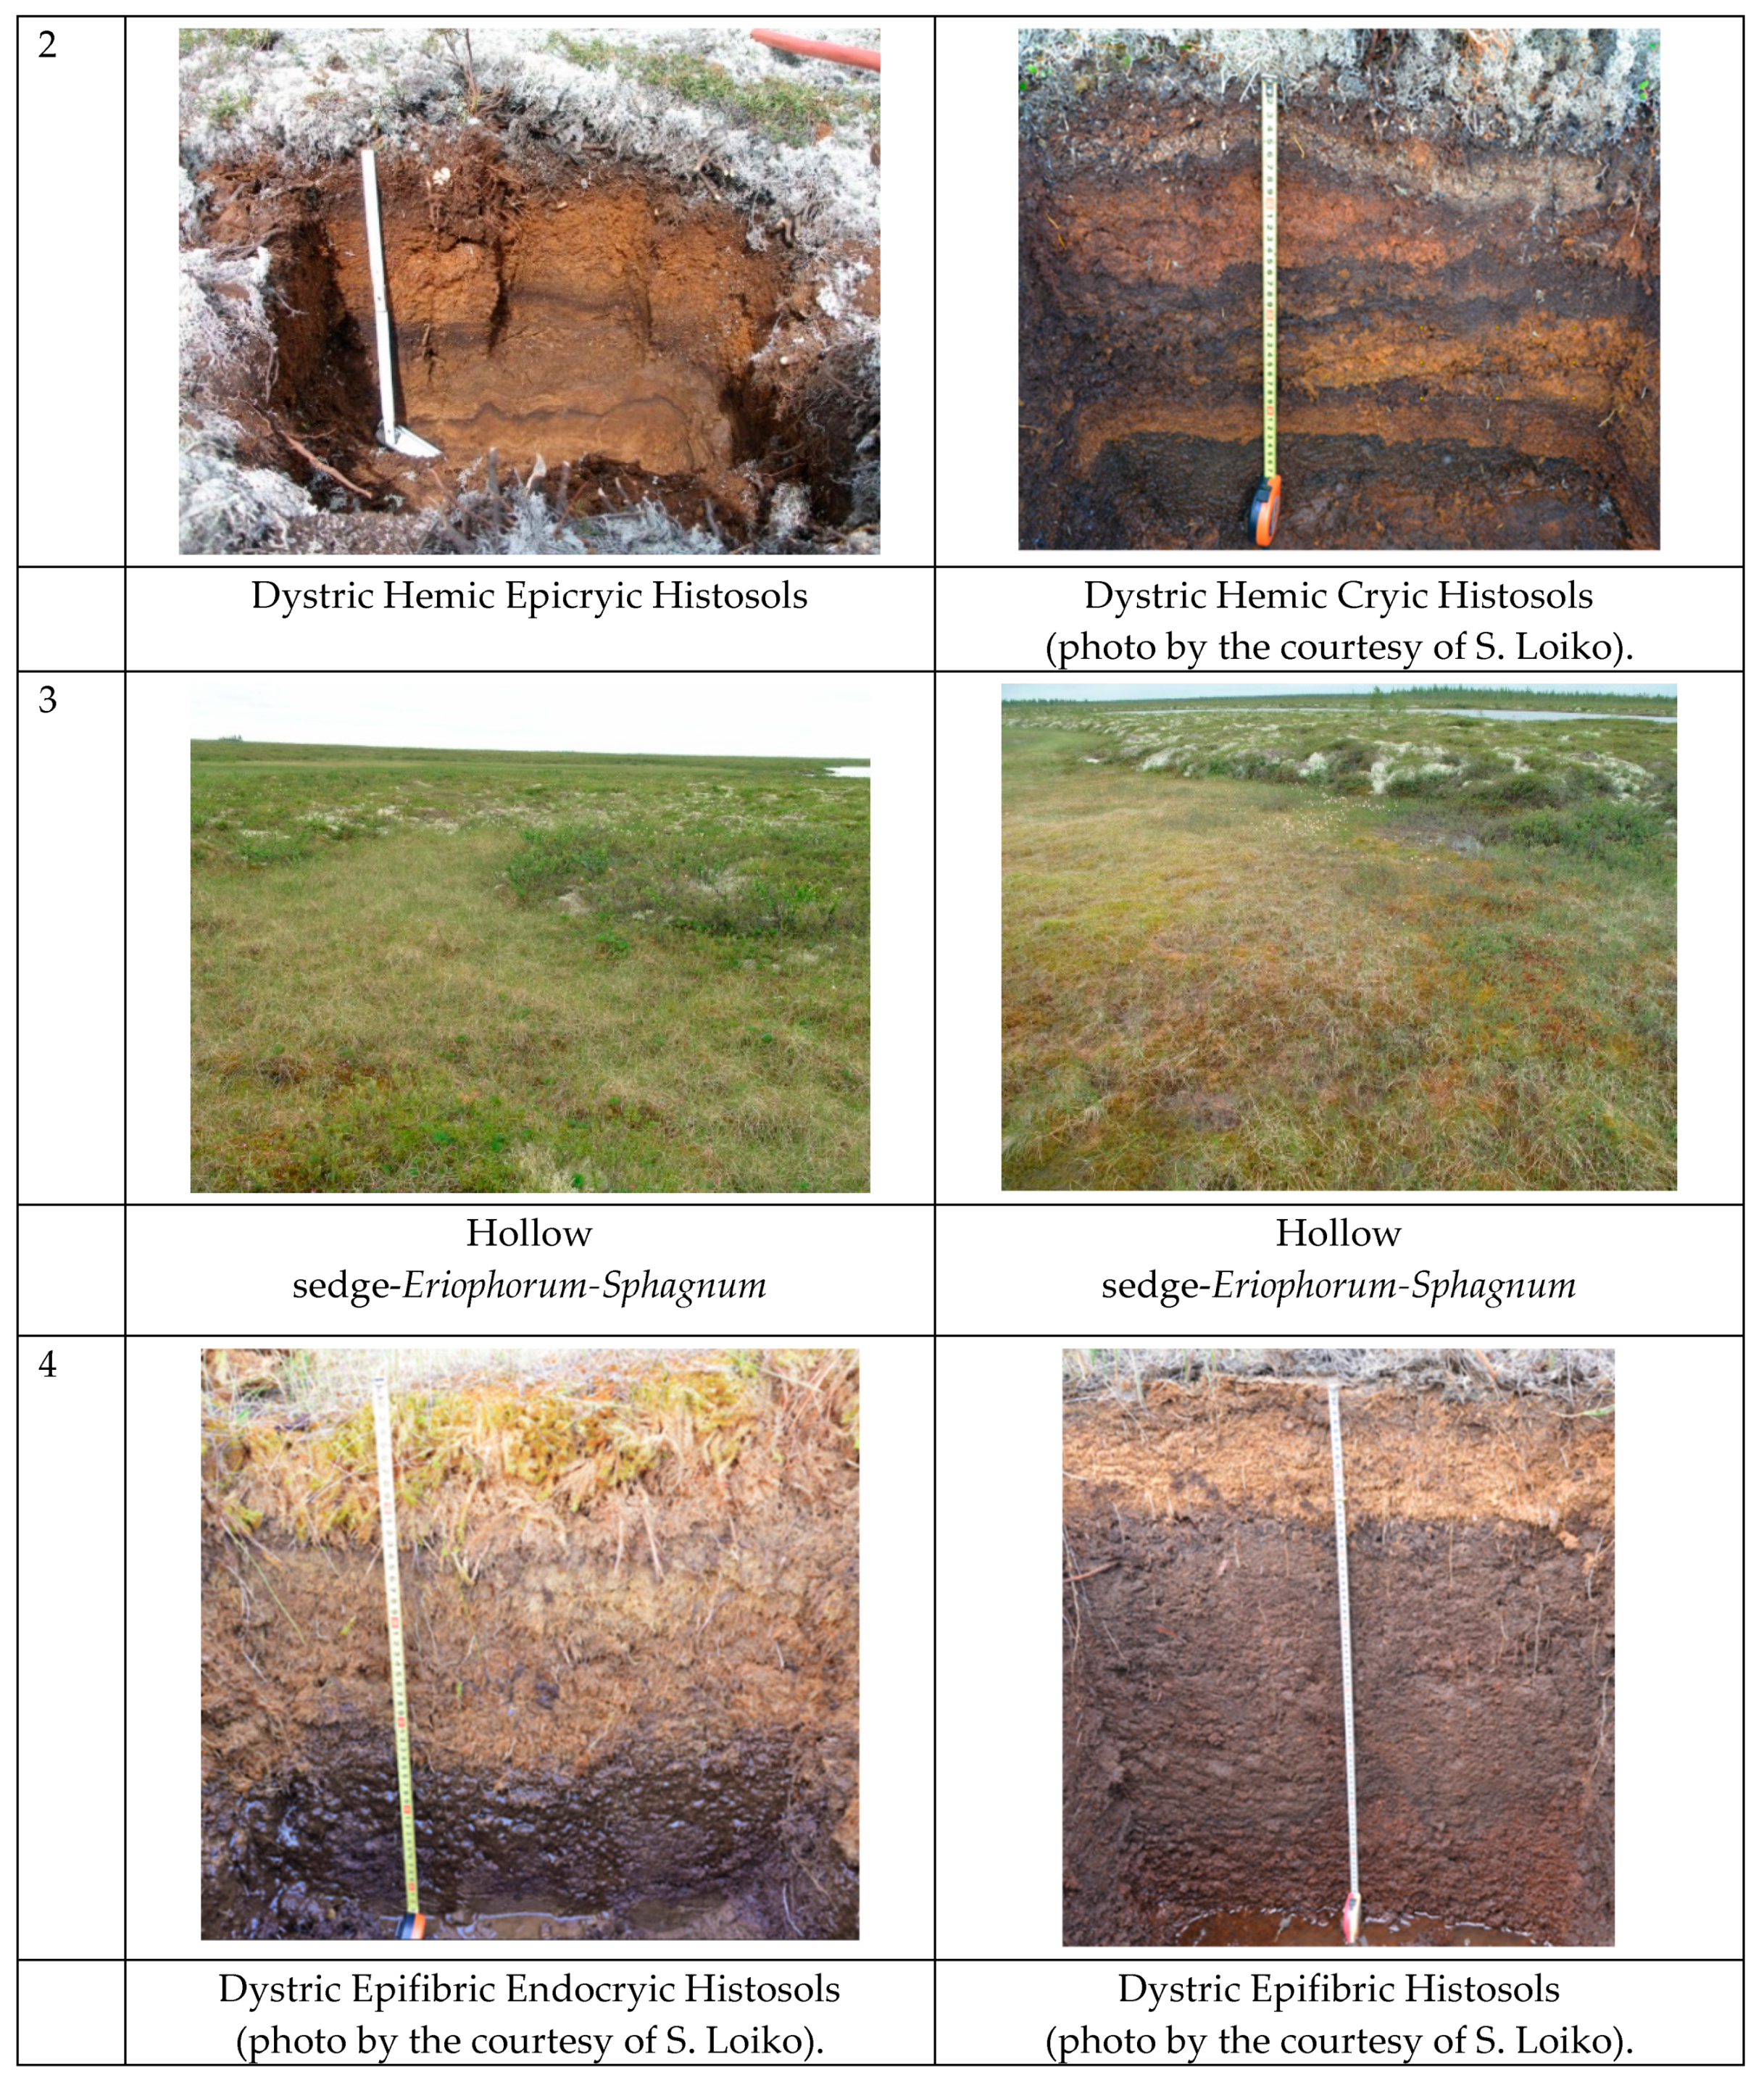
3.1. The Features of Soil Profiles and Soil Properties

The features of soil profiles (described in Table 3 and Table 4) show a number of soil layers formed by partly decomposed organic materials deposed in peat sediments.
Oligotrophic permafrost peat soil in the forest tundra (Dystric Hemic Epicryic Histosols) is composed of several peat layers of different properties; the uppermost (tow and undecomposed plant materials) horizon is about 5–7 cm depth (see Figure 1a; Table 3). Anaerobic processes resulted in the accumulation of dead organic matter in the form of peat at a depth of 7 cm and below, where strong decomposition and compaction of peat occurs. Low temperatures and short growing season in the region are the main constrains of biological processes, resulting in a dramatic decrease in underground organs/plants (roots) presented at the depth of 30 cm, which is the same in deeper horizons.
Oligotrophic permafrost peat soil (Dystric Hemic Cryic Histosols) was described also on hummock (frozen palsa) sites in the northern taiga region. This peatland is similar to the one located in forest-tundra in terms of both surface morphology and vegetation cover, as well as the structure of peat deposits. This is a flat interfluve, underlying by sands, and covered by “palsa” type mires on shallow (0.5–1.5 m) peat deposits.
Furthermore, two typical soil profiles were described in oligotrophic hollows (which is depressed element of micro-landscape in palsa mire), and they classified as Dystric Epifibric Endocryic Histosols in the forest tundra and Dystric Epifibric Histosols in the northern taiga (Figure 1(4)). The description of soil profiles is presented in Table 4.
The permanently frozen soil horizon (permafrost) was found at the depth of 55 cm below land surface in the northern taiga and at the depth of 40 cm in the forest tundra. There are a number of ice crystals present in permafrost layers. The soil above frozen horizon is saturated by water. There is no presence of frost deformation. pH is from 4.4 to 3.4 in-depth of soil profile.
The content of Ca2+ and Mg2+ has typical distribution in all studied soil profiles (see Table 5). The largest amount of Ca2+ and Mg2+ was found in the T1 layer (flat hummock/palsa 13.3; hollow 14.3; khasyrei 20.8 Mmol/100 g). Below T1, the average values of Ca2+ and Mg2+ range from 7.3 to 9.0 Mmol/100 g. Their distribution reflects in-depth migration of organic matter with periodic freezing and thawing in the soil profile. Our analysis of morphological features suggest that these soil profiles are almost identical, with the main difference being in the degree of decomposition of the peat horizons. The values of acidity decrease with an increase in decomposition of organic materials (peat), and the values of Ca2+ and Mg2+ increase accordingly [45].

3.2. Plant Organic Matter
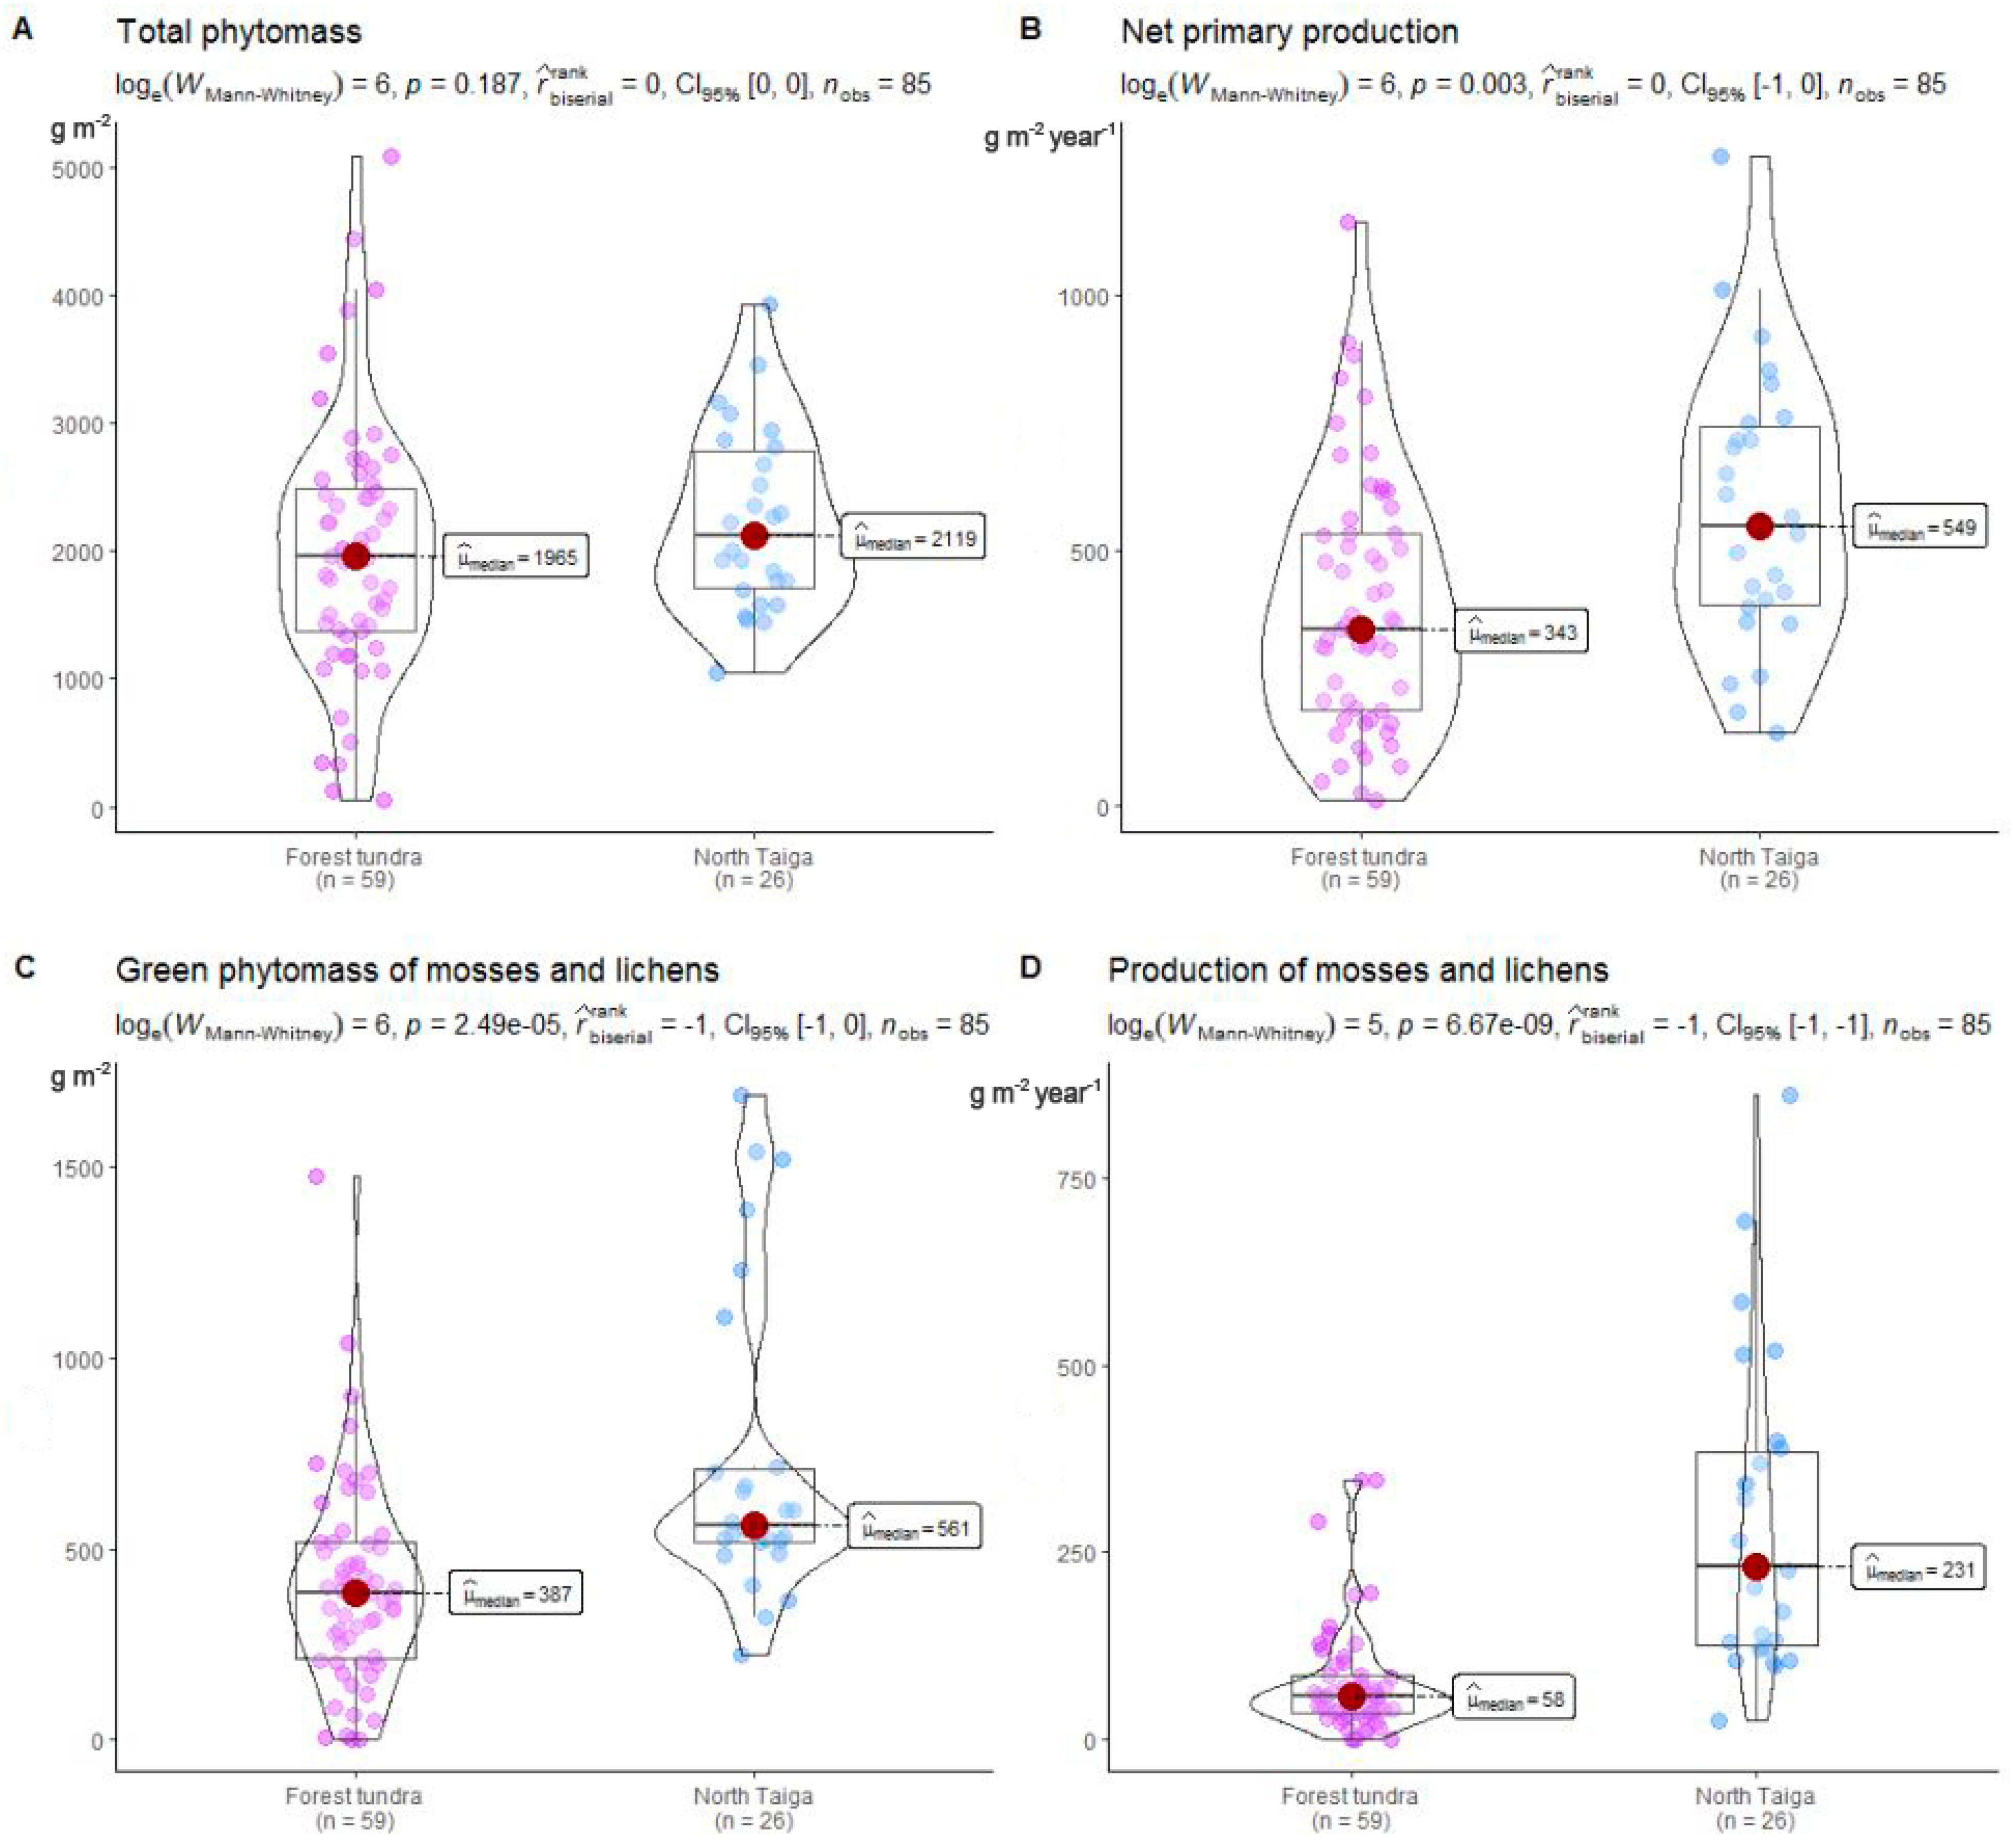
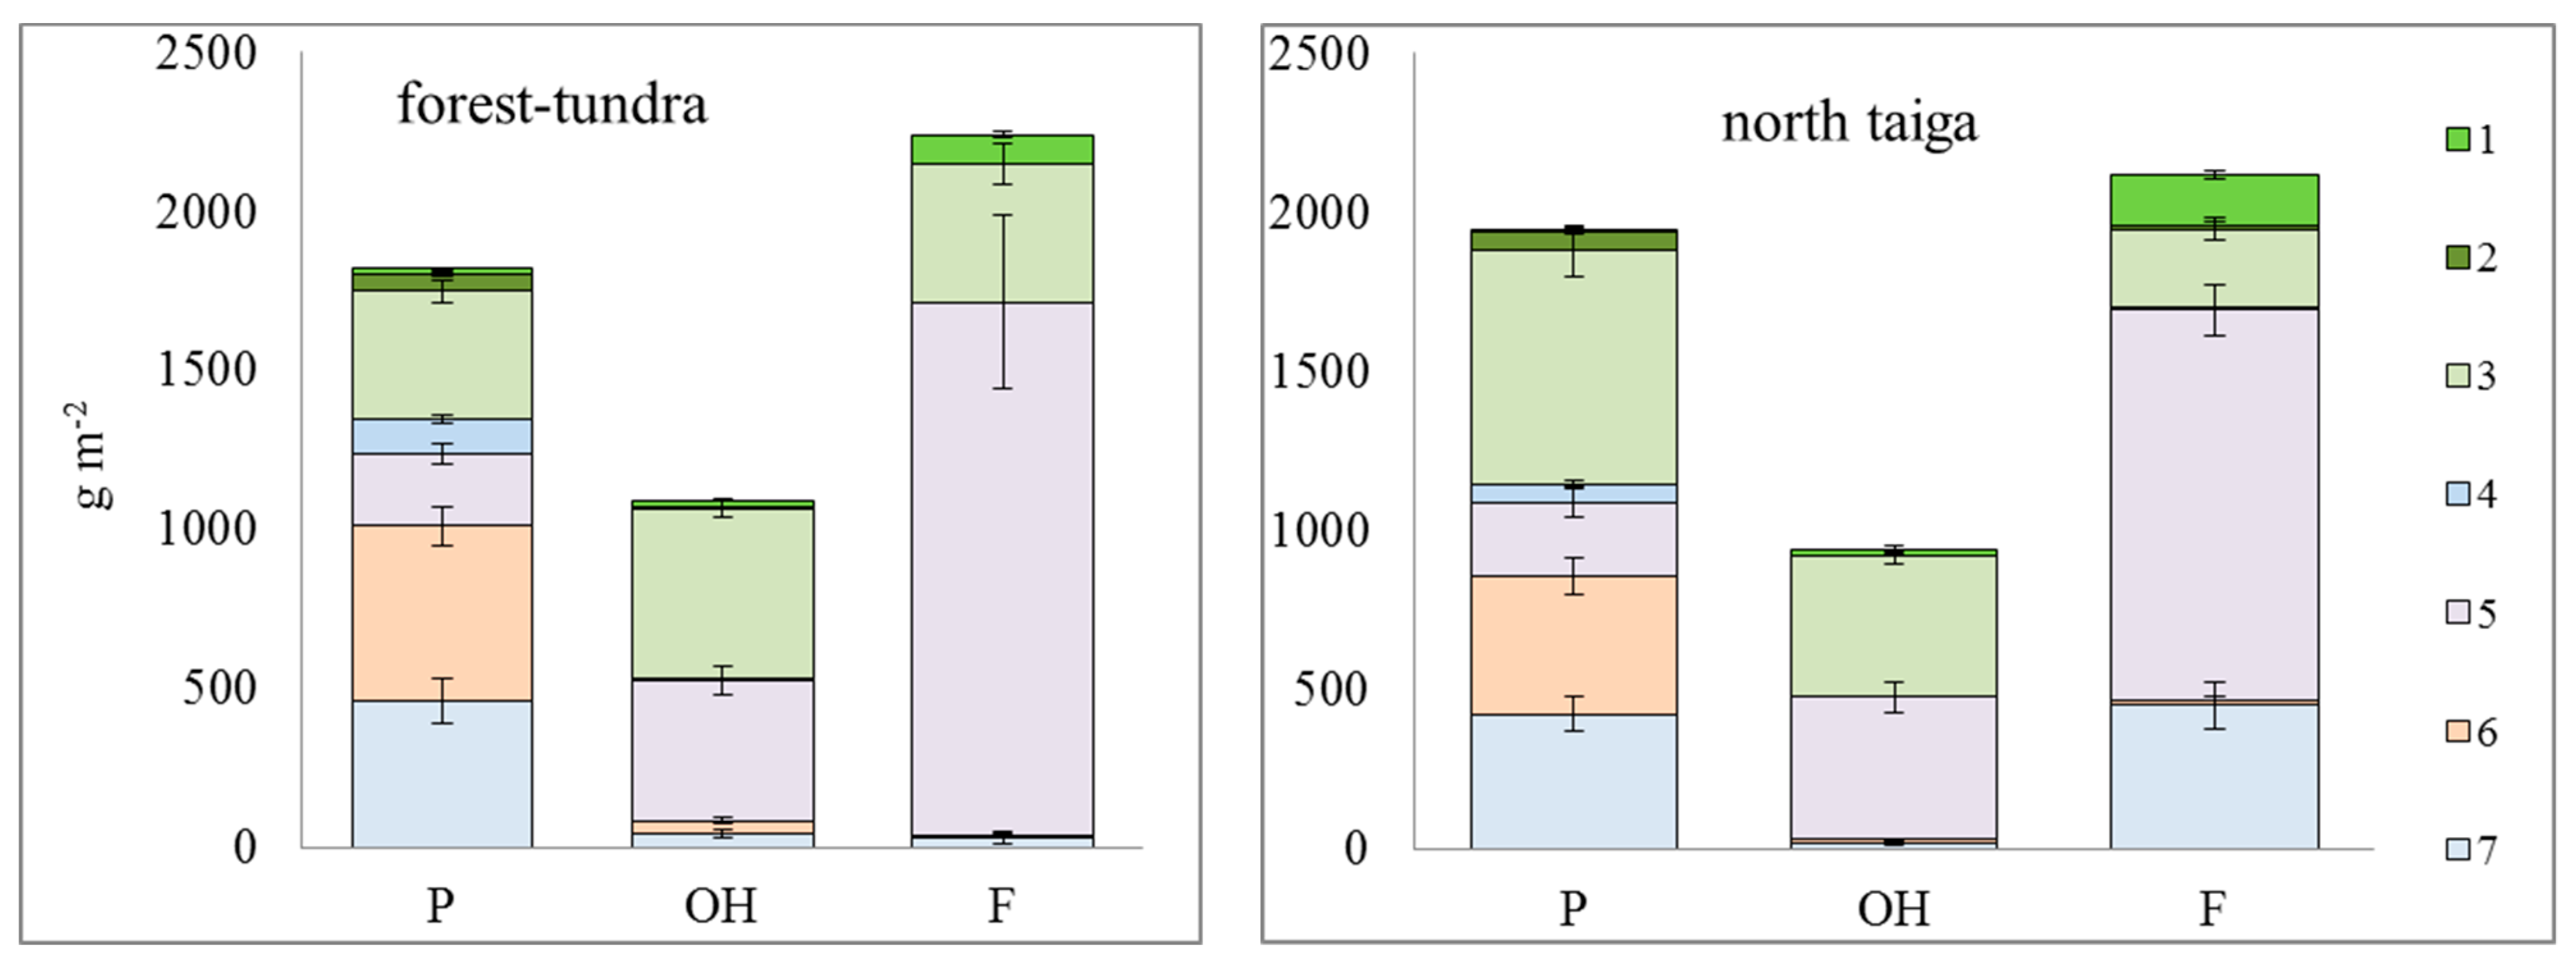
3.2.1. Biomass

In oligotrophic permafrost peat soils (at hummock/palsa component of palsa mire) in the northern taiga region, the total pool of biomass accounts for 470 g m−2, with great contribution of dwarf shrub roots (70% of biomass) only in the uppermost 15-centimeter soil layer; the stock of biomass decreases to 200 g m−2 in the lower soil layers. In same ecosystem (and soil type) in the forest-tundra, in the uppermost 15 cm of soil depth, the fraction of dwarf shrub roots contributes up to 72% of the total biomass, but it decreases dramatically to 15% (64 g m−2) at a depth of 20 cm and below.
In the northern taiga, in the uppermost peat layers of oligotrophic permafrost peat soil (sedge-Sphagnum hollow component of palsa mire), the biomass is mainly composed of below-ground parts of sedges, and cotton grass (Eriophorum) contributed 160 g m−2 or 34% of the total plant biomass. The roots of grasses become the main dominant in near-surface soil layer (220 g m−2), but it further declines to 100 g m−2 at the depths of 20 cm. In the forest tundra and in the uppermost 10-centimeter peat soil of the oligotrophic hollow, the underground organs of sedges and cotton grass account for 230 g m−2 or 66% of biomass; then, the below-ground fraction of biomass drop to 118 g m−2 in deeper layers.
In the northern taiga and in the eutrophic peat soil of poor fen (khasyrei), the underground organs of sedges and cotton grass reach the highest development in the upper soil layer—1060 g m−2 (70% of all below-ground fraction of biomass)—but at a depth of T2. the biomass decreases. In the forest-tundra, the underground organs of sedges and cotton grass are the largest contributors to biomass storage and accounts for 800 g m−2 (or 50% of total below-ground fraction of biomass) in the peat depth of 0–20 cm; again, the drastic decrease was observed already in the depth of 20–30 cm (T2).
For total biomass, which is live biomass + dead biomass (or so-called mortmass), storage in the uppermost 30-centimeter soil depth varies from 9000 to 26,400 g m−2 among all studied ecosystems. The maximum values of mortmass accumulate in hummock/frozen palsa sites at “palsa”-type mire in the forest tundra (~23,480 g m−2), decreasing by almost two folds in the northern taiga (~12,680 g m−2). Less mortmass is stored in oligotrophic hollows (13,200–20,000 g m−2) (Figure 3). Overall, we found that the biomass is less variable in rather contrast wetland micro-landscapes, such as hummock/palsa sites vs. hollow sites within palsa mire than that in inter-hummocks depressions, where we suspect no pressure of cold wind and where we observe a form of “microclimatic oases” that causes deep thawing of permafrost [39]. In general, the stock of plant biomass in soils is much lower in the northern taiga mires: The values are very much similar for the hummock/palsa sites and for oligotrophic hollows within palsa mire landforms, where it accounts for about 14,000 g m−2, and it accounts for 14,500 g m−2 in eutrophic ecosystems of poor fen (khasyrei).
Live biomass remains the most important fraction of plant organic matter that defines the main properties of natural wetland ecosystems. Compared to severe climates in the forest-tundra, more favourable conditions in the taiga regions result in the formation of more productive plant communities. In the forest-tundra region, the average live biomass accounts for 1965 g m−2, whereas it is as much as 2119 g m−2 in the northern taiga. The net primary production (NPP) of wetland ecosystems contributed every year to live biomass storage is 343 g m−2 in the forest tundra and almost twice as much in the northern taiga (550 g m−2) (Figure 4). The biomass of mosses and lichens, which forms the land-surface layer of mire ecosystems and where the majority of underground organs of grasses and shrubs are located, could account for 1/6 to 1/4 of the total live biomass. Relative to the total live biomass, the mosses and lichens add up to 60 g m−2 annually with net primary production (NPP) in the forest-tundra region and 230 g m−2 in the northern taiga region (Figure 4). Statistically significant variations were found in the NPP of ecosystems along different test sites; no significant variations were found for the values of live biomass.
The lowest values of live biomass (900 to 1100 g m−2) were found in the ecosystems of oligotrophic sedge-Sphagnum inter-palsa depressions (hollows). The highest values of live biomass were found in the ecosystems of frozen hummock/palsa (up to 2400 g m−2), mainly due to large contribution of lichens where its biomass is two folds of that found in topographic depressions. Evergreen shrubs at upper topographical positions of palsa sites often create a “wind shadow,” which favors the growth of lichens. The majority (60–80%) of below-ground live biomass on elevated elements of micro-topography was contributed by roots of dwarf shrubs and their stems that became buried in peat deposits. The biomass of green parts of mosses and lichens is in the range of 380–700 g m−2 (or about 25% of the total live biomass). Below-ground organs of grasses and dwarf shrubs contribute 60–70% of total plant organic matter. In the hollows, the main contributors to the storage of biomass are Sphagnum mosses and below-ground organs of vascular plants.
The highest values of above-ground live biomass were found as a contribution of mosses and lichens, which make up at least half of the total live biomass in all studied ecosystems. The mosses contribute the largest fraction of live biomass in hollows, whereas lichens contributed a lot at the hummocks/palsa sites. In mesotrophic ecosystems (poor fen) of khasyrei, live biomass contributed by mosses is in the range of 430–500 g m−2 (Figure 5). The lack of nutrients in oligotrophic hollows results in an increase in live biomass contributed by mosses down to 540 g m−2. On the hummock/palsa sites, with a high abundance of lichens, the live biomass varies from 400 to 700 g m−2. In general, the largest values of live biomass were found in relatively reach-in nutrient ecosystems: In the poor fen (khasyrei), it accounts for 1360 g m−2 and 2240 g m−2 in the region of northern taiga and in the region of forest-tundra, respectively. The live biomass was found to be much lower in the oligotrophic hollow: 940 g m−2 and 1090 g m−2 in the regions of northern taiga and forest tundra, respectively. In the poor-in-nutrients ecosystems, the values of live biomass were found to be largely constrained by presence of permafrost. It accounts for 2420 g m−2 at elevated elements of micro-topography (hummocks/palsa sites) and 1250 g m−2 in micro-depressions in the northern taiga region, whereas it accounts for 2010 g m−2 on the same type of hummock/palsa sites in the forest-tundra.

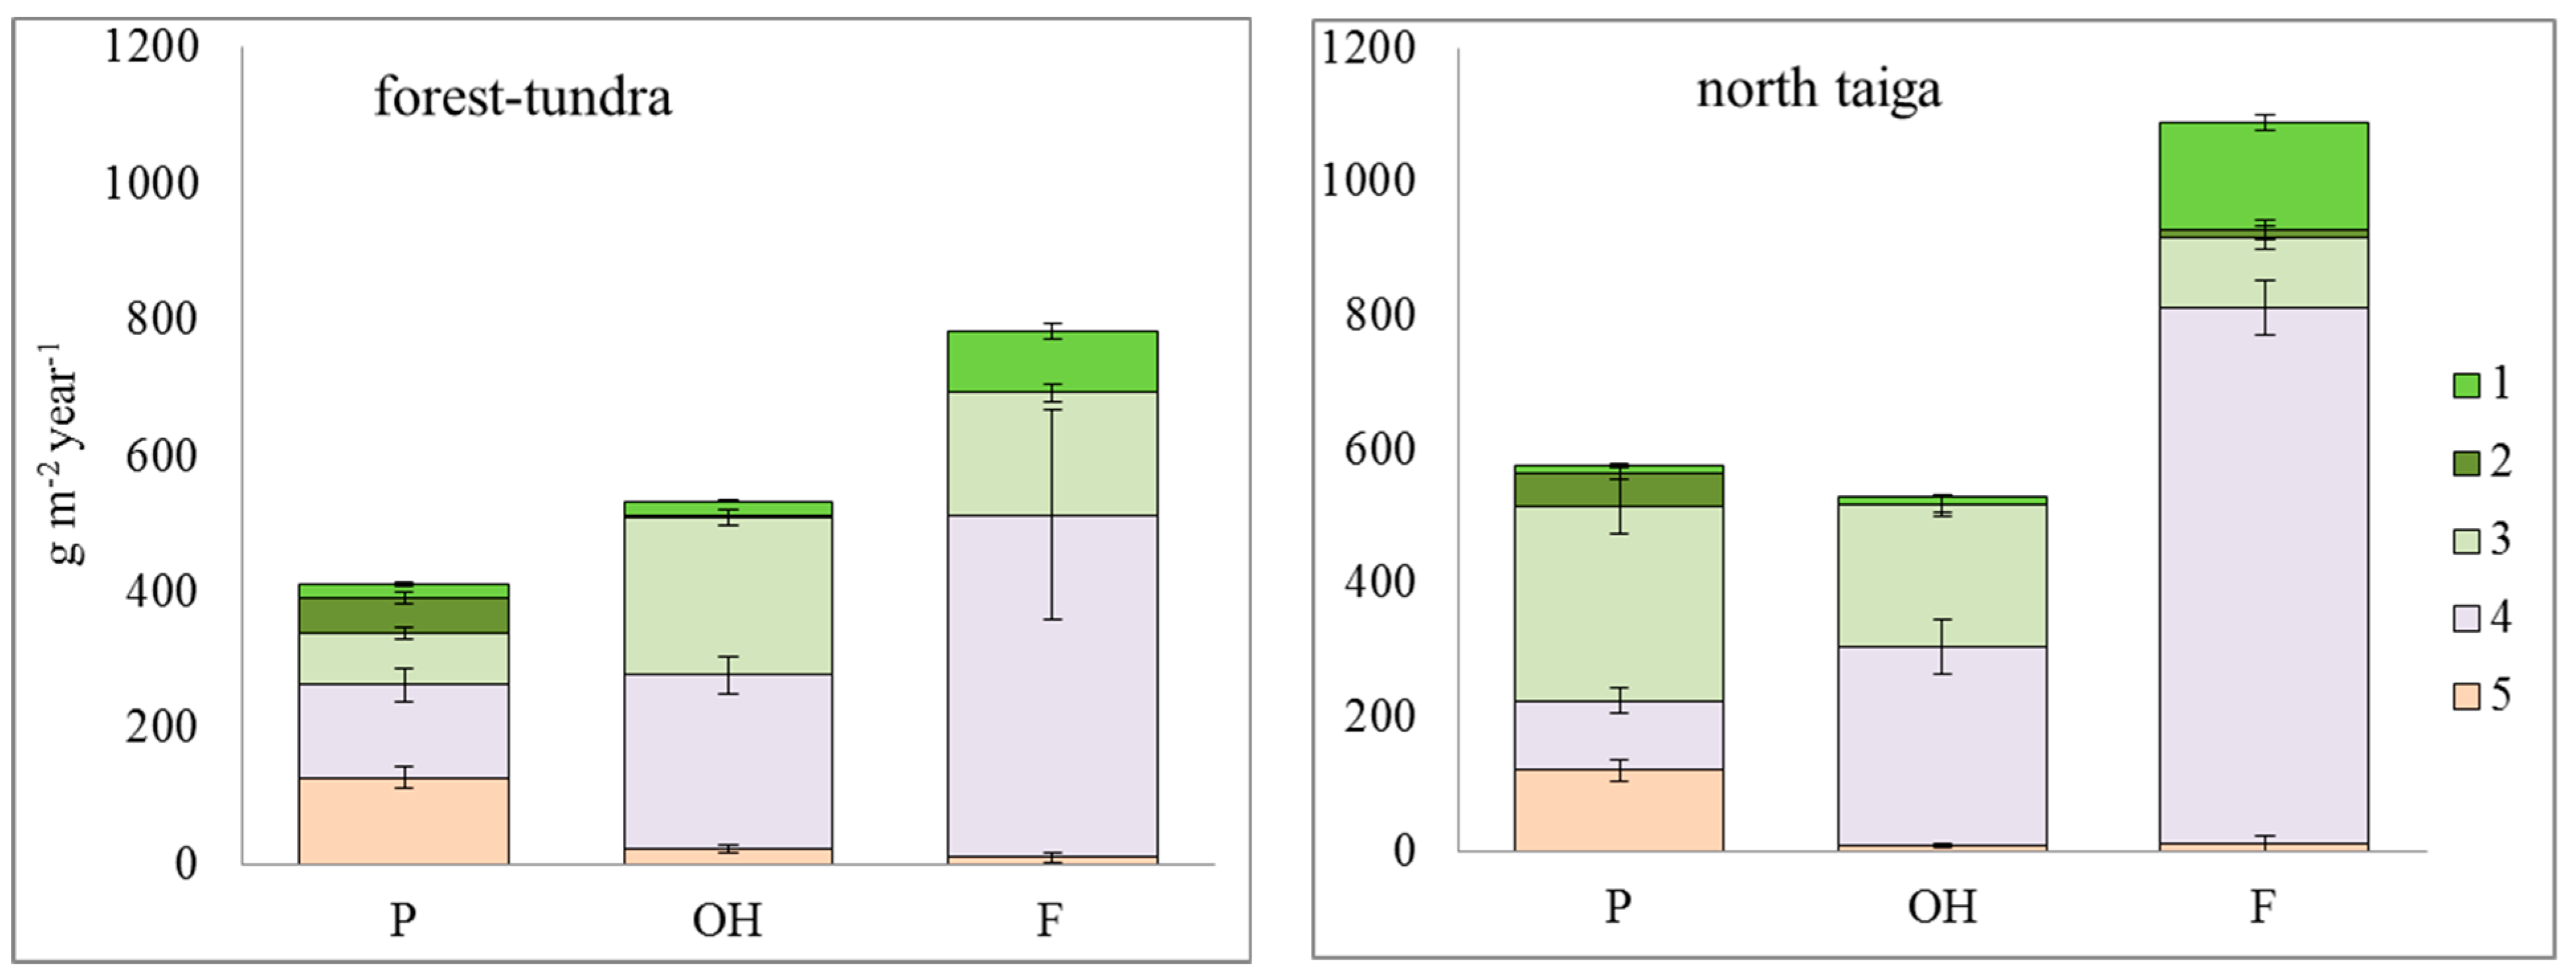
3.2.2. Net Primary Production (NPP)

Net primary production (NPP) of palsa mires was found in a range of 400–530 g m2 yr−1. It varies depending on the on-site composition of plant species, the features of micro-topography, and geographical location (Figure 6). Across all studied ecosystems in the northern taiga, the NPP ranges from 530 to 580 g m2 yr−1 with live biomass ranges from 900 to 2240 g m2, with an exception for ecosystems of poor fen (khasyrei), where the NPP accounts for 1100 g m2 yr−1, and live biomass accounts for 2200 g m2. In the forest tundra, the NPP ranges from 410 to 530 g m2 yr−1, and live biomass ranges from 1100 to 2100 g m2; in khasyrei, the values of NPP and live biomass were found at the rates of 780 g m2 yr−1 and 2240 g m2, respectively.
In the palsa mire, the ratio of above-ground to below-ground fractions of NPP on flat palsa sites was 1:4 due to large contributions of dwarf shrub roots; whereas the ratio was found at 1:6 in oligotrophic hollows, where the below-ground fraction of NPP predominates due to large contribution of sedges and cotton grass (Eriophorum spp.). In general, the largest contribution to NPP is made by the below-ground fraction (BNP) of plants.
The contribution of the roots of grasses to the total NPP of ecosystem was found at about 80–90 g m2 yr−1 on the hummock/palsa sites; 100 g m2 yr−1 in oligotrophic hollows; and 620 g m2 yr−1 g m−2/yr in khasyrei. The contribution of dwarf shrub roots ranges from 70 to 200 g m2 yr−1 across hummock/palsa sites, but it accounts for only 6 g m2 yr−1 in oligotrophic hollows. The contribution of mosses and lichens ranges from 100 to 200 g m2 yr−1 across all studied ecosystems. The lowest contribution to NPP (20–100 g m2 yr−1) is made by green parts of grasses and dwarf shrubs, and it is driven by features of micro-topography of wetland landscape [24].
The net primary production (NPP) contributes about 20–47% of the total live biomass of ecosystem on an annual basis across all studied ecosystems. It is driven by the life form of plants dominated in land cover in terms of the contribution of different fractions to the total NPP value. Basically, the grasses and mosses account for slightly less than a half of the total NPP values. The NPP of shrubs contribute a minor fraction to its live biomass due to large contribution of perennial stems. In all studied plant communities and across all ecosystems, the below-ground fraction of NPP (BNP) is always higher than that of above-ground fraction of NPP (ANP).
Our data analyses reveal the significant difference in dead biomass (mortmass) values between the palsa mire sites (hummock and oligotrophic hollow) and poor fen (khasyrei) ecosystems in the forest tundra, and there was no difference revealed for all three ecosystems in the northern taiga.
The total live biomass in the forest tundra differs significantly between the hummock and the oligotrophic hollow (OH) sites in the palsa mire, and the live biomass values at the hummocks were found rather similar to those in the poor fen (khasyrei) ecosystems. In the northern taiga, all three ecosystems were found significantly different from each other in terms of live biomass values.

4. Discussion

Our study revealed that both the biomass and net primary production (NPP) in the wetland (mire) ecosystems are largely constrained by nutrient supply in soils, which also depends on water content in root-inhabited soil layers. Biomass and NPP reach high values in rather rich-in-nutrients (mesotrophic) hollows; but these values are much lower in the poor-in-nutrients (oligotrophic) hummock/palsa sites, especially in presence of permafrost. The study allows making certain conclusions in which both soil properties and climatic conditions have a significant impact on net primary production (NPPs) and the features of plant organic matter; the same factors also determine NPP values in wetlands/peatlands at the low end of natural ecosystems in the boreal regions of Western Siberia.
In our study, the 300 kilometer move from north to south in Western Siberia resulted in a 2 °C increase in temperature and 37% increase in net primary production (NPP) of flat palsa mire ecosystems. The average total biomass of mires in the forest-tundra region accounts for 20,600 to 26,400 g m−2, with an annual contribution of above-ground production (ANP) of 146–270 g m2 yr−1 and below-ground production (BNP) of 264–513 g m2 yr−1. The average total biomass of mire ecosystems in the northern taiga accounts for 14,200 g m2, with an above-ground fraction of NPP (ANP) of 226–350 g m2 yr−1 and below-ground fraction of NPP (BNP) of 226–400 g m2 yr−1. In the poor fen (khasyrei) ecosystems of northern taiga, the biomass accounts for about 14,000 g m2, with an annual contribution of above-ground production (ANP) of about 280 g m2 yr−1 and below-ground production (BNP) of about 800 g m2 yr−1. In poor fen (khasyrei) ecosystems of the forest tundra, the biomass accounts for about 9000 g m2, with an annual contribution of above-ground production (ANP) of about 270 g m2 yr−1 and below-ground production (BNP) of about 510 g m2 yr−1.
Overall, our long-term observations have found a fraction of dead biomass (mortmass) that tends to increase northwards in the boreal region, whereas the NPP tends to increase in an opposite direction; the storage of live biomass (phytomass) is not dependent on the geographical location of the studied ecosystems.
Across earlier publications that focused on studies the features of plant organic matter in natural wetland ecosystems in Western Siberia, it has been extensively studied in the middle-boreal and south-boreal (taiga) regions [46,47,48,49,50]. In the middle taiga, the most productive ecosystems are mesotrophic mires with NPPs of about 890 g m2 yr−1, where below-ground organs of grasses and mosses contributed equal fractions of 40% each to the total NPP. The above-ground NPP (ANP) of grasses and dwarf shrubs did not exceed 20%. In ecosystems of dwarf shrub-Sphagnum bogs (ryam), the Sphagnum mosses make the largest contribution to NPP. The lowest NPPs were found in oligotrophic hollows. Some low values of NPPs (no more than 560 g m2 yr−1) were found on ridges in the patterned ridge-hollow type bogs.
In West Siberian Arctic, the above-ground fraction of NPP (ANP) was found as much as 1134 g m2 yr−1 at some early stages of formations of khasyrei ecosystems; then, the ANP drops to 660 ± 292 g m2 yr−1 at the mature stage of khasyrei formation, as shown in Loiko et al. [32]. Our study in the northern taiga of Western Siberia suggests that the below-ground fraction of NPP (BNP) accounts for about 60% of the total NPP in mire ecosystems. This finding is in a good agreement with Titlyanova et al. [51], who studied the features of biomass in grass-dominated ecosystems. They have found that a below-ground fraction of live biomass is always much higher than that of the above-ground fraction.
The features of plant organic matter, biomass storage, and net primary production (NPP) were studied in Canada [52,53], on wetlands in Sweden [54], and in Finland [55]. These studies revealed the NPP in a range of 350–1940 g m2 yr−1, and it tends to increase from north to south along climatic gradient of research area. Nijp et al. [56] estimated the wetland biomass in Finland in a range of 150–336 g m2 yr−1. The other study has found the NPP of 870 g m2 yr−1 in a boreal fen, dominated by below-ground fraction (BNP)—the roots of sedges contributed 75% of NPP, and the above-ground fraction (ANP) contributed ~25% of the total [57]. In the mires of south Sweden, the NPP accounted for 800 g m2 yr−1, with 70% contributed by roots [54]. Overall, for all northern wetlands/peatlands, the NPP was found as 370 g m2 yr−1 for palsa type mires, and 450 g m2 yr−1 for oligotrophic bogs [58]. We confirm these numbers are in general agreement with our findings.

Author Contributions

N.P.K. and N.P.M.-T. have developed the main concept of this study and led publication activity; they developed methodology of direct field measurements of plant organic matter (biomass and NPP) in wetland/peatland ecosystems in Western Siberia; E.K.V., N.G.K. and V.A.S. implemented formal analysis, and they contributed to work on review comments; L.G.K. studied soil carbon in wetland/mire profiles; A.O.K. led project administration and funding acquisition; A.M.P. contributed to final data analysis and interpretation, original draft preparation, and worked on review comments. All authors contributed to writing and editing the manuscript. All authors have read and agreed to the published version of the manuscript.

Funding

Analytical work was made on laboratory equipment of the Institute of Soil Science and Agrochemistry, Siberian Branch of the Russian Academy of Sciences (ISSA SB RAS). The study was carried out according to the State Assignment of ISSA SB RAS. The study was carried out by using the equipment of the Unique Research Installation “System of experimental bases located along the latitudinal gradient” TSU with financial support from the Ministry of Education and Science of Russia (RF-2296.61321X0043, 13.YHY.21.0005, agreement No. 075-15-2021-672). This study was supported by the Tomsk State University Development Programme («Priority-2030»). A.M.P. and A.O.K. are grateful for support from the Russian Science Foundatin (RSF), grant 20-67-46018.

Institutional Review Board Statement

Not applicable.

Informed Consent Statement

Not applicable.

Conflicts of Interest

The authors declare no conflict of interest. The funders had no role in the design of the study; in the collection, analyses, or interpretation of data; in the writing of the manuscript; or in the decision to publish the results.

References

  1. Yu, Z.; Loisel, J.; Brosseau, D.P.; Beilman, D.W.; Hunt, S.J. Global peatland dynamics since the Last Glacial Maximum. Geophys. Res. Lett. 2010, 37, L13402. [Google Scholar] [CrossRef]
  2. Stocker, T.F.; Qin, D.; Plattner, G.-K.; Tignor, M.; Allen, S.K.; Boschung, J.; Nauels, A.; Xia, Y.; Bex, V.; Midgley, P.M. (Eds.) IPCC, 2013: Climate Change 2013: The Physical Science Basis. Contribution of Working Group I to the Fifth Assessment Report of the Intergovernmental Panel on Climate Change; Cambridge University Press: Cambridge, UK; New York, NY, USA, 2013; p. 1535. [Google Scholar]
  3. Turunen, J.; Tahvanainen, T.; Tolonen, K. Carbon accumulation in west Siberian mires, Russian. Glob. Biogeochem. Cycles 2001, 15, 285–296. [Google Scholar] [CrossRef]
  4. Botch, M.S.; Kobak, K.I.; Vinson, T.S.; Kolchugina, T.P. Carbon pools and accumulation in peatlands of the former Sovet Union. Glob. Biogeochem. Cycles 1995, 9, 37–46. [Google Scholar] [CrossRef]
  5. Loisel, J.; van Bellen, S.; Pelletier, L.; Talbot, J.; Hugelius, G.; Karran, D.; Yu, Z.; Nichols, J.; Holmquist, J. Insights and issues with estimating northern peatland carbon stocks and fluxes since the Last Glacial Maximum. Earth-Sci. Rev. 2017, 165, 59–80. [Google Scholar] [CrossRef]
  6. Smith, L.C.; MacDonald, G.M.; Velichko, A.A.; Beilman, D.W.; Borisova, O.K.; Frey, K.E.; Kremenetski, K.V.; Sheng, Y. Siberian Peatlands a Net Carbon Sink and Global Methane Source Since the Early Holocene. Science 2004, 303, 353–356. [Google Scholar] [CrossRef] [PubMed] [Green Version]
  7. Sheng, Y.W.; Smith, L.C.; MacDonald, G.M.; Kremenetski, K.V.; Frey, K.E.; Velichko, A.A.; Lee, M.; Beilman, D.W.; Dubinin, P. A high-resolution GIS-based inventory of the west Siberian peat carbon pool. Glob. Biogeochem. Cycles 2004, 18, 14415–14428. [Google Scholar] [CrossRef]
  8. Efremov, S.P.; Efremova, T.T. Present stocks of peat and organic carbon in bog ecosystems of west Siberia. In Carbon Storage and Atmospheric Exchange by West Siberian Peatlands; Bleuten, W., Lapshina, E.D., Eds.; Utrecht University: Utrecht, The Netherlands, 2001; pp. 73–78. [Google Scholar]
  9. Vomperskiy, S.E. Biogeocenoticheskie Osobennosti Bolot i Ich Razional’noe Ispol’zovanie; Izdatel’stvo VZ SO RAN: Moskva, Russia, 1994; pp. 5–37. [Google Scholar]
  10. Efremov, S.P.; Efremova, T.T.; Melentyeva, N.V. Zapasy ugleroda v ecosystemah bolot. In Uglerod v Ecosystemah Lesov I Bolot Rossii; Alekseev, V.A., Berdsi, R.A., Eds.; Izdatel’stvo VZ SO RAN: Krasnoyarsk, Rossia, 1994; pp. 128–139. [Google Scholar]
  11. Titlianova, A.A.; Bulavko, G.I.; Kudryashova, S.Y.; Naumov, A.V.; Smirnov, V.V.; Tanasienko, A.A. Zapasi i poteri organicheskogo ugleroda v pochvach Sibiri. Pochvovedenie 1998, 1, 51–59. [Google Scholar]
  12. Novikov, S.M. Gydrologiya Zabolochennych Territoriy Zony Mnogoletney Merzloty Zapadnoi Sibiri; OOO Izdatel’stvo VVM: Saint-Petersburg, Russia, 2009; 536p. [Google Scholar]
  13. Romanova, E.A. Tipy bolotnych massivov i zakonomernoe raspredelenie ich na territorii Zapadnoi Sibiri. In Tipy Bolot SSSR I Principy Ich Klassifikazii; Nauka: Leningrad, Russia, 1974; pp. 167–174. [Google Scholar]
  14. Botch, M.S.; Mazing, V.V. Ecosystemy Bolot SSSR; Nauka: Leningrad, Russia, 1979; 188p. [Google Scholar]
  15. Seppälä, M. The term “palsa”. Z. Geomorphol. 1972, 16, 463. [Google Scholar]
  16. Luoto, M.; Heikkinen, R.K.; Carter, T.R. Loss of palsa mires in Europe and biological consequences. Environ. Conserv. 2004, 31, 30–37. [Google Scholar] [CrossRef] [Green Version]
  17. Peregon, A.; Maksyutov, S.; Kosykh, N.; Mironysheva-Tokareva, N.P. Map based inventory of the wetland biomass and NPP in western Siberia. J. Geophys. Res. 2008, 113, G01007. [Google Scholar] [CrossRef]
  18. Bazilevich, N.I.; Titlyanova, A.A. Bioticheskiy Krugovorot na Pyati Kontinentah; Izdatel’stvo SO RAN: Novosibirsk, Russia, 2008; 380p. [Google Scholar]
  19. Bazilevich, N.I. Biologicheskaya Productivnost’ Ecosystem Severnoi Evrazii; Nauka: Moskva, Russia, 1993; 293p. [Google Scholar]
  20. Rodin, L.E.; Bazilevich, N.I. Dinamika Organicheskogo Veshestva i Biologicheskiy Krugovorot Zol’nych Elementov i Azota v Osnovnych Tipah Rastitel’nosti Zemnogo Schara; Nauka: Moskva, Russia; Leningrad, Russia, 1965; 253p. [Google Scholar]
  21. Karelin, D.V.; Zamolodchikov, D.G. Uglerodniy Obmen v Kriogennych Ecosystemah; Nauka: Moskva, Russia, 2008; 344p. [Google Scholar]
  22. Gould, W.A.; Raynolds, M.; Walker, D.A. Vegetation, plant biomass, and net primary productivity patterns in the Canadian Arctic. J. Geophys. Res. 2003, 108, 8167. [Google Scholar] [CrossRef]
  23. Prokushkin, A.S.; Hagedorn, F.; Pokrovsky, O.S.; Viers, J.; Kirdyanov, A.V.; Masyagina, O.V.; Prokushkina, M.P.; McDowell, W.H. Permafrost Regime Affects the Nutritional Status and Productivity of Larches in Central Siberia. Forests 2018, 9, 314. [Google Scholar] [CrossRef] [Green Version]
  24. Kosykh, N.P.; Koronatova, N.G.; Naumova, N.B.; Titlyanova, A.A. Above- and below-ground phytomass and net primary production in boreal mire ecosystems. Wetl. Ecol. Manag. 2008, 16, 139–153. [Google Scholar] [CrossRef]
  25. Raudina, T.V.; Loiko, S.V.; Lim, A.; Manasypov, R.M.; Shirokova, L.S.; Istigechev, G.I.; Kuzmina, D.M.; Kulizhsky, S.P.; Vorobyev, S.N.; Pokrovsky, O.S. Permafrost thaw and climate warming may decrease the CO2, carbon, and metal concentration in peat soil waters of the Western Siberia Lowland. Sci. Total Environ. 2018, 634, 1004–1023. [Google Scholar] [CrossRef]
  26. Kirpotin, S.N.; Berezin, A.; Bazanov, V.; Polishchuk, Y.; Vorobiov, S.; Mironycheva-Tokoreva, N.; Kosykh, N.; Volkova, I.; Dupre, B.; Pokrovsky, O.; et al. Western Siberia wetlands as indicator and regulator of climate change on the global scale. Int. J. Environ. Stud. 2009, 66, 409–421. [Google Scholar] [CrossRef]
  27. Loiko, S.; Raudina, T.; Lim, A.; Kuzmina, D.; Kulizhskiy, S.; Pokrovsky, O. Microtopography controls of carbon and related elements distribution in the west siberian frozen bogs. Geosciences 2019, 9, 291. [Google Scholar] [CrossRef] [Green Version]
  28. Weltzin, J.F.; Harth, C.; Bridgham, S.D.; Pastor, J.; Vonderharr, M. Production and microtopography of bog bryophytes: Response to warming and water-table manipulations. Oecologia 2001, 128, 557–565. [Google Scholar] [CrossRef] [PubMed]
  29. Vitt, D.H.; Halsey, L.A.; Zoltai, S.C. The bog landforms of continental Western Canada in relation to climate and permafrost patterns. Arct. Alp. Res. 1994, 26, 1–13. [Google Scholar] [CrossRef]
  30. Stepanova, V.A.; Pokrovsky, O.S.; Viers, J.; Mironycheva-Tokareva, N.P.; Kosykh, N.P.; Vishnyakova, E.K. Elemental composition of peat profiles in western Siberia: Effect of the micro-landscape, latitude position and permafrost coverage. Appl. Geochem. 2015, 53, 53–70. [Google Scholar] [CrossRef]
  31. Audry, S.; Pokrovsky, O.S.; Shirokova, L.S.; Kirpotin, S.N.; Dupré, B. Organic matter mineralization and trace element post-depositional redistribution in Western Siberia thermokarst lake sediments. Biogeoscience 2011, 8, 3341–3358. [Google Scholar] [CrossRef] [Green Version]
  32. Loiko, S.; Klimova, N.; Kuzmina, D.; Pokrovsky, O. Lake Drainage in Permafrost Regions Produces Variable Plant Communities of High Biomass and Productivity. Plants 2020, 9, 867. [Google Scholar] [CrossRef] [PubMed]
  33. Vaganov, E.A.; Vedrova, E.F.; Verhovets, S.V.; Efremov, S.P.; Efremova, T.T.; Kruglov, V.B.; Onuchin, A.A.; Sukhinin, A.I.; Shibistova, O.B. Lesa i bolota Sibiri v global’nom zikle ugleroda. Sibirskiy Ecol. Z. 2005, 4, 631–649. [Google Scholar]
  34. Meltzer, L.I. Tundrovaya rastitel’nost’. In Rastitel’nyi Pokrov Zapadno-Sibirskoi Ravniny; Nauka: Novosibirsk, Russia, 1985; pp. 41–54. [Google Scholar]
  35. Smolentsev, B.A. Struktura Pochvennogo Pokrova Sibirskich Uvalov; Izdatel’stvo SO RAN: Novosibirsk, Russia, 2002; 117p. [Google Scholar]
  36. Tonkonogov, V.D. Avtomorfnoe Pochvoobrazovanie v Tundrovoi i Taeshnoi Zonah Vostochno-Evropeiskoi i Zapadno-Sibirskoi Ravnin; Pochvenniy Institut V.V. Dokuchaeva: Moskva, Russia, 2010; 304p. [Google Scholar]
  37. Pavlov, A.V. Monitoring Kriolitozony; Akademicheskoe Izdatel’stvo “GEO”: Novosibirsk, Russia, 2008; 229p. [Google Scholar]
  38. Loiko, S.; Raudina, T.; Lim, A.; Kuzmina, D.; Kulizhskiy, S.; Pokrovsky, O. Dissolved organic carbon, macro- and microelements in solutions of peat soils in the cryolithozone of the West Siberian Plain. In Proceedings of the “Horizons of the Future” Conference, Soil Institute Named after V.V.Dokuchaev, Moscow, Russia, February 2017; Available online: https://www.researchgate.net/publication/337472993_Dissolved_organic_carbon_macro-_and_microelements_in_solutions_of_peat_soils_in_the_cryolithozone_of_the_West_Siberian_Plain?channel=doi&linkId=5dd9b175a6fdccdb4460010c&showFulltext=true (accessed on 30 September 2021).
  39. Kosykh, N.P.; Mironycheva-Tokareva, N.P.; Parshina, E.K. Biologicheskaya productivnost’ bolot lesotundry Zapadnoi Sibiri. Vestnik TGPU Seriya Biol. Nauki 2008, 4, 53–57. [Google Scholar]
  40. Shishov, L.L.; Tonkonogov, V.D.; Lebedeva, I.I. Klassifikaziya i Diagnostika Pochv Rossii; Izdatel’stvo Oikumena: Moscow, Rossia, 2004; 342p. [Google Scholar]
  41. IUSS Working Group WRB. World Reference Base for Soil Resources 2006. A Framework for International Classification. No 103; FAO: Rome, Italy, 2006; 144p. [Google Scholar]
  42. Andreyashkina, N.I.; Andreiashkina, Y.G. Raznogodichnaya izmenchivost’ produkzii nadzemnoi biomassy tundrovych soobshestv. In Structura i Funkzionirovanie Biogeozenozov Priobskogo Severa; Publ. House of the UNC of the USSR AS: Sverdlovsk, Russia, 1981; pp. 12–19. [Google Scholar]
  43. Kosykh, N.P.; Koronatova, N.G.; Granath, G. Effect of Temperature and Precipitation on Linear Increment of Sphagnum fuscum and S. magellanicum in Western Siberia. Russ. J. Ecol. 2017, 48, 173–181. [Google Scholar] [CrossRef]
  44. Andreev, V.N. Prirost kormovych lishainikov i priyemy ego regulirovaniya. Trudy Bot. Inst. AN SSSR Geobotanika 1954, 3, 12–19. [Google Scholar]
  45. Vasilevskaya, V.D.; Ivanov, V.V.; Bogatyrev, L.G. Pochvy Severa Zapadnoi Sibiri; Izdatel’stvo Moscow State University: Moskva, Russia, 1986; 226p. [Google Scholar]
  46. Efremova, T.T.; Efremov, S.P.; Kosykh, N.P.; Mironycheva-Tokareva, N.P.; Titlyanova, A.A. Biologicheskaya productivnost’ i pochvy bolot yushnogo Vasyuganiya. Sib. Ecol. Z. 1994, 3, 253–267. [Google Scholar]
  47. Kosykh, N.P.; Mironycheva-Tokareva, N.P.; Parshina, E.K. The carbon and macroelements budget in the bog ecosystems of the middle taiga in Western Siberia. Int. J. Environ. Stud. 2009, 66, 485–493. [Google Scholar] [CrossRef]
  48. Kosykh, N.P.; Mironycheva-Tokareva, N.P.; Bleuten, V. Productivnost’ bolot yushnoi taigi Zapadnoi Sibiri. Vestn. Tomsk. Uni. 2003, 7, 142–152. [Google Scholar]
  49. Kosykh, N.P.; Mironycheva-Tokareva, N.P.; Peregon, A.M.; Parshina, E.K. Net primary production in peatlands of middle taiga region in western Siberia. Rus. J. Ecol. 2008, 39, 466–474. [Google Scholar] [CrossRef]
  50. Titlyanova, A.A. Chistaya pervichnaya producziya travianych i bolotnych ecosystem. Sib. Ecolog. Z. 2007, 5, 763–770. [Google Scholar]
  51. Titlyanova, A.A.; Romanova, I.P.; Kosykh, N.P.; Mironycheva-Tokareva, N.P. Pattern and process in above-ground and below-ground components of grassland ecosystems. J. Veg. Sci. 1999, 10, 307–320. [Google Scholar] [CrossRef]
  52. Reader, R.J.; Stewart, J.M. The relationship between net primary production and accumulation for a peatland in southern-eastern Manitoba. Ecology 1972, 53, 1024–1037. [Google Scholar] [CrossRef]
  53. Moore, T.R.; Bubier, J.L.; Frolking, S.E.; LaFleur, P.M.; Roulet, N.T. Plant biomass and production and CO2 exchange in an ombrotrophic bog. J. Ecol. 2002, 90, 25–36. [Google Scholar] [CrossRef]
  54. Wallen, B. Methods for studing below-ground production in mire ecosystems. Suo 1992, 43, 155–162. [Google Scholar]
  55. Murray, K.J.; Tenhunen, J.D.; Nowak, R.S. Photoinhibition as a control on photosynthtsis and production of Sphagnum mosses. Oecologia 1993, 96, 200–207. [Google Scholar] [CrossRef]
  56. Nijp Jelmer, J.J.; Limpens, J.; Metselaar, K.; Van Der Zee, S.; Berendse, F.; Robroek, B.J.M. Can frequent precipitation moderate the impact of drought on peatmos uptake in northern peatlands. New Phytol. 2014, 203, 70–80. [Google Scholar] [CrossRef] [PubMed]
  57. Saarinen, T. Vascular Plants as Input of Carbon in Boreal Sedge Fens: Control of Production and Partitioning of Biomass; Publications in Botany, University of Helsinki 28: Yliopistopaino, Finland, 1999; p. 66. [Google Scholar]
  58. Beilman, D.W.; Yu, Z.; Vitt, D.H. Modelling regional variability in peat accumulation response to climate in continental Western Canada. In Proceedings of the West Siberian Peatlands and Carbon Cycle: Past and Present. International Field Symposium, Noyabrsk, Russia, 18–22 August 2001; pp. 15–18. [Google Scholar]
Figure 1. Vegetation communities and soil types in the forest-tundra, “Pangody,” [38]. (a) and in the northern taiga—“Noyabrsk” (b) test sites. At (1) land cover at flat hummock/palsa; (2) frozen peat soils at flat hummock/palsa sites; (3) land cover in oligotrophic hollows; (4) peat soil in oligotrophic hollows; (5) land cover in sedge-Sphagnum poor fen (khasyrei). All pictures with no on-panel was made by N. P. Kosykh.
Atmosphere 12 01612 g001aAtmosphere 12 01612 g001bAtmosphere 12 01612 g001c
Figure 2. Sphagnum moss-dominated plant community (on peat eutrophic permafrost soils) in khasyrei. The photo by N. P. Kosykh.
Atmosphere 12 01612 g002
Figure 3. (1) Live biomass (phytomass) and (2) dead biomass (mortmass) at different micro-landscapes in patterned palsa mire: P (hummock/frozen palsa), OH (oligotrofic hollow), and F (poor fen) (khasyrei) in the forest tundra (left panel) and in the northern taiga (right panel) regions of Western Siberia.
Atmosphere 12 01612 g003
Figure 4. Total biomass (phytomass) (A); net primary production, NPP (B); green biomass (phytomass) of mosses and lichens (C); net primary production (ANP) of mosses and lichens (D) in palsa mire ecosystems in the forest tundra and in the northern taiga regions.
Atmosphere 12 01612 g004
Figure 5. The fractions of live biomass at different elements of micro-topography at palsa-type mire, where (P) corresponds to hummock/palsa sites, (OH) corresponds to oligotrophic hollows, and (F) corresponds to poor fens (khasyrei). The colors are as follows: 1—green biomass of grasses; 2—green biomass of shrubs; 3—green biomass of mosses and lichens; 4—wooden fraction of shrubs (above-ground); 5—below-ground fraction of grasses; 6—live roots of shrubs; 7—below-ground trunks of shrubs in uppermost 30 cm depth.
Atmosphere 12 01612 g005
Figure 6. The fractions of net primary production (NPP) at different elements of micro-topography at palsa mires, where (P) corresponds to hummock/palsas; (OH) corresponds to oligotrophic hollows; and (F) corresponds to poor fens (or khasyrei). The colors are as follows: 1—ANP of grasses; 2—ANP of shrubs; 3—above-ground fraction (ANP) of mosses and lichens; 4—BNP of grasses; 5—below-ground fraction (BNP) of shrubs.
Atmosphere 12 01612 g006
Table 1. Location of test sites.
Name of Test SiteLocationEcosystemDepth of Permafrost, cmNumber of Measurements
Pangody65°52′ N,
74°58′ E
palsa40–4559
oligotrophic hollow8059
poor fen (khasyrei)-9
Noyabrsk63°14′ N,
75°44′ E
palsa50–6026
oligotrophic hollow-26
poor fen (khasyrei)-11
Table 2. The features of land cover/plant communities at the test sites.
Micro-LandscapeElement of
Topography
Vegetation CommunityDominant Species
Forest Tundra (Pangody)
Palsa mireFlat palsa siteDwarf shrub-lichenLedum decumbens (Ait.) Lodd. ex Steud., Andromeda polifolia L., Oxycoccus microcarpus Turcz. ex Rupr., Cladonia stellaris (Opiz) Brodo, Cl. rangiferina (L.) F.H.Wigg, Sphagnum fuscum (Schimp.) Klinggr, S. lenense H.Lindb. ex L.I.Savicz.
Oligotrophic hollowSedge-Eriophorum-SphagnumCarex rotundata Wahlenb., Eriophorum russeolum Fries, Sphagnum lindbergii Schimp. ex Lindb., S. balticum (Russow) C.E.O. Jensen.
KhasyreiHollow (poor fen)Sedge-Eriophorum-SphagnumCarex rostrate Stokes, Carex lasiocarpa Ehrh., Eriophorum angustifolium Honck., Comarum palustre L., Sphagnum riparium Ångstr., S. squarrosum Crome.
North Taiga (Noyabrsk)
Palsa mireFlat palsa siteDwarf shrub-moss-lichenLedum decumbens, Andromeda polifolia, Oxycoccus microcarpus, Cladonia stellaris, Cl. rangiferina, Sphagnum fuscum
Oligotrophic hollowSedge-Eriophorum-SphagnumCarex rotundata, Eriophorum russeolum, S. balticum.
KhasyreiHollow (poor fen)Sedge-Eriophorum-SphagnumCarex lasiocarpa, Eriophorum angustifolium, Sphagnum riparium.
Table 3. Description of oligotrophic permafrost peat soils at hummock/palsa sites on palsa mire.
Soil HorizonSoil Layer, cmDescription
Forest-tundra (Dystric Hemic Epicryic Histosols)
Tow0–7Color is brown and light brown. Wet layer of undecomposed peat.
T17–10Color is mainly brown. Wet peat at early stage of decomposition.
T210–25Homogeneous brown colored peat. Wet and moderately decomposed materials.
T325–40Inhomogeneous color, brown and dark brown. Well decomposed peat and very humid peat layer.
T340–50Homogeneous dark brown color. Well decomposed peat and very humid materials.
Northern taiga (Dystric Hemic Cryic Histosols)
Tow0–7Green and light grey color. The layer composed of dead parts of lichens and mosses that dry and mellow. Clear border with underlying peat horizons.
T17–10Wet horizon of ochre-colored moss-dwarf shrub peat deposits penetrated by roots and buried shrub trunks that are fresh and mellow. The border with underlying horizon is sharp and well distinguished by color.
T210–25Reddish-brown peat with a few plots of dark brown peat at a depth of 12–20 cm. There are no mineral particles; they are fresh and mellow materials. The border with underlying horizon is sharp and well distinguished by color.
T325–55Brown and dark brown with reddish-brown thin interlayers (stratified) peat deposit with the presence of mineral particles; they are well compacted and fresh. Presence of permafrost from 55 cm depth.
Table 4. Description of oligotrophic permafrost peat soil in sedge-Sphagnum hollows on palsa mire.
Soil HorizonSoil Layer, cmDescription
Forest-tundra (Dystric Epifibric Endocryic Histosols)
Tow0–20The color is homogeneous light brown. Wet layer of undecomposed peat with residues of vascular plants: shrubs, sedges, and cotton grass.
T120–35Wet peat at early stage of decomposition: brown-colored.
T235–40Homogeneous dark brown well decomposed peat. Wet. Smeared in hands.
T340–50Dark brown well-decomposed peat. Wet. Smeared in hands.
Northern taiga (Dystric Epifibric Histosols)
Tow0–20Undecomposed residues of vascular plants (shrubs, sedges, cotton grass) and Sphagnum mosses.
T120–35Wet brown-colored horizon, moderately decomposed, and with plant residues of dwarf shrubs and cotton grass; some (minor) content of mineral particles. The border with underlying horizon is gradual in color.
T235–40Wet, brown, and moderately decomposed peat layer; minor content of mineral particles as compared with overlying deposits.
T340–50Dark brown and moderately decomposed peat; slightly smeared in hands. Large amount of mineral particles.
Table 5. Soil properties and carbon storage in the northern taiga (Noyabrsk test site).
Soil HorizonDepthpHCarbon (org.)NPCa2+Mg2+Carbon Storage
(cm)(Water)%mg Per g of SoilMmol/100 ggC m2
Dystric Hemic Epicryic Histosols (frozen palsa site)
Tow0–64.4 4.72.1389
At6–103.755.60.242.177.85.2727
T110–203.456.30.731.5813.35.85450
T220–303.555.90.461.429.02.25565
T230–40 54.50.431.64
T330–403.455.90.371.8911.44.2
Dystric Epifibric Histosols (hollow site)
Tow0–104.753.20.131.867.34.9829
T110–204.157.50.191.6714.37.7846
T220–304.655.00.191.544.50.86735
T230–40 50.00.120.6
T340–50 56.40.181.24
Dystric Epifibric Endohemic Histosols (khasyrei)
Tow0–104.250 * 13.96.11043
T110–204.350 * 20.81.63732
T220–304.550 * 9.7 4088
T230–404.6 9.02.4
T340–504.7 11.41.0
* Data of Efremova et al. [46].
Publisher’s Note: MDPI stays neutral with regard to jurisdictional claims in published maps and institutional affiliations.

