Abstract
The steady-state assumption commonly used in object-based tracking algorithms may be insufficient to determine the right track when a convective storm goes through a complicated evolution. Such an issue is exacerbated by the relatively coarse output frequency of current convection allowing model (CAM) forecasts (e.g., hourly), giving rise to many spatially well resolved but temporally not well resolved storms that steady-state assumption could not account for. To reliably track simulated storms in CAM outputs, this study proposed an object-based method with two new features. First, the method explicitly estimated the probability of each probable track based on either its immediate past and future motion or a reliable “first-guess motion” derived from storm climatology or near-storm environmental variables. Second, object size was incorporated into the method to help identify temporally not well resolved storms and minimize false tracks derived for them. Parameters of the new features were independently derived from a storm evolution analysis using 2-min Multi-Radar Multi-Sensor (MRMS) data and hourly CAM forecasts produced by the University of Oklahoma (OU) Multiscale data Assimilation and Predictability Laboratory (MAP) from May 2019. The performance of the new method was demonstrated with hourly MRMS and CAM forecast examples from May 2018. A systematic evaluation of four severe weather events indicated 99% accuracy achieved for over 600 hourly MRMS tracks derived with the proposed tracking method.
1. Introduction
Storm tracking techniques were originally designed to track observed storms in radar-based observations [1,2,3]. Recent decades have witnessed rapid convection allowing model (CAM) developments [4,5,6,7]. CAM’s ability to realistically simulate convective storms has motivated the adaptation of observation-based storm tracking techniques to track CAM-simulated storms [8]. A reliable CAM-based storm tracking technique is essential for the accurate characterization of simulated convective storm evolutions including key attributes such as convection initiation (CI), storm motion, duration, and max-size during the lifetime of a simulated storm. It provides a framework to systematically evaluate crucial aspects of CAM-simulated storms. Such a framework advances our understanding of the strengths and limitations of CAM forecasts so that they can be more appropriately utilized for severe weather forecasting.
The object-based method, which involves the identification of objects to represent storms present in a spatial variable at time t, is one of the most widely used methods for convective storm tracking and CAM forecast verification [9]. Assuming minimal changes in certain characteristics such as motion, size, intensity and/or changes in size and intensity, the object-based tracking of a storm from t to t + ∆t is generally a “predict and match” process [2,10,11]. Specifically, the storm object is first extrapolated to t + ∆t based on its status at (i.e., location, size, intensity) and/or attributes from t − ∆t to (e.g., motion, changes in intensity/size). Then, the object(s) present at t + ∆t with attributes most comparable to the extrapolated object is associated with .
Although this extrapolation-based approach showed promise, it is unclear to what extent an object’s status at and attributes from t − ∆t to can be reliably used to predict its counterpart at t + ∆t. If too much confidence is given to a poorly predicted object, the derived track associating with some object(s) at may be false. False tracks derived from to t + ∆t may lead to more unreliable tracks from t + ∆t to t + 2∆t and so on. Although this caveat has been noted by many studies for tracking both observed and CAM-simulated storms [10,12,13], we have not found any existing object-based tracking method that quantified or at least studied the uncertainty associated with the attributes used for extrapolation.
The extrapolation-based approach is especially ill-suited for handling current CAM forecasts because it cannot accurately track spatially well resolved but “short-lived” storms (i.e., seen on less than three contiguous time frames) without a high-quality “first-guess motion”. It is not a serious concern if the number of such storms is limited. However, the output frequencies of current CAM forecasts are generally much lower compared to their spatial resolution (e.g., ∆t = 1 h versus [14]), giving rise to a considerable number of such storms. The abundance of these storms greatly increases the likelihood of random, false connections among them and would inevitably affect the tracking reliability of nearby, long-lived storms, posing a serious challenge to the overall tracking quality of CAM-simulated storms [15]. We are not aware of any existing CAM-based tracking methods that address this challenge associated with hourly CAM outputs.
To overcome the above limitations and improve the accuracy of CAM-based convective storm tracking, this paper proposes a new object-based method with two new features. First, uncertainties associated with attributes used in object extrapolation were explicitly quantified to guide the derivation of tracks. Second, object size was incorporated to help identify objects not well resolved by the given temporal resolution; tracks associated with objects smaller than certain threshold size must undergo additional quality control steps before being accepted. Parameters used in the new features were derived from a resolution-dependent study of generic storm evolution properties using 2-min Multi-Radar Multi-Sensor (MRMS [16]) data and hourly CAM forecasts produced by the University of Oklahoma (OU) Multiscale data Assimilation and Predictability Laboratory (MAP) from May 2019.
The structure of the paper is as follows. Section 2 presents the independent, resolution-dependent study of convective storm evolution using 2-min, 1 km MRMS observations and hourly, 3 km CAM forecasts produced by OU MAP during May 2019. The new object-based tracking algorithm with parameters derived from the study is proposed in Section 3. Section 4 demonstrates the performance of the new tracking algorithm with examples of complex storm evolutions in hourly MRMS observations and MAP forecasts during May 2018 and systematic evaluations of 608 hourly MRMS tracks, and 123 distinct CIs derived with the new method. Section 5 summarizes the study.
2. Generic Evolution Properties of Convective Storms
The goal of this section is to derive baseline parameters for (a) describing generic evolution properties for storms well resolved by data of given spatial (∆x) and temporal (∆t) resolution and (b) distinguishing them from storms not well resolved by . As an applicable example for CAM-based storm tracking, we set ∆x = 3 km and ∆t = hourly, the resolution of MAP forecasts used in this study. To ensure the accuracy and general applicability of the baseline parameters, we utilized the publicly available 2-min MRMS data (https://www.nssl.noaa.gov/projects/mrms/, accessed on 1 May 2019) spanning a month (May 2019). The adaptability of baseline parameters for tracking CAM-simulated storms was explored using hourly MAP forecasts from the same period.
2.1. Data and Method
The data for identifying observed objects and tracks is 2-min, 0.01° × 0.01° (~1 km × 1 km) MRMS composite reflectivity observations over the continental U.S. (CONUS) during May 2019. The data for identifying simulated objects is hourly, 3 km × 3 km CAM simulated reflectivity forecasts produced by OU MAP over the same domain during the 2019 NOAA Hazardous Weather Testbed (HWT) Spring Forecasting Experiment (SFE). For a detailed description of the OU MAP forecast configuration, please refer to the 2019 HWT SFE program overview and operations plan (https://hwt.nssl.noaa.gov/sfe/2019/docs/HWT_SFE2019_operations_plan.pdf, accessed on 1 August 2019).
To match the spatial resolution of CAM forecasts used in this study, MRMS data was remapped to a 3 km × 3 km grid. Before object identification, a median filter of size 9 km × 3 km was applied to both data to filter high-frequency noise [17,18].
Objects were identified using a fixed threshold, 35 dBZ. This is based on subjective evaluations of objects identified with a series of thresholds (e.g., 35, 40 and 45 dBZ): 35 dBZ performs the best for identifying individual storms in their entirety, while higher thresholds produce increasing numbers of objects describing only part of a storm, especially in the case of mesoscale convective systems.
Identified MRMS objects were tracked every 2 min by a simple method: each object at was associated with the nearest object(s) at t + 2 min measured by the Hausdorff distance (H [19]). Hausdorff distance is a composite distance measure between two sets of points rather than two single points (e.g., centroids). A small between two objects not only indicates spatial proximity but also implies similar sizes and shapes. To minimize the effects of less well-resolved features on tracking reliability, (a) we only tracked objects with area ≥10 pts on the 3 km grid which is equivalent to a minimum storm size of ~10 km in diameter, and (b) the overlap ratio for each track derived by the simple method must be greater than 0.5 for the track to be valid. Overlap ratio, , is defined as the ratio between , the overlap area of and , and , the smaller object’s area within the track.
If multiple objects, i.e., , , and , connect to the same object , we calculate the Hausdorff distance for all competing one-to-one tracks, i.e., , , , as well as the alternative many-to-one track describing the merging of , into , . Curly brackets of objects () denotes that the objects listed inside the brackets are treated as one object. The track with the smallest is the resulting track. One-to-many tracks are derived similarly. A one-to-many track simulates the situation where one object at splits as several objects at t + 2 min.
After 2-min tracks were derived for all consecutive time frames, ∆t tracks were obtained by (a) combining all contiguous 2-min tracks within each t~t + ∆t period into a track sequence and (b) reducing each track sequence to a ∆t track containing only the starting object(s) at and ending object(s) at t + ∆t. Because the 2-min track sequence may contain both one-to-many and many-to-one tracks, the derived ∆t track may be many-to-many (the association of multiple objects at to multiple objects at t + ∆t). A many-to-many ∆t track typically describes the co-development of storms that have gone through rather complex deformations and interactions (merging and splitting) on the 2-min level.
To demonstrate the hourly tracks identified by this approach, Figure 1 and Figure 2 show 20-min snapshots of MRMS composite reflectivity for a small region of ongoing convection during 18–19 z and 19–20 z of 1 May 2019. Colored objects represent storms associated with identified hourly tracks while gray objects represent storms not well resolved by hourly data. Three hourly tracks were identified during 18–19 z (orange, blue, pink in Figure 1) and four were identified during 19–20 z (green, orange, magenta, blue in Figure 2). The orange-colored track in Figure 2 is the continued track of the same-colored storm in Figure 1 while the blue- and pink-colored tracks in Figure 1 continued as one track (blue) in Figure 2. The green- and magenta-colored tracks of Figure 2 are storms newly formed after 18 z.
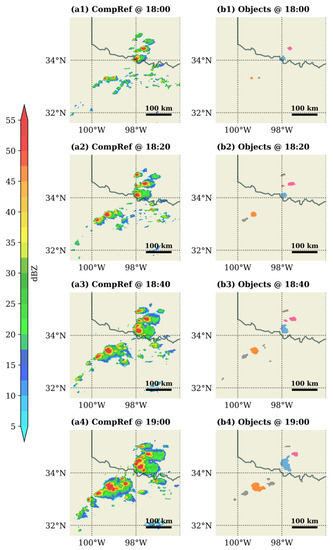
Figure 1.
(a1–a4) 20-min snapshots of MRMS composite reflectivity and (b1–b4) objects identified from 18 z to 19 z, 1 May 2019. Same-colored objects in column b imply tracks identified for 18–19 z and gray objects represent systems that initiate and/or dissipate during 18–19 z.
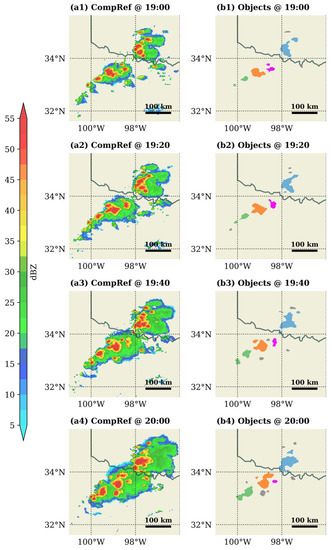
Figure 2.
(a1–a4) 20-min snapshots of MRMS composite reflectivity and (b1–b4) objects identified from 19 z to 20 z, 1 May 2019. Same-colored objects in column b imply tracks identified for 19–20 z and gray objects represent systems that initiate and/or dissipate during 19–20 z.
2.2. Track-Based Attributes and Their Properties
To study generic properties of convective storm evolution on the target resolution , track direction () and speed (h) were estimated for all identified tracks: and were estimated per track and saved separately for each object associated with the track. For example, the direction and speed of a many-to-one track was derived using the centroid locations of and ; the estimates were saved as the future (or current) track direction () and speed () for and and past (or previous) track direction () and speed () for . For an object associated with both a future track () and a past track (), changes in track direction () and speed () were also estimated. Specifically, and .
Table 1 listed all the attributes we estimated for the hourly tracks identified in Figure 1 and Figure 2, including track direction, speed for all hourly tracks and changes in track direction and speed from 18–19 z to 19–20 z if the tracks identified in Figure 1 were continued in Figure 2. Track direction ranges between 0° and 360° following standard meteorological convection (e.g., the direction for storms moving west-to-east and south-to-north is 270° and 180°, respectively). The track direction of 238.23° and 240.45° was estimated for the cell along the orange-colored track from 18–19 z and 19–20 z, respectively, reflecting an average storm moving direction of WSW with minimal changes in direction (i.e., ). Changes in direction and speed were also estimated for the blue-colored track of Figure 2, with values slightly different for the two blue objects of Figure 2 h because they were associated with different tracks (blue and pink) from the past hour (Figure 1). Although listed in the table, the motion ( and h) as well as changes in motion ( and ) for the blue-colored track of Figure 2 were not used for further analyses because they reflect the attributes of a typical slow-moving storm () with an overlap ratio of 0.894. As discussed in [2], slow-moving storms may make apparently large changes in direction. Object-based motion derived from a slow-moving storm mostly reflects the structural changes within the storm rather than the translational motion of the storm. For this reason, slow-moving tracks, identified by an overlap ratio of 0.7 and larger, were excluded from the statistical analyses of track attributes for the remainder of the subsection.

The statistical properties of track direction and speed were studied with histograms of and . Figure 3 shows the histograms of and for a total of 8336 sample objects with valid future hourly tracks derived from the 2-min MRMS data of May 2019. The sample mean moving direction of 246° and speed of 51 km/h as well as ranges of values were close to those estimated by [15] using similar object-based methods and a different observation dataset and tracking method. Samples with seemingly extreme values of h (i.e., ) were subjectively examined and found to be storms that have undergone large structural deformation in addition to translation within the 1-hour period.
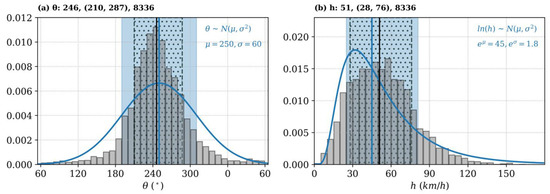
Figure 3.
Histogram of (a) track direction () and (b) track speed (h) for a total of 8336 sample objects with valid hourly future tracks. Sample mean, one standard deviation range and sample size are listed on top of the histograms. The blue curves are (a) normal and (b) lognormal distribution probability density functions (PDFs) we designed to fit the histograms.
To describe the statistical behaviors of and , we fitted two probability density functions (PDFs, blue curves), and , to the histograms of Figure 3 based on their shapes. Standard deviation parameters and were designed to be slightly larger than histogram-derived ones to account for geographical, diurnal and object-size-based variability of sample mean and h (see Figures S1 and S2). The slightly larger values of and were depicted in Figure 3 with blue shaded ranges, the one-standard-deviation distribution ranges ( and ) that is slightly wider than the corresponding histogram intervals shown by dotted hatchings. Because the two PDFs quantitatively described the general behavior of hourly storm motion for convective storms well resolved in hourly, 3 km observations, they can be utilized to (a) provide a “first-guess motion” to initialize the tracking of a storm object and (b) quantify the generic likelihood of any track derived within data of the same resolution.
Similarly, the generic hour-to-hour variation of moving direction and speed were studied with and for a total of 6531 sample objects with a valid future and past track. Figure 4 shows the histograms of and with two main findings: (a) the histograms of and were both symmetric and centered around 0, indicating there was no preferred direction in the changes of track direction and speed from the past hour to the current hour, and (b) the distributions of and were more concentrated about the mean than the distributions of and , suggesting extrapolation was more reliable than “first-guess” and should be used for predicting the motion of a storm if its immediate past/future motion was known. Similarly, we fitted two PDFs to the histograms of Figure 4 (blue curves, Gaussian) which were used to quantify the extrapolation-based likelihood of any track derived within data of the same resolution. Considering the relatively small motion variation between contiguous tracks, we can also devise a criterion stipulating how much motion deviation from its immediate past or future track is allowed should a derived track be real.
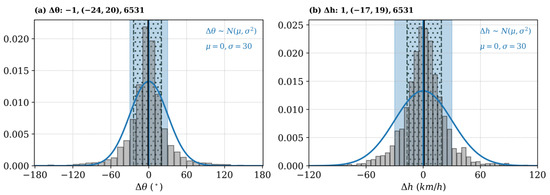
Figure 4.
As in Figure 3, but for (a) changes in track direction () and (b) changes in track speed ( ) for a total of 6531 sample objects with valid hourly future and past tracks. The blue curves in (a,b) are normal PDFs we designed to fit the histograms.
Other track-based attributes we studied include average storm intensity and size along the track and changes of storm intensity and size from the past track to the future track of the same object. These attributes were not used in the proposed tracking method because they were associated with very large sample/subsample uncertainties, providing little guidance for generic storm tracking on the target resolution.
2.3. Object Attributes to Infer Resolvability
As discussed in Section 2.2, an evaluation of how well a derived track has maintained steady motion can be used to infer whether the derived track is real, i.e., the objects within the track in fact continued from t to . With this attribute serving as a quality-control criterion, the number of false tracks connecting well-resolved storms to nearby, temporally not well resolved storms can be effectively reduced.
However, the above criterion cannot be used to reduce tracks connecting two temporally not well resolved storms, i.e., objects with no hourly tracks associated with them. To better identify these objects and limit the number of false tracks connecting them, we divided the identified MRMS objects from May 2019 into two groups, (a) objects with at least one derived hourly track (past and/or future) and (b) objects with no hourly tracks. Several object-based attributes were studied for the two groups and Figure 5 displayed the histograms of one object-based attribute, object size (), for the two groups of objects. It was apparent that the smaller the object, the less likely there existed an hourly track with the object, suggesting a parameter based on object size can be used to infer the likelihood of an object’s temporal resolvability and minimize tracks connecting temporally not well resolved objects.

Figure 5.
Object size histograms of (orange) temporally well-resolved and (blue) not well-resolved objects that appear on the hourly time frames of the 2-min MRMS composite reflectivity data from May 2019. An object is identified as temporally well resolved if it is associated with at least one future or past hourly track.
2.4. Adaptability of Baseline Parameters for Tracking CAM-Simulated Storm
Section 2.3 and Section 2.4 derived baseline parameters for reliably tracking observed convective storms in hourly MRMS data. Since CAM-simulated storms may have intrinsically different motion climatology, MRMS sample mean motion (from Figure 3) may not be appropriate to be used for tracking CAM-simulated storms. So, how well can MRMS-based parameters be adapted to reliably track simulated convective storms in hourly CAM forecasts?
Figure 6a,b shows an example of MRMS storms and the corresponding CAM-simulated storms at the analysis time of a MAP forecast. Most MRMS storms were well simulated by the MAP forecast shown in this case. Subjective evaluation of short-range 10-min MAP forecasts suggested that storms well simulated at analysis time were able to maintain observed motions for at least 1–2 h. Given the high-quality initial simulation of storms in MAP forecasts, we can match well-simulated storms to observed ones (see Figure 6c,d) and safely assume the observed motion, which can be derived using 2-min data, for each matched storm in Figure 6d. With these motions, the relationship between simulated storm motion and predictors like near-storm variables (such as wind, temperature) and storm attributes (such as size, location) can be explored. Because these predictors were available at all forecast hours, the relationship we learnt for a small number of well-simulated storms can be used to predict motion for any storm present in our CAM forecasts and construct a CAM-specific storm motion climatology.
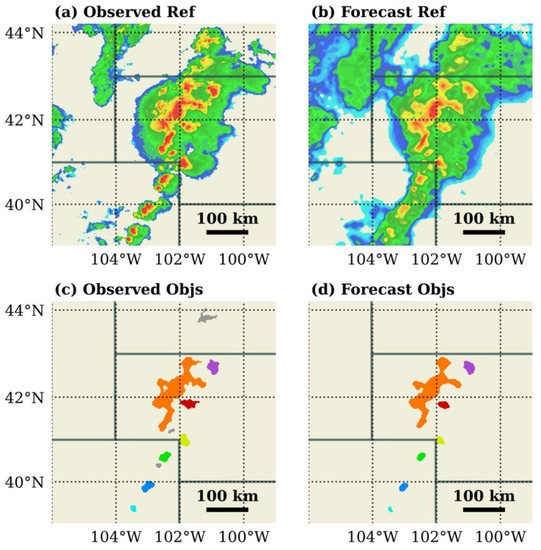
Figure 6.
(a) MRMS composite reflectivity and (b) simulated reflectivity at the analysis time of a CAM forecast produced by OU MAP; (c,d) identified objects for observed and simulated storms from (a,b). Distance-matched observed and simulated objects in (c,d) are displayed with the same colors.
Using the above strategy, we constructed and trained a multilayer perceptron model (MLP [20]) to learn the relationship between simulated storm motion and several predictors including near storm 500 hPa wind fields, storm size, location and intensity. Our data includes 425 well-simulated storm objects at the analysis time of 26 MAP forecasts produced during May 2019. After training the model with 80% of the data, we achieved an 85% accuracy (estimated with mean absolute error) on the remaining 20% test data. As will be detailed in Section 3, the trained MLP was used instead of the sample mean motion of Figure 3 to produce the generic PDFs used as “first-guess motions” for tracking simulated storm objects.
In addition to the 500 hPa wind fields, we also considered other potentially useful MLP predictors such as 0–6 km storm motion, 0–6 km vertical shear of horizontal wind, 700 hPa vertical velocity and 1–6 km updraft helicity. However, the correlations between these model variables and object-based storm motion were relatively low; incorporating them into the MLP model led to training data overfitting and reduced prediction accuracy.
Other MRMS-based parameters such as motion variation statistics and object size were directly adapted for CAM-based tracking. As will be introduced in Section 3, the algorithm initializes with and depends primarily on “first-guess motions”. The constraint of other parameters on the derivation of storm tracks were secondary.
3. Materials and Methods
This section presents the new object-based storm tracking algorithm. The output of the algorithm is a track-object network serving as an abstract representation of the temporal evolutions and interactions of all storms resolvable by the given data during a specified period. Once the track-object network is constructed, a new space-time object describing the evolution of each distinct storm from initiation to dissipation can be identified.
Resolution-dependent parameters to be used in the proposed algorithm were derived from Section 2 and can be applied to any data with the same resolution (i.e., hourly and 3 km). To demonstrate the general applicability of the algorithm, we use hourly MRMS observations and MAP forecasts from May 2018, a period different from the one used to derive baseline parameters, to illustrate and evaluate the proposed algorithm. MAP forecasts produced in May 2018 used the same configuration as the ones produced in May 2019 [21].
Data preprocessing and object identification were the same as in Section 2. Assuming each identified object describes one physically well-defined storm, the object-based tracking problem from t to is defined as to derive the tracks between object(s) identified at to object(s) identified at that most accurately describe the physical evolutions of storms. There are four types of tracks we could derive:
- A one-to-one track is the association of an object at to another object at . This is the most common type of track we derive, describing the independent evolution of a storm from to ;
- A many-to-one track is the association of multiple objects at to one object at . It describes the merging of several storms at into one storm at ;
- A one-to-many track is the association of one object at to multiple objects at . It describes the splitting of a storm at into several storms at ;
- A many-to-many track is the association of multiple objects at to multiple objects at . It describes the group tracking of several storms at t to several storms at . Because our goal is to separately track the evolutions of individual storms, this type of track is not considered in our solution.
Here is used to describe one-to-one tracks while describes tracks in general, including one-to-one and composite (i.e., many-to-one or one-to-many) tracks. For simplicity, we will use one-to-one tracks to define most quantities encountered in the algorithm, but they can be straightforwardly extended for composite tracks.
Our general tracking strategy is extrapolation. However, instead of extrapolating in the forward direction only, we start with the forward extrapolation from (the earliest time of the data) to (the latest time of the data). Once it finishes, we extrapolate backwards from to (e.g., hindcast) and update the tracking solution. The procedure is repeated multiple times until the tracking solution converges (i.e., the solution changes little from the last iteration to the current). The iterative design generally improves the tracking accuracy following the 2nd iteration, because each probable track can be more reliably determined with not only the past track of from to , but also the future track of from to .
As the iterative design suggests, the likelihood of a probable one-to-one track can be estimated by two conditional probabilities, and . Specifically, is the conditional probability that exists given (the past motion of) and it is estimated by
Here and are the probabilities of the direction and speed of conditioned on the past direction and speed of . Similarly, is the conditional probability of that exists given (the future motion of) and it is estimated by
with and denoting the probabilities of the direction and speed of conditioned on the future direction and speed of .
The past motion of (future motion of ) which the above probabilities are conditioned on is estimated using either (a) the past track of (future track of ) with extrapolation-based PDFs (derived from Figure 4) if the track exists, or (b) a “first-guess motion” with generic PDFs (in the case of MRMS observations, derived from Figure 3) or with mean motion predicted by MLP (in the case of CAM forecasts, detailed in Section 2.4). The two sets of PDFs as well as other parameters used in the tracking algorithm are listed in Table 2.

Table 2.
The parameters used for hourly tracking. and denote the direction and speed of the given past or future motion. and are parameters of the likelihood criterion applied in steps 2 and 6 of the proposed tracking.
Given the past (or future) motion, the conditional probability of a one-to-one track was estimated by first determining the speed and direction of the track itself and then identifying their probabilities and on the PDFs the track was conditioned on. With the two conditional probabilities, and , we can thoroughly analyze the likelihood of each from both sides and derive our solution, the set of most likely tracks from to , following a specific order guided by the conditional probabilities. The hierarchy of decision-making starts with a set of “base tracks” determined first. A track is identified as a base track if and only if it is the highest probability track among all probable s of and , describing the most likely one-to-one tracking solution. The second tier s to be decided are ones that are most likely according to one of the two conditional probabilities of each . All other one-to-one tracks are then decided according to their relationships with the base tracks and accepted second tier tracks.
During the multi-tiered decision-making process, the decision to accept or reject each one-to-one track is made upon diagnosing its relation to all the tracks that have already been accepted from to . Figure 7 schematically demonstrated all three scenarios regarding whether to accept a new (shown as a dashed red line). The already accepted tracks are shown as solid red lines. In Figure 7a, the new track is accepted because it is independent of the already accepted track. In the case of Figure 7b, the new track is rejected because it conflicts with already accepted tracks: accepting this track would lead to its combination with the two already accepted tracks into a many-to-many track, a type of track not allowed in our solution. Figure 7c shows the final type of decision-making scenario in which a composite track will be identified if the new track is accepted. In this situation, the new track shares the same object with one of the already accepted tracks and we need to conduct a quantitative evaluation to help make the decision. The evaluation examines whether combining the new track with the already accepted track into a many-to-one track would improve the probability () of the track. A detailed description of the quantitative evaluation will be presented in Step 4a of the algorithm (below). If the probability is improved, the new track will be accepted and incorporated into the already accepted track as a composite track.
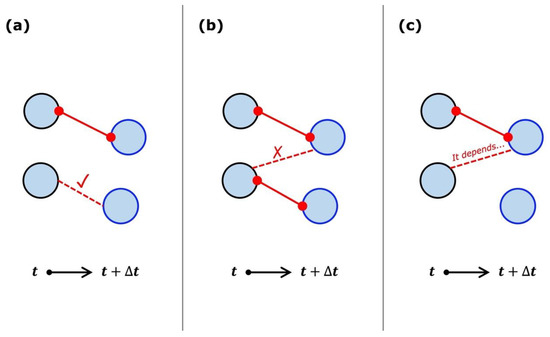
Figure 7.
Schematic illustrations of whether to accept or reject a new (shown as red dashed line) in three different scenarios (see text): (a) the new track is independent of the already accepted track, (b) the new track conflicts with already accepted tracks, and (c) the new track shares an object with the already accepted track the already accepted tracks are shown as red solid lines. Circles marked by black and blue outlines represent objects at and , respectively.
To avoid false connections associated with temporally not well resolved storms, each track derived during the process is further evaluated with a likelihood criterion based on (a) the sizes of objects within the track or (b) whether steady motion is well maintained. The likelihood criterion was implemented in Step 2 (for one-to-one tracks) and Step 6 (for composite tracks) of the algorithm (below). If the track is derived by first-guess motions only, the criterion evaluates the sizes of objects within the tracks: both sides of the track must include at least one object whose size is greater than (equivalent to ~ in diameter, from Figure 5) to pass the criterion. If the track is derived by past and/or future motions, the criterion evaluates whether steady motion is well maintained: changes in the moving direction between the current track and its immediate previous (or future) track must be smaller than to pass the criterion. For slow-moving storms with large structural deformations, translation rather than centroid-based motion estimates are used for steady motion evaluation. Specifically, we attempt to translate of using the past moving direction(s) of until the translated object maximally overlaps with as indicated by the overlap ratio . The procedure is done similarly to with the future moving direction(s) of . The maximum overlap ratios of derived by past and/or future motion must be greater than 0.5 to pass the criterion.
The step-by-step description of the algorithm is as follows. To facilitate the understanding of the algorithm, we also provided an MRMS example featuring the hourly development of three closely spaced storms in Figure 8 and the step-by-step break-down of the algorithm in deriving the hourly tracks in Figure 9. The example will be discussed further after the algorithm description.
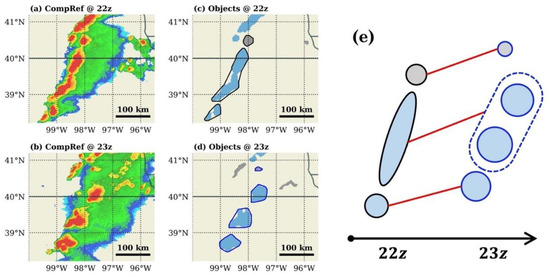
Figure 8.
(a,b) MRMS composite reflectivity and (c,d) identified objects for 22 z and 23 z, 1 May 2018. Blue (gray) shaded objects in (c,d) are objects larger (smaller) than . The actual evolutions of the black contoured objects in ((c), 22 z) to the blue contoured objects in ((d), 23 z) is schematically shown in (e) by the red lines.
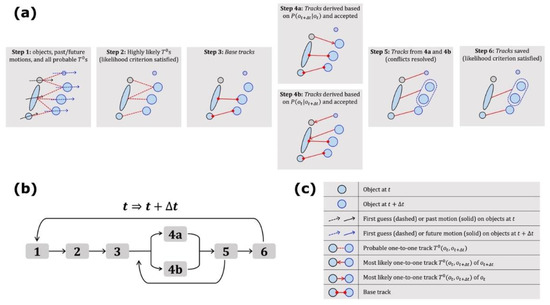
Figure 9.
(a) Schematic illustration of the six steps to identify hourly tracks for the example of Figure 7, (b) workflow of the algorithm and (c) descriptions of selected symbols in (a).
Step 1: Estimate conditional probabilities, and , for each probable .
Step 2: To avoid false tracks connecting temporally not well resolved storms, each probable is further evaluated using the likelihood criterion defined above.
Step 3: Derive base tracks. A base track satisfies the following three conditions: (a) it is the most likely track among all one-to-one tracks of according to , (b) it is the most likely track among all one-to-one tracks of according to and (c) it satisfies the likelihood criterion of step 2.
Step 4 contains two independent and recursive steps: 4a and 4b, which decide the acceptance or rejection of each probable but undecided in the order determined by the past motion- and future motion-based probabilities in 4a and 4b, respectively.
Step 4a (recursive): For every object at that is not already associated with a track from step 3 and 4a, select the most likely and not yet rejected based on . For each of the selected s, accept it if it is not related to any existing tracks derived from step 3 and 4a and reject it if it conflicts with certain existing tracks derived from step 3 and 4a. If the shares the same object (i.e., ) to an existing track, decide whether to accept it by an evaluation of whether track likelihood improves if the two are combined. For example, the decision on whether to accept a new track , given an already accepted track is made after the evaluation of whether and merge, i is the more likely scenario than evolving into . The track is accepted if and only if (a) the probability () of the composite track conditioned on is larger than and (b) the probability of conditioned on is larger than . If accepted, the track is incorporated into the existed track as a composite track. If rejected, search for the next most likely and not yet rejected of according to and repeat 4a until we’ve accepted at least one (or have rejected them all) for every object at . The track derived from 4a is either one-to-one or many-to-one.
Step 4b (recursive): For every object at that is not already associated with a track from step 3 and 4b, select the most likely and not yet rejected based on and decide whether to accept it based on its relationship with already accepted tracks (from step 3 and 4b via similar decision-making flow as 4a). If the most likely of is rejected, search for the next most likely and not yet rejected of according to and repeat 4b until we have accepted at least one (or have rejected them all) for every object at . The track derived from 4b is either one-to-one or one-to-many.
Step 5 (recursive): Examine and resolve conflicting tracks of 4a and 4b. Track(s) from 4a conflict with track(s) from 4b if they share some, but not all objects. The conflict must be resolved because accepting both may lead to an ambiguous tracking of many to many. To resolve the conflict, we estimate the probabilities of the conflicting 4a and 4b tracks conditioned on all the objects involved and derive two object area weighted average probabilities, one for all the involved 4a tracks and the other for all the involved 4b tracks. The set of tracks with higher (lower) average probability is accepted (rejected). For each rejected track, we remove the non-base part of the track and repeat step 4 until the object associated with the removed track is reassigned with a new . This step is also recursive: it finishes when tracks from 4a and 4b has no conflicts. The track derived from step 5 may be one-to-one, one-to-many, or many-to-one.
Step 6: The same as step 2 but applied to tracks identified in step 5. Tracks that fail the likelihood criterion are deleted.
Figure 9a shows the step-by-step derivations leading to the final tracking results for the Figure 8 case during the first round of extrapolation. The tracks identified by the proposed algorithm indicate that the bottom cell at 22 z continued as cell, the middle line storm split into two cell storms, while the top cell dissipated, which were consistent with the actual evolutions of the storms shown in Figure 8e except the top one. The track for the top cell was correctly derived in step 5 but deleted in step 6 because it was derived by first-guess motions only and the object sizes within the track were too small to satisfy the likelihood criterion we designed. Since there was no future track existed to re-evaluate the validity of the deleted track as the storm dissipated shortly after 23 z, this track would not be identified even after multiple rounds of extrapolation. In other words, it is by design of our algorithm to not identify tracks associated with such short-lived () storms because they are not well-resolved by .
After we apply the tracking algorithm to all consecutive time frames of a selected case, a space-time network of track-connected objects is derived. This track-object network serves as an abstract representation of convective storm evolutions and interactions well-resolved by the given data. Because the track-object network resolves storm interactions such as merging and splitting, a separate identification for each storm trajectory is not always straightforward without rules stipulating what constitutes a distinct storm trajectory and how storm interactions would be handled as a result.
Here we formally present the rules for the identification of distinct storm trajectories from the track-object network. Each separately identified storm trajectory, which we will refer to as object trajectory (OT) hereafter, is a track-connected object time series describing the complete and distinct evolution of a storm from initiation to dissipation. There are different ways to identify OTs depending on how one specifies the distinctness of a storm trajectory. As an example of OT identification focusing on the distinctness of convection initiation (CI), here we consider a storm trajectory to be distinct if and only if its CI is unique. In other words, the number of OTs we identify should be the same as the number of resolvable individual CI objects that exist. What does this mean for storms that underwent merging and splitting? (a) For individually evolving storms that later merged, OTs would be identified, each with a unique initial portion and a shared portion after the merge. (b) For a storm that later split, all of its split storms would be collectively identified as one OT as before the split, unless (c) one of the split storms later merges with another distinct storm. In the special case of (c), the split storm will be treated as a new storm starting at the split time, as was similarly done in [15]. Figure 10 shows a schematic track-object network with all three scenarios included. Under the proposed rules, 3 OTs (e.g., blue shades, green shades, black contours) would be identified in Figure 10, each representing a storm trajectory with a unique CI marked by solid triangles.
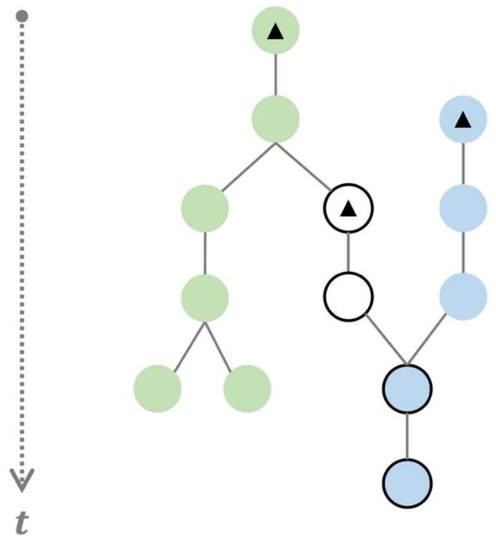
Figure 10.
Schematic illustration of a track-object network and all the OTs to be identified. The initial object (or CI) for each identified OT is marked with a black solid triangle. Three OTs are identified from this network as marked by green shades, blue shades and black outlines.
4. Results and Discussion
Figure 11 demonstrates the proposed tracking method with a complex storm evolution example from May 2018. Panel a and c of Figure 11 shows hourly snapshots of composite reflectivity from MRMS and simulated reflectivity from 0–5 h MAP forecast during 00–05 z, 11 May 2018; the objects and hourly OTs identified during the period are shown in panel b and d. Identified objects are illustrated by color-shaded regions with contours and blue (gray) color denotes storms larger (smaller) than . The track-object network is demonstrated by the piece-wise linear curves with each linear segment representing one hourly track. At each hourly time frame, the evolution of each well-resolved storm is displayed in detail including the current storm location (blue dot), past-hour location and track (gray dots and lines) and future locations and tracks until dissipation (black dots and lines). Storm merging is illustrated by two or more linear segments arriving at the same point (e.g., in Figure 11(b3,d6)). A black circle around the blue dot indicates that the object is the unique CI object of a distinct OT. In this example, we identified four observed CIs (at 03 z and 05 z) and two forecast CIs (at 02 z and 05 z).
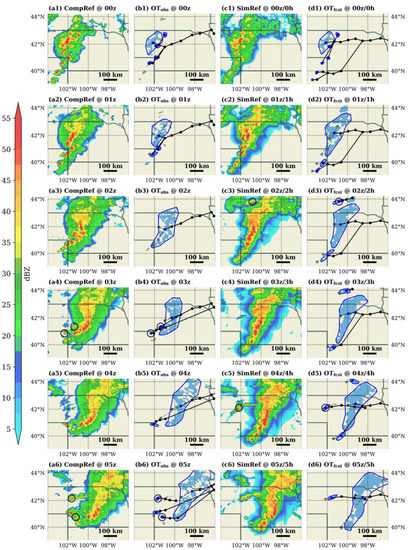
Figure 11.
(a1–a6) MRMS composite reflectivity, (b1–b6) MRMS objects and hourly OTs identified, and (c1–c6) 0–5 h MAP forecast simulated reflectivity and (d1–d6) forecast objects and hourly OTs during 00–05 z, 11 May 2018. CI objects of distinct hourly OTs are marked by black circles. Objects larger (smaller) than are colored with blue (gray) shades.
MRMS reflectivity snapshots of Figure 11a indicate a convectively active region with an upscale-growing mesoscale convective system (MCS) moving towards the east and new cells emerged from the south and west that quickly merged with the MCS. Simulated storm evolution by 0–5 h MAP forecast in Figure 11c shared key characteristics with the observed system including the general moving direction and speed of the MCS, the merging of the MCS with smaller cells to its south, and subsequent emergence of new cells from the west of the MCS. What’s different in the forecast is the strength of cells to the southwest of MCS and the timings and locations of the new CIs. The OT-based demonstration in Figure 11b,d suggests that the proposed tracking method can reliably identify these key evolution characteristics in both data. In particular, the tracking method correctly displayed the distinct evolution patterns of the two cells to the southwest of the MCS from 00 z to 02 z. The two cells were smaller than in both data, suggesting they were likely too small to be temporally well resolved. Subsequent evolution patterns confirm that the observed ones did dissipate shortly after initiation, but the forecast ones grew and later merged with the MCS at 05 z, both of which were accurately described by the derived tracks. Recognizing such subtle differences may be key to the diagnosis of subsequent forecast degradation; automating such a time-consuming task with a reliable tracking method is vital for the systematic evaluation of CAM forecasts.
To quantitatively evaluate the performance of the proposed tracking algorithm, four severe weather events of May 2018 (May 01–04, from 12 z to 12 z, according to the SPC severe weather event archive) were selected. These events offer 608 hourly MRMS tracks derived with the proposed method to be evaluated against validation tracks independently obtained using 2-min MRMS data and the method of Section 2. As discussed before, tracks derived with the method of Section 2 may be many-to-many if storm evolution within the period was complex on the 2 min level (i.e., both merging and splitting occurred). In situations where the validation track associated with an object is many-to-many, we conduct manual checks to determine the correctness of the derived track since many-to-many tracks are excluded from the solution of our tracking method. Approximately 70% of the 608 derived tracks were objectively evaluated and the remaining 30% underwent manual checks. To the authors’ knowledge, this is the first time an independent, objective evaluation has been conducted for algorithm-derived storm tracks. It is made possible since the proposed method allows explicit tracking of storm merging and splitting. The evaluation results were given in Table 3. The 99% overall accuracy rates suggest the algorithm performs reasonably well. The algorithm was especially robust in complex cases where individual storms were located very close to each other compared to their spatial extents and moving speeds but maintained relatively consistent motions (see Figure S3). Upon examining the 1% erroneous tracks, we found that they were derived mostly in situations where storms underwent (at current step, ) or had undergone (previous step, ) complex deformations such as splitting and merging with another storm soon thereafter, cell forms nearby that quickly merged with an existing storm and large shape deformation. In these situations, the derived tracks were less reliable mainly because the object-based estimates of storm motion were less accurate.

Table 3.
Sample size (number # of identified tracks), number # of incorrect tracks and accuracy rate for the selected four severe weather cases of May 2018. The verification period for each case is from 12 z to 12 z the next day.
As discussed in Section 3, a unique feature of the proposed tracking technique is its ability to identify distinct CIs, the initial object of each identified OT. Object-based CI identification is an active research area with many CAM-based applications [15,22,23]. However, the accuracy of existing methodologies was rarely evaluated. To systemically evaluate the accuracy of CIs identified by the proposed method, we examined the tracks associated with all algorithm-identified CIs in the following two aspects: (a) whether the object was a CI (i.e., it was not associated with a past validation track) and (b) whether the future track associated with the CI object was consistent with validation. The special case for which an identified CI is not a new cell, but a split of an existing storm was manually evaluated; it was considered correct if the continued track(s) of the existing storm via its other split(s) were accurately identified by the algorithm, as was similarly done in [15].
The CI evaluation results for the four severe weather events are presented in Table 4. The overall accuracy rate of CI identification is 95.9% for a total of 123 algorithm-identified CIs. If the identified CIs missed by 1 h are considered accurate, the overall CI identification accuracy rate reaches 98.4%. These numbers suggest that the algorithm performs reasonably well in terms of accurate CI identification.

Table 4.
Sample size (number # of identified CI objects), number # of CI missed by 1 h and number of incorrect CIs for the selected 4 severe weather cases of May 2018. The verification period for each case is from 12 z to 12 z the next day.
5. Conclusions
An object-based method to reliably track convective storms depends on the complexity of storm evolution patterns and the temporal resolution () of the data relative to the spatial and temporal scales of the storm. The steady-state assumption commonly used in object-based storm tracking algorithms may be ill-suited if the storm underwent complex evolution or, in the case of CAM-based tracking, the output frequency of the data is too coarse to resolve a considerable amount of spatially well resolved storms.
To overcome the above limitations and more reliably track simulated convective storms in CAM outputs of temporal resolution , this study proposed an object-based method with two new features. First, the method explicitly estimated the probability of each probable track, which is conditioned either on its immediate past and future motion or a “first guess motion” if the immediate past or future motion does not exist. This probability approach was realized by parameters of an independent analysis of storm evolution with tracks derived from the 2-min MRMS data and hourly MAP forecasts from May 2019. Second, a likelihood criterion evaluating whether a derived track is real was designed. The purpose of the criterion is to better identify storms that were newly formed and/or dissipating and minimize false tracks derived for these storms. The design of the likelihood criterion was motivated by two main findings from the 2-min MRMS study: (a) the past and future track motions of the same storm are highly consistent, and (b) there is a noticeable size difference between storms that had continued from to and ones that dissipated and/or were newly formed between and .
After tracking completes for all contiguous time steps of a selected case, a track-object network will be derived and serve as an abstract description of all the storm evolutions and interactions resolvable by the given data. Object trajectory (OT), the diagnostic product identified from the track-object network, was formally introduced. Each OT is a track-connected object time series that characterizes the space-time structure of an individual storm with a unique CI. Examples of identified OTs in real cases showed the capability of this diagnostic to highlight newly initiated storms and simplify the display of complex storm evolutions so subtle differences between the evolution patterns of observation and CAM forecast can be easily spotted.
The new tracking method was applied to hourly MRMS observations and MAP forecasts from May 2018. Its performance for tracking convective storms was demonstrated using complex storm evolution examples and systematic evaluations of four severe weather events with more than 600 derived tracks and over 100 identified CIs. The evaluations indicate 99% and 95.9% accuracy rates were achieved for hourly MRMS tracks and CIs derived by the proposed method.
Future research will focus on the adaptability of MRMS-based parameters to track simulated convective storms in other CAM-based systems and the design of OT-based methods for evaluating different aspects of simulated storm evolutions in CAM forecasts.
Supplementary Materials
The following are available online at https://www.mdpi.com/article/10.3390/atmos12111535/s1: Figure S1: Histograms of track direction () for objects located at different regions of CONUS: (a) Northern Plains (north of 37° N and west of 108° W), (b) Southern Plains (south of 37° N and west of 108° W), (c) Northeast (north of 37° N and east of 108° W) and (d) Southeast (south of 37° N and east of 108° W); (e–h) for objects present at different time periods of a day and (i–l) for objects in different size groups. Sample mean, one standard deviation range and sample size are listed on top of the histograms. The PDFs plotted on top of the histograms (blue curve) are the same as in Figure 3a., Figure S2: As in Figure S1, but for track speed (h). The PDFs plotted on top of the histograms (blue curve) are the same as in Figure 3b., Figure S3: (panel a) Hourly snapshots of MRMS composite reflectivity and (panel b) objects identified during 01–05 z 02 May 2018, with identified OTs overlaid.
Author Contributions
Conceptualization, F.H.; methodology, F.H.; software, F.H. and X.W.; validation, F.H.; formal analysis, F.H.; investigation, F.H.; resources, X.W.; data curation, F.H. and X.W.; writing—original draft preparation, F.H.; writing—review and editing, F.H. and X.W.; visualization, F.H.; supervision, X.W.; project administration, X.W.; funding acquisition, X.W. All authors have read and agreed to the published version of the manuscript.
Funding
This research was funded by NOAA, grant number NA17OAR4590116.
Institutional Review Board Statement
Not applicable.
Informed Consent Statement
Not applicable.
Data Availability Statement
The data presented in this study are available on request from the authors.
Acknowledgments
The authors appreciate helpful discussions by Yongming Wang and Aaron Johnson in the University of Oklahoma (OU) Multiscale data Assimilation and Predictability (MAP) lab. The computing for this project was performed at the OU Supercomputing Center for Education and Research (OSCER). The reflectivity plots were generated using the “pyart_NWSRef” colormap of the Python Atmospheric Radiation Measurement (ARM) Radar Toolkit (Py-ART [24]).
Conflicts of Interest
The authors declare no conflict of interest.
References
- Dixon, M.; Wiener, G. TITAN: Thunderstorm identification, tracking, analysis, and nowcasting—A radar-based methodology. J. Atmos. Ocean. Technol. 1993, 10, 785–797. [Google Scholar] [CrossRef]
- Johnson, J.; MacKeen, P.L.; Witt, A.; Mitchell, E.D.W.; Stumpf, G.J.; Eilts, M.D.; Thomas, K.W. The storm cell identification and tracking algorithm: An enhanced WSR-88D algorithm. Weather Forecast. 1998, 13, 263–276. [Google Scholar] [CrossRef] [Green Version]
- Wilson, J.W.; Crook, N.A.; Mueller, C.K.; Sun, J.; Dixon, M. Nowcasting Thunderstorms: A Status Report. Bull. Am. Meteorol. Soc. 1998, 79, 2079–2099. [Google Scholar] [CrossRef]
- Xue, M.; Kong, F.; Weber, D.; Thomas, K.W.; Wang, Y.; Brewster, K.; Droegemeier, K.K.; Kain, J.S.; Weiss, S.J.; Bright, D.R.; et al. CAPS realtime storm-scale ensemble and high-resolution forecasts as part of the NOAA Haz-ardous Weather Testbed 2007 spring experiment. In Proceedings of the 22nd Conference on Weather Analysis and Forecasting/18th Conference on Numerical Weather Prediction, Park City, UT, USA, 25–29 June 2007. [Google Scholar]
- Bentzien, S.; Friederichs, P. Generating and Calibrating Probabilistic Quantitative Precipitation Forecasts from the High-Resolution NWP Model COSMO-DE. Weather Forecast. 2012, 27, 988–1002. [Google Scholar] [CrossRef]
- Tennant, W. Improving initial condition perturbations for MOGREPS-UK. Q. J. R. Meteorol. Soc. 2015, 141, 2324–2336. [Google Scholar] [CrossRef]
- Schwartz, C.S.; Romine, G.S.; Weisman, M.L.; Sobash, R.A.; Fossell, K.R.; Manning, K.W.; Trier, S.B. A Real-Time Convection-Allowing Ensemble Prediction System Initialized by Mesoscale Ensemble Kalman Filter Analyses. Weather Forecast. 2015, 30, 1158–1181. [Google Scholar] [CrossRef]
- Clark, A.J.; Bullock, R.G.; Jensen, T.L.; Xue, M.; Kong, F. Application of Object-Based Time-Domain Diagnostics for Tracking Precipitation Systems in Convection-Allowing Models. Weather Forecast. 2014, 29, 517–542. [Google Scholar] [CrossRef] [Green Version]
- Skinner, P.S.; Wheatley, D.M.; Knopfmeier, K.H.; Reinhart, A.E.; Choate, J.J.; Jones, T.A.; Creager, G.J.; Dowell, D.C.; Alexander, C.R.; Ladwig, T.T.; et al. Object-Based Verification of a Prototype Warn-on-Forecast System. Weather Forecast. 2018, 33, 1225–1250. [Google Scholar] [CrossRef]
- Han, L.; Fu, S.; Zhao, L.; Zheng, Y.; Wang, H.; Lin, Y. 3D Convective Storm Identification, Tracking, and Forecasting—An Enhanced TITAN Algorithm. J. Atmos. Ocean. Technol. 2009, 26, 719–732. [Google Scholar] [CrossRef]
- Lakshmanan, V.; Smith, T. An Objective Method of Evaluating and Devising Storm-Tracking Algorithms. Weather Forecast. 2010, 25, 701–709. [Google Scholar] [CrossRef]
- Kyznarová, H.; Novak, P. CELLTRACK—Convective cell tracking algorithm and its use for deriving life cycle characteristics. Atmos. Res. 2009, 93, 317–327. [Google Scholar] [CrossRef]
- Judy, M. Multiple Hypothesis Tracking and Strong Point Analysis for Storm Tracking with Weather Radar. Master’s Thesis, University of Oklahoma, Norman, OK, USA, 2020. [Google Scholar]
- Gagne, D.J.; McGovern, A.; Haupt, S.E.; Sobash, R.A.; Williams, J.K.; Xue, M. Storm-based probabilistic hail fore-casting with machine learning applied to convection-allowing ensembles. Weather Forecast. 2017, 32, 1819–1840. [Google Scholar] [CrossRef]
- VandenBerg, M.A.; Coniglio, M.C.; Clark, A.J. Comparison of Next-Day Convection-Allowing Forecasts of Storm motion on 1- and 4-km Grids. Weather Forecast. 2014, 29, 878–893. [Google Scholar] [CrossRef]
- Smith, T.M.; Lakshmanan, V.; Stumpf, G.J.; Ortega, K.; Hondl, K.; Cooper, K.; Calhoun, K.; Kingfield, D.; Manross, K.L.; Toomey, R.; et al. Multi-Radar Multi-Sensor (MRMS) Severe Weather and Aviation Products: Initial Operating Capabilities. Bull. Am. Meteorol. Soc. 2016, 97, 1617–1630. [Google Scholar] [CrossRef]
- Hou, J.; Wang, P. Storm Tracking via Tree Structure Representation of Radar Data. J. Atmos. Ocean. Technol. 2017, 34, 729–747. [Google Scholar] [CrossRef]
- Zan, B.; Yu, Y.; Li, J.; Zhao, G.; Zhang, T.; Ge, J. Solving the storm split-merge problem—A combined storm iden-tification, tracking algorithm. Atmos. Res. 2019, 218, 335–346. [Google Scholar] [CrossRef]
- Huttenlocher, D.; Klanderman, G.; Rucklidge, W. Comparing images using the Hausdorff distance. IEEE Trans. Pattern Anal. Mach. Intell. 1993, 15, 850–863. [Google Scholar] [CrossRef] [Green Version]
- Gardner, M.W.; Dorling, S.R. Artificial neural networks (the multilayer perceptron)—A review of applications in the atmospheric sciences. Atmos. Environ. 1998, 32, 2627–2636. [Google Scholar] [CrossRef]
- Johnson, A.; Wang, X.; Wang, Y.; Reinhart, A.; Clark, A.J.; Jirak, I.L. Neighborhood- and Object-Based Probabilistic Verification of the OU MAP Ensemble Forecasts during 2017 and 2018 Hazardous Weather Testbeds. Weather Forecast. 2020, 35, 169–191. [Google Scholar] [CrossRef]
- Burghardt, B.J.; Evans, C.; Roebber, P.J. Assessing the Predictability of Convection Initiation in the High Plains Using an Object-Based Approach. Weather Forecast. 2014, 29, 403–418. [Google Scholar] [CrossRef]
- Degelia, S.K.; Wang, X.; Stensrud, D.J.; Turner, D.D. Systematic Evaluation of the Impact of Assimilating a Network of Ground-Based Remote Sensing Profilers for Forecasts of Nocturnal Convection Initiation during PECAN. Mon. Weather Rev. 2020, 148, 4703–4728. [Google Scholar] [CrossRef]
- Helmus, J.J.; Collis, S.M. The Python ARM Radar Toolkit (Py-ART), a Library for Working with Weather Radar Data in the Python Programming Language. J. Open Res. Softw. 2016, 4. [Google Scholar] [CrossRef] [Green Version]
Publisher’s Note: MDPI stays neutral with regard to jurisdictional claims in published maps and institutional affiliations. |
© 2021 by the authors. Licensee MDPI, Basel, Switzerland. This article is an open access article distributed under the terms and conditions of the Creative Commons Attribution (CC BY) license (https://creativecommons.org/licenses/by/4.0/).