Article

Research on the Temporal and Spatial Characteristics of Air Pollutants in Sichuan Basin

College of New Energy and Environment, Jilin University, Changchun 130012, China
*
Author to whom correspondence should be addressed.
Atmosphere 2021, 12(11), 1504; https://doi.org/10.3390/atmos12111504
Submission received: 15 September 2021 / Revised: 11 November 2021 / Accepted: 13 November 2021 / Published: 15 November 2021
(This article belongs to the Special Issue Air Pollution in China)

Abstract

:
Sichuan Basin is one of the most densely populated areas in China and the world. Human activities have great impact on the air quality. In order to understand the characteristics of overall air pollutants in Sichuan Basin in recent years, we analyzed the concentrations of six air pollutants monitored in 22 cities during the period from January 2015 to December 2020. During the study period, the annual average concentrations of CO, NO2, SO2, PM2.5 and PM10 all showed a clear downward trend, while the ozone concentration was slowly increasing. The spatial patterns of CO and SO2 were similar. High-concentration areas were mainly located in the western plateau of Sichuan Basin, while the concentrations of NO2 and particulate matter were more prominent in the urban agglomerations inside the basin. During the study period, changes of the monthly average concentrations for pollutants (except for O3) conformed to the U-shaped pattern, with the highest in winter and the lowest in summer. In the southern cities of the basin, secondary sources had a higher contribution to the generation of fine particulate matter, while in large cities inside the basin, such as Chengdu and Chongqing, air pollution had a strong correlation with automobile exhaust emissions. The heavy pollution incidents observed in the winter of 2017 were mainly caused by the surrounding plateau terrain with typical stagnant weather conditions. This finding was also supported by the backward trajectory analysis, which showed that the air masses arrived in Chengdu were mainly from the western plateau area of the basin. The results of this study will provide a basis for the government to take measures to improve the air quality in Sichuan Basin.

1. Introduction

In the past 20 years, China has experienced severe air pollution due to rapid economic development and increasing urbanization [1]. Studies showed that exposure to ambient air pollution has been associated with increased risks of mortality and morbidity worldwide [2,3]. According the Global Burden of Disease (GBD) project, air pollution was responsible for 1.6 million deaths in China and 4.2 million deaths worldwide in 2015 [4]. The continuous and serious air pollution has caused an immense burden for China’s medical and economic [5]. In order to cope with serious air quality problems, China has taken a series of measures in recent years [6,7].
In 2005 and 2011, China implemented the installation of desulphurization and selective catalytic reduction (SCR) systems for coal-fired power plants [8]. At the same time, the strategies of upgrading vehicle fuel and prohibiting polluting old vehicles were introduced at the city level [9]. The Ministry of Environmental Protection of China issued the revised “Ambient Air Quality Standards” (CAAQS, GB3095-2012) in February 2012, adding PM2.5 and O3 to CAAQS for the first time [10]. In 10 September 2013, the Chinese government promulgated the Air Pollution Prevention and Control Action Plan. The plan aimed to reduce the number of severely polluted days drastically and improve the national air quality significantly through long-term efforts [11]. Despite these efforts, there were still many cities that have not yet reached the current CAAQS [12]. According to the “2020 Reports on the State of Environment of China”, there were still 135 cities whose ambient air quality exceeded the standard, accounting for 40.1% of the total number of cities. In the days exceeding the standard, the proportions of PM2.5, O3, and PM10 as the primary pollutants were 51%, 37.1%, and 11.7%, respectively.
Previous studies showed that Beijing-Tianjin-Hebei area (BTH), Yangtze River Delta (YRD), Pearl River Delta (PRD) and Sichuan Basin were the four main regions with severe air pollution in China [13,14]. In Beijing, YRD and PRD, some scholars have carried out a lot of research to understand the basic characteristics, chemical mechanisms, main components and transmission sources of air pollution [15,16,17,18,19]. Since 2000, the air quality in Sichuan Basin has further deteriorated due to increased anthropogenic emissions. However, only a few studies have focused on Sichuan Basin [20,21]. And in the past, related studies on Sichuan Basin were mainly concentrated in the two megacities of Chongqing and Chengdu, and there were few studies on the overall air quality for the whole of large-scale valley terrain [22,23]. The characteristics and source of air pollution for Sichuan Basin in recent years are still unclear [24]. In this study, we analyzed air quality data collected from Sichuan Basin for six years (January 2015 to December 2020) to fill this gap. The main goal is to investigate (1) the temporal and spatial characteristics of the overall air pollution in Sichuan Basin, (2) the industry contribution reflected by the ratio of different pollutants, and (3) a regional-scale air pollution episode that influenced multiple cities in the region. The knowledge gained in this study provides a scientific basis for formulating future emission control policies aimed at reducing severe PM2.5 pollution in this unique watershed

2. Materials and Methods

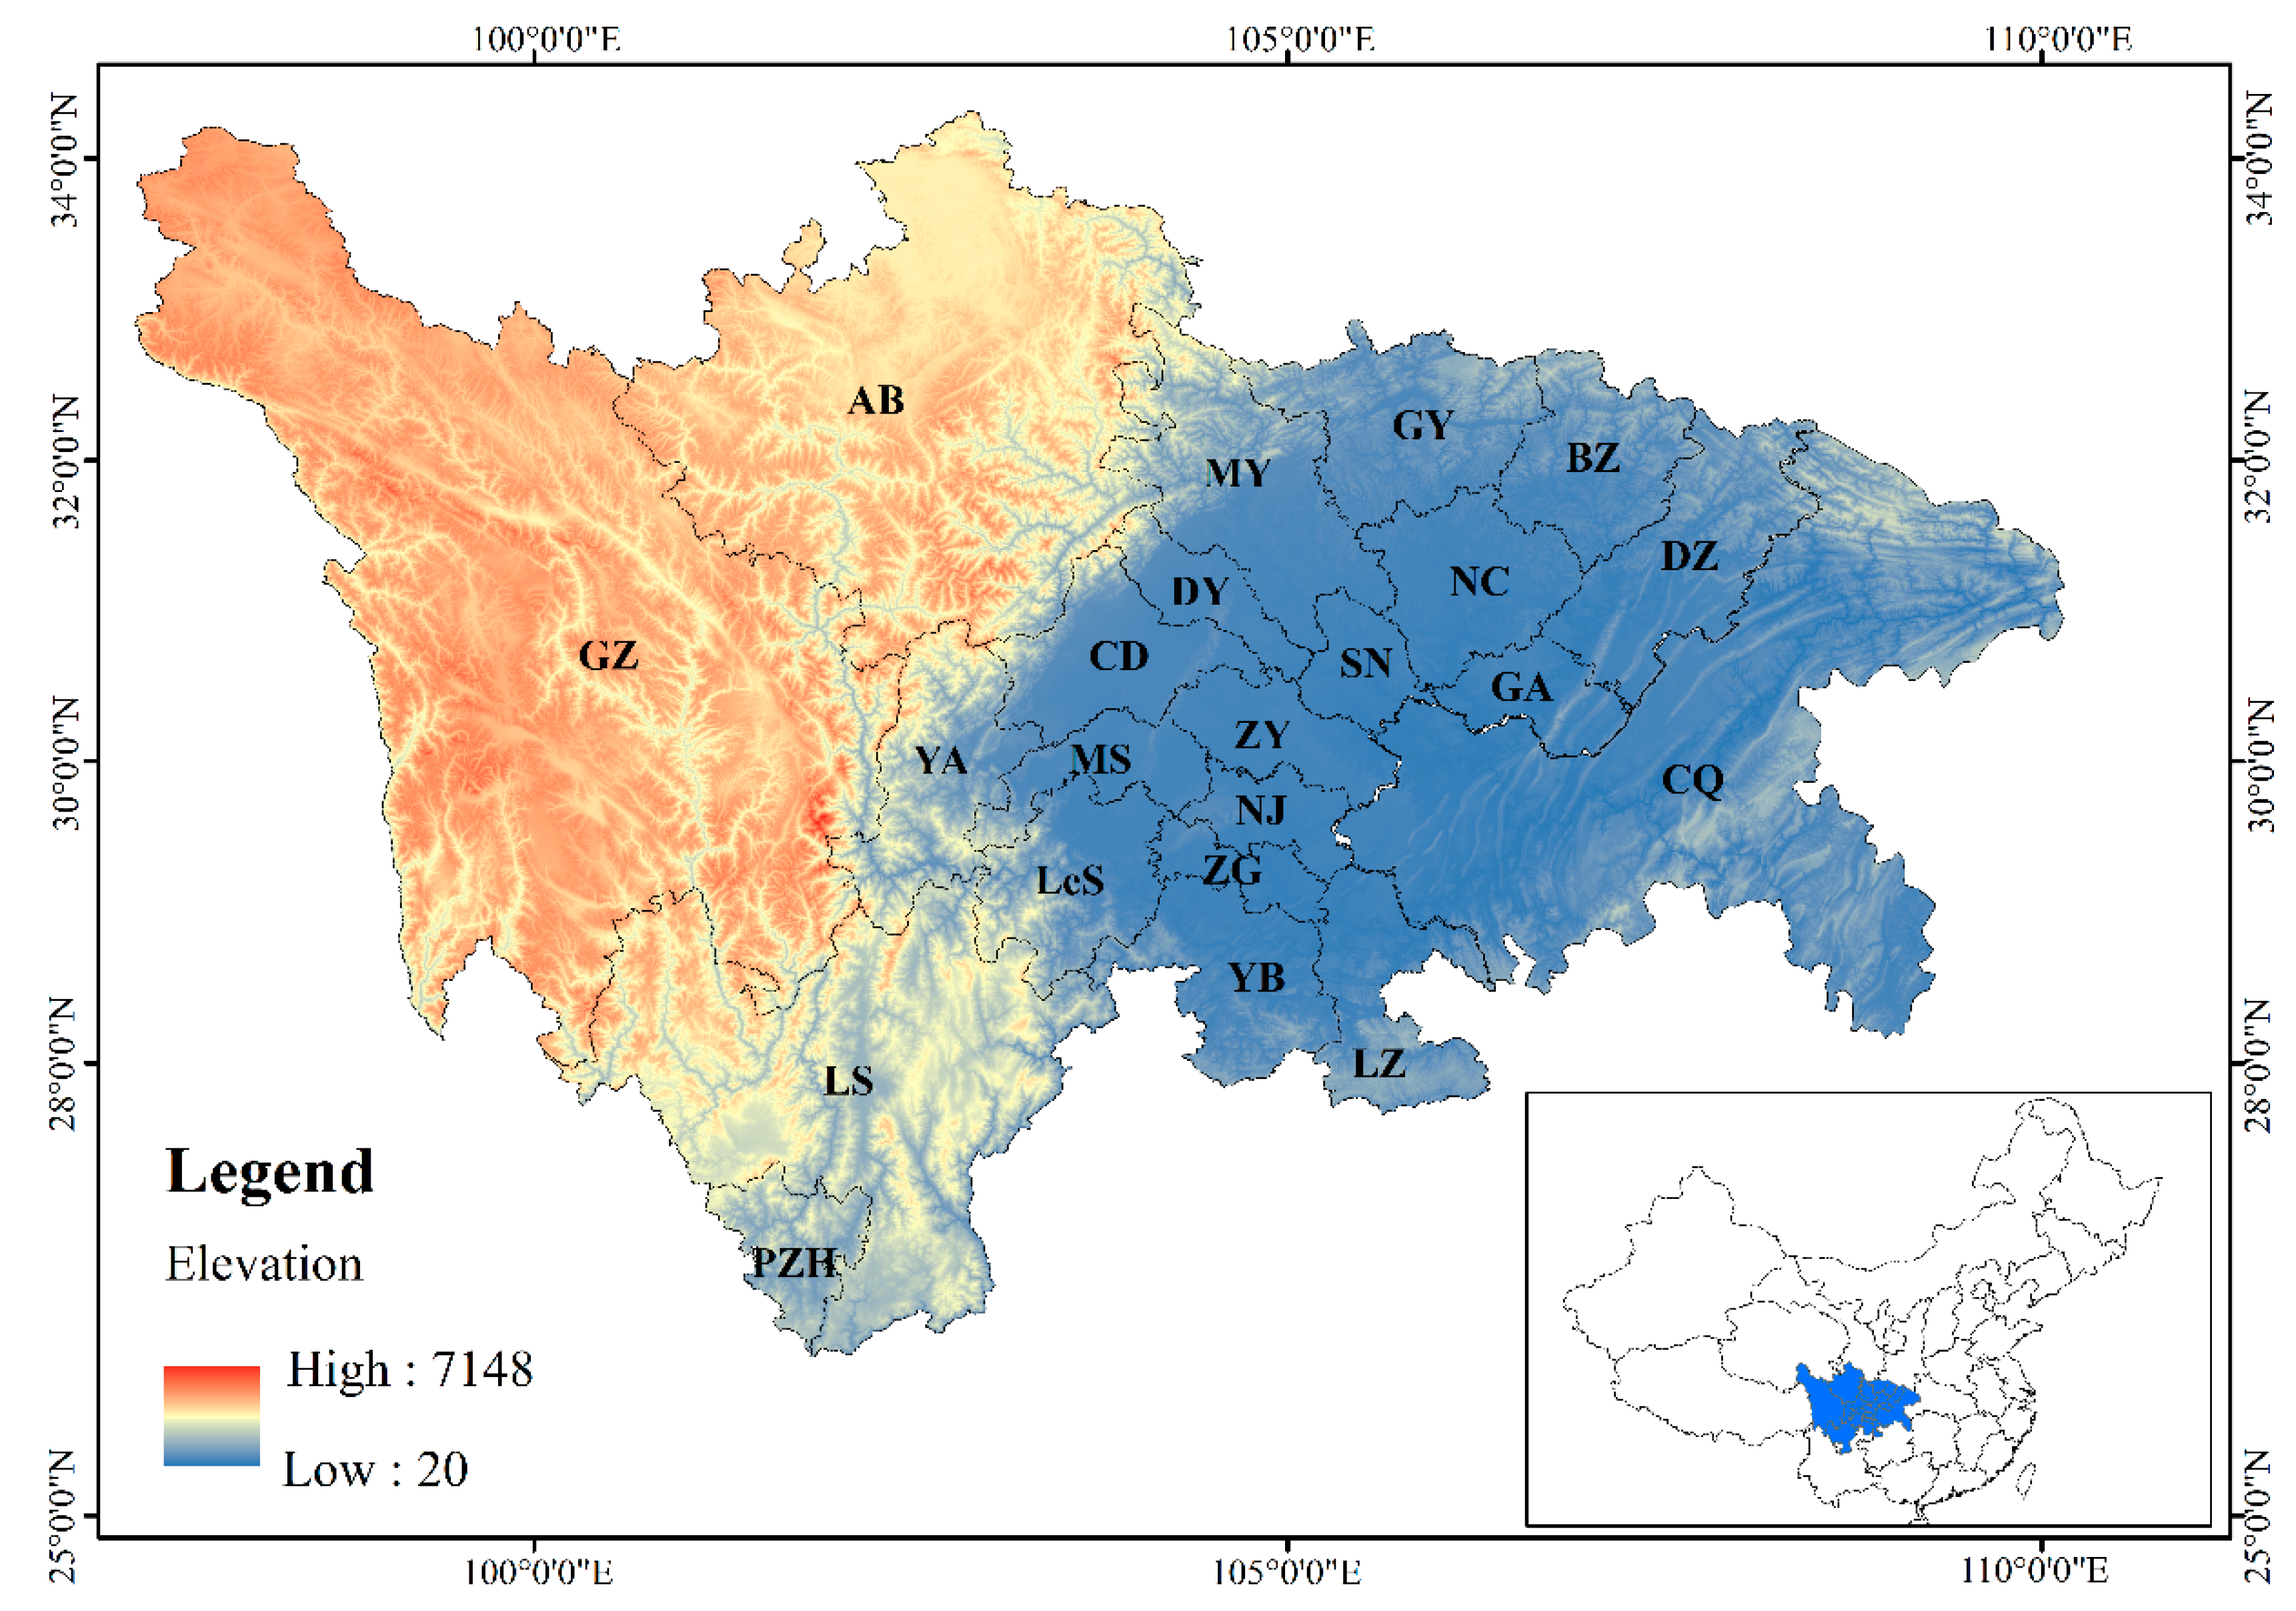
2.1. Air Quality Monitoring Sites

The air quality was monitored at 127 stations spread over 22 cities across Sichuan Basin, covering an area of over 260,000 square kilometers. Located in the central and southern part of the Asian continent, with a total population of more than 100 million, Sichuan Basin is one of the most densely populated areas in China and the world. Completely surrounded by high mountains and plateaus, it is a vast subtropical low hills and plains. The west is surrounded by the high-altitude Qinghai-Tibet Plateau, the south is the Yunnan-Guizhou Plateau, the east is Wushan, and the north is Dabashan. Due to low wind speed and high relative humidity, it was one of the four traditional areas with acidic rain and frequent haze events [25]. Figure 1 showed the locations of the 22 cities that collected the air quality data used in this study.
Considering the completeness of the data, this study collected the socio-economic data of each city in Sichuan Basin during 2018 (source: http://tjj.cq.gov.cn/zwgk_233/tjnj/2019/zk/indexce.htm (accessed on 15 September 2021)). Table 1 listed the city’s abbreviations, number of vehicles, population, and GDP (Gross Domestic Product). In 2018, Chongqing’s total population was 31.01 million, the total number of vehicles was 6.31 million, and the GDP was 20363 billion yuan, ranking first among the cities. As another megacity in Sichuan Basin, Chengdu has a total population of 16.33 million, a total of 4.87 million vehicles, and a GDP of 1.5342 billion yuan, second only to Chongqing.

2.2. Air Quality Data

The concentrations of six pollutants, SO2, NO2, CO, O3, PM2.5 and PM10, were monitored hourly over 22 cities across Sichuan Basin from January 2015 to December 2020. The data were made available by the China National Environmental Monitoring Center (http://www.cnemc.cn/ (accessed on 15 September 2021)).
The instruments for air quality monitoring were deployed according to the China Environmental Protection Standard HJ 664-2013. The equipment came from Shenzhen Aosen Purification Technology Co., Ltd., China. The gaseous pollutant and PM concentrations were measured following the Specifications and Test Procedures for Ambient Air Quality Continuous Automated Monitoring System HJ 654-2013 for SO2, NO2, O3 and CO, and HJ 653-2013 for PM2.5 and PM10, as stipulated in the National Environmental Protection Standards of the People’s Republic of China. The air quality monitoring stations were located at least 50 m away from any notable stationary pollution sources, and the inlets for the instruments were placed at least 1 m higher than the roof of the building or wall [26]. Data quality assurance and quality control (QA/QC) were conducted following the technical guidelines on environmental monitoring quality management (HJ 630-2011) established in the National Environmental Protection Standards of the People’s Republic of China. The validity of the data was checked following the national ambient air quality standards specified in the National Standards of the People’s Republic of China (GB 3095-2012), as used in earlier studies [27,28]. The daily, monthly, and annual means of the data were calculated from the hourly concentrations (with ~80% of the available data to be considered as valid for calculating the mean).

2.3. Back-Trajectory Analysis

Backward trajectory analysis essentially follows a parcel of air backward in hourly time steps for a specified length of time [29]. The HYbrid-Single Particle Lagrangian Integrated Trajectory (HYSPLIT) model developed by the National Oceanic and Atmospheric Administration (NOAA) was used to identify the potential source area of air pollution in a specific city and capture the vertical movement of the air masses from the sources to the receptor inside planetary boundary layer [30].
The HYSPLIT model was used to investigate the movement of air masses during a heavy particulate pollution observed in winter 2017. In order to understand the impact of the regional transmission process, three-dimensional 48 h backward trajectories arriving at 500 m above ground level (AGL) of the receptor sites were also calculated using 1° × 1° Global Data Assimilation System (GDAS) data from National Centers for Environmental Prediction (NCEP). Based on the Euclidean distance between the motion trajectories, the Ward layering method was used to assign the motion trajectories to different clusters according to their moving speed and direction. The hour with the highest PM concentration of coarse particles in Chengdu was selected as the start time of the trajectory, and the backward trajectory at a height of 500 m from 3 January to 6 January 2017 was calculated. The main transportation routes that caused severe air pollution in the winter of 2017 were identified by combining the trajectory with the corresponding average concentration of pollutants [31].

3. Results

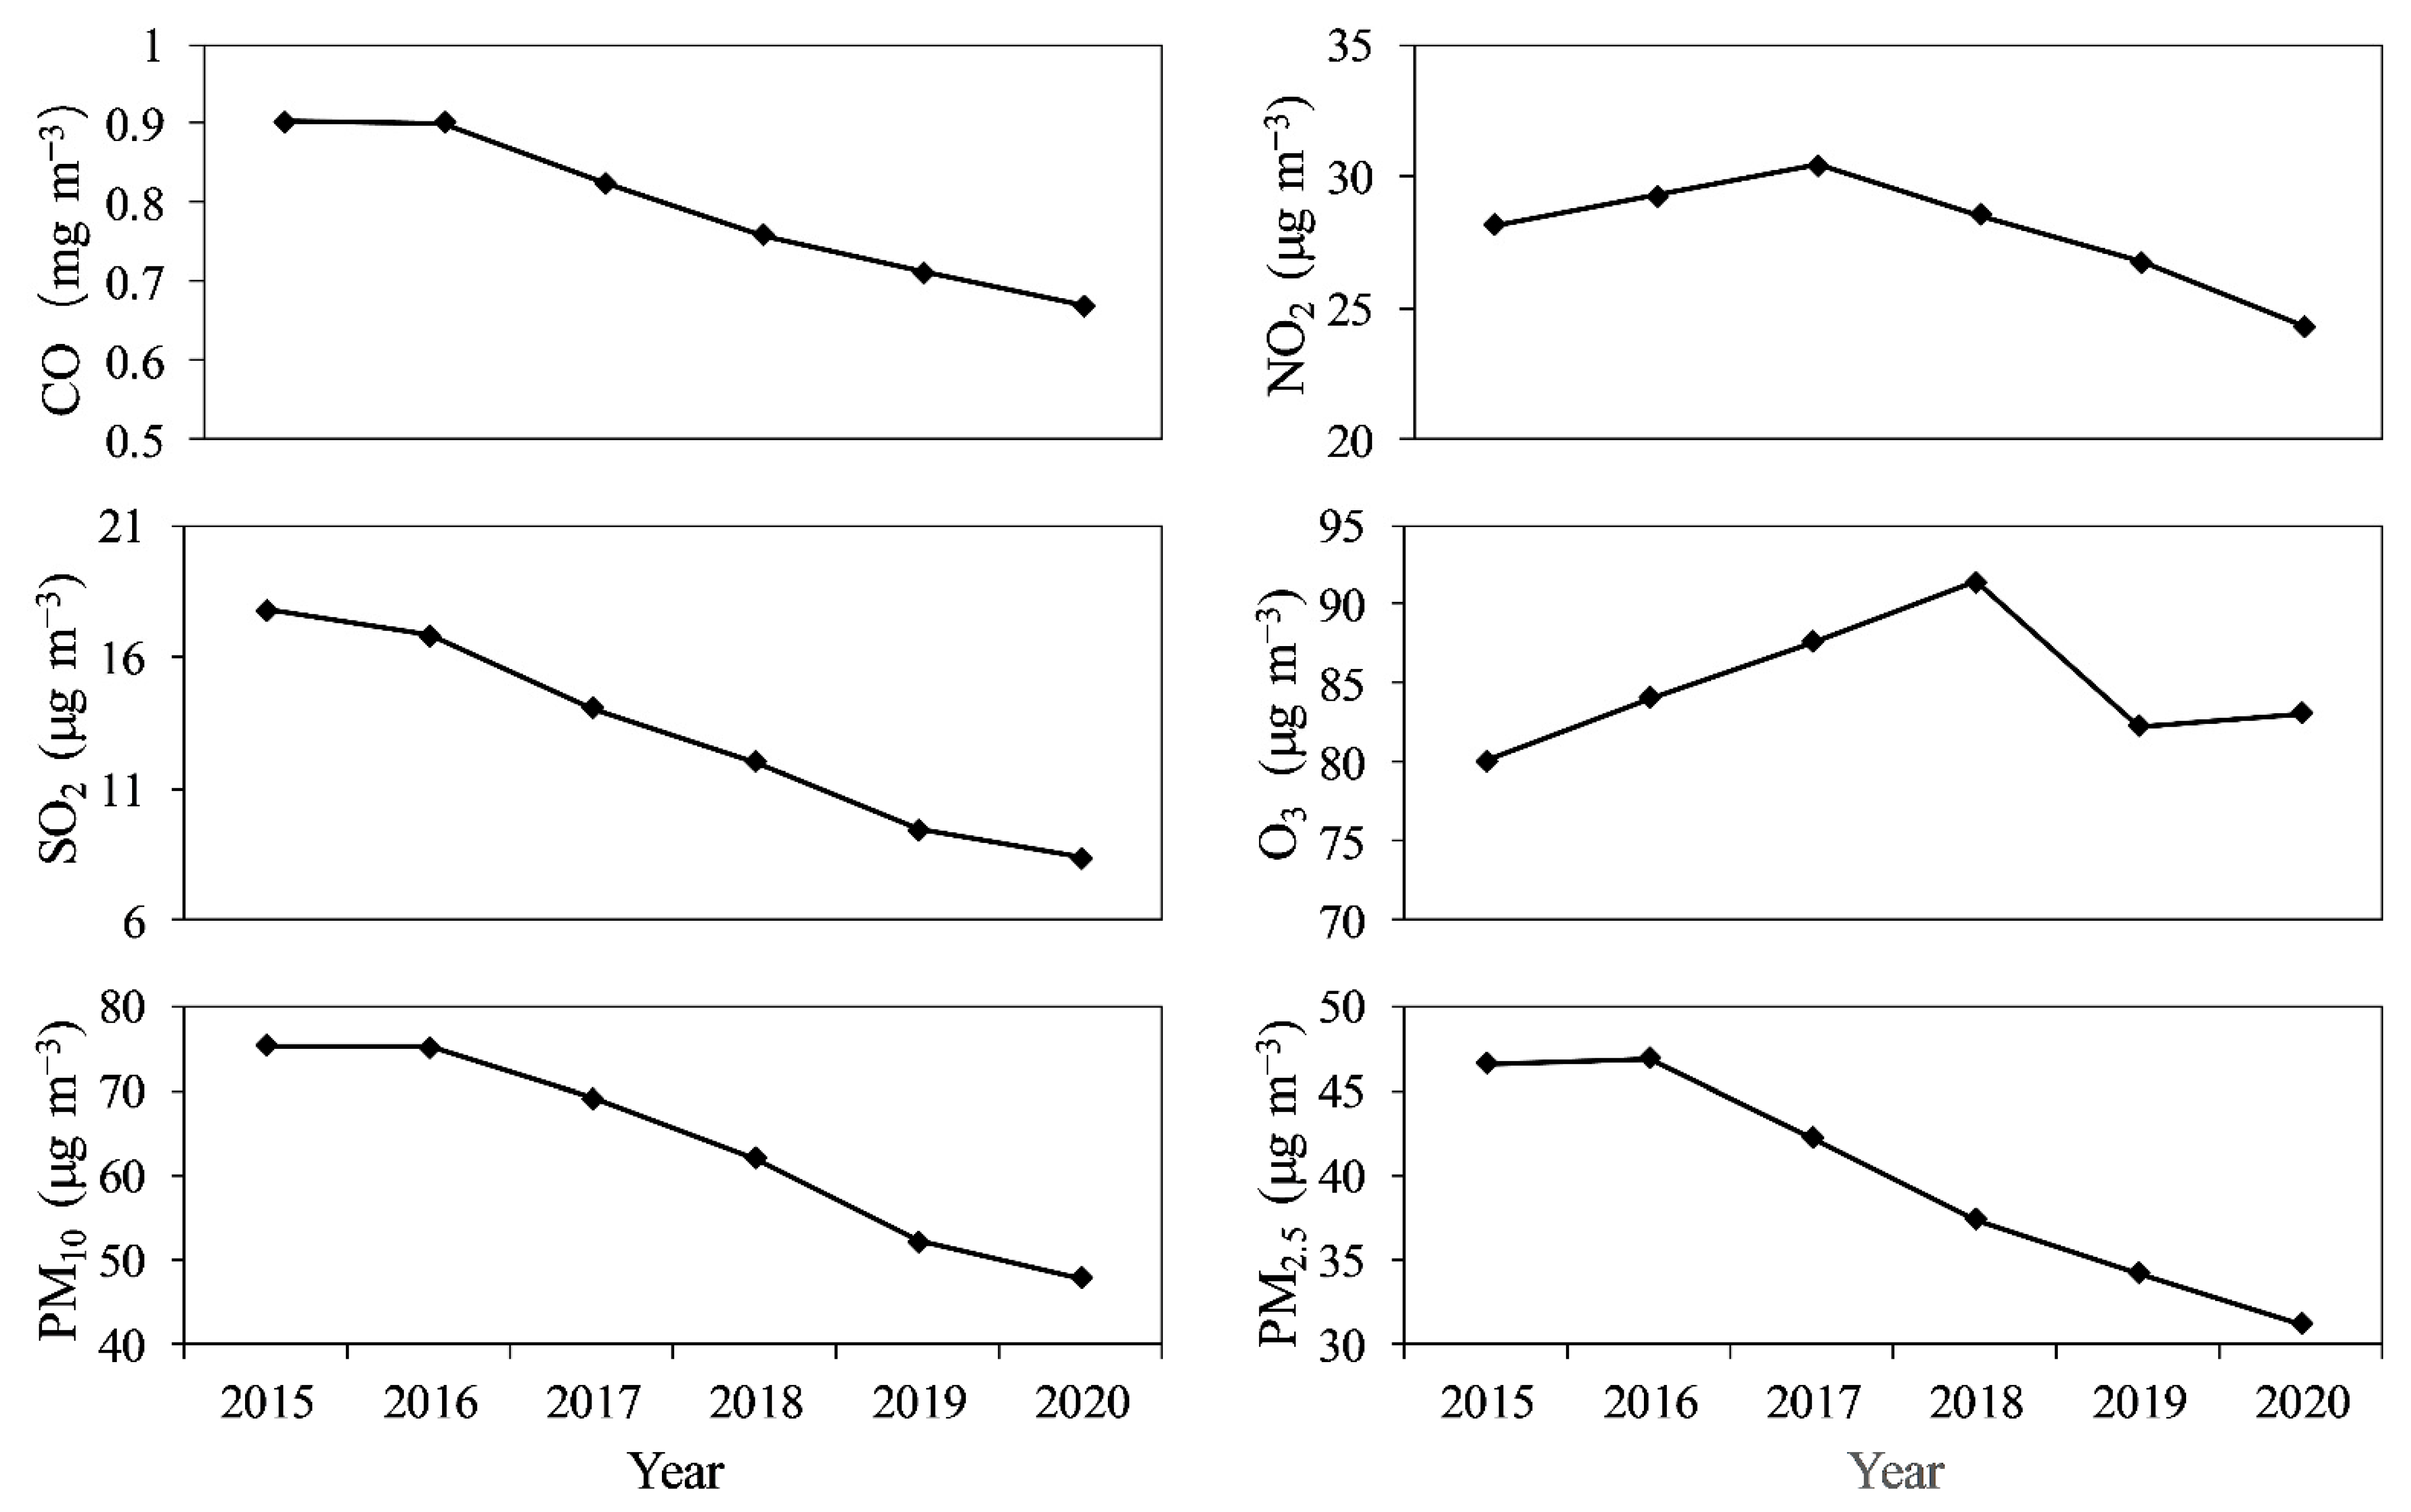
3.1. Spatio-Temporal Characteristics of the Air Quality

The annual average concentrations of the pollutants in Sichuan Basin were determined by averaging the effective data from all stations. Their values are shown in Figure 2. The annual mean concentrations of CO, NO2, SO2, O3, PM2.5 and PM10 in the entire basin area ranged from 0.67–0.90 mg/m3, 24.33–30.4 μg/m3, 8.41–17.76 μg/m3, 80.08–91.4 μg/m3, 31.2–46.56 μg/m3 and 47.87–75.19 μg/m3, respectively. During the same period, in Chengdu and Chongqing, two megacities of Sichuan Basin, the annual average concentrations of the six pollutants ranged from 0.69–1.08 (0.79–1.1) mg/m3, 33.75–49.46 (37.18–45.5) μg/m3, 6.56–15.75 (7.49–16.17) μg/m3, 87.86–101.56 (68.98–81.54) μg/m3, 39.23–61.85 (32.27–54.42) μg/m3, 61.27–103.83 (51.85–84.12) μg/m3, respectively.
The annual average SO2 concentration was the lowest in Bazhong, with a value of 4.71 μg/m3, and the highest in Panzhihua, with a value of 33.69 μg/m3. The lowest NO2 concentration of 9.21 μg/m3 was observed in Aba Prefecture, and the highest in Chengdu, reached 43.73 μg/m3. The highest annual average CO concentration observed at 1.49 mg/m3 in Panzhihua, and the lowest of 0.48 mg/m3 was observed in Ganzi. The lowest annual average concentration of O3 was observed in Ya’an during 2015, which was 53.2 μg/m3. The highest annual average concentration of O3 was observed in Zigong during 2018, with a value of 105.19 μg/m3. The annual average concentration of PM2.5 and PM10 in Aba Prefecture was the lowest, 15.12 μg/m3 and 26.38 μg/m3, respectively. The highest values of 84.94 μg/m3 and 109.6 μg/m3 was observed in Zigong, both of which appeared in 2015.
As shown in Figure 3, the concentrations of five pollutants other than O3 all showed a downward trend from 2015 to 2020 in Sichuan Basin. The concentration of NO2 was the highest in 2017, at 30.4 μg/m3, and the lowest in 2020, at 24.33 μg/m3, with an average annual decline rate of 2.72%. The highest concentrations of CO, SO2, PM2.5 and PM10 all appeared in 2015 with the value of 0.9 mg/m3, 17.76 μg/m3, 46.56 μg/m3 and 75.19 μg/m3, respectively. The lowest concentrations all appeared in 2020 with the value of 0.67 mg/m3, 8.41 μg/m3, 31.2 μg/m3, 47.87 μg/m3, and the average annual decline rates were 5.14%, 10.52%, 6.59%, and 7.27%, respectively.
At present, the environmental concentration of most air pollutants in China is declining, but the concentration of secondary pollutants such as O3 is increasing at both provincial and capital city levels [32,33]. Previous studies showed that the rising rate of O3 in China’s 2 + 26 urban areas was almost 14 times that of the global O3 [34]. The lowest ozone concentration of 80.08 μg/m3 in Sichuan Basin was observed in 2015, and reached the highest in 2018, with the value of 91.4 μg/m3. It declined slightly in the following two years, but still showed an upward trend during the overall study period. The annual growth rate was about 0.76%.
Ozone is not directly emitted by pollution sources in the environment [35]. It is a secondary pollutant generated by chemical reactions of nitrogen oxides and volatile organic compounds under strong ultraviolet light irradiation [36]. Although China has adopted strict control measures in recent years, which has made PM, NO2, SO2 and other atmospheric pollutants show a clear downward trend, the ozone concentration is still slowly increasing [37]. The main reason for this phenomenon is that emissions of NOx and VOCs (main precursors of O₃) remain high in China [38]. And the meteorological conditions of high temperature and low rainfall are conducive to the generation of O₃ in recent years [39]. At the same time, the global O₃ background value has been continuously increasing, which also makes a certain promoting effect on China’s ozone concentration [40].

3.2. Seasonal Variations of Pollutants

Figure 4 shows the seasonal variations of the six pollutants in each city. For almost all pollutants (except O3), the highest concentrations were observed in winter and the lowest in summer. It is speculated that the continuous adverse weather conditions in winter include smaller wind speed and rainfall, lower temperature and atmospheric boundary height, which are not conducive to the diffusion of pollutants. And compared with other seasons, the consumption of coal and biomass fuel for heating in winter is higher [41,42]. On the contrary, in summer, the wind speed and planetary boundary layer is higher, the rainfall is abundant, the rain removal effect is obvious, and the pollutant concentration is lower [43,44].
Since NO2 is the main man-made pollutant emitted from vehicles and transportation facilities and fuel combustion, these activities are more frequent in the two megacities of Chengdu and Chongqing than in other places [45]. In 2018, the total number of motor vehicles in Chengdu and Chongqing accounted for 28.2% and 36.5% of the entire basin area respectively. Therefore, the highest NO2 concentration was observed in these two cities. The average concentration of NO2 in winter was between 111.87 μg/m3 (Chengdu) and 50.93 μg/m3 (Aba Prefecture). Similar characteristics were observed for CO, namely the highest and lowest concentrations were observed in winter and summer, respectively. The opposite trend of ozone occurred. The highest concentration happened in spring and summer, and the lowest concentration occurred in winter. This is related to the formation mechanism of ozone. Many studies showed that under sufficient light, volatile organic compounds (VOCs) and nitrogen oxides (NOx) underwent a photochemical reaction to generate O3 and at the same time produced secondary pollutants in the atmosphere [46,47,48]. High temperature, strong ultraviolet and high photochemical reaction rate were common phenomena in Sichuan Basin during spring and summer. The weaker solar radiation in winter inhibited the photochemical reaction, which was not conducive to the production of O3. Therefore, the O3 concentration in the Sichuan Basin had the highest trend in spring and summer.
Regions with high SO2 concentrations were mainly located in the plateau areas of the western Sichuan Basin, such as Panzhihua, Liangshan, Ganzi and other cities. Far more than the cities such as Chengdu and Mianyang in the basin, the winter SO2 concentration of Panzhihua was 38.7 μg/m3, about 3 times of the average SO2 concentration in whole Sichuan Basin (12.8 μg/m3). On the one hand, the SO2 of cities in the basin such as Chengdu was mainly derived from industrial emissions. In these areas, the government took strict desulfurization measures, which greatly reduced the concentration of SO2. On the other hand, coal combustion for household heating due to low temperature in high altitude regions, led to more SO2 emissions, and the implementation of desulfurization measures in these areas were not yet fully completed.
Different with northern China, due to the warm temperature in Sichuan Basin (about 10 °C on average), there was no widespread coal or wood burning for household heating in winter; therefore, atmospheric processes and meteorological conditions played an important role in the seasonal changes of particulate matter effect [49]. Almost all regions had the highest concentration of particulate matter in winter, about 1.8–2.5 times that of the other three seasons. The concentration was similar in spring and autumn, and the lowest concentration occurred in summer.

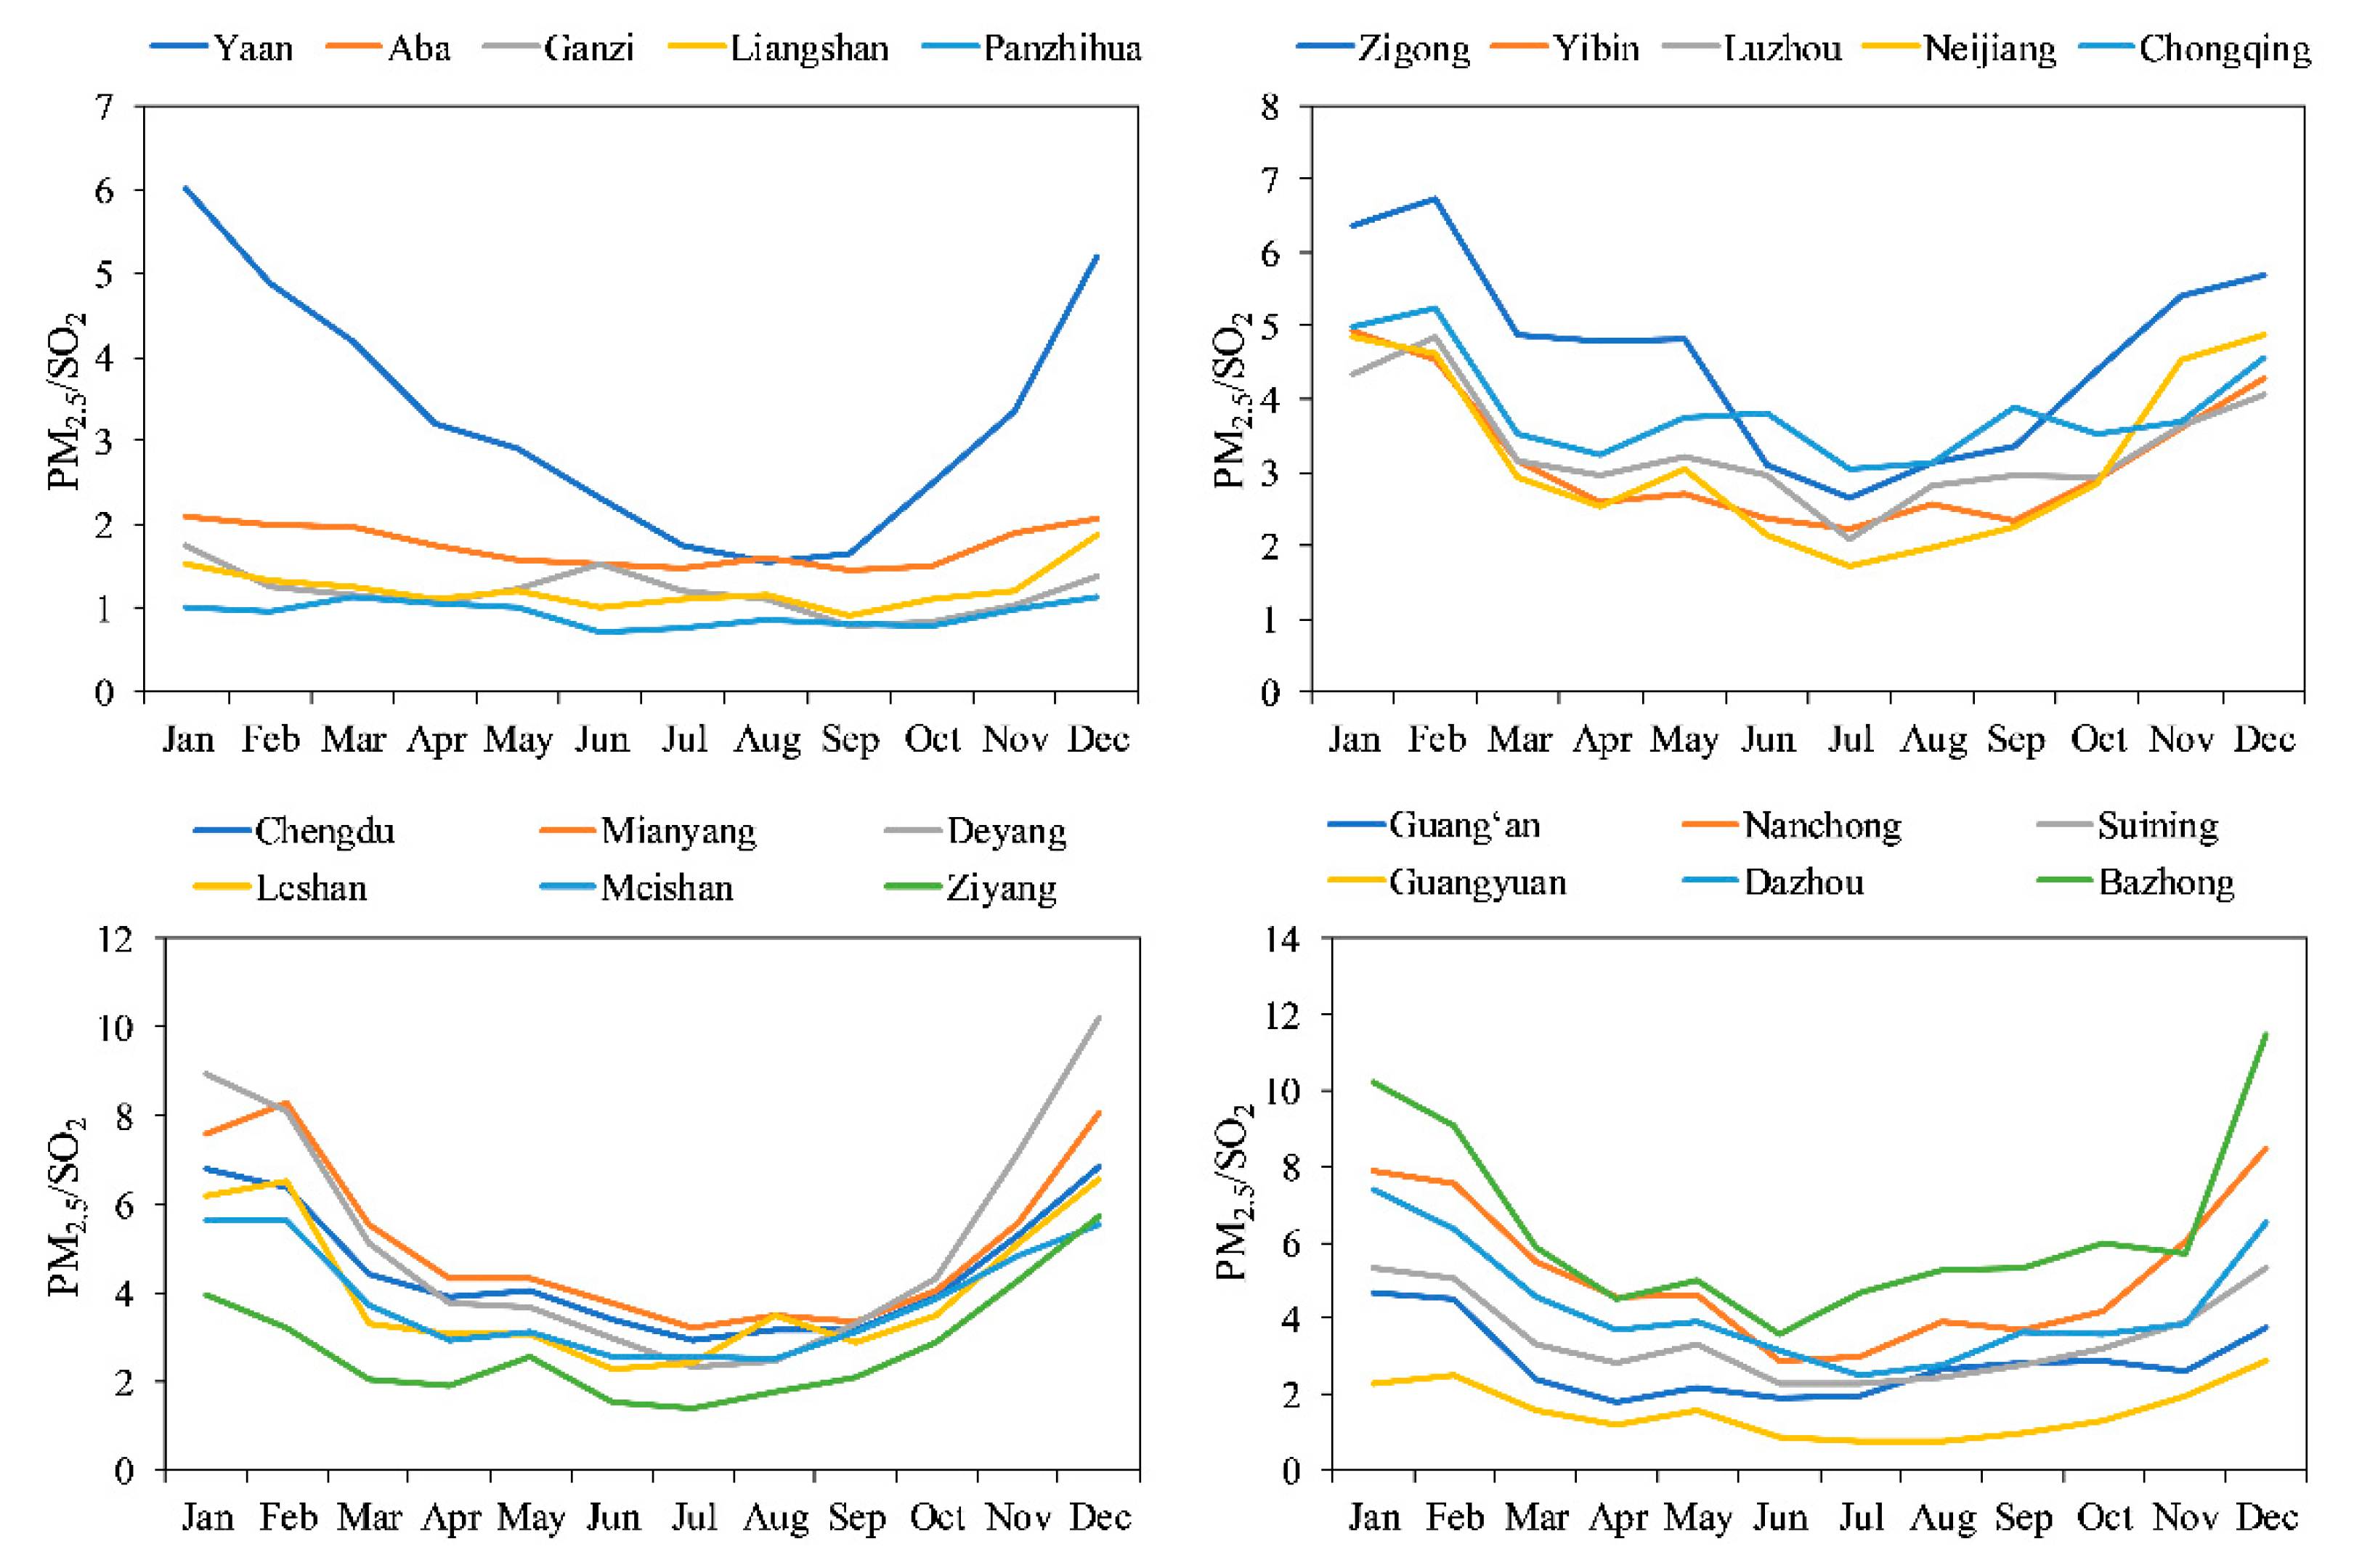
3.3. Analysis of City’s Pollutant Ratio

The average PM2.5/PM10 ratio of all cities in Sichuan Basin was 0.61, and the monthly ratio was between 0.43 and 0.69, appeared in April and January respectively. The average ratio in Chengdu and Chongqing was 0.60 and 0.63, respectively. In 2017, a study reported the average ratio of 0.58 for 31 provincial capital cities, and Zhang (2015) reported an average ratio of 0.56 for 190 cities in China [7,50]. However, in Beijing (0.80), Shanghai (0.70) and Guangzhou (0.72), the ratio was much higher than that observed in this study [51]. These findings indicated that, compared to developed cities in China, the air quality in Sichuan Basin was more affected by coarse particles. Figure 5 showed the monthly average ratios of different cities in Sichuan Basin during the study period. The lowest average ratio was found to be 0.43 (in Guangyuan), while the highest average ratio (0.69) was observed in Zigong and Luzhou.
In winter, all cities had the highest PM2.5/PM10 ratio, while in spring and summer, the ratio decreased rapidly. This was due to the high emissions of coarse particulate matter from sand and soil during the spring when it is very dry, windy, and dusty in Sichuan Basin [52]. Dust emitted from desert areas in Xinjiang (such as Taklimakan) may be transported towards the Qinghai-Tibet Plateau in the northwest of Sichuan Basin, thereby affecting the atmosphere and ecosystems of the basin area.
SO2 can be used to normalize PM2.5 to exclude the effects of coal combustion and meteorological conditions. It can be seen from Figure 6 that during the study period, among the cities in Sichuan Basin, the city with the highest PM2.5/SO2 was Bazhong (6.39), followed by Deyang (5.19) and Nanchong (5.18), which reflected the contribution of non-industrial source to PM2.5. The average ratio in Sichuan Basin is 3.45, which was close to the national average (2.92) in the previous study [53]. It is worth noting that in Panzhihua, Aba, Liangshan and other areas, the value of PM2.5/SO2 has always remained at a low level throughout the year, which may be because the industry in Sichuan Basin is mainly concentrated in the western region, and industrial sources contribute more to fine particles.
PM2.5/SO2 also exhibited a U-shaped mode in most cities, which reflected that non-industrial sources such as power and residential contributed more to PM2.5 in winter. Multi-resolution Emission Inventory for China (MEIC) was often used to estimate emis-sions from various sectors in China [54]. In order to determine the relationship between this dynamic change and the emission trends of key sectors involved in the air pollution process, we collected PM2.5 emission information from key sectors in the 2017 MEIC in-ventory of Sichuan Basin (Figure A1). Among them, non-industrial source emissions showed a similar U-shaped trend, which was consistent with the previous conclusions.
CO is an indicator of the primary combustion source. The secondary formation of fine particles in the basin can be studied by calculating the ratio of PM2.5 to CO [55]. From 2015 to 2020, the value of PM2.5/CO was higher in the southern areas such as Luzhou and Zigong, and the lowest in the western plateau areas such as Panzhihua (Figure 7). This indicated that the secondary sources in the southern cities of the basin had a higher contribution to the generation of fine particles
Previous research reported that the sulfur dioxide emissions were much lower than the emissions of nitrogen oxides for motor vehicles in China, and the ratio of [SO2]/[NO2] in motor vehicles was usually between 0.0084 and 0.042. Both NOx and SO2 were emitted from stationary sources, but the emissions of SO2 was relatively more. The ratio of [SO2]/[NO2] in fixed sources was usually between 1.25 and 5 [56]. Therefore, the SO2/NO2 ratio was often used as an indicator of air pollution caused by stationary sources and mobile sources [57]. Figure 8 showed the monthly average ratio of SO2/NO2 in each city. In study area, Liangshan and Panzhihua had the highest SO2/NO2 ratios, indicating that the air pollution in these western plateau cities mainly came from local industrial sources and coal combustion. Bazhong was the lowest (0.21), followed by Chengdu (0.24) and Chongqing (0.26). These results confirmed that there was a strong correlation between air pollution and automobile exhaust emissions in Chengdu and Chongqing.
From 2015 to 2020, the ratio of PM2.5/SO2 in Sichuan Basin had shown a continuous upward trend, and the ratio of SO2/NOx had shown a continuous downward trend (Fig-ure A2). It showed that the contribution of industrial sources to fine particulate matter con-tinued to decline. This was related to the pollutant emission reduction measures that the government had introduced. PM2.5/CO also showed a downward trend, reflecting the de-cline in the contribution of secondary sources to fine particulate matter, which was related to the decrease in the concentration of SO2 and NOx in the regional atmosphere. In 2015, the executive meeting of the State Council of China decided to implement ultra-low emis-sion and energy-saving retrofits for coal-fired power plants before 2020. Sichuan Province had successively formulated the implementation rules for the Air Pollution Prevention and Control Action Plan from 2014 to 2017, and proposed a series of measures to improve the atmosphere environmental quality, including the elimination of coal-fired boilers be-low 10 tons per hour and the prohibition of new coal-fired boilers below 20 tons per hour. At the same time, we also noticed that during the study period, the ratio of PM2.5/PM10 showed an overall upward trend. This reflected the effectiveness of current dust removal measures to a certain extent, because the existing dust removal measures had far greater removal effects on coarse particles than fine particles.

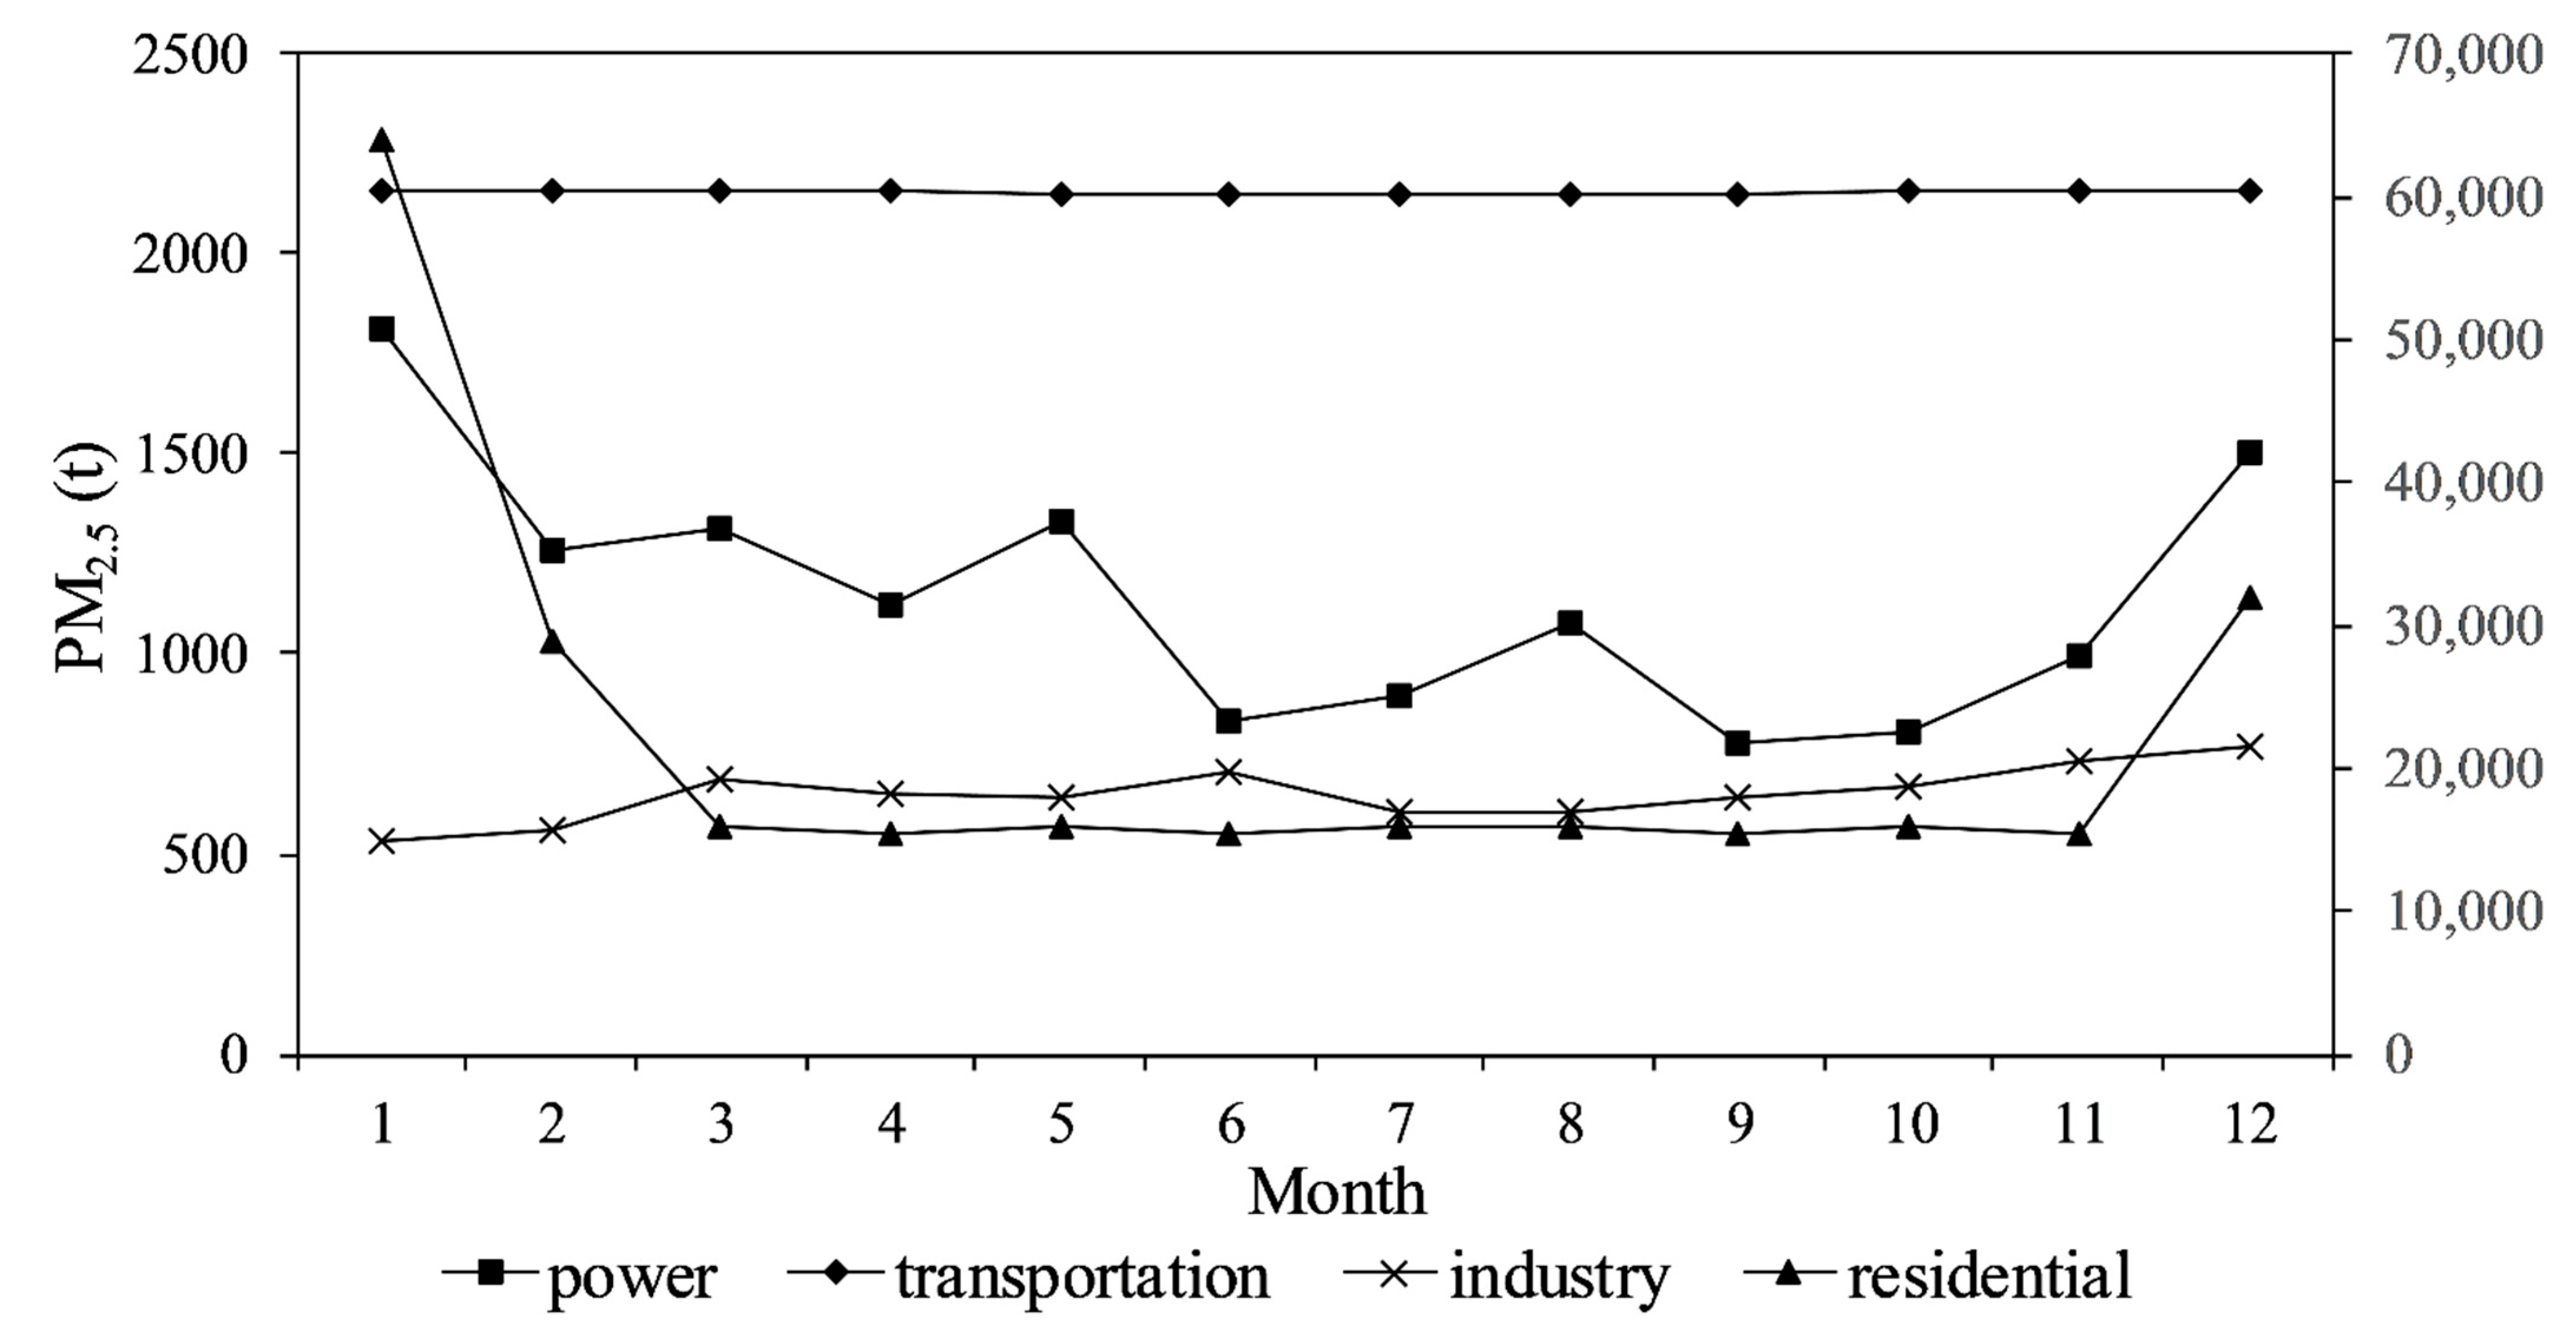
3.4. Characterization of an Air Pollution Episode in Winter 2017

During this research period, the particulate pollution incident that caused a wide range of impacts was identified in the winter of 2017. Figure 9 showed the hourly average PM10 concentration of four cities affected by air pollution incidents (3–6 January 2017), during which the hourly average PM10 concentration of all cities exceeded 120 μg/m3. The average daily concentrations from 3–6 January in Chengdu, Deyang, Ya’an and Meishan were 366 μg/m3, 245 μg/m3, 232 μg/m3 and 225 μg/m3, respectively. The average daily PM10 concentration in these cities was about 10–18 times higher than the WHO guidelines. During the period of heavy pollution, the average ratio of PM2.5/PM10 increased over Chengdu, Deyang, Ya’an and Meishan to 0.65, 0.68, 0.69 and 0.74, respectively. The ratio of the four cities is greater than 0.65, much higher than the annual average value of 2017 (0.59), indicating the dominance of fine particulate matter during the event.
After clustering the downloaded backward trajectories, it was found that they mainly originated over the plateau area of the southwestern part in the basin. The air mass reached Ya’an first from the southwest. The concentration of particulate matter in Ya’an reached a peak with the value of 316 μg/m3 at 20 o’clock on 4 January, and then the air mass continued to move northeastward. When the air mass moved to Chengdu, the concentration of particulate matter increased. Moreover, the highest concentration was observed in the Chengdu area, and the highest concentration may occurred over Chengdu and Deyang. Chengdu and Meishan peaked at around 15:00 on 5 January, with PM10 concentrations of 478 μg/m3 and 288 μg/m3, respectively. Deyang reached the maximum concentration of 324 μg/m3 during the pollution period at around 20 o’clock on 5 January.
It is worth noting that the backward trajectory changed the direction in DY and MY before arriving in CD. The further enrichment of particulate matter concentration from DY to MY and CD may be affected by climatic conditions. The adverse meteorological conditions in heavy pollution days, including high pressure, weak wind (0.7 m/s in average) and low temperature (10.5 °C in average), make the pollution track not easy to spread and can only flow inside the basin.
Southwest region is the industrial concentration area of Sichuan Basin, with devel-oped secondary industry. In these cities of Southwest region, PZH is one of the four major iron ore areas in China. In 2018, the economic proportion of the secondary industry in PZH was 62.3%, the highest among all cities in Sichuan Basin. Previous studies have shown that there is a strong positive correlation between the secondary industry and PM2.5 concentration [58]. Dense industrial sources in southwest region and adverse meteorolog-ical conditions may be the main causes of heavy pollution events in the selected cities.

3.5. Comparison of Air Quality with Standards and Guidelines

In this section, we compared the mean concentration of the pollutants with the available national and WHO guidelines to determine the impacts of current air quality on human health in Sichuan Basin. China revised the National Ambient Air Quality Standard in February 2012. The WHO standards were more stringent than China. Table 2 compared the annual average concentrations of the four pollutants in the basin with different standards, such as the United States Environmental Protection Agency (USEPA), European Union (EU), Australia and Indian standards. The situation regarding pollutants in Sichuan Basin was severe. The WHO guideline for PM2.5(PM10) was exceeded by a factor of approximately 4 (3.8), indicating that the health of the residents will be affected. And the concentrations of PM2.5 and PM10 are approximately 2 and 1.8 times higher than the national Grade-I standards, respectively.
In Figure 10, the annual average concentration was compared with WHO standards and national Grade-I and II standards. During the study period, the average annual SO2 concentration of all cities in Sichuan Basin reached the national Grade-II standard. All cities except Panzhihua reached the national Grade-I standard in 2020. The high concentration of SO2 in Panzhihua may be due to the burning of coal and biomass and the work of power plants. Moreover, the annual average concentration in Panzhihua declined rapidly since 2018, and it was only slightly higher than the national Grade-I standard in 2020.
During the study period, the annual NO2 concentration in almost all cities was lower than the WHO and national Grade-I standard. As the two megacities in the basin, Chengdu and Chongqing have the largest anthropogenic activities and emissions, so their annual average concentration of NO2 was the highest. In 2015–2018, the annual average level was 1.04–1.23 times higher than the WHO guidelines. However, in 2019–2020, its concentration dropped rapidly, mainly due to the strict implementation of the government’s environmental protection policy.
In 2020, the concentration of fine particulate matter in almost all cities in the basin exceeded the WHO regulations. Among these 22 cities, only the average PM2.5 concentration of Ganzi was within the WHO standard in 2020. The PM2.5 concentration in Aba Prefecture in the past two years was only 0.37 μg/m3 higher than the national Grade-I standard. In Chengdu, Deyang, Zigong and other cities, although the concentration of particulate matter has been declining in recent years, it was still higher than the national Grade-II standard, about 3.5–3.9 times higher than the WHO standard. Compared with PM2.5, the situation of PM10 is slightly better. In 2020, the PM10 concentration of all cities reached the national Grade-II standard. Both Aba and Liangshan reached the national Grade-I standard, and only Ganzi reached the WHO standard in 2019–2020.

4. Conclusions

This study used air quality monitoring data to present the overall air quality status of 22 cities in Sichuan Basin from January 2015 to December 2020. The annual average concentrations of CO, NO2, SO2, O3, PM2.5 and PM10 in the entire basin were 0.79 mg/m3, 28.17 μg/m3, 13.08 μg/m3, 84.76 μg/m3, 39.75 μg/m3 and 63.56 μg/m3, respectively. Except for O3, the annual average concentration of the other five pollutants showed a clear downward trend. CO, NO2, SO2, PM2.5 and PM10 decreased by 25.7%, 13.6%, 52.6%, 32.9%, and 36.3% respectively during the study period. And O3 was slowly increasing at an average annual rate of 0.6 μg/m3. The spatial patterns of CO and SO2 were similar. High-concentration areas were mainly located in the western plateau of Sichuan Basin, while the concentrations of NO2 and particulate matter were more prominent in the urban agglomerations inside the basin.
The annual average value of PM2.5/SO2 has been maintained at a low level in Panzhihua (0.9), Liangshan (1.2) and other regions for many years, indicating that industrial sources in the western Sichuan Basin have made a greater contribution to fine particulate matter. Non-industrial sources such as electricity and housing contribute more to fine particulate matter in winter. PM2.5/CO is higher in the southern Sichuan Basin, such as Luzhou (0.077) and Zigong (0.075), indicating that secondary sources have a greater impact on the generation of fine particles. The low SO2/NO2 values in megacities such as Chengdu (0.24) and Chongqing (0.26) indicate that there is a strong correlation between air pollution and automobile exhaust emissions.
During the heavy pollution incident in the winter of 2017, the average daily concentrations from 3–6 January in Chengdu, Deyang, Ya’an and Meishan were 366 μg/m3, 245 μg/m3, 232 μg/m3 and 225 μg/m3, respectively, which were mainly caused by the surrounding plateau terrain under typical stagnant weather conditions. This finding is also supported by backward trajectory analysis, indicating that the air masses arriving in Chengdu are mainly from the plateau area in the western part of the basin. During the study period, the annual average concentration of PM2.5 (PM10) exceeded the WHO guidelines by as much as 4 (3) times. This shows that PM is still the main air pollutant of concern in the region. Therefore, reducing PM should become an integral part of the strategy, policy and action plan of the air pollution management plan. This paper conducts an in-depth study on the temporal and spatial distribution characteristics of six standard air pollutants in the Sichuan Basin, hoping to provide a strong scientific basis for effective air pollution control planning in this area and similar urban agglomerations.

Author Contributions

Data curation and methodology, C.F.; supervisors and directors, J.W.; conceptualization, original draft writing, review and editing, X.T.; field sampling and formal analysis, Y.Z. All authors have read and agreed to the published version of the manuscript.

Funding

This research was funded by Ecology and Environment Department of Jilin Province. The project numbers are 2018-19 and 2019-08.

Institutional Review Board Statement

Not applicable.

Informed Consent Statement

Not applicable.

Data Availability Statement

Publicly available datasets were analyzed in this study. This data can be found here: [http://www.cnemc.cn/].

Acknowledgments

The author would like to thank Xin Siyu for her encouragement and company, as well as the group members of Laboratory 537 and 142 in Jilin University.

Conflicts of Interest

The authors declare no conflict of interest.

Appendix A

Figure A1. PM2.5 emissions of various departments in Sichuan Basin based on 2017 MEIC inventory statistics. The transportation department corresponds to the left axis, and the other departments correspond to the right axis.
Atmosphere 12 01504 g0a1
Figure A2. Annual change in the proportion of pollutants.
Atmosphere 12 01504 g0a2

References

  1. Tie, X.; Cao, J. Aerosol pollution in China: Present and future impact on environment. Particuology 2009, 7, 426–431. [Google Scholar] [CrossRef]
  2. West, J.J.; Cohen, A.; Dentener, F.; Brunekreef, B.; Zhu, T.; Armstrong, B.; Bell, M.L.; Brauer, M.; Carmichael, G.; Costa, D.L.; et al. What We Breathe Impacts Our Health: Improving Understanding of the Link between Air Pollution and Health. Environ. Sci. Technol. 2016, 50, 4895–4904. [Google Scholar] [CrossRef] [PubMed]
  3. Cao, J.; Yang, C.; Li, J.; Chen, R.; Chen, B.; Gu, D.; Kan, H. Association between long-term exposure to outdoor air pollution and mortality in China: A cohort study. J. Hazard. Mater. 2011, 186, 1594–1600. [Google Scholar] [CrossRef] [PubMed]
  4. Forouzanfar, M.H.; Afshin, A.; Alexander, L.T.; Anderson, H.R.; Bhutta, Z.A.; Biryukov, S.; Brauer, M.; Burnett, R.; Cercy, K.; Charlson, F.J.; et al. Global, regional, and national comparative risk assessment of 79 behavioural, environmental and occupational, and metabolic risks or clusters of risks, 1990–2015: A systematic analysis for the Global Burden of Disease Study 2015. Lancet 2016, 388, 1659–1724. [Google Scholar] [CrossRef] [Green Version]
  5. Burnett, R.; Chen, H.; Szyszkowicz, M.; Fann, N.; Hubbell, B.; Pope, C.A., 3rd; Apte, J.S.; Brauer, M.; Cohen, A.; Weichenthal, S.; et al. Global estimates of mortality associated with long-term exposure to outdoor fine particulate matter. Proc. Natl. Acad. Sci. USA 2018, 115, 9592–9597. [Google Scholar] [CrossRef] [Green Version]
  6. Han, S.; Bian, H.; Feng, Y.; Liu, A.; Li, X.; Zeng, F.; Zhang, X. Analysis of the Relationship between O3, NO and NO2 in Tianjin, China. Aerosol. Air Qual. Res. 2011, 11, 128–139. [Google Scholar] [CrossRef] [Green Version]
  7. He, J.; Gong, S.; Yu, Y.; Yu, L.; Wu, L.; Mao, H.; Song, C.; Zhao, S.; Liu, H.; Li, X.; et al. Air pollution characteristics and their relation to meteorological conditions during 2014-2015 in major Chinese cities. Environ. Pollut. 2017, 223, 484–496. [Google Scholar] [CrossRef]
  8. Zhang, Q.; Zheng, Y.; Tong, D.; Shao, M.; Wang, S.; Zhang, Y.; Xu, X.; Wang, J.; He, H.; Liu, W.; et al. Drivers of improved PM2.5 air quality in China from 2013 to 2017. Proc. Natl. Acad. Sci. USA 2019, 116, 24463–24469. [Google Scholar] [CrossRef] [Green Version]
  9. Wu, Y.; Zhang, S.; Hao, J.; Liu, H.; Wu, X.; Hu, J.; Walsh, M.P.; Wallington, T.J.; Zhang, K.M.; Stevanovic, S. On-road vehicle emissions and their control in China: A review and outlook. Sci. Total Environ. 2017, 574, 332–349. [Google Scholar] [CrossRef] [Green Version]
  10. Li, R.; Mao, H.; Wu, L.; He, J.; Ren, P.; Li, X. The evaluation of emission control to PM concentration during Beijing APEC in 2014. Atmos. Pollut. Res. 2016, 7, 363–369. [Google Scholar] [CrossRef]
  11. Song, C.; Wu, L.; Xie, Y.; He, J.; Chen, X.; Wang, T.; Lin, Y.; Jin, T.; Wang, A.; Liu, Y.; et al. Air pollution in China: Status and spatiotemporal variations. Environ. Pollut. 2017, 227, 334–347. [Google Scholar] [CrossRef]
  12. Maji, K.J.; Sarkar, C. Spatio-temporal variations and trends of major air pollutants in China during 2015–2018. Environ. Sci. Pollut. Res. Int. 2020, 27, 33792–33808. [Google Scholar] [CrossRef]
  13. Tao, J.; Zhang, L.; Cao, J.; Zhang, R. A review of current knowledge concerning PM2.5 chemical composition, aerosol optical properties and their relationships across China. Atmos. Chem. Phys. 2017, 17, 9485–9518. [Google Scholar] [CrossRef] [Green Version]
  14. Xie, Y.; Zhao, B.; Zhang, L.; Luo, R. Spatiotemporal variations of PM2.5 and PM10 concentrations between 31 Chinese cities and their relationships with SO2, NO2, CO and O3. Particuology 2015, 20, 141–149. [Google Scholar] [CrossRef]
  15. Gao, J.; Wang, K.; Wang, Y.; Liu, S.; Zhu, C.; Hao, J.; Liu, H.; Hua, S.; Tian, H. Temporal-spatial characteristics and source apportionment of PM2.5 as well as its associated chemical species in the Beijing-Tianjin-Hebei region of China. Environ. Pollut. 2018, 233, 714–724. [Google Scholar] [CrossRef]
  16. Ma, T.; Duan, F.; He, K.; Qin, Y.; Tong, D.; Geng, G.; Liu, X.; Li, H.; Yang, S.; Ye, S.; et al. Air pollution characteristics and their relationship with emissions and meteorology in the Yangtze River Delta region during 2014–2016. J. Environ. Sci. 2019, 83, 8–20. [Google Scholar] [CrossRef]
  17. Shen, Y.; Zhang, L.; Fang, X.; Ji, H.; Li, X.; Zhao, Z. Spatiotemporal patterns of recent PM2.5 concentrations over typical urban agglomerations in China. Sci. Total Environ. 2019, 655, 13–26. [Google Scholar] [CrossRef]
  18. Xiao, C.; Chang, M.; Guo, P.; Gu, M.; Li, Y. Analysis of air quality characteristics of Beijing-Tianjin-Hebei and its surrounding air pollution transport channel cities in China. J. Environ. Sci. 2020, 87, 213–227. [Google Scholar] [CrossRef]
  19. Dong, Z.; Wang, S.; Xing, J.; Chang, X.; Ding, D.; Zheng, H. Regional transport in Beijing-Tianjin-Hebei region and its changes during 2014-2017: The impacts of meteorology and emission reduction. Sci. Total Environ. 2020, 737, 139792. [Google Scholar] [CrossRef]
  20. Zhao, S.; Yu, Y.; Qin, D.; Yin, D.; Dong, L.; He, J. Analyses of regional pollution and transportation of PM2.5 and ozone in the city clusters of Sichuan Basin, China. Atmos. Pollut. Res. 2019, 10, 374–385. [Google Scholar] [CrossRef]
  21. Zhao, S.; Yu, Y.; Yin, D.; Qin, D.; He, J.; Dong, L. Spatial patterns and temporal variations of six criteria air pollutants during 2015 to 2017 in the city clusters of Sichuan Basin, China. Sci. Total Environ. 2018, 624, 540–557. [Google Scholar] [CrossRef]
  22. Wang, H.; Tian, M.; Chen, Y.; Shi, G.; Liu, Y.; Yang, F.; Zhang, L.; Deng, L.; Yu, J.; Peng, C.; et al. Seasonal characteristics, formation mechanisms and source origins of PM2.5 in two megacities in Sichuan Basin, China. Atmos. Chem. Phys. 2018, 18, 865–881. [Google Scholar] [CrossRef] [Green Version]
  23. Hu, W.; Hu, M.; Hu, W.-W.; Niu, H.; Zheng, J.; Wu, Y.; Chen, W.; Chen, C.; Li, L.; Shao, M.; et al. Characterization of submicron aerosols influenced by biomass burning at asite in the Sichuan Basin, southwestern China. Atmos. Chem. Phys. 2016, 16, 13213–13230. [Google Scholar] [CrossRef] [Green Version]
  24. Zeng, S.; Zheng, Y. Analysis of a Severe Pollution Episode in December 2017 in Sichuan Province. Atmosphere 2019, 10, 156. [Google Scholar] [CrossRef] [Green Version]
  25. Chen, Y.; Xie, S.D. Long-term trends and characteristics of visibility in two megacities in southwest China: Chengdu and Chongqing. J. Air Waste Manag. Assoc. 2013, 63, 1058–1069. [Google Scholar] [CrossRef]
  26. Zhang, W.; Liu, B.; Zhang, Y.; Li, Y.; Sun, X.; Gu, Y.; Dai, C.; Li, N.; Song, C.; Dai, Q.; et al. A refined source apportionment study of atmospheric PM2.5 during winter heating period in Shijiazhuang, China, using a receptor model coupled with a source-oriented model. Atmos. Environ. 2020, 222, 117157. [Google Scholar] [CrossRef]
  27. Fu, S.; Guo, M.; Fan, L.; Deng, Q.; Han, D.; Wei, Y.; Luo, J.; Qin, G.; Cheng, J. Ozone pollution mitigation in guangxi (south China) driven by meteorology and anthropogenic emissions during the COVID-19 lockdown. Environ. Pollut. 2021, 272, 115927. [Google Scholar] [CrossRef]
  28. Gao, S.; Cong, Z.; Yu, H.; Sun, Y.; Mao, J.; Zhang, H.; Ma, Z.; Azzi, M.; Yang, W.; Jiang, Y.; et al. Estimation of background concentration of PM in Beijing using a statistical integrated approach. Atmos. Pollut. Res. 2019, 10, 858–867. [Google Scholar] [CrossRef]
  29. Escudero, M.; Stein, A.; Draxler, R.R.; Querol, X.; Alastuey, A.; Castillo, S.; Avila, A. Determination of the contribution of northern Africa dust source areas to PM10 concentrations over the central Iberian Peninsula using the Hybrid Single-Particle Lagrangian Integrated Trajectory model (HYSPLIT) model. J. Geophys. Res. 2006, 111. [Google Scholar] [CrossRef]
  30. Urlea, A.D.; Barbu, N.; Andrei, S.; Ştefan, S. Simulation of Vesuvius volcanic ash hazards within Romanian airspace using the Hybrid Single-Particle Lagrangian Integrated Trajectory Volcanic Ash numerical model. Meteorol. Appl. 2021, 28. [Google Scholar] [CrossRef]
  31. Meng, F.; Wang, J.; Li, T.; Fang, C. Pollution Characteristics, Transport Pathways, and Potential Source Regions of PM2.5 and PM10 in Changchun City in 2018. Int. J. Environ. Res. Public Health 2020, 17, 6585. [Google Scholar] [CrossRef] [PubMed]
  32. Yao, Y.; He, C.; Li, S.; Ma, W.; Li, S.; Yu, Q.; Mi, N.; Yu, J.; Wang, W.; Yin, L.; et al. Properties of particulate matter and gaseous pollutants in Shandong, China: Daily fluctuation, influencing factors, and spatiotemporal distribution. Sci. Total Environ. 2019, 660, 384–394. [Google Scholar] [CrossRef] [PubMed]
  33. Li, B.; Shi, X.F.; Liu, Y.P.; Lu, L.; Wang, G.L.; Thapa, S.; Sun, X.Z.; Fu, D.L.; Wang, K.; Qi, H. Long-term characteristics of criteria air pollutants in megacities of Harbin-Changchun megalopolis, Northeast China: Spatiotemporal variations, source analysis, and meteorological effects. Environ. Pollut. 2020, 267, 115441. [Google Scholar] [CrossRef] [PubMed]
  34. Fan, Y.; Ding, X.; Hang, J.; Ge, J. Characteristics of urban air pollution in different regions of China between 2015 and 2019. Build. Environ. 2020, 180, 107048. [Google Scholar] [CrossRef]
  35. Pusede, S.E.; Steiner, A.L.; Cohen, R.C. Temperature and recent trends in the chemistry of continental surface ozone. Chem. Rev. 2015, 115, 3898–3918. [Google Scholar] [CrossRef]
  36. Monks, P.S.; Archibald, A.T.; Colette, A.; Cooper, O.; Coyle, M.; Derwent, R.; Fowler, D.; Granier, C.; Law, K.S.; Mills, G.E.; et al. Tropospheric ozone and its precursors from the urban to the global scale from air quality to short-lived climate forcer. Atmos. Chem. Phys. 2015, 15, 8889–8973. [Google Scholar] [CrossRef] [Green Version]
  37. Wang, T.; Xue, L.; Brimblecombe, P.; Lam, Y.F.; Li, L.; Zhang, L. Ozone pollution in China: A review of concentrations, meteorological influences, chemical precursors, and effects. Sci. Total Environ. 2017, 575, 1582–1596. [Google Scholar] [CrossRef]
  38. Zhang, Q.; Yuan, B.; Shao, M.; Wang, X.; Lu, S.; Lu, K.; Wang, M.; Chen, L.; Chang, C.C.; Liu, S.C. Variations of ground-level O3 and its precursors in Beijing in summertime between 2005 and 2011. Atmos. Chem. Phys. 2014, 14, 6089–6101. [Google Scholar] [CrossRef] [Green Version]
  39. Liu, Z.; Wang, Y.; Gu, D.; Zhao, C.; Huey, L.G.; Stickel, R.; Liao, J.; Shao, M.; Zhu, T.; Zeng, L.; et al. Summertime photochemistry during CAREBeijing-2007: ROx budgets and O3 formation. Atmos. Chem. Phys. 2012, 12, 7737–7752. [Google Scholar] [CrossRef] [Green Version]
  40. Cooper, O.R.; Parrish, D.D.; Ziemke, J.; Balashov, N.V.; Cupeiro, M.; Galbally, I.E.; Gilge, S.; Horowitz, L.; Jensen, N.R.; Lamarque, J.F.; et al. Global distribution and trends of tropospheric ozone: An observation-based review. Elem. Sci. Anthr. 2014, 2, 000029. [Google Scholar] [CrossRef]
  41. Xu, Z.; Huang, X.; Nie, W.; Chi, X.; Xu, Z.; Zheng, L.; Sun, P.; Ding, A. Influence of synoptic condition and holiday effects on VOCs and ozone production in the Yangtze River Delta region, China. Atmos. Environ. 2017, 168, 112–124. [Google Scholar] [CrossRef]
  42. Chen, J.; Shen, H.; Li, T.; Peng, X.; Cheng, H.; Ma, A.C. Temporal and Spatial Features of the Correlation between PM2.5 and O3 Concentrations in China. Int. J. Environ. Res. Public Health 2019, 16, 4824. [Google Scholar] [CrossRef] [Green Version]
  43. Chen, Z.; Chen, D.; Zhao, C.; Kwan, M.P.; Cai, J.; Zhuang, Y.; Zhao, B.; Wang, X.; Chen, B.; Yang, J.; et al. Influence of meteorological conditions on PM2.5 concentrations across China: A review of methodology and mechanism. Environ. Int. 2020, 139, 105558. [Google Scholar] [CrossRef]
  44. Yu, H.; Yang, W.; Wang, X.; Yin, B.; Zhang, X.; Wang, J.; Gu, C.; Ming, J.; Geng, C.; Bai, Z. A seriously sand storm mixed air-polluted area in the margin of Tarim Basin: Temporal-spatial distribution and potential sources. Sci. Total Environ. 2019, 676, 436–446. [Google Scholar] [CrossRef]
  45. Casquero-Vera, J.A.; Lyamani, H.; Titos, G.; Borras, E.; Olmo, F.J.; Alados-Arboledas, L. Impact of primary NO2 emissions at different urban sites exceeding the European NO2 standard limit. Sci. Total Environ. 2019, 646, 1117–1125. [Google Scholar] [CrossRef]
  46. Guo, H.; Chen, K.; Wang, P.; Hu, J.; Ying, Q.; Gao, A.; Zhang, H. Simulation of summer ozone and its sensitivity to emission changes in China. Atmos. Pollut. Res. 2019, 10, 1543–1552. [Google Scholar] [CrossRef]
  47. Su, Y.; Lu, C.; Lin, X.; Zhong, L.; Gao, Y.; Lei, Y. Analysis of Spatio-temporal Characteristics and Driving Forces of Air Quality in the Northern Coastal Comprehensive Economic Zone, China. Sustainability 2020, 12, 536. [Google Scholar] [CrossRef] [Green Version]
  48. Duan, Z.; Yang, Y.; Wang, L.; Liu, C.; Fan, S.; Chen, C.; Tong, Y.; Lin, X.; Gao, Z. Temporal characteristics of carbon dioxide and ozone over a rural-cropland area in the Yangtze River Delta of eastern China. Sci. Total Environ. 2021, 757, 143750. [Google Scholar] [CrossRef]
  49. Jia, B.; Wang, Y.; Wang, C.; Zhang, Q.; Gao, M.; Yung, K.K.L. Sensitivity of PM2.5 to NOx emissions and meteorology in North China based on observations. Sci. Total Environ. 2021, 766, 142275. [Google Scholar] [CrossRef]
  50. Zhang, Y.L.; Cao, F. Fine particulate matter (PM2.5) in China at a city level. Sci. Rep. 2015, 5, 14884. [Google Scholar] [CrossRef] [Green Version]
  51. Wang, Y.; Ying, Q.; Hu, J.; Zhang, H. Spatial and temporal variations of six criteria air pollutants in 31 provincial capital cities in China during 2013–2014. Environ. Int. 2014, 73, 413–422. [Google Scholar] [CrossRef]
  52. Wang, J.; Xie, X.; Fang, C. Temporal and Spatial Distribution Characteristics of Atmospheric Particulate Matter (PM10 and PM2.5) in Changchun and Analysis of Its Influencing Factors. Atmosphere 2019, 10, 651. [Google Scholar] [CrossRef] [Green Version]
  53. Jing, B.; Wu, L.; Mao, H.; Gong, S.; He, J.; Zou, C.; Song, G.; Li, X.; Wu, Z. Development of a vehicle emission inventory with high temporal–spatial resolution based on NRT traffic data and its impact on air pollution in Beijing—Part 1: Development and evaluation of vehicle emission inventory. Atmos. Chem. Phys. 2016, 16, 3161–3170. [Google Scholar] [CrossRef] [Green Version]
  54. Li, M.; Liu, H.; Geng, G.; Hong, C.; Liu, F.; Song, Y.; Tong, D.; Zheng, B.; Cui, H.; Man, H.; et al. Anthropogenic emission inventories in China: A review. Natl. Sci. Rev. 2017, 4, 834–866. [Google Scholar] [CrossRef]
  55. Hu, J.; Wang, P.; Ying, Q.; Zhang, H.; Chen, J.; Ge, X.; Li, X.; Jiang, J.; Wang, S.; Zhang, J.; et al. Modeling biogenic and anthropogenic secondary organic aerosol in China. Atmos. Chem. Phys. 2017, 17, 77–92. [Google Scholar] [CrossRef] [Green Version]
  56. Fiedler, V.; Nau, R.; Ludmann, S.; Arnold, F.; Schlager, H.; Stohl, A. East Asian SO2 pollution plume over Europe—Part 1: Airborne trace gas measurements and source identification by particle dispersion model simulations. Atmos. Chem. Phys. 2009, 9, 4717–4728. [Google Scholar] [CrossRef] [Green Version]
  57. Lian, X.; Huang, J.; Huang, R.; Liu, C.; Wang, L.; Zhang, T. Impact of city lockdown on the air quality of COVID-19-hit of Wuhan city. Sci. Total Environ. 2020, 742, 140556. [Google Scholar] [CrossRef]
  58. Wang, Y.; Yao, L.; Xu, Y.; Sun, S.; Li, T. Potential heterogeneity in the relationship between urbanization and air pollution, from the perspective of urban agglomeration. J. Clean. Prod. 2021, 298. [Google Scholar] [CrossRef]
Figure 1. The map of Sichuan Basin and the locations of 22 city stations.
Atmosphere 12 01504 g001
Figure 2. The annual average concentrations of pollutants in Sichuan Basin. The filled circle represents the mean concentration whereas the error bar denotes the range of the annual concentration. The data used in each city comes from every station during 2015–2020.
Atmosphere 12 01504 g002
Figure 3. Annual average concentration trend of the six pollutants.
Atmosphere 12 01504 g003
Figure 4. Seasonal variation in concentrations of air pollutants in Sichuan Basin. The vertical error bars represent the standard deviation values. Spring (March to March), Summer (June to August), Autumn (September to November), Winter (December to February of the following year).
Atmosphere 12 01504 g004
Figure 5. The monthly average PM2.5/PM10 ratio of each city.
Atmosphere 12 01504 g005
Figure 6. The monthly average PM2.5/SO2 ratio of each city.
Atmosphere 12 01504 g006
Figure 7. The monthly average PM2.5/CO ratio of each city.
Atmosphere 12 01504 g007
Figure 8. The monthly average SO2/NO2 ratio of each city.
Atmosphere 12 01504 g008
Figure 9. Air transport clustering trajectory in Chengdu during heavy pollution period, and the color of red and orange represent two different trajectories. The right picture shows the hourly average PM10 concentration of the four cities during the event. The shaded part represents the arrival time of the peak concentration.
Atmosphere 12 01504 g009
Figure 10. Annual mean concentrations of the pollutants at each site and comparison with the WHO guideline values (yellow shading) and National Grade-I (black shading) and Grade-II (dark gray shading) standards for air quality.
Atmosphere 12 01504 g010
Table 1. Urban areas, population, number of vehicles, and GDP of each city in the Sichuan Basin in 2018.
CityPopulationGDPPrimary IndustrySecondary IndustryTertiary IndustryVehicle Numbers
(10,000 Persons)(Billion Yuan)(Billion Yuan)(Billion Yuan)(Billion Yuan)(10,000 Units)
Chengdu (CD)163315,342.77522.596516.198303.99487.7169
Mianyang (MY)485.72303.82301.27929.41073.1549.9193
Deyang (DY)354.52213.87243.311071.13899.4340.5155
Leshan (LeS)326.71615.09165.92721.78727.3939.2793
Meishan (MS)298.41256.02186.5554.46515.0637.9811
Yaan (YA)154646.185.83303257.2711.1461
Ziyang (ZY)251.21066.53166.79507.61392.1331.0002
Zigong (ZG)2921406.71151.55653.71601.4566.1452
Yibin (YB)455.62026.37248.571006.73771.0751.8162
Luzhou (LZ)432.41694.97190.58882.97621.4218.2872
Neijiang (NJ)369.91411.75219.31610.8581.6425.1536
Chongqing (CQ)3101.7920,363.191378.278328.7910,656.13631.7233
Guang‘an (GA)324.11250.24173.52575.23501.4935.733
Nanchong (NC)6442006.03381.87824.05800.1117.9184
Suining (SN)320.21221.39165.64565.22490.5325.2796
Guangyuan (GY)266.7801.85118.1358.56325.1924.403
Dazhou (DZ)5721690.17326.24603.91760.0218.0632
Bazhong (BZ)332.2645.8898.27316.39231.229.0715
Aba (AB)94.4306.6749.55139.53117.5924.2416
Ganzi (GZ)119.6291.265.47121.78103.9523.3053
Liangshan (LS)490.81533.19307.61613.13612.4535.1002
Panzhihua (PZH)123.61173.5239.74731.13402.6525.5248
Table 2. Comparison of the annual average concentration of the four pollutants with the available standards.
SpeciesChinaWHOUSEPAEUAustraliaIndiaSichuan Basin (This Study)
Grade-IGrade-II
PM2.5153510152584039.75
PM10407020-40256075.19
SO22060---20 *5017.76
NO240404053 *4030 *4028.17
Values are in μg m−3, * Values in ppb (parts per billion).
Publisher’s Note: MDPI stays neutral with regard to jurisdictional claims in published maps and institutional affiliations.

