1. Introduction
Spatial and temporal variability of precipitation amounts in Poland is very high. The diversity of relief means that the areas with the lowest precipitation covering the central part of the country receive less than 500 mm of precipitation annually. On the other hand, on the upper border of the moderately warm story in the Western Carpathians, precipitation of 1000 mm should be expected, while on the upper border of the moderately cool story, which is the limit of agricultural use, it was 1400 mm [
1,
2,
3].
The location of Poland in moderate latitudes of Central Europe determines high variability of weather in particular years. The values of the lowest and highest precipitation in Warsaw may vary from 60% to 150% of the standard multi-year average for the year, 27% to 250% for seasons, and even 5% and 505% for October [
4,
5]. In the summer, the maximum daily sums may exceed the multi-year average monthly sums. Such high variability of precipitation with simultaneous variability of values of other meteorological elements results in different meteorological conditions of crops in particular years manifested by the occurrence of dry periods and periods with an excess of precipitation.
In recent years, a growing interest among climatologists, hydrologists, environmentalists, farmers, and political activists has been the observed and projected climate change [
6]. The trends of precipitation changes in a warming climate have not yet found a clear assessment. In the area of Poland lying between northern Europe, with marked and predicted increasing trends of annual precipitation sums and southern Europe where decreasing annual precipitation sums are observed and predicted, no major changes in precipitation are observed and predicted, with only a very slight increasing trend in some areas [
7,
8]. The largest increases in precipitation with different significance of changes were observed in the northern part of Poland with different levels of significance and in a small area of south-eastern Poland [
9]. In the light of the analysis of observational series averaged for the area of Poland, only the increasing variability of precipitation sums is undeniable [
10,
11]. Rising air temperatures, especially since the second decade of the 20th century, have increased evapotranspiration and may be a significant cause of increased drought caused by insufficient precipitation among other things [
12,
13,
14].
In contrast to floods, the effects of droughts are not immediate. The phenomenon increases slowly and its consequences become visible over a longer period of time. Furthermore, they are initially less visible and extend over a larger area than in the case of other extreme weather events [
15,
16,
17]. The impact on the economy in a drought-affected region depends not only on the duration, intensity, and spatial extent of the phenomenon, but also on the vulnerability of the environment to the negative effects of droughts. On soils with deep groundwater levels and low useful retention, which prevail in Poland, with relatively low and variable precipitation and the observed increase in air temperature as well as the signaled increase in the frequency of meteorological extreme events, an increase in both the frequency and intensity of drought phenomena should be expected [
18,
19].
In the extensive literature on droughts, and particularly on droughts in Poland, one can distinguish several research trends or thematic sections covering the phenomenon in question. Drought as a meteorological phenomenon unfavorable for agriculture does not occur suddenly but it shows a specific cycle of development. Dębski [
20] breaks down this cycle into four phases: distinguishing atmospheric drought, soil drying out transforming into soil drought, lowering of groundwater level, occurrence of deep lows in rivers and drying out of springs and small watercourses–hydrological drought, and long-term lowering of groundwater resources defined as hydrogeological drought. Extended atmospheric drought may develop into soil drought, often referred to as agricultural drought. It occurs when a lack of precipitation, usually combined with high air temperatures, causes the soil to dry out, severely restricting the growth and development of crops and resulting in a significant decrease in crop yields. The time scale over which soil drought can occur is 1–3 months [
15]. The prolonged period of low precipitation, often in combination with increased air temperature, leads to hydrological drought manifested by decreased water flow in rivers and water level in lakes, and at a further stage to hydrogeological drought manifested by decreased groundwater resources. The phases distinguished by the author correspond to the divisions into atmospheric, soil, and hydrological droughts often used in the literature [
21,
22].
Each of the mentioned phases is characterized by a different course and requires different research methods. One of them is the method of rain-free sequences. In Poland, Schmuck [
23] was the first to analyze droughts on the basis of rain-free sequences. The author together with Koźmiński [
24] presented a spatial distribution of frequencies of droughts lasting over 8 and 17 days in Poland. Drought monitoring uses many indices based on precipitation alone or precipitation and other meteorological elements and indices, often taking into account evapotranspiration of plants and soil water reserves, as well as groundwater. A review of this is provided by Przedpełska [
21] and later by Łabędzki [
15,
25]. The simplest and the most widely used are indices using precipitation in such modifications as the relative precipitation index RPI [
4] and the standardized precipitation index SPI [
26,
27,
28,
29].
Drought monitoring in agricultural areas should take into account meteorological evaporation conditions in addition to precipitation. For example, we can mention the Sielianinov hydrothermal index, the De Martonne dryness index, index evapotranspiration, or standardized climatic water balance [
30,
31,
32,
33]. The Institute of Soil Science and Plant Cultivation–State Research Institute (IUNG-PIB) in Puławy, at the request of the Ministry of Agriculture and Rural Development, developed and launched an agricultural drought monitoring system (PL abbr. SMSR). The importance of the problem of drought monitoring is also emphasized by the fact that it has found appropriate legal empowerment [
34]. Based on the Act, the Ministry of Agriculture and Rural Development carries out the task of drought monitoring by specifying that the IUNG-PIB determines the current values of climatic water balance (CWB) “in the period from 1 June to 20 October, within 10 days after the end of the six-day period, indicators of climatic water balance for individual crop species and soils, broken down by voivodeship, on the basis of data provided by the Institute of Soil Science and Plant Cultivation–State Research Institute” [
35].
Drought is a relative phenomenon and its assessment should be related to the current agricultural area and a specific crop. Therefore, by analyzing the current state of research, a number of studies on drought can be listed for particular regions, such as Schmuck [
36] for Lower Silesia, Prawdzic and Koźmiński [
37] for the Szczecin province, Konopka [
38] for the Bydgoszcz region, and Łabędzki [
39] for the Bydgoszcz-Kujawy region, as well as publications on selected crops, e.g., winter wheat [
40], medium–late and late potatoes [
41], or spring cereals [
42].
Characteristics of particular droughts or drought periods, such as the 1959 drought [
43], the drought of 1969 [
44], the dry period of 1982–1992 by Bobiński and Meyer [
45], the drought of 1992 [
46], or the drought of 2005 [
47], have been developed. A few sentences on the course and effects of droughts in 2003 and 2005 may be found in the monograph by Łabędzki [
15] devoted to agricultural droughts in Poland.
As for drought problems discussed directly in this paper and concerning precipitation deficits and drought cases in Poland in the first years of the 20th century, it is worth mentioning the first study by Hohendorf [
48] on precipitation deficits and excesses for the period 1891–1930 and a more recent one by Dzieżyc et al. [
49] for the realities of the period from 1952–1980, Farat et al. [
50] for the 40-year period from 1951–1990, Ziernicka-Wojtaszek and Zawora [
51] for the 30-year period from 1971–2000, Doroszewski et al. [
14] for the period from 1961–2010, and Przybylak et al. [
52] for the period of over 1000 years from the establishment of the Polish state in the year 1996 to 2015.
In recent years, studies from the stream of contemporary climate change taking into account the impact of rising temperature on the occurrence of droughts have become increasingly frequent [
53,
54,
55,
56]. Drought is increasingly monitored using satellite data [
57,
58].
In the warmest year in the history of observation, 2019, especially in the summer, another intense drought occurred in Poland. This study uses preliminary documentation and characterization, and is a continuation of such studies made in the 20th and 21st centuries for dry years, such as 1959, 1969, 1982, 1983, 1989, 1992, 2000, 2003, 2005, 2008, and 2013. The study includes analysis of the causes, the course, and the consequences of the summer drought of 2019, and characterizes consecutive drought-meteorological, agricultural, hydrological, and hydrogeological phases. It shows, by comparison with extreme thermal droughts of 2003, 2018, and 2019 in Central Europe, its uniqueness. It proves that, in terms of climatic water balance values in summer, it is a case of maximum maximorum, which means that there is no other value in the series that is above or at least at the level of this maximum. It is a typical case of thermal drought caused not so much by precipitation deficit as by intensive evapotranspiration, following extremely high air temperatures. Hence, the methods which were atypical or modified for drought analysis, such as the analysis of months with precipitation frequency lower than the average rather than the analysis of classical sequences of days without precipitation, or the additional analysis of the simultaneous influence of precipitation and air temperature on the value of climatic water balance using the method of stepwise multiple regression, were used to show the leading role of temperature in generating the drought phenomenon.
2. Materials and Methods
The research material consists of verified, homogeneous monthly mean values of insolation, air temperature, and precipitation totals from 47 meteorological stations evenly distributed across Poland for the periods June–August 2019 and June–August 1981–2010 (
Figure 1). Due to the insufficient number of stations, mountainous, and especially high-mountainous, areas are poorly represented. Data on sunshine (hours), temperature (°C), and precipitation (mm) were taken from the database of the Institute of Meteorology and Water Management. The study material was evaluated in terms of the degree of data homogeneity [
59].
In addition to meteorological data, the following were used: maps published within the agricultural drought monitoring system of IUNG–CWB, maps with comments from 14 reporting periods, summaries of drought-prone areas for the mentioned 14 reporting periods, all 14 studied plants and 16 voivodeships, and summaries of drought occurrence for selected communes of the Lubuskie voivodeship on particular soil categories for the year 2019.
The characteristics of weather patterns, i.e., temperature, precipitation, and synoptic situations against multi-year averages contained in the Bulletin of Climate Monitoring of Poland of the Institute of Meteorology and Water Management and the Bulletin of the National Hydrological and Meteorological Service for 2019; data on the outflow from the Bulletin of the National Hydrological and Meteorological Service for 2019; and data on the groundwater table level from the Hydrogeological Annual Report Polish Hydrogeological Survey for 2019 were also used.
The scope of the work included: (1) Characteristics of the weather pattern during the 2019 drought: (a) pluviothermic December 2018 to October 2019 including days with maximum temperature equal to and above 25 °C on the background of the multi-year (1981–2010); (b) characteristics of the occurrence of probability of extreme values of temperature and precipitation on the background of the multi-year (1951–2018); (c) frequency of synoptic situations on the background of the multi-year (1951–2018); (d) characteristics of the driest months June to August 2019 on the background of the multi-year (1951–2019). (2) The characteristics of meteorological drought: (a) the low rainfall frequency method for the entire summer drought period; and (b) the relative precipitation method RPI for the period of June–August. (3) The characteristics of agricultural drought: (a) on the basis of the climatic water balance (CWB) values for the following months June, July, and August 2019 and in the period 1981–2010; (b) the temporal dynamics of drought (during the growing season); (c) a ranking of the provinces affected by the drought; and (d) the vulnerability of particular crops to drought. (4) Elements of hydrological drought. (5) Elements of hydrogeological drought.
Due to the extraordinary nature of the phenomenon, very different methods were used.
The method for periods of low precipitation frequency.
It was not possible to distinguish classical sequences of rain-free days, even in the areas regarded as the driest, comprising south-western and central-western parts of Poland. Precipitation-free sequences of several days at the most, often lasting several days, were separated by one, two, or even several days of local precipitation of thunderstorm character. Attempts were made to separate such drought sequences interrupted by rainfall in June–August by the predominance of rain-free days in the selected periods. At the same time, meteorological stations were found at which precipitation dominated separated by rainless days and which could not be regarded as drought periods. These were high-mountain stations and the Lesko station and stations in north-central and north-eastern Poland, such as Lębork, Elbląg, Olsztyn, Kętrzyn, and Suwałki. The limiting value was the average multi-year number of days with precipitation amounting to 41% of the duration of the summer period from June–August [
60]. On the basis of this criterion, drought periods with rare precipitations were distinguished, in which the average number of days with precipitation amounted to 24%. In the remaining periods, not included in the drought periods, the number of days with precipitation amounted to 43%, which slightly exceeded the average number of days with precipitation—41%.
The relative precipitation method RPI.
The relative precipitation index RPI [
4] is defined as the ratio of the total precipitation in a given period to the average multi-year sum, taken as the norm:
where
P—the total precipitation in the study period (mm); and
—the average precipitation in the studied multi-year period (mm). The 1981–2010 norm was assumed.
The method of climatic water balance (CWB).
The climatic water balance (
CWB) was calculated as the difference between precipitation (
P) and potential evapotranspiration (
PET):
where
P—precipitation (mm); and
PET—potential evapotranspiration (mm).
To calculate the potential evapotranspiration, the simplified formula developed by Doroszewski and Górski [
61], based on Penmann’s algorithm [
62], was used:
where:
PET—the monthly potential evapotranspiration (mm ∙ [month]^(−1));
f—the length of the middle day of the month (hour);
h—the monthly insolation (hour);
t—the average monthly air temperature 2 m above the ground surface (°C).
The Institute of Soil Science and Plant Cultivation (IUNG) method of determining climatic water balance (CWB) in 6-decade periods with a step every decade was modified to characterize the CWB in monthly periods. The calculated values of climatic water balance for the months of June, July, and August were compared with the same months from the multi-year period from 1981–2010 and with the corresponding IUNG reporting periods for the estimated monthly periods.
The temporal dynamics of drought.
The dynamics of drought over time in the growing season were characterized by presenting—for the entire area of Poland without regional differentiation (discussed in other chapters)—the values of climatic water balance (mm) and the area at risk of drought (%) in the following 14 reporting periods from 21 March to 30 September 2019: reporting period 1 (from 21 March to 20 May), reporting period 2 (from 1 April to 31 May), reporting period 3 (from 11 April to 10 June), reporting period 4 (from 21 April to 20 June), reporting period 5 (from 1 May to 30 June), reporting period 6 (from 11 May to 10 July), reporting period 7 (from 21 May to 20 July), reporting period 8 (from 1 June to 31 July), reporting period 9 (from 11 June to 10 August), reporting period 10 (from 21 June to 20 August), reporting period 11 (from 1 July to 31 August), reporting period 12 (from 11 July to 10 September), reporting period 13 (from 21 July to 20 September), and reporting period 14 (from 1 August to 30 September).
Ranking of voivodeships by area at risk of drought.
A ranking of voivodeships by drought risk, illustrating spatial diversification of drought phenomenon, in addition to values of climatic water balance, was presented for two time periods: the whole reporting period covering the vegetation period from 21 March to 30 September, and the reporting period 8 of the highest drought intensity covering the months of June and July. The corresponding summaries for voivodeships published in IUNG reports for the individual 14 reporting periods were used. Voivodeships were ranked in terms of the area at risk of drought based on the average value of the 14 reporting periods (as above) and the eighth period with the highest drought intensity.
Sensitivity of crops to drought.
Sensitivity of crops to drought was determined by the percentage of cases of drought occurrence in all 14 reporting periods for the entire Poland, in all reporting periods for the three voivodeships where drought was the most intense (i.e., lubuskie, wielkopolskie, and łódzkie voivodeships), and for three voivodeships for the driest reporting period covering June and July. The 14 crops studied by IUNG were ranked from the most drought-sensitive to the least drought-sensitive on the basis of the average risk for the whole of Poland, within the three voivodeships most threatened by drought and within those voivodeships in the eighth period with the highest drought intensity.
Hydrological aspects of drought.
Hydrological aspects of drought were characterized by the acceleration of the timing of minimum flows and comparison of minimum flows with multi-year averages.
Hydrogeological aspects of drought.
Hydrogeological aspects of drought were characterized on the basis of the difference in the level of the groundwater table with respect to multi-year average values in individual months.
The results on the background of drought patterns in different European countries are presented against a historical reconstruction of a 254-year climate database for Europe and drought projections in Europe for the period 2041–2070 compared to 1981–2010 for two emission scenarios: RCP4.5 and RCP8.5.
The uniqueness of the 2019 drought phenomenon against the background of (compared to) the hottest and driest years of 2003 and 2018 was demonstrated by comparing the values of the climatic water balance in individual months of the summer (June–August) and for the whole summer period in the stated three years. The results of the comparison are included in the final “Discussion” chapter.
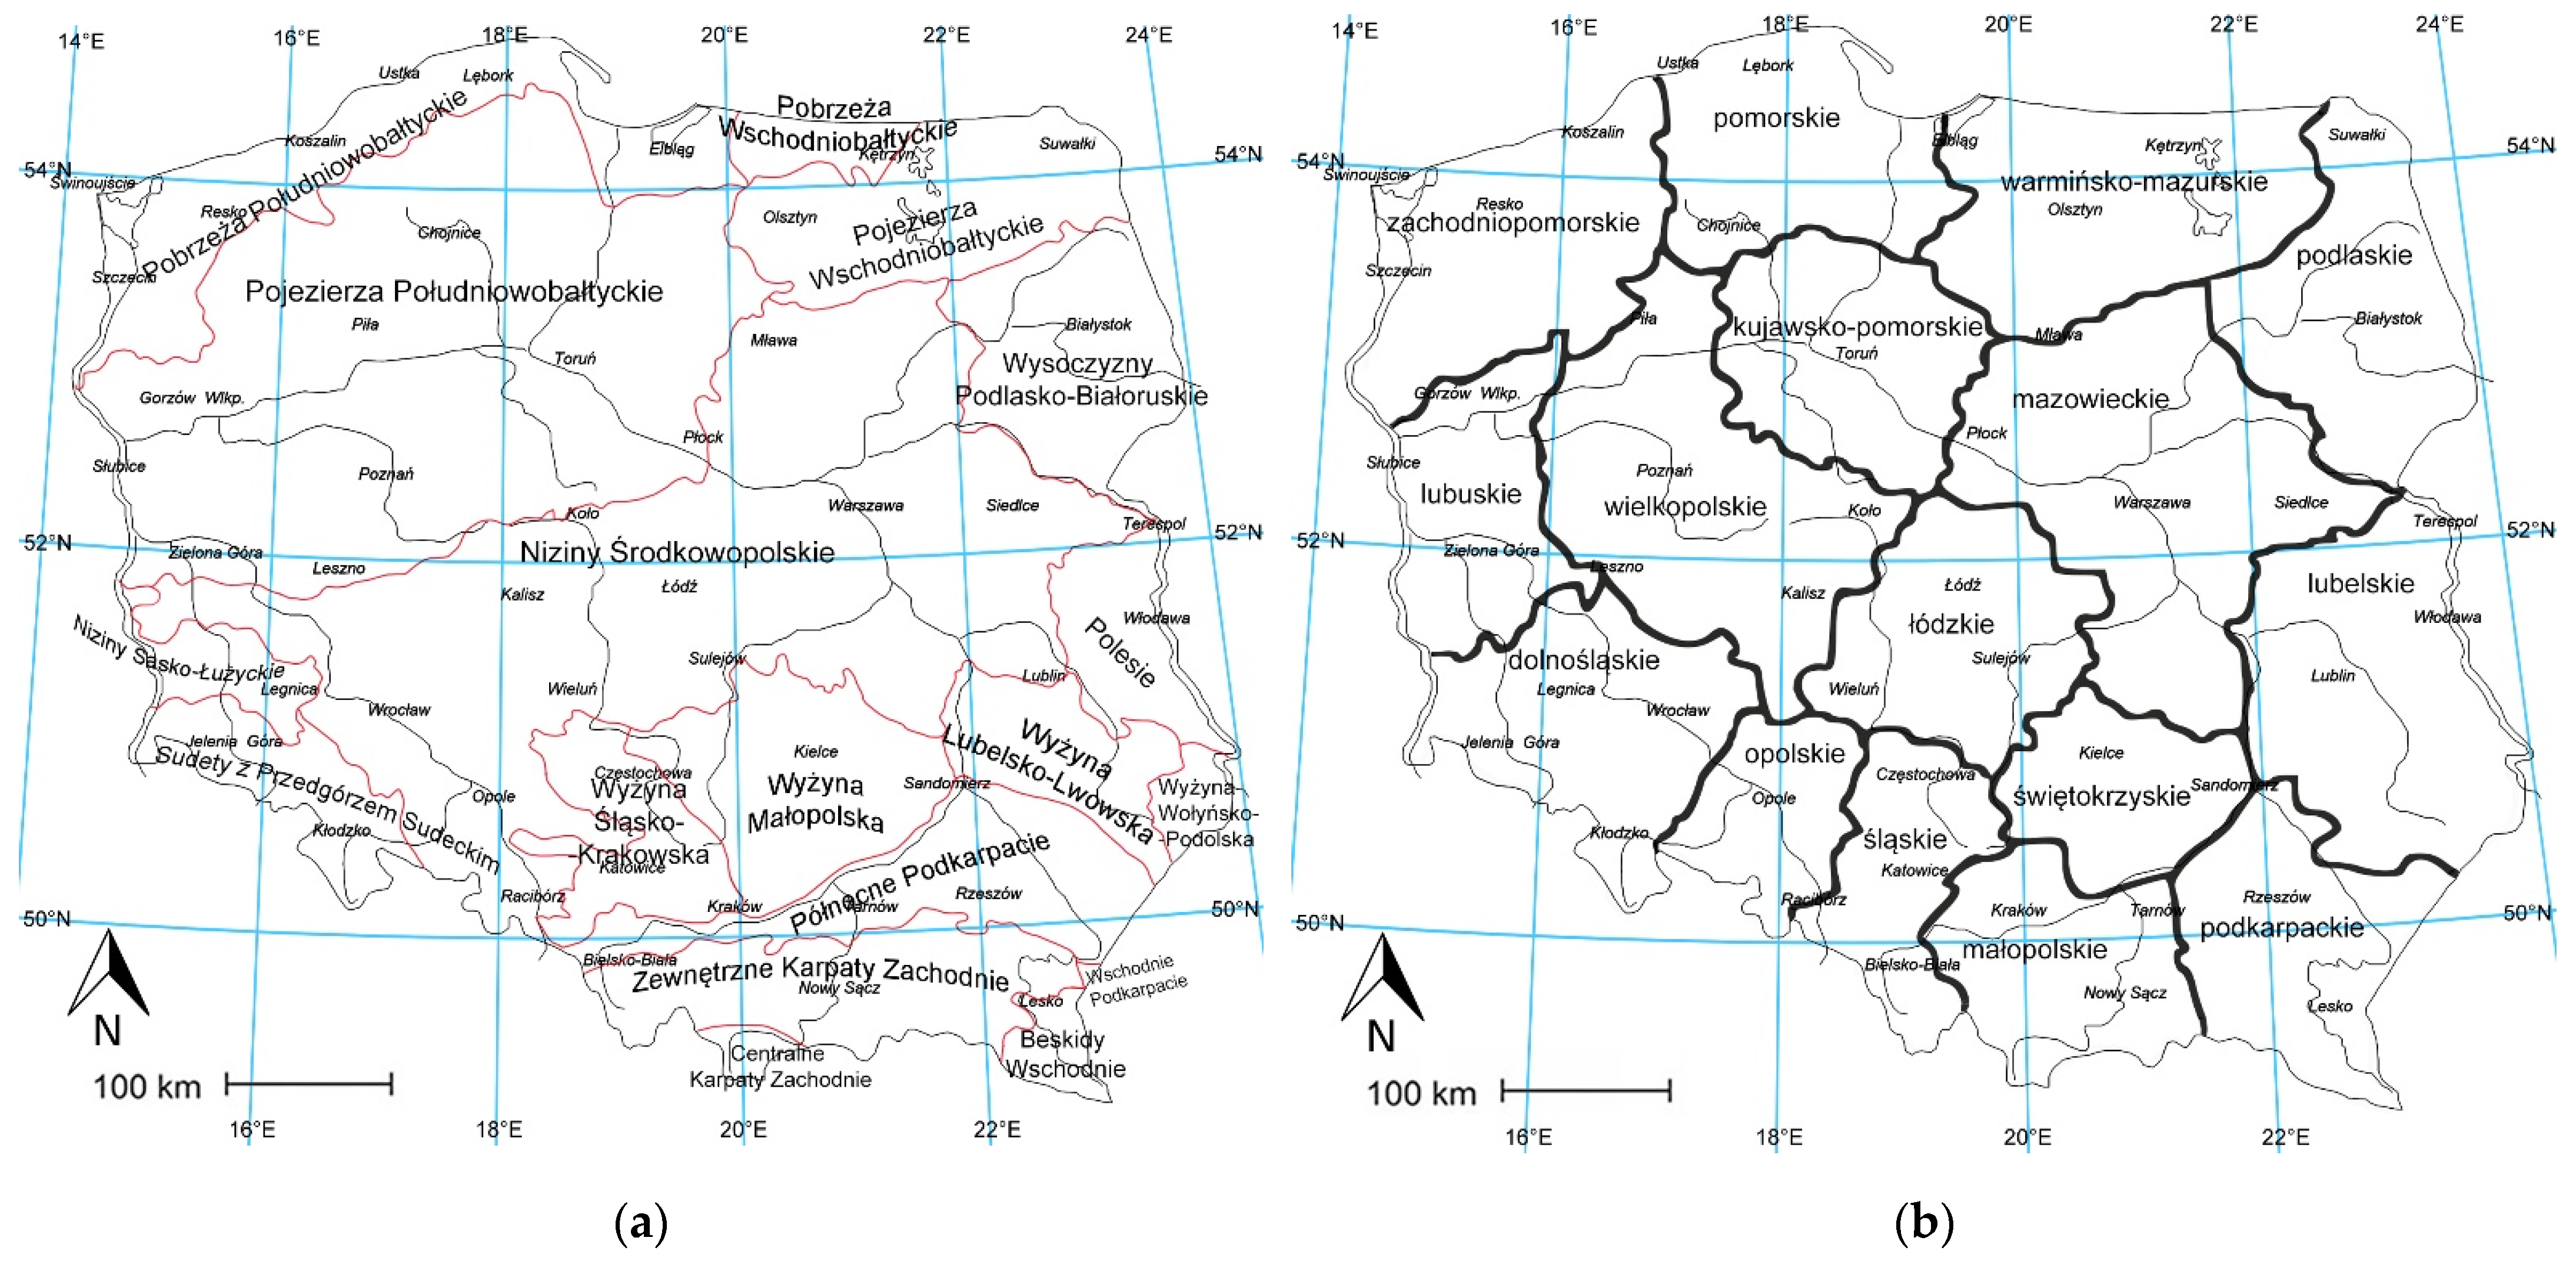
The maps of spatial distribution of drought were made in the Surfer 10 program. The kriging method using spherical function fitting was used for their interpolation. Taking into consideration small scale of the maps, it was evident that they had illustrative character. To describe spatial variability of precipitation, the names of mesoregions according to physico-geographical regionalization by Kondracki [
63] were used.
3. Results
3.1. Synthesis of Weather Patterns December 2018–October 2019 for Air Temperature, Precipitation, Atmospheric Circulation
The months leading up to the 2019 growing season were treated more generally, more specifically the driest months of June, July, and August.
The winter period and the April–October 2019 growing season in question can be characterized as follows:
December 2018 was anomalously warm with a deviation of 2.0 °C from the 1981–2010 norm and very wet with precipitation of 126–150% of normal with snow cover lingering for several to a dozen days.
January 2019 was slightly cool with a temperature deviation from normal of −0.5 °C on the borderline between humid and very humid with precipitation of the order of 125% of normal with snow cover persisting throughout the month, in warmer regions a few to a dozen days.
February was very warm with temperature deviation from the norm of 3.0–4.0 °C and was dry with precipitation of 80% of the norm with snow cover lasting several days, especially in colder regions.
March was anomalously warm with temperature deviation from the norm of 2.0–3.0 °C and was slightly dry with precipitation of 80% of the norm.
April, in terms of temperature, was anomalously warm with temperature deviations from the norm exceeding 2.0 °C in the central-western part of Poland, in the Mazowiecka Basin and near Suwałki. Only the coast, i.e., the Sudety Mountains and the Carpathians, saw very warm conditions. In terms of precipitation, the month was normal in the south of the country and, locally, it was humid and very humid there. In the remaining part of Poland, April was mostly extremely dry. Anticyclonic situations prevailed: 57% over cyclonic 20% and zero 23%. Advections from the north-east direction prevailed for 30% of days, followed by advections from the east, the south-east, and the south for 20% each.
May was the only month of the year with temperatures lower than normal within the limits of −0.7 °C and was very cold in the prevailing area of the country. In the prevailing area of Poland, it exceeded the precipitation norm and was the month with the highest relative precipitation in the year within 145% of the norm. Anticyclonic situations prevailed at 54%, and the prevailing north-west direction of advection was 28%. This frequency was more than twice the frequency of the 1951–2018 multi-year average of 12%.
June was extremely warm over most of Poland, with temperatures within the range of 5.0–6.0 °C. Across about 80 percent of the country, there were days with a maximum temperature of >25.0 °C every day. In 18 days on almost half of the Polish territory, the maximum temperature exceeded 30.0 °C. The probability of such a warm June can be estimated at less than 1%. June was extremely dry on most of the country, and only Eastern Pomerania and Warmia and Mazury received normal or even wet precipitation. The probability of occurrence of such low precipitation at representative meteorological stations can be estimated as 1% at the Kraków station, 27% at the Słubice station, 31% at the Toruń station, 6% at the Warszawa station, and 11% at the Wrocław station. Anticyclonic situations prevailed, accounting for 59%. The dominant direction of advection was southerly. Advection from the south direction was 2.5 times higher than the average of 8%. The frequency of circulation from the south-east direction was twice as high as the average for the 1951–2018 period.
July was normal in terms of temperature, only slightly warm in the Carpathians, and very warm in the Sudetes. The probability of such a warm July can be estimated at 40%. July in the prevailing area of Poland was dry or extremely dry. After June and April, it was the third relatively driest month of the year. The probability of occurrence of such low precipitation at representative meteorological stations can be estimated as 59% at the Kraków station, 45% at the Słubice station, 16% at the Toruń station, 20% at the Warszawa station, and 22% at the Wrocław station. Cyclonic situations accounted for almost half of the cases. Advection from the north-east direction prevailed strongly, accounting for 33% of all cases in this month.
August was extremely warm over the prevailing area, with anomalies exceeding 2.0 °C in the warmest places. The probability of such a warm August can be estimated at 5%. August was humid in the east and south-east of Poland, while the remaining areas were dry and very dry, and, in the Lubuskie Land, it was extremely dry. The probability of occurrence of such a dry August can be estimated as 59% at the Kraków station, 6% at the Słubice station, 2% in Toruń, 20% in Warszawa, and 30% in Wrocław. Anticyclonic situations prevailed with a frequency of 44%. South-west-oriented advection prevailed with a frequency of 29%, followed by south-oriented advection with a frequency of 16%.
September was warm and sometimes slightly warm. September on the prevailing area of Poland was in the range between humid and extremely humid, only in the south-east, and, locally, in Silesia and the Sudeten basins, September was dry or very dry. Advection from the north-west direction prevailed with a frequency of 17%, which was 8% higher than the norm. Anticyclonic, cyclonic, and null situations occurred with an equal frequency of 33%.
October was generally very warm. The month was dry and very dry over the prevailing area of Poland, and, locally, in the center of the country, in the east, and in the south, it was even extremely dry. Cyclonic systems prevailed, accounting for 41%, with zero circulation 38%. Advection from a southernly direction with a frequency of 20% was dominant, which was 7% higher than normal. Advection from west direction was frequent—19%, also 7% more frequent than the norm, north-east direction—16% which was 9% more frequent than the norm.
Driest months (June, July, and August).
June with a temperature deviation of 5.0 °C for the whole Poland was the warmest month in the period since 1951. Although in the period 1951–2019 there were extreme years with very high temperatures as in 1964 with a deviation of 2.2 °C and in 1979 with a deviation of 1.9 °C but they were within 2.0 °C or below.
July was no longer so warm but normal. Years with temperature deviations above 2.0 °C occurred in the period since 1951 in 2006 with a deviation of 3.5 °C, with a deviation of 2.6 °C in 1994 and with a deviation of 2.4 °C in 2010.
In August, which was an extremely warm month in the mentioned period 1951–2019, there were years even warmer, such as 2015 with a deviation of 3.5 °C, 2.7 °C in 1992, 2.6 °C in 2018, and 2.1 °C in 2002.
As far as the moisture characteristics of the year 2019 are concerned, in the light of the flows for the whole area of Poland for the period 1951–2019, it ranks fifth after the driest years of 1954, 2015, 2016, and 1952 [Bulletin of the National Hydrological and Meteorological Service No. 13/215 2019].
3.2. Periods of Low Precipitation Frequency
The summer drought in terms of periods of low precipitation frequency began on 29 May with the change from cyclonal to anti-cyclonal circulation, which lasted for very different periods of time reaching 100 days in Warsaw and 101 days in Zielona Góra, i.e., until the first days of September. The longest period, i.e., exceeding 90 days, occurred at stations located in the Central Poland Lowlands (up to Warsaw) and the southern part of the South Baltic Lake District. On the outskirts of the mentioned area and in the Lublin Upland, the length of this period was shorter, of the order of 60–90 days. In the Sandomierz Basin and lower parts of the Sudety Mountains, it was a period of 30–60 days, and, in the Carpathian, the period lasted from several to twenty days. On the South Baltic Coast in its western and central part, this period lasted from 30 to 30 several days, while, in the Podlasie–Byelarus Uplands and Podlasie, the period lasted in between 35–37 days. In the surroundings of the Gulf of Gdańsk, the Eastern Baltic Coast, and the Lake Districts, the period of low precipitation frequency did not occur (
Figure 2).
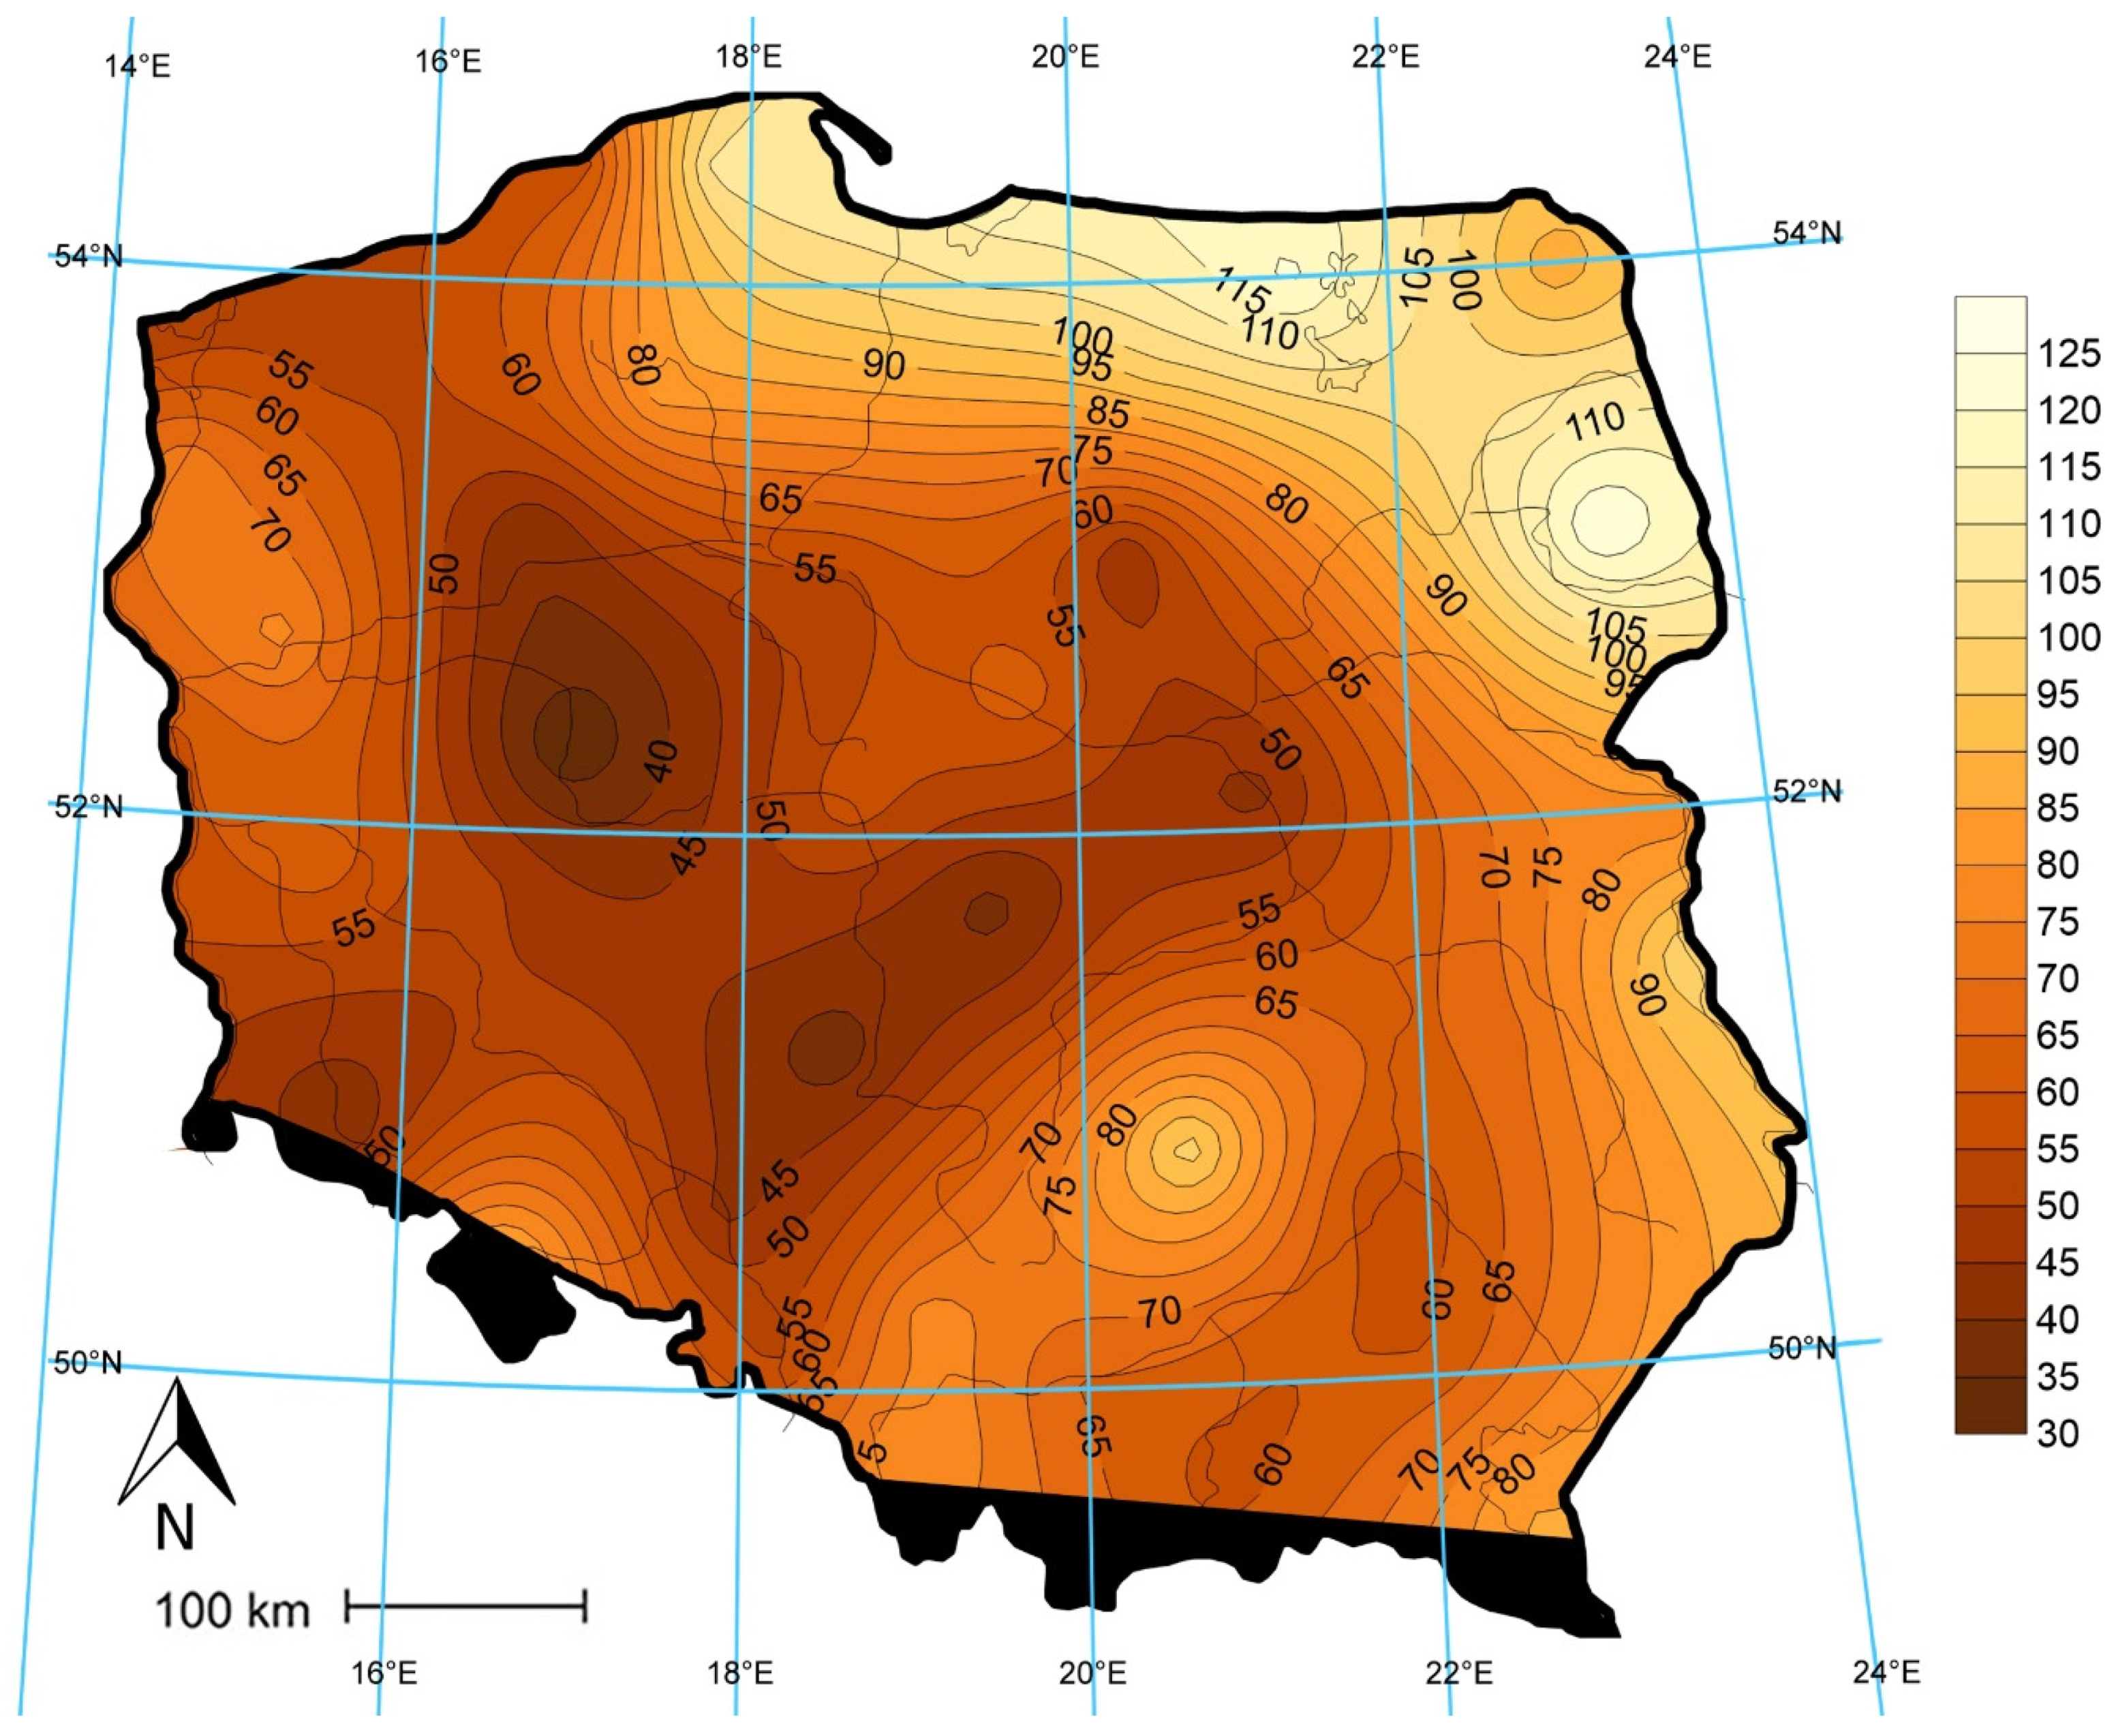
3.3. Percentage of Normal Rainfall June–August 2019
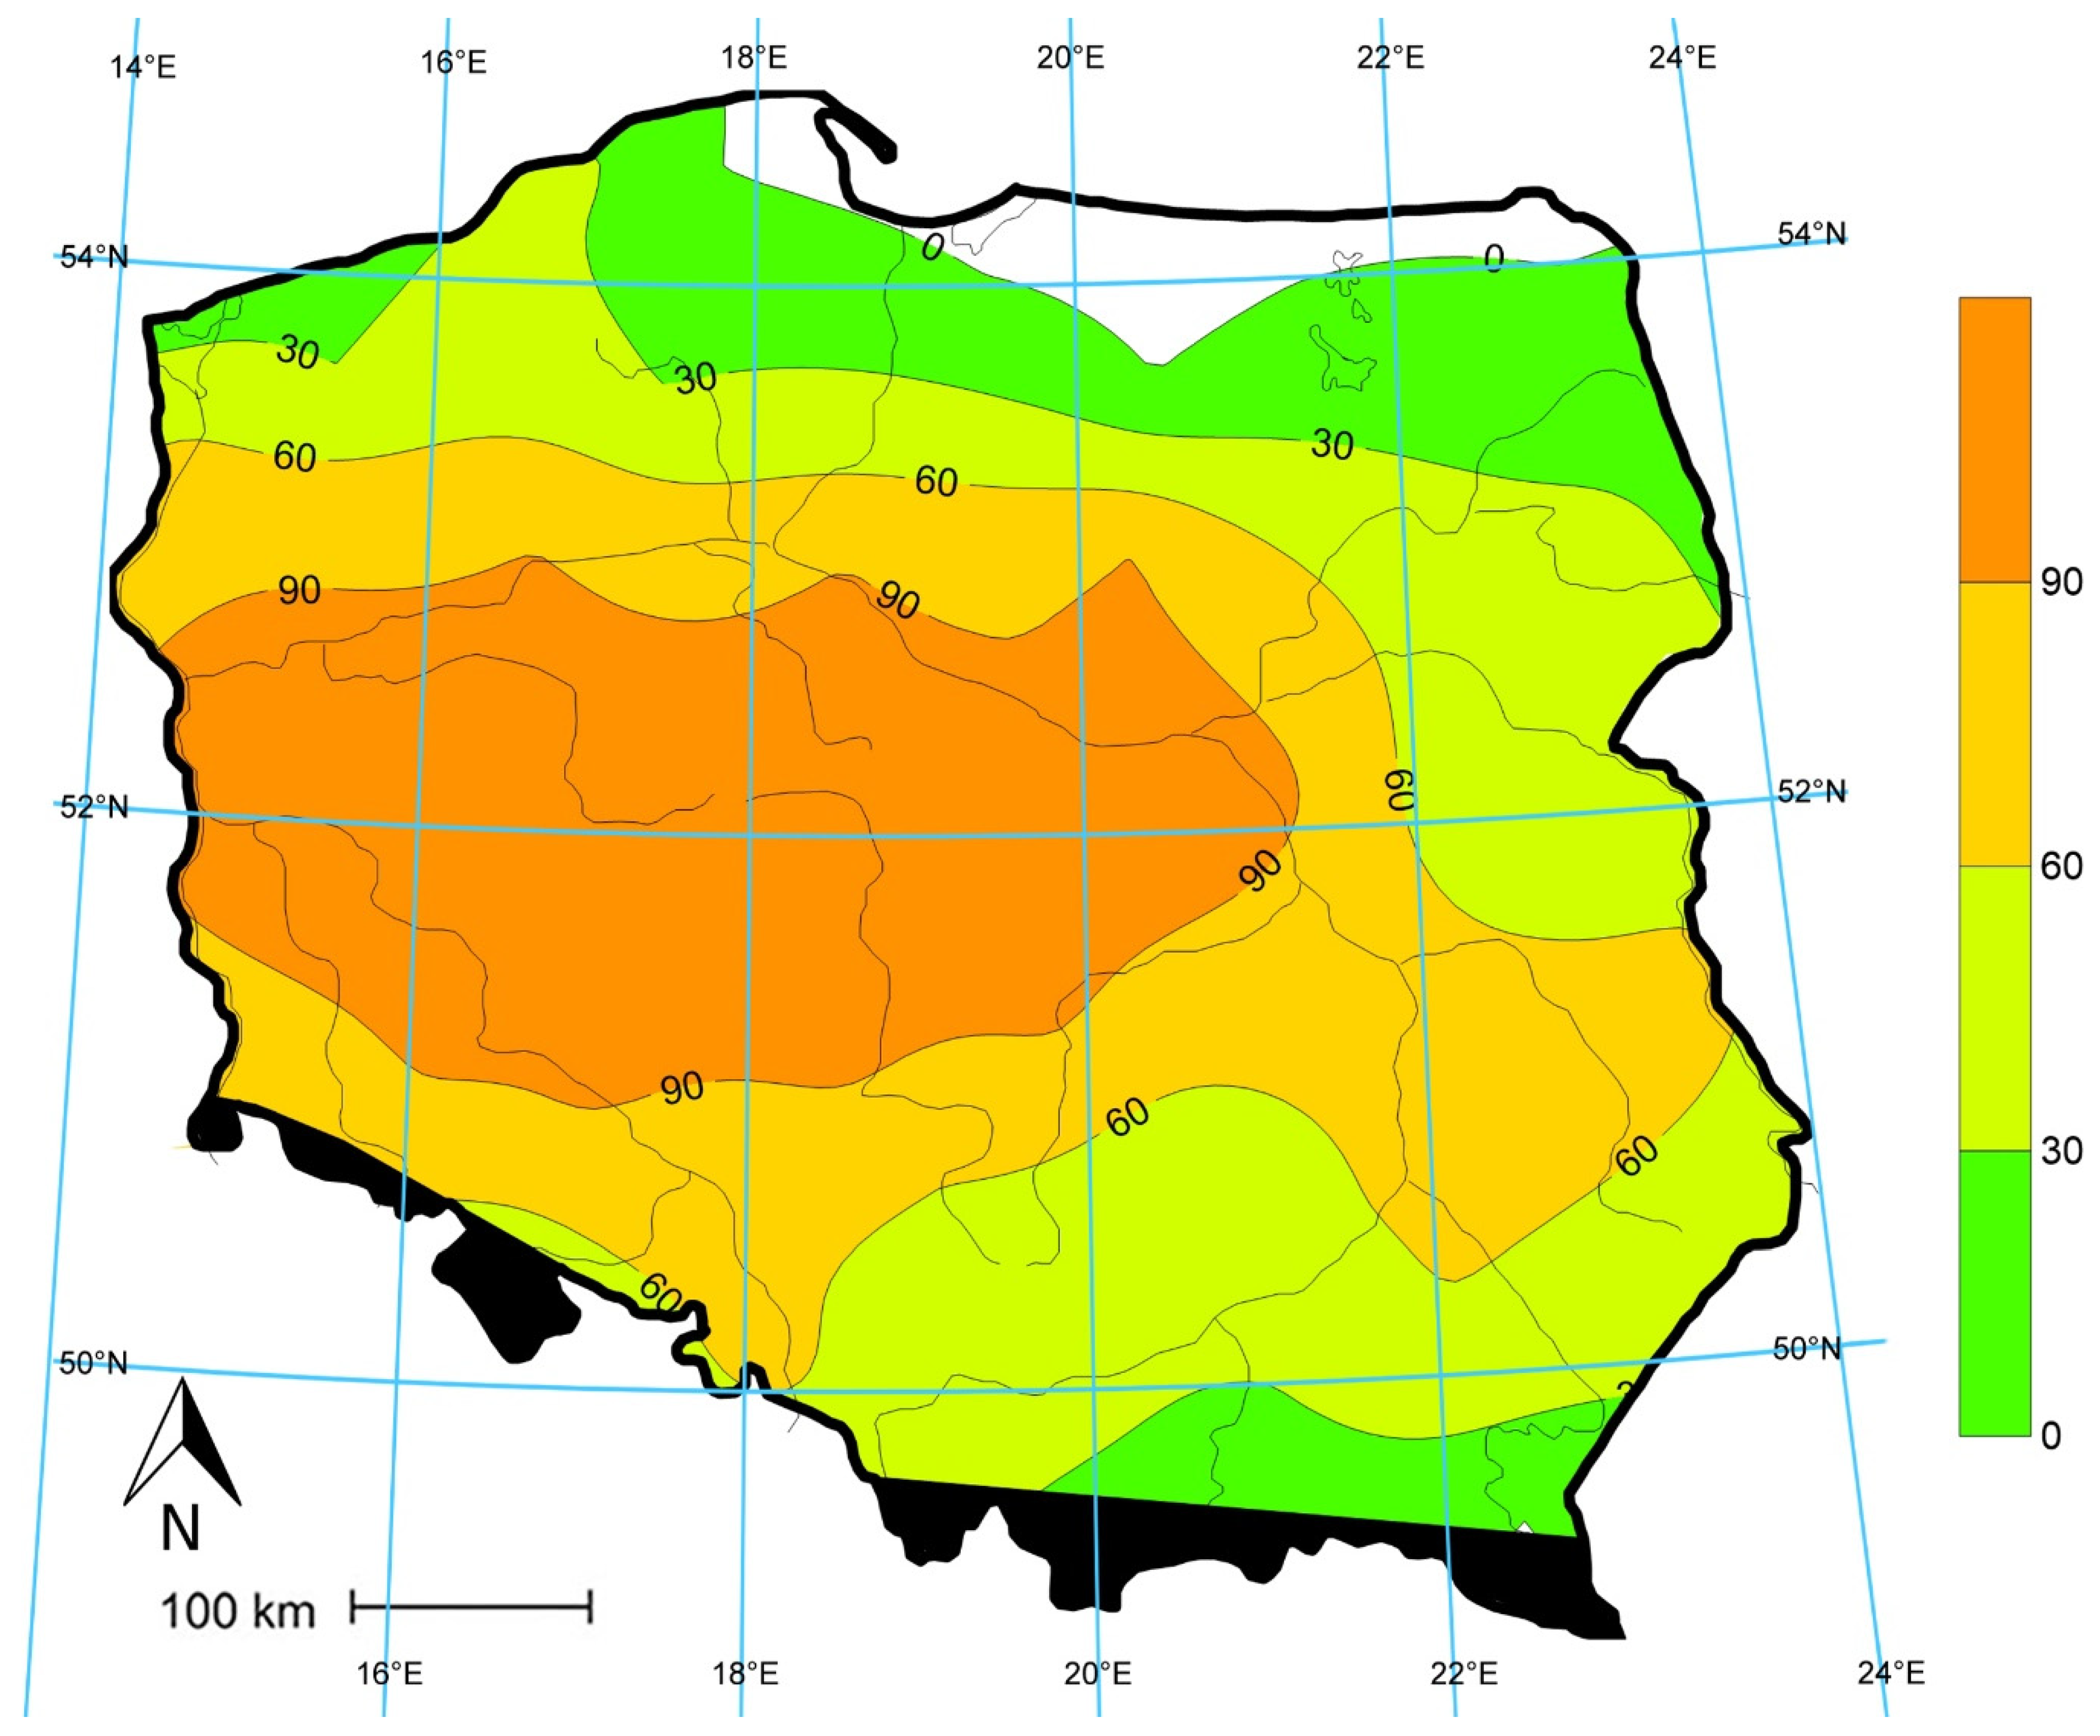
From June to August 2019 in the South Baltic Lakes belt and the Central Polish Lowlands, precipitation totals were 30–60% of normal with a minimum of 30.1% in Poznań. Slightly higher values of precipitation occurred in the western part of the South Baltic Coast and Lake Districts belt within 70–90% of the norm. Values exceeding 90% of the precipitation norm occurred in the southern part of the Sudety Mountains with the Sudeten Foreland, in the northern part of the Małopolska Upland, in the western part of the Outer West Carpathians, and in the eastern part of Poland. The highest values of precipitation were recorded in the eastern part of the South Baltic Coast, the Eastern Baltic Coast, and the Podlasie–Byelarus Uplands within 100–125% of the norm. The average precipitation in Poland was only 66.5% of the norm (
Figure 3).
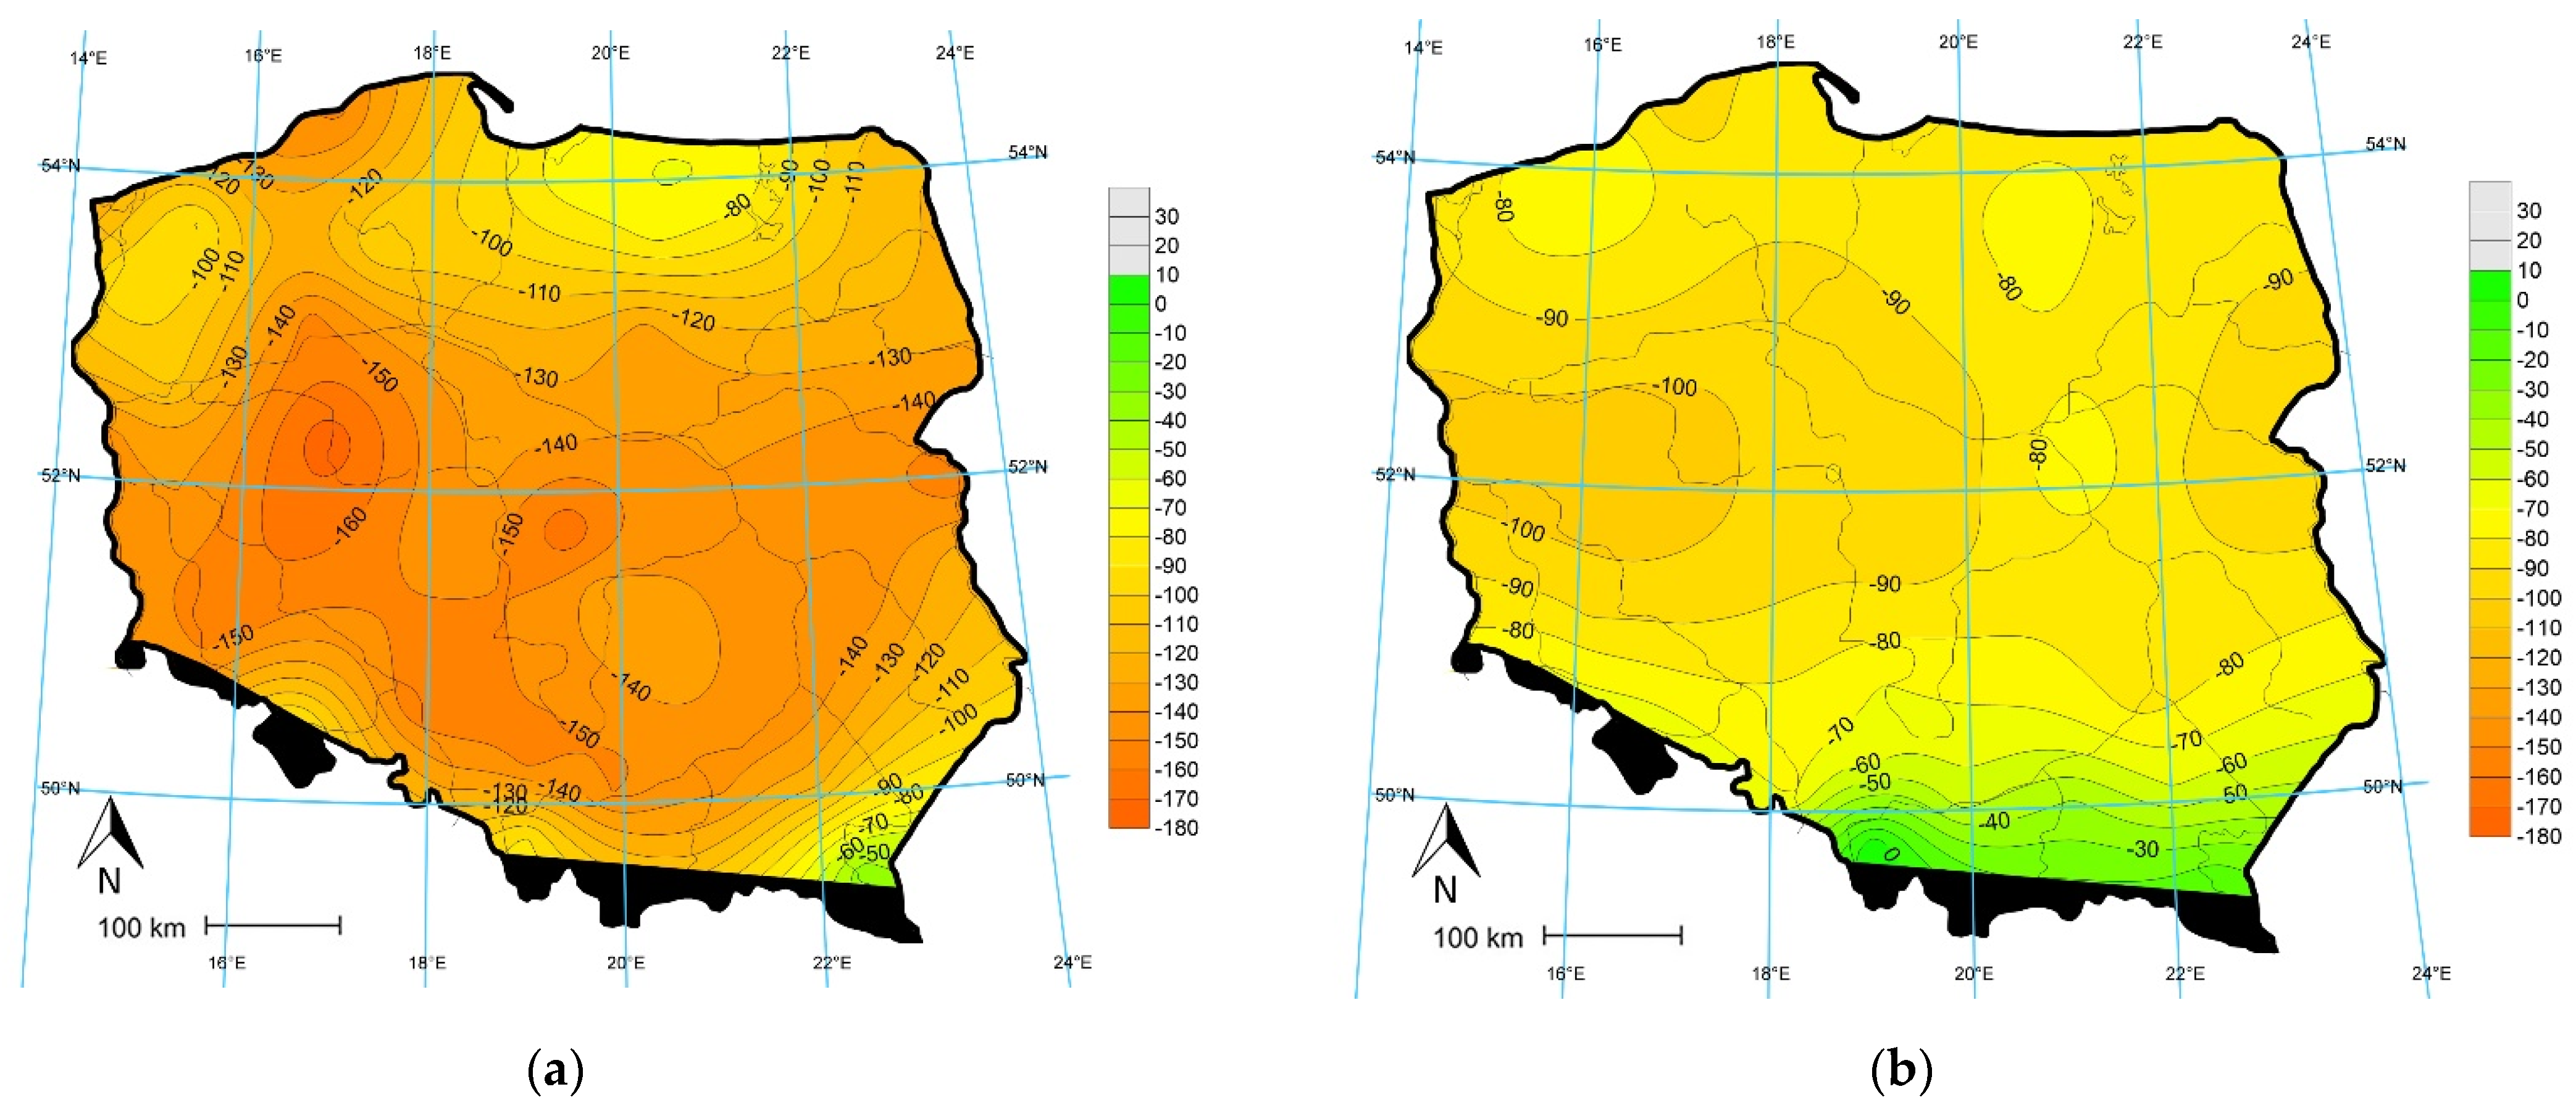
3.4. Climate Water Balance (CWB) for June, July, August with Aspects of Regional Variation
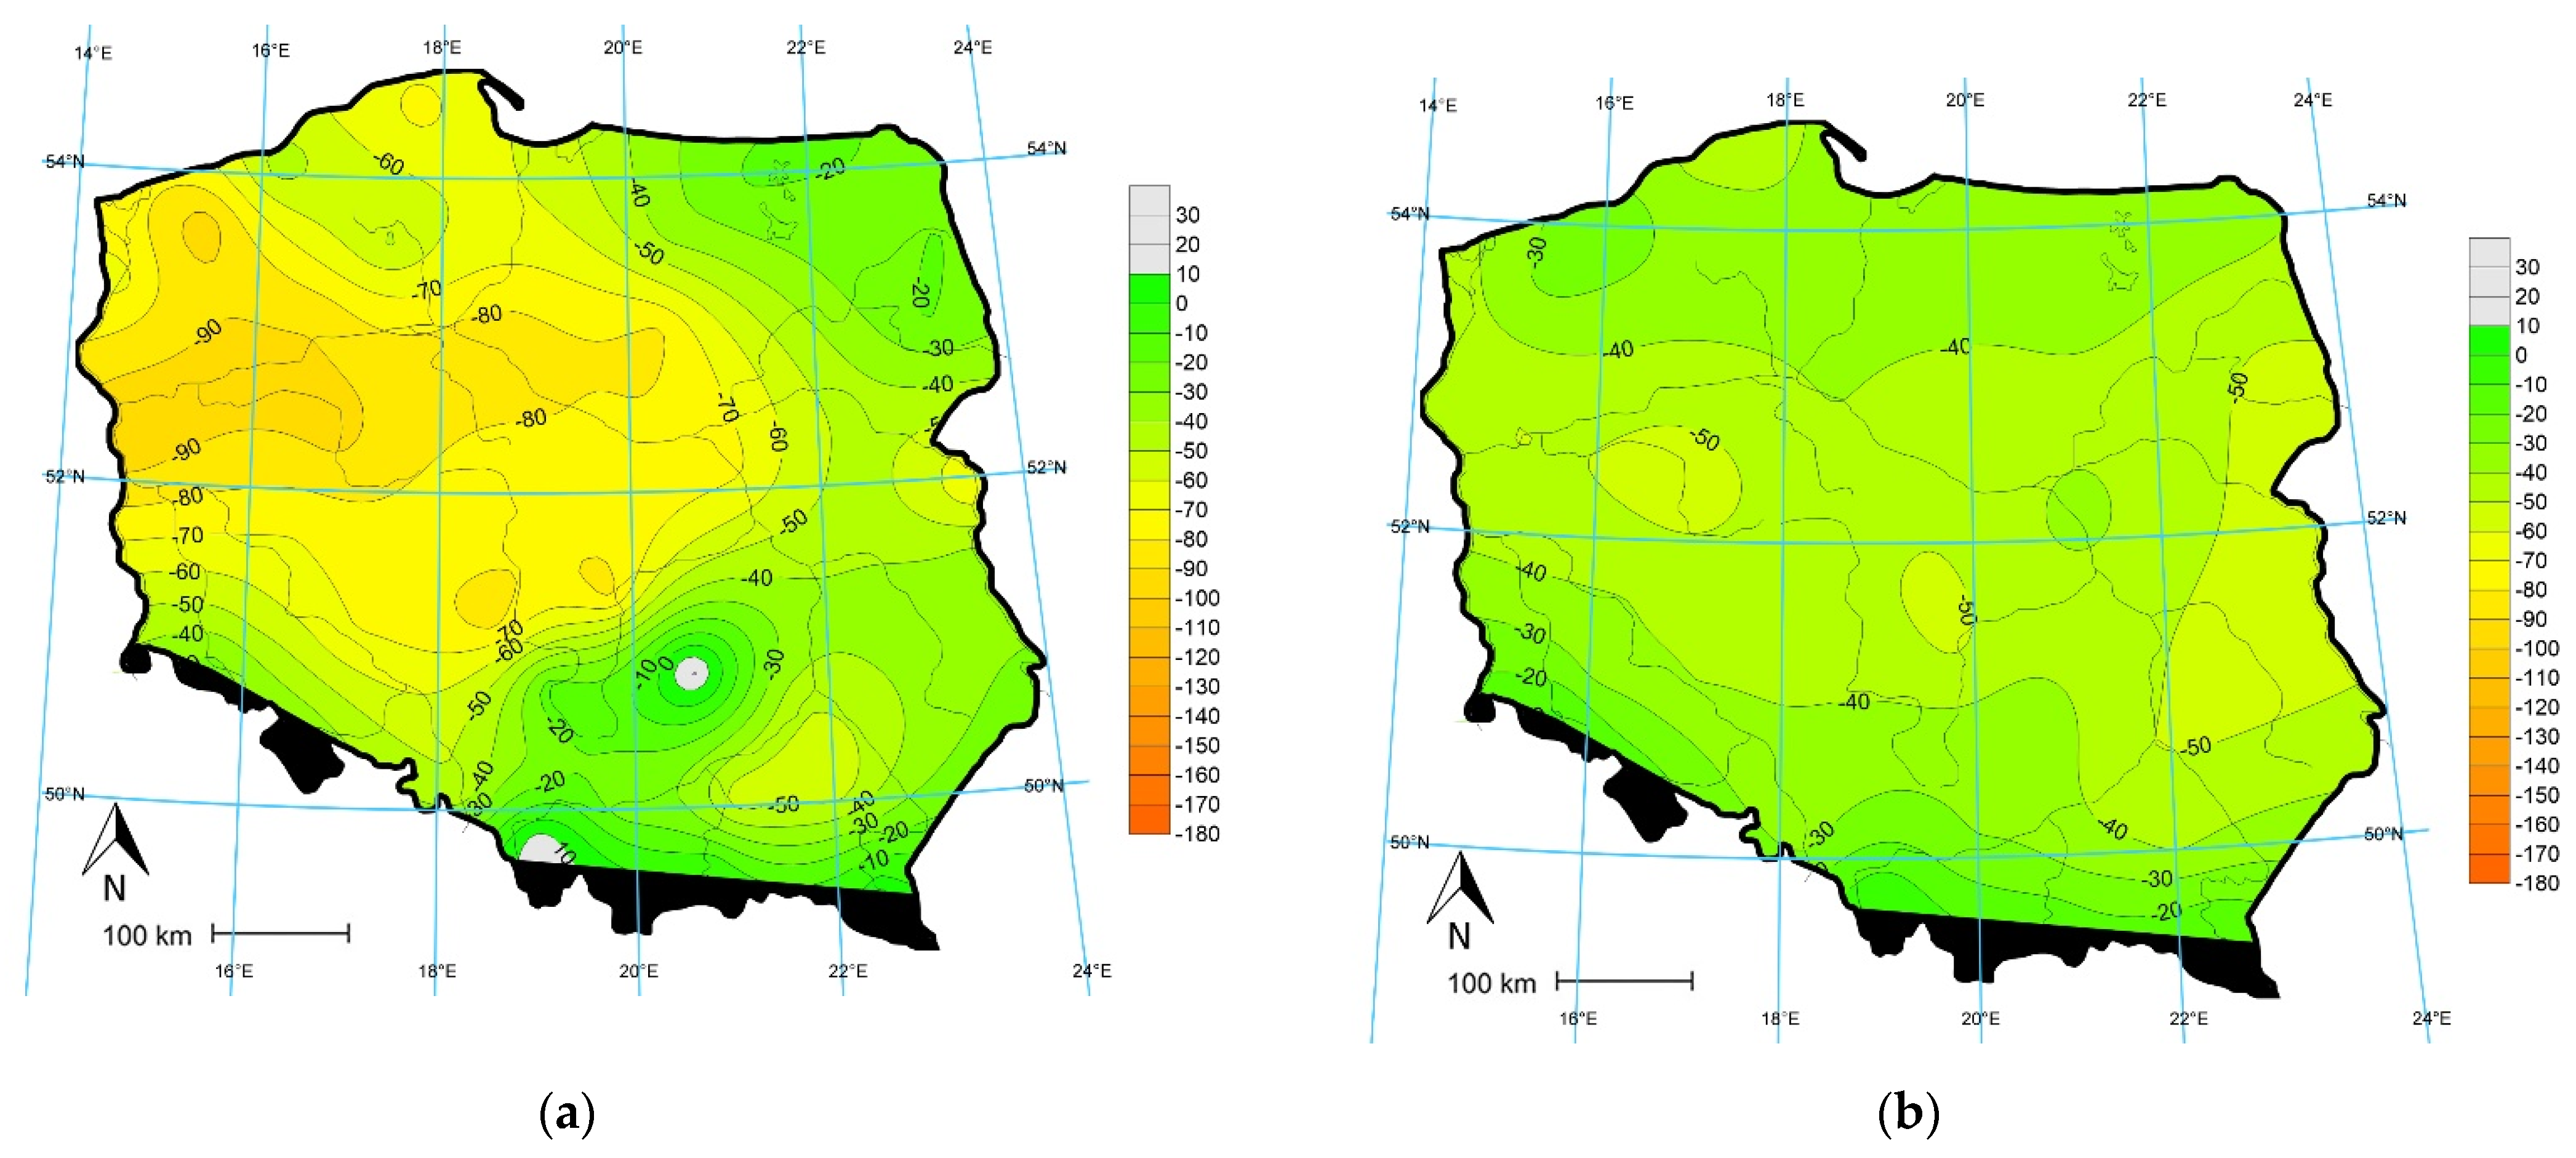
In June 2019, the greatest water deficit occurred in the central Poland belt, especially its central and western parts with a maximum in Poznań at 176.6 mm. The water deficit decreased towards the north, south, and east. The lowest values of water deficit occurred in Eastern Baltic Coast and Lake Districts with the minimum of −71.3 mm in Kętrzyn. Lower deficit values were recorded in southern Poland with a minimum of −34.1 mm near Lesko. The mean value of CWB in Poland was −129 mm (
Figure 4a). In June 1981–2010, the highest water deficit occurred in central Poland, especially in its central and western part with its maximum in Poznań at 106.7 mm. Water deficit decreased towards the north and south. The smallest deficit values occurred in the Eastern Baltic Coast and the Lake Districts with the minimum of −69.5 mm in Koszalin. Much lower values of deficit were recorded in southern Poland with a minimum of −12.9 mm near Lesko. The mean value of CWB in Poland amounted to −79 mm (
Figure 4b).
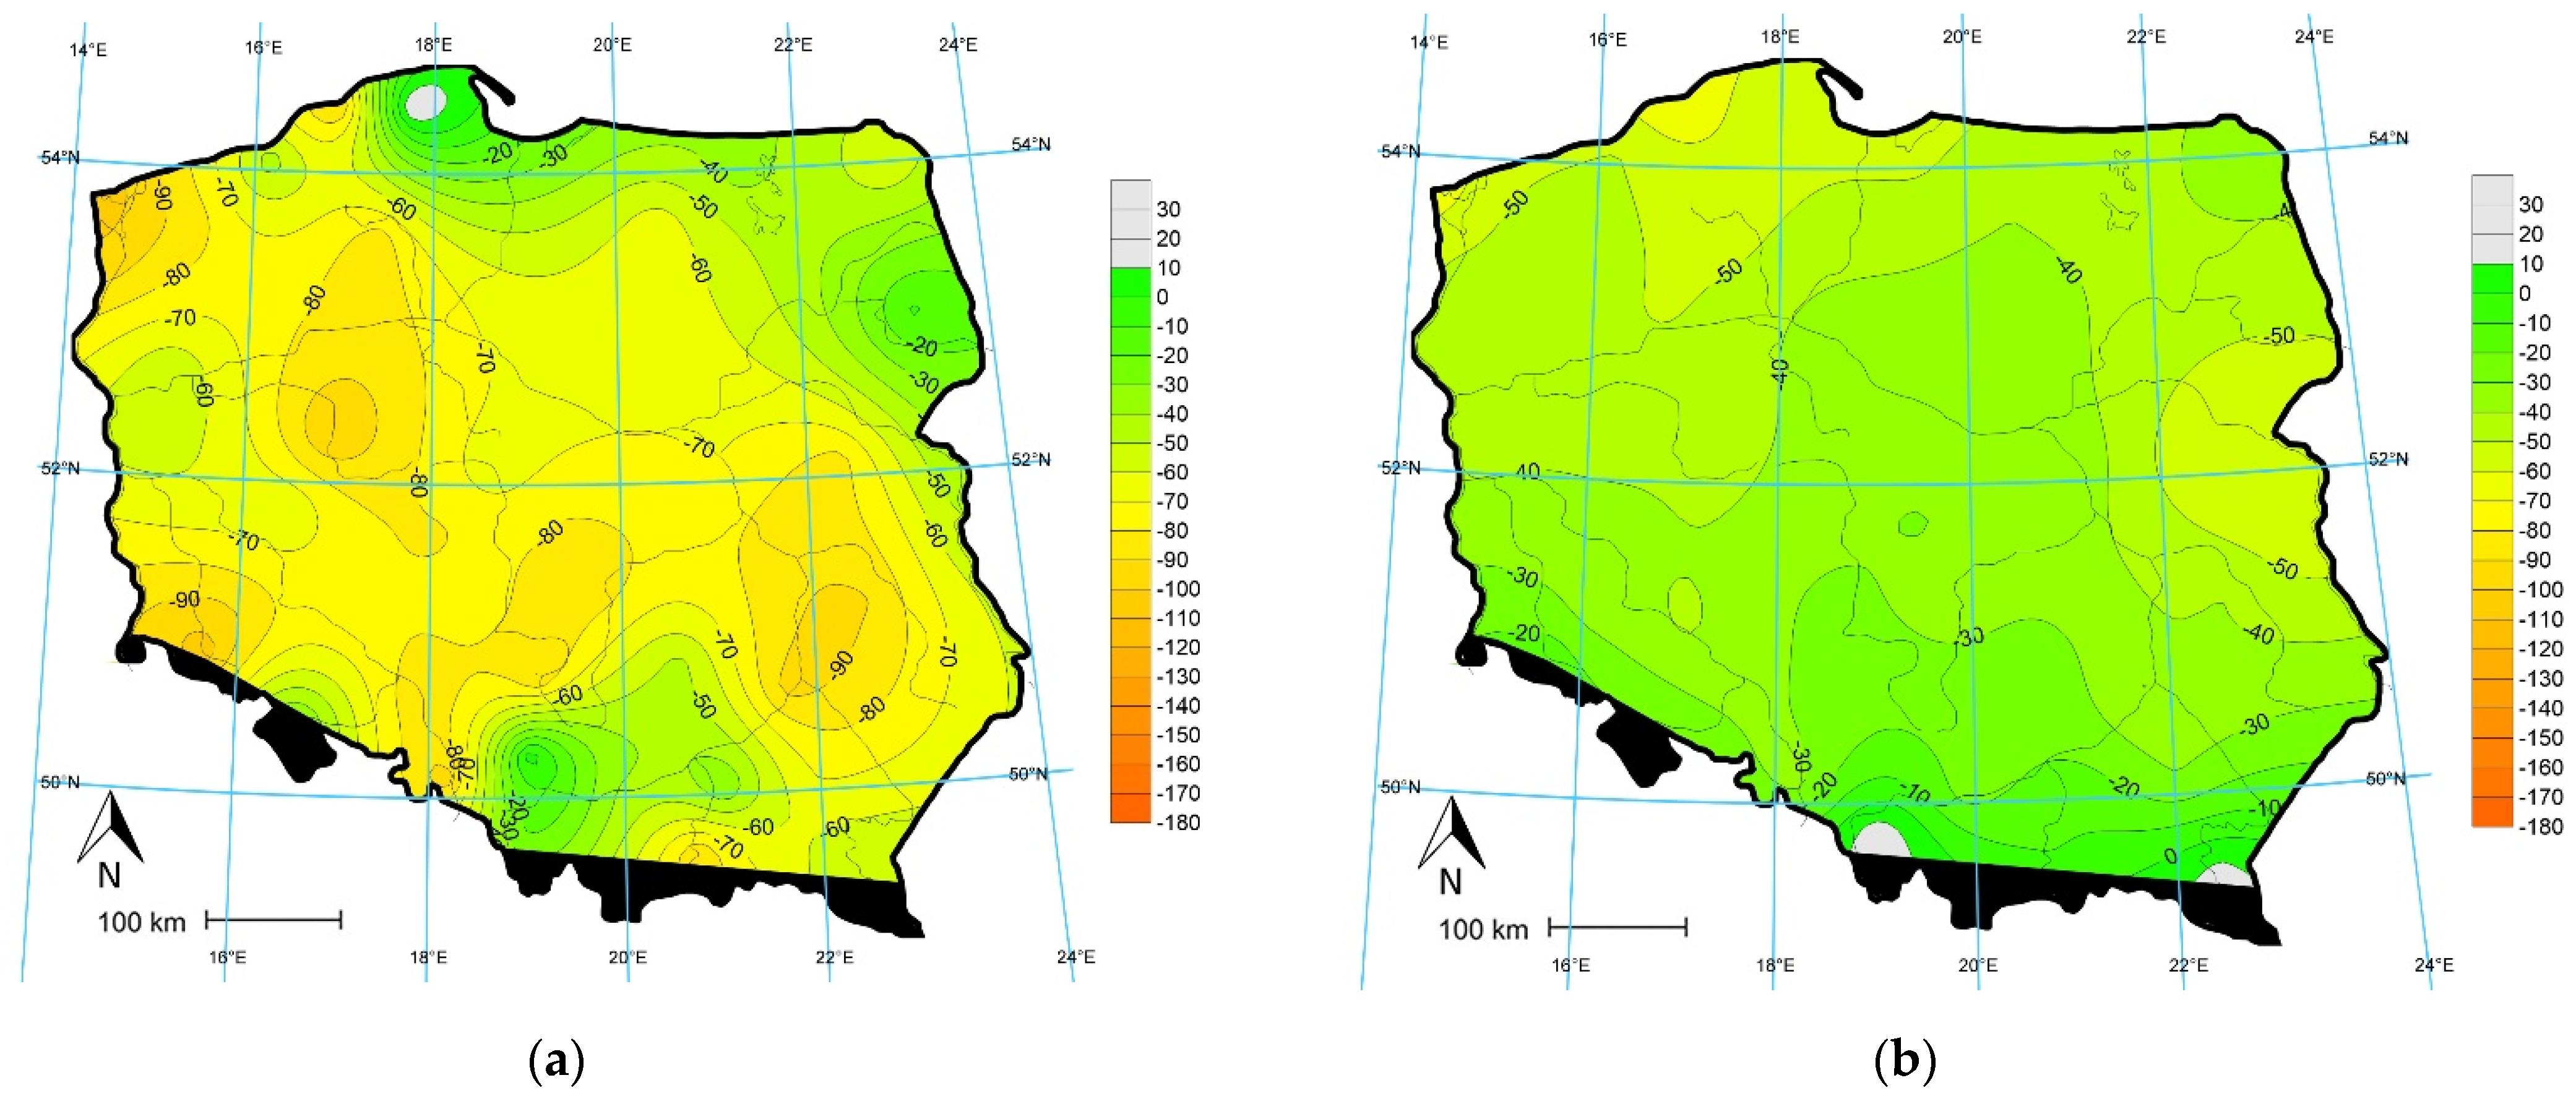
In July 2019, the largest water deficits occurred in the western part of the South Baltic Coast with a maximum of −109.8 mm in Świnoujście. Slightly lower values were observed in central Poland ranging from −60 mm to −90 mm. The lowest values of water deficit were observed in the eastern part of South Baltic Coast, Eastern Baltic Coast and Lake Districts and locally in the south of Poland. In the vicinity of Katowice, an excess of 6.1 mm was recorded. The average CWB over Poland was −64 mm (
Figure 5a). In July 1981–2010, the highest water deficits occurred in western part of the South Baltic Coast with a maximum of −69.9 mm recorded in Ustka. Slightly lower values were observed in central Poland ranging from −30 to −60 mm. The lowest values of water deficit occurred in the southern part of Poland. In the vicinity of Bielsko–Biała and Lesko, an excess of water was recorded, at 19.1 and 13.5 mm, respectively. The mean CWB value over Poland was −36 mm (
Figure 5b).
In August 2019, the largest water deficit values were characterized by the South Baltic Lakes region, especially around Słubice, Gorzów Wlk., and Poznań from −92.4 mm to −100.6 mm. As one moved away from these regions, a decrease in water deficit values in all directions was observed. Smaller values of water deficit were recorded in the north-eastern part of Poland and in the south of the country from −1.5 mm to −19 mm. Locally, in Kielce, Bielsko–Biała, and Lesko, there was an excess of water, with recordings of 23.8 mm, 18 mm, and 1.4 mm, respectively. The mean CWB value over Poland was −53 mm (
Figure 6a). In August 1981–2010, the highest values of water deficit were characterized by the eastern part of Poland, especially near Terespol and Włodawa, which saw values of −55.8 mm and −55.7 mm, respectively. Smaller values of water deficit occurred in northern part of Poland and in the south of the country, ranging from −1.5 mm to −30 mm. The mean value of CWB in Poland was −38 mm (
Figure 6b).
In light of the comparison presented, June saw with the highest temperature deviation from normal and low rainfall, and was the month with the highest CWB deviation of 50 mm. The values of these deviations from normal decreased to −28 mm in July and −15 mm in August (
Table 1).
3.5. The Temporal Dynamics of Drought
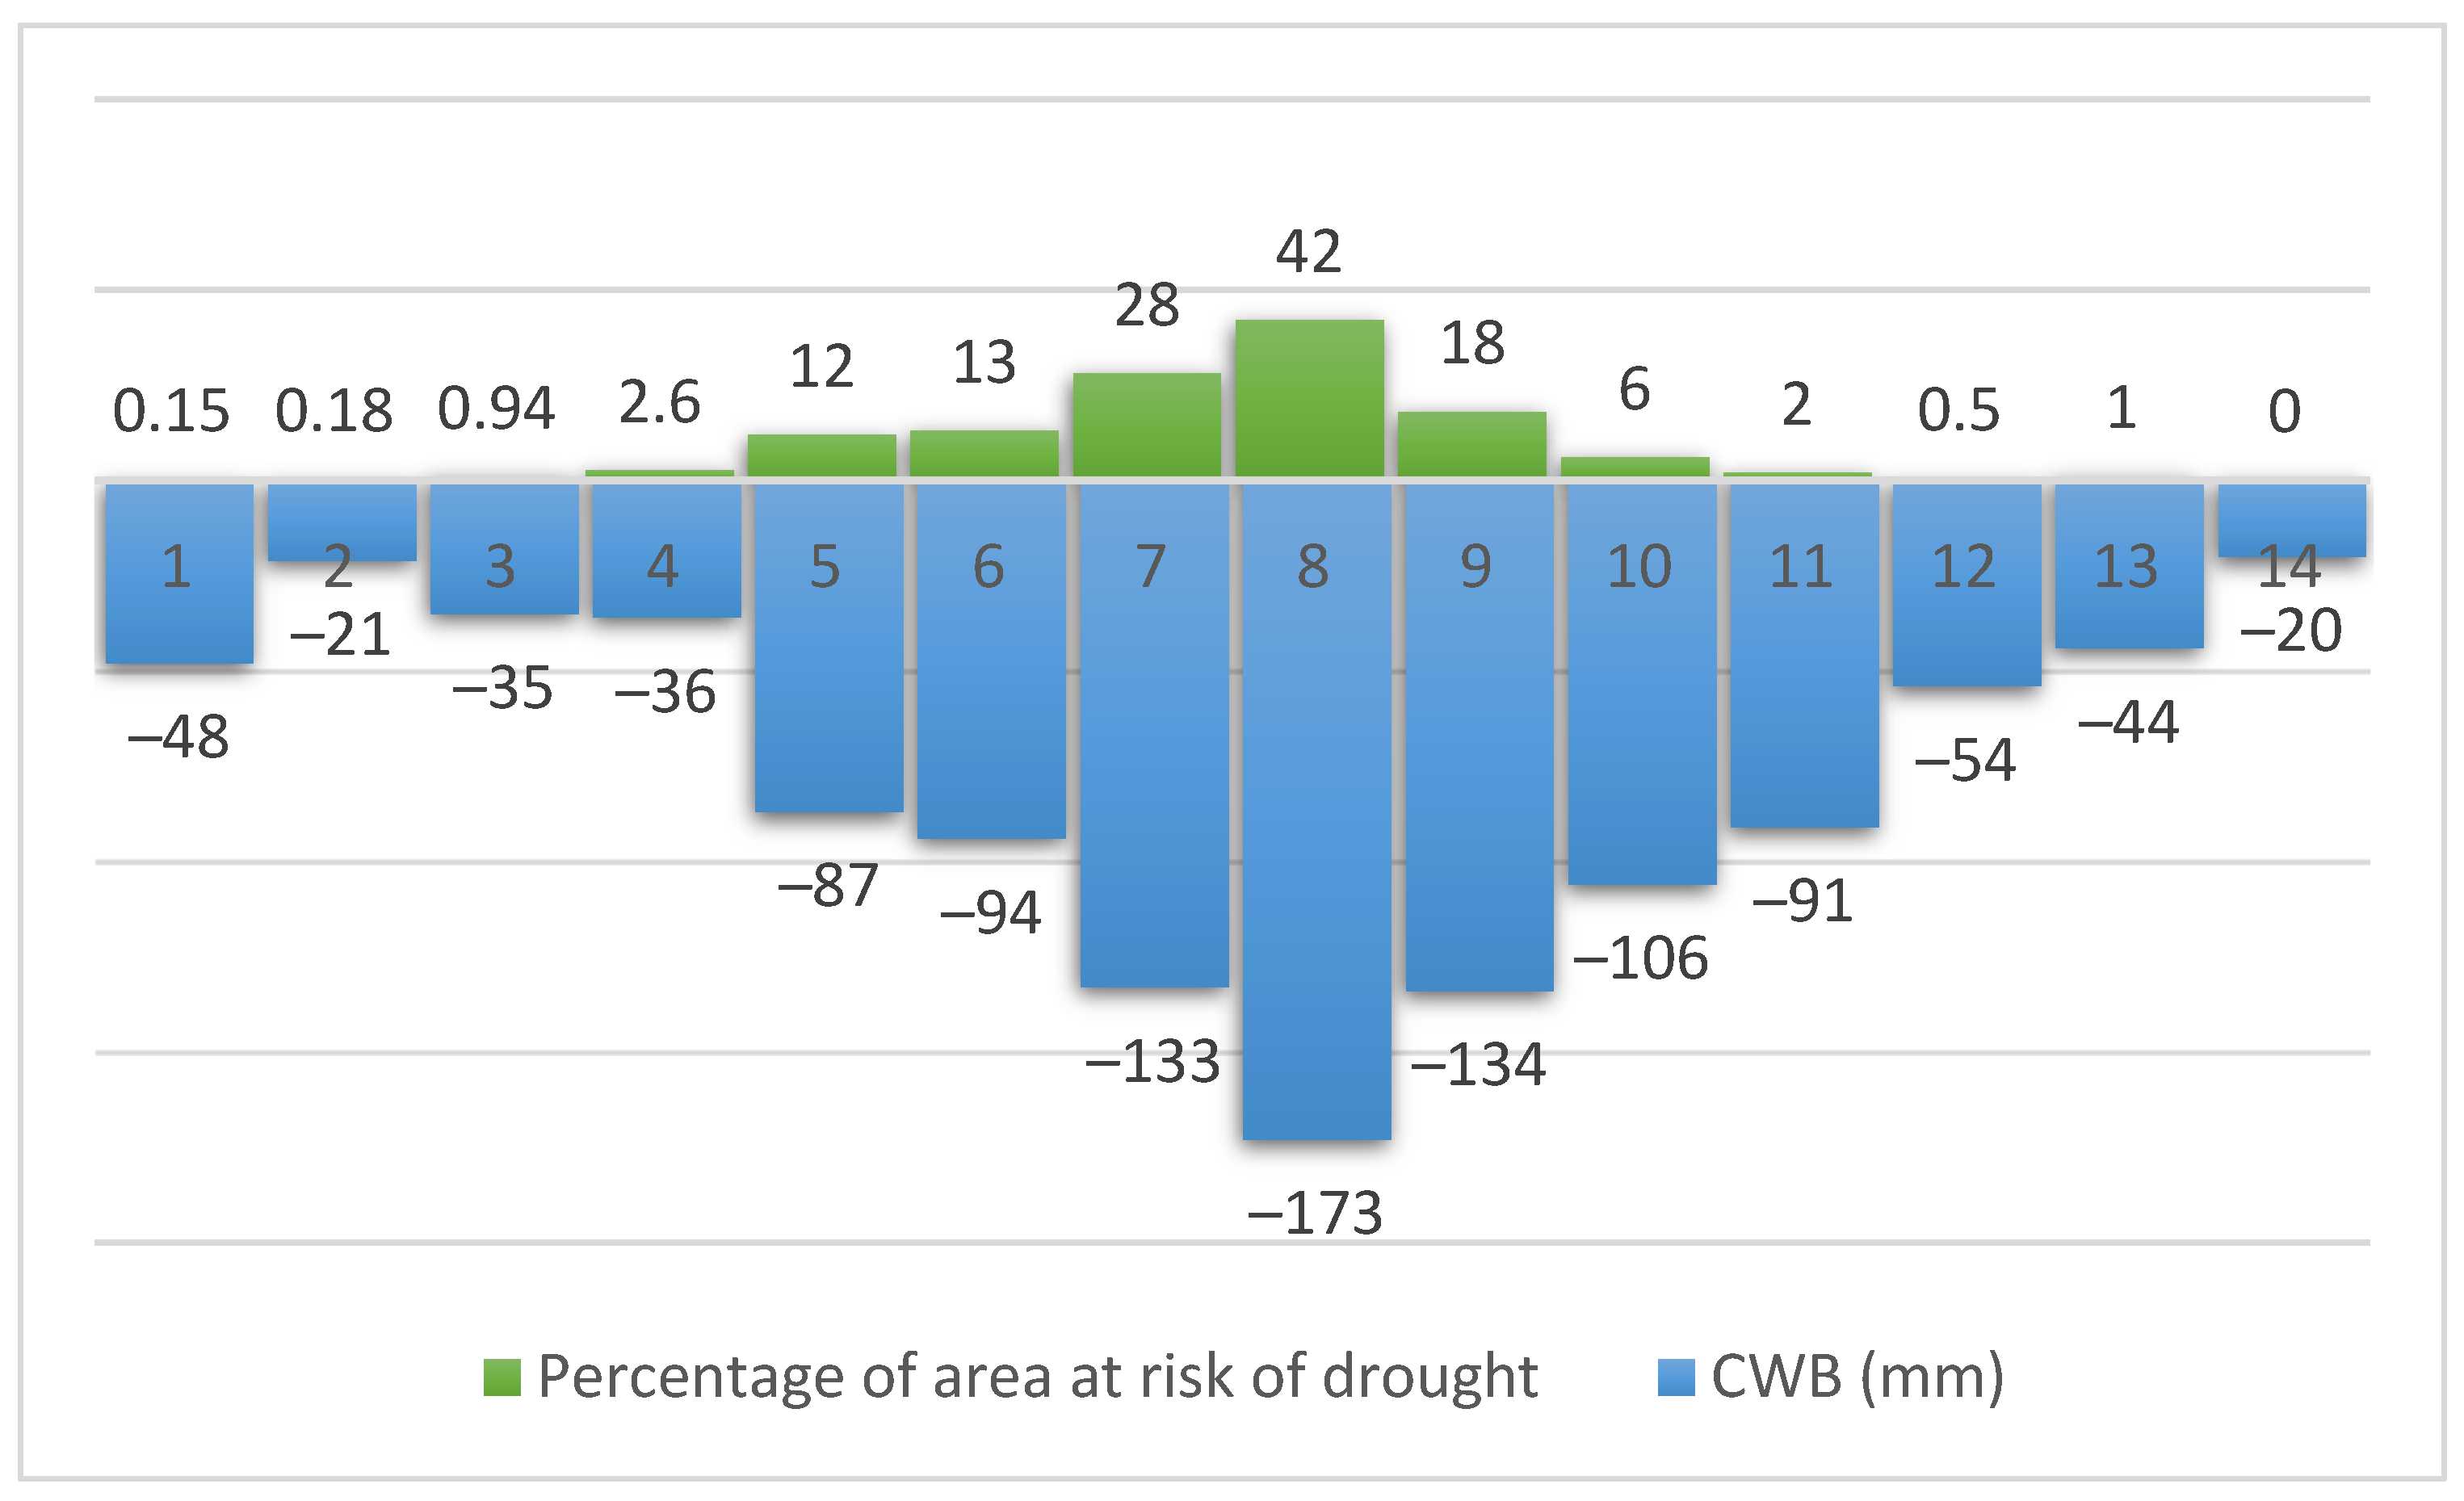
Drought was practically absent in the first four reporting periods, i.e., 21 March to 20 May up to 21 April to 20 June. CWB values in these periods were several tens of mm with the highest value of −48 mm in the first period, and the area at risk of drought ranged from a fraction of a percent to 2.6% in the fourth reporting period. From the fifth reporting period, i.e., 1 May to 30 June, the mean CWB value for Poland decreased from −87 mm, through subsequent periods −94 mm and −133 mm to reach the highest value of −173 mm in the eighth reporting period from June to July. In the following reporting periods, CWB values systematically decreased from −134 mm, −106 mm, −91 mm, −54 mm, and −44 mm to reach −20 mm in the last reporting period. The percentage of area at risk of drought increased at a similar rate from a fraction of percent in the first three reporting periods through several to a dozen or so percent in periods 4–6, i.e., 21 April–20 June to 11 May–10 July, to reach 28% in period 7 and the highest value of 42% in period 8. In periods 9 and 10, i.e., 11 June to 10 August and 21 June to 20 August, it was already 18% and 6%, respectively, in the following periods a few percent and fractions of a percent. The highest CWB values occurred in the Lubuskie Lake District and systematically increased from −120 mm in the first reporting period to −240 mm to −279 mm in the eighth period of the highest drought intensity. In subsequent periods, they decreased systematically to reach the value from 100 mm to −159 mm in the last reporting period. The percentage of the area endangered by drought in the three lubuskie, łódzkie, and wielkopolskie voivodeships (most endangered by drought) increased from a fraction of a percent to several percent in the first three reporting periods to reach the values of 52%, 73%, 97%, and 56% in periods 6–9, respectively (
Figure 7).
Explanations: reporting period 1 (from 21 March to 20 May), reporting period 2 (from 1 April to 31 May), reporting period 3 (from 11 April to 10 June), reporting period 4 (from 21 April to 20 June), reporting period 5 (from 1 May to 30 June), reporting period 6 (from 11 May to 10 July), reporting period 7 (from 21 May to 20 July), reporting period 8 (from 1 June to 31 July), reporting period 9 (from 11 June to 10 August), reporting period 10 (from 21 June to 20 August), reporting period 11 (from 1 July to 31 August), reporting period 12 (from 11 July to 10 September), reporting period 13 (from 21 July to 20 September), and reporting period 14 (from 1 August to 30 September).
3.6. Ranking of Voivodeships by Area at Risk of Drought
Despite slight differences in the order of voivodeships for average data from all reporting periods and from the eighth period with the highest drought intensity, a clear regularity was observed. It was possible to distinguish four groups of voivodeships with the highest, medium, and lowest drought risk, and one voivodeship in which drought practically did not occur. Voivodeships with the highest drought risk included the lubuskie, łódzkie, and wielkopolskie voivodeships. The voivodeships with a medium drought threat were the dolnośląskie, kujawsko-pomorskie, lubelskie, mazowieckie, opolskie, śląskie świętokrzyskie, and zachodnio-pomorskie voivodeships. The voivodeships with a low drought risk included małopolskie, podkarpackie, podlaskie, and pomorskie. In the warmińsko-mazurskie voivodeship, drought practically did not occur (
Table 2).
3.7. Sensitivity of Crops to Drought
Analysis of areas covered by drought, both in the whole of Poland and in the three voivodeships most threatened by drought, i.e., the lubuskie, wielkopolskie, and łódzkie voivodeships, revealed clear differences in the drought sensitivity of individual crops. The crops most threatened by drought are fruit bushes, spring cereals, maize, and legumes. For Poland, the percentage of these crops threatened by drought ranges from 16–18%, while, on the area of the three voivodeships most exposed to drought, it is as high as 42–49%. Tobacco, winter cereals, field vegetables, and strawberries are among the crops which are moderately sensitive to drought. On the other hand, the crops least exposed to drought are rape and colza seed, hops, potatoes, fruit trees, and sugar beet, and the percentage of the area of these crops affected by drought is 2–8%, respectively, on the area of Poland as a whole, and 11–26% on the area of the three voivodeships mentioned. In the eighth driest reporting period, from 1 June to 31 July, the majority of crops in the lubuskie, wielkopolskie, and łódzkie voivodeships were almost completely threatened by drought (
Table 3).
3.8. Hydrological Aspects of Drought
According to the classification of Kaczorowska [
4], which assesses the deficiency or excess of precipitation in relation to the perennial norm (1971–2000), the year 2019 was classified as normal [Bulletin of the National Hydrological and Meteorological Service No. 13/215 2019]. Annual precipitation on a national scale, determined by measurements from 52 synoptic stations, amounted to 556 mm, corresponding to 91.7% of the multi-year value (1971–2000). In the central part of Poland, 2019 was classified as dry, locally even as very dry, and in the rest of the country as normal, only locally in the north and south as wet. The hydrological year 2019 with a total outflow of Polish rivers equal to 41.9 km
3 (with an average in the multi-year period 1951–2018 equal to 60.4 km
3) was classified as a dry year [Bulletin of the National Hydrological and Meteorological Service No. 13/215 2019]. The outflow in 2019 was, therefore, about 2/3 of the multi-year average outflow. In the distribution sequence from the period 1951–2019, which contains 69 years, where the years are arranged in the order of increasing total annual outflow of Polish rivers, the year 2019 occupies the 5th place after the driest the years, i.e., 1954, 2015, 2016, and 1952. In the first and second hydrological half-years, lower values of outflow occurred in the Odra basin than in the Vistula basin. The outflow of the Pomeranian rivers was, like other rivers, lower than the norm, and was generally relatively higher than the outflow of the rivers of the Vistula and Oder basins. Outflow of the Pomeranian rivers, like other rivers, was lower than the regular values; however, in general, it was relatively higher than the outflow of the rivers of the Vistula and Odra basins [Bulletin of the National Hydrological and Meteorological Service No. 13/215 2019] (
Table 4).
After analyzing 20 river flows of very different river basins [Bulletin of the National Hydrological and Meteorological Service No. 13/215 2019], in almost half of them, i.e., in nine, the drought accelerated the date (month) of the lowest flow. Thus, this acceleration was observed in three cases by one month (two cases from September to August and one case from August to July). In four cases, it was an acceleration by two months (in two cases from October to August and in two cases from September to July). In two cases, the acceleration of the lowest flow was by three months, i.e., in all cases from October to July. These flows constituted on average of 41% in average perennial flows, a maximum of 52% (Vistula–Warszawa), and a minimum of 36% (Odra–Nowa Sól). It is noteworthy that all cases of minimum flow acceleration only occurred in central-western and south-western Poland with the highest air temperature. In seven cases, apart from those analyzed above, minimum flows occurred in the same months as the multi-year averages, but their values were, on average, smaller by half. In the case of the Skorogoszcz gauge on the Nysa Kłodzka River, flow values were affected by water management in the existing reservoir. Indeed, at the gauge mentioned, minimal flows did not occur in July and August, like most of the analyzed gauges, but in November. Low flows also occurred in October, December, and August. Water management in the reservoir, in this case, disturbed the natural rhythm of flows.
3.9. Hydrogeological Aspects of Drought
In the hydrological year of 2019, the level of the groundwater table was lower than the monthly average for many years (1991–2015). In waters with a free well, the largest deviation was recorded in August (about 31 cm below the average for many years). In waters with a tight well, the highest values below the average were recorded in the period of August–October where it was about 32–34 cm below the multi-year average. In July, the state hydrogeological service declared a state of hydrogeological emergency due to the phenomenon of a very intense hydrogeological low. In August, an extension of the area of the phenomenon was found, and, by the end of the hydrological year, there were no grounds for revoking the state of hydrogeological emergency [Hydrogeological Annual Report Polish Hydrogeological Survey].
In the lowland belt, where the drought was the most intensive, the mean monthly groundwater levels of both free and tight groundwater tables were lower than the monthly averages for the whole hydrologic year. The highest deviation of free-bore waters was recorded in August (36 cm below the average), and, by the end of the year, they were over 30 cm below the average for individual months of the studied period. Similarly, it was the case for waters with a tight well, the average monthly groundwater level was at a level lower than the monthly averages (this difference was 9 cm below the average in January), and then increased from month to month to 45 cm below the average in October, representing the largest deviations of waters with a tight well [Hydrogeological Annual Report Polish Hydrogeological Survey].
4. Discussion
A direct comparison of the IUNG method (CWB in 6-decade periods, step every decade) with the method used in the study (CWB in monthly periods), i.e., concerning the months of the most intensive drought in June, July, and August, is not possible due to different comparison periods. The first two decades of June in the IUNG method fall within the 6th reporting period, ie 11 May to 10 July. The second and third decades of June fall within the seventh reporting period, covering the period from 21 May to 21 July. Therefore, the average of the reporting periods for June (from reporting periods 6, 7, and 8), for July (from reporting periods 9, 10, and 11), and for August (from reporting periods 12, 13, and 14) were conventionally taken for the estimation of CWB values.
The results vary slightly, though there was the least variation in June. June was the warmest month since at least 1951 with a temperature deviation from the national norm of 5.0–6.0 °C and the driest relatively month of the year in 2019, and was very dry on the verge of extremely dry which was the reason for the very low CWB values [Bulletin of the National Hydrological and Meteorological Service No. 6/208 2019]. Smaller differences occurred in August and the largest in July. The differences may be caused, on the one hand, by the different way of estimating values for individual months as an average of the three reporting periods and, on the other hand, by the extension of large negative CWB values from June to the July (post-June) using the IUNG method to determine CWB for 6-week periods (
Table 5).
The drought of 2019 was preceded by the drought of 2018. The analysis of consecutive communiqués of the IUNG agricultural drought monitoring system from 2020 shows that, in that year, drought was indicated, especially in north-western Poland voivodeships; in the wielkopolskie voivodeship during all 14 reporting periods; and in the lubuskie, pomorskie, and zachodniopomorskie voivodeships during 13 periods (except the last reporting period). In 2021, in the fifth reporting period from 1 May to 30 June, drought of various intensity was observed in all Polish voivodeships. The analysis of the causes, the course, and the consequences of the dry years of 2018–2021 requires a separate study.
The drought of 2019 has marked itself with varying intensity across Europe. The manifestations and impacts of drought are reported from countries, such as Belgium, Czechia, Finland, France, Germany, Greenland, Italy, Luxembourg, Netherlands, Norway, Poland, Spain, Sweden, Switzerland, and the United Kingdom [
64]. A historical reconstruction of the 254-year climate database [
65,
66] indicates that many years with similar precipitation anomalies occurred in the summer months, but 2018–2019 saw two of the three warmest summer periods in the cited period. The third year when average summer temperature anomalies over Central Europe reached record extreme conditions of over 2.0 °C was 2003. Of the three cited years with the highest air temperature anomaly in Europe, in 2019, the strongest impact of the thermal anomaly was marked in the Central European region including Poland where the increase in temperature was accompanied by a simultaneous significant reduction in summer precipitation, leading to extreme drought conditions.
The comparison of the values of climatic water balance in the months of June, July, and August in the analyzed three extreme years in terms of temperature in the area of Poland shows that, in 2003, these values were −100, −21, and −79 mm, respectively. In 2018, the values averaged for Poland were −77, −36, and −80 mm, respectively. In 2019, the year under analysis, these values were, −129, −64, and −53 mm, respectively, so the highest were in June and July, and were slightly lower only in August. If the values of climatic water balance for the analyzed three months were averaged, then in the next extreme years, in terms of temperature, the values would be −67 mm in 2003, −64 mm in 2018, and −82 mm in 2019. Thus, it can be concluded that, in the light of the values of climatic water balance in Poland representing a significant area of central Europe, this was the most intense drought in the reconstruction of the last more than 250 years of climatic data.
Analysis of drought frequency over a multi-year period shows that the frequency has increased since 1950 throughout southern Europe and most parts of central Europe, while it has decreased in many parts of northern Europe [
67,
68]. Other drought indices, including drought severity indices, also show significant increases in the Mediterranean region and parts of central and south-eastern Europe, and decreases in northern Europe and parts of eastern Europe [
69,
70,
71,
72]. Projections for the period 2041–2070 compared to 1981–2010 for two emission scenarios, i.e., RCP4.5 and RCP8.5, indicate an increase in meteorological droughts in most of Europe, especially in southern Europe, while decreases in droughts are projected only for a limited part of northern Europe. The changes are most pronounced for the high emissions scenario (RCP8.5) and somewhat smaller for the moderate scenario (RCP4.5) [
73].
5. Conclusions
The summer drought of 2019 was not only caused by a shortage of precipitation, but above all by extremely high temperatures, especially in June with a record deviation of 5.0–6.0 °C and in August when deviations exceeded 2.0 °C. Anticyclonic situations prevailed especially in June (59%) and August. In June, the advection from south direction was 2.5 times higher than the average of 8%.
In the light of days with low precipitation frequency (frequency lower than average), 41% of the duration of summer drought lasted from 29 May to the first days of September. The longest, i.e., 90 days and more, occurred at stations located in the Central Poland Lowlands (up to Warsaw) and the southern part of the South Baltic Lake District. On the outskirts of this driest area, the number of such days with a below-average precipitation frequency was systematically lower. Such a period with lower precipitation frequency basically did not occur only in the area of the Gulf of Gdańsk, the Eastern Baltic Coast and the Lake Districts.
In the summer season of June–August, the lowest precipitation amounts, constituting 30–60% of the norm were recorded in the South Baltic lakes belt and Central Polish Lowlands with the minimum of 30.1% in Poznań. The highest values of precipitation were noted in the eastern part of the South Baltic Coast, the Eastern Baltic Coast, and the Podlasie–Byelarus Uplands with 100–125% of the norm. The average precipitation in Poland in summer was only 66.5% of the norm.
The values of climatic water balance (CWB) calculated by the Institute of Soil Science and Plant Cultivation (IUNG) method for particular months of June–August for the area of Poland amounted successively to −129 mm, −64 mm, and −53 mm with minima, respectively, of −176.6 mm in Poznań, −109.8 mm in Świnoujście, and from −92.4 mm to −100.6 mm near Słubice, Gorzów Wielkopolski, and Poznań.
Summer drought in the light of the area of Poland threatened by drought increased gradually exceeding the values of several percent of the area of Poland in the periods from the beginning of June to 10 July, with the maximum at the end of June—42% of the area of Poland covered by drought. Most threatened by drought were the wielkopolskie, lubuskie, and łódzkie voivodeships, in which the percentage of the area threatened by drought during its highest intensity in the eighth reporting period (1 June to 31 July) amounted to 92%, 88%, and 81%, respectively.
The sensitivity of individual crops to drought is evident. The least resistant to drought are: fruit bushes, spring cereals, maize for silage and grain, and legumes. Medium drought tolerant are: winter cereals, tobacco, field vegetables, and strawberries. The most resistant are hops, potatoes, rapeseed and canola, fruit trees, and sugar beet.
The summer drought accelerated the timing of flow minima, which typically fall in the autumn months, by 1 to 3 months or halved the minimum flows without changing the timing of their occurrence. In the hydrological year 2019, the level of the groundwater table was lower than the average monthly level in many years. In waters with a free well, the largest deviations were recorded in August, and, in waters with a tight well, the largest values below the average were recorded in the August–October period.
Although contemporary trends and scenarios of precipitation changes at the end of the 21st century for Poland do not predict a decrease in precipitation and even a small increase of about 5–10%, it cannot be said that we will not be threatened by droughts. These will be droughts caused not so much by a lack of precipitation but by high air temperature combined with low precipitation (the increase of which in Poland has been documented). The phenomenon of drought will also be aggravated by the observed increase in the coefficient of variation of precipitation in Poland.


