Article

Sustainability as a Function of an Area: Application of Multi-Criteria Evaluation in Assessing the Effectiveness of Nature-Based Solutions

by
Ewa Podhajska
1,
Ewa Burszta-Adamiak
2,*,
Anetta Drzeniecka-Osiadacz
3,
Magdalena Zienowicz
1,
Bronisław Podhajski
4,
Tymoteusz Sawiński
3 and
Agnieszka Jasińska
1
1
Department of Landscape Architecture, Wrocław University of Environmental and Life Sciences, Grunwaldzka Str. 55, 50-357 Wrocław, Poland
2
Institute of Environmental Engineering, Wrocław University of Environmental and Life Sciences, pl. Grunwaldzki 24, 50-357 Wrocław, Poland
3
Department of Climatology and Atmosphere Protection, Institute of Geography and Regional Development, University of Wrocław, Kosiby 8 str., 51-621 Wrocław, Poland
4
Naudet Reboisement, 4 Rue de Lugny, 21290 Leuglay, France
*
Author to whom correspondence should be addressed.
Atmosphere 2021, 12(11), 1464; https://doi.org/10.3390/atmos12111464
Submission received: 25 September 2021 / Revised: 29 October 2021 / Accepted: 3 November 2021 / Published: 5 November 2021

Abstract

:
One of the essential factors influencing the overall urban experience is the presence of biologically active surfaces. Despite widespread awareness of the beneficial effects of such spaces, the natural tissue in cities is still being significantly limited by the priority given to functionality and the economy. The aim of this article is to assess the potential of using a hybrid infrastructure in the grey–green–blue system (GGB) on a public site. In order to assess the efficiency of the implemented solutions, a multi-criteria method was developed, thereby recognising this research aspect as necessary in the process of designing urban built-up spaces. The assessment compared indicators of biological activity in the area using the biotope area factor and green space factor scales. The rainwater retention potential was estimated using a quantitative method. The change in the site’s thermal conditions was analysed by conducting numerous experiments with the use of micrometeorogical computational fluid dynamics models ENVI-met. The demonstrated improvement in the proportion of the biologically active area, water retention, and thermal conditions, ranging from a few to a dozen percent compared to the initial state, confirms the legitimacy of using grey–green–blue infrastructure systems as a method of shaping a sustainable and climate-responsive urban design.

1. Introduction

The observed trend of expansion in the urban population has caused the continued growth and development of urban areas, changing the morphology of cities and their physical features. The density of urbanised areas’ tissue, postulated in the guidelines for sustainable development, has led to a specific phenomenon, referred to as the “paradox of the compact city” [1]. The high density of urban development, recognised as one of the indicators of sustainability, albeit based on traditional technologies, has brought an increasing number of tightly built-up areas into cities [2]. The transformation of the natural cover of land causes changes in the natural patterns of atmospheric and hydrological cycles, disturbances to the natural ecosystem processes, modifications of the radiation and thermal budget, and changes in the urban pattern of the wind [3,4]. The limitation of evapotranspiration and moisture availability in cities and extreme surface runoff, as well as a reduction of baseflows and infiltration, which contributes to the desiccation of soil, thereby lowering the level of groundwater and overloading natural surface receivers, have all been observed [5,6]. For these reasons, there is an increasingly urgent need to search for a strategy to mitigate the negative phenomena of urbanisation and to verify the available design methods in this respect [7,8]. Much research is channeled towards understanding the influence of urbanisation on the urban climate, looking at the possibility of shaping compact housing with better sustainability parameters [9,10]. One of the solutions for increasing the sustainability level of the compact urban development is the implementation of a hybrid grey–green–blue infrastructure (GGB) [11,12]. This type of integrated system allows us to use both the ability of engineering technology and the potential of biological processes to keep the expected functionality of urban spaces without degrading their biological value [13]. Nature-based solutions (NBS), being an integral part of the GGB system, are inspired by nature in a conceptual and functional sense [14]. Such an approach maximises the beneficial effects provided by nature using its environmental services [15]. The fusion of nature and engineering technologies increases the efficiency of processes, shaping their long-term and stable course, all the while developing the phenomenon of urban resilience in terms of complex socio-ecological systems. In this perspective, the GGB systems are recognised tools in the mitigation and adaptation strategies of cities, allowing them to shape their more sustainable form [16].
The aim of this article is to assess the possibilities offered by the use of a hybrid infrastructure in the grey–green–blue system (GGB) in the city. The objective of the presented project is to promote a more sensitive urban design as a possible measure for mitigating the negative environmental phenomena accompanying the growing urban tissue. In order to estimate the efficiency of the implemented NBS, a method comprising a multi-criteria evaluation of their effectiveness has been developed, taking into account the multidisciplinary nature of such implementations and verifying, in a comprehensive approach to sustainability, its individual aspects, i.e., the share of biologically active areas, water management, and local thermal conditions.
The infrastructure systems (GGB) presented in this article and the multistage verification of their effectiveness are an attempt to determine the design process canon taking into account the research aspect. According to the authors, the research stage should become obligatory in the process of shaping sensitive urban design and constitute the basis for compact city design decisions.

2. Materials and Methods

2.1. Background Information and Description of Study Site

Taking into account the GGB infrastructure, the concept of land improvement was developed for the area within the customer service building belonging to the Municipal Water and Sewage Company in Wrocław (Poland). The facility is located in the vicinity of the city centre and, given its function, it is visited daily by dozens of customers. The standard space so far, based on traditional engineering solutions, does not refer to the principles of sustainable shaping, nor does it offer any form of organised rainwater retention, despite the structure’s profile (Figure 1). The design region has an area of 2767 m2, including 1894 m2 of sealed areas and 423 m2 of biologically active areas.

2.2. Methodology of Design Framework

This section presents the fundamental concepts and technologies used to create a GGB design framework. The so-called two-track methodological approach consists of the following methods: design and research. It will also verify the proposed measures in terms of consistency with the main aims of this study. The appropriate tools to assess the performance of the whole design process were implemented, e.g., biotope area factor (BAF) and green space factor (GSF), the bioretention capacity and thermal indices.

2.2.1. Design Method

The main design method adopted was the implementation of solutions connected to the hybrid infrastructure in the grey–green–blue system. To maximise the beneficial environmental effects, the fundamental guideline assumed in this project was to increase the presence of vegetation. While providing us with a wide range of environmental services, and, at the same time, delivering positive influences that can be described as supportive, provisioning, and cultural, vegetation fulfills many regulating functions [17].
In practical terms, urban vegetation has the capacity to clean the environment [18,19], can improve the local climate through reduction of solar radiation absorption and air temperature by providing shade and through evapotranspiration [20,21], have control over precipitation run-off of, and can improve the retention capacity of built-up areas [22].
The presented project is designed not only to improve the image of the facility but also to realistically increase the environmental values of the place. In this project, various types of vegetation were introduced in diverse arrangements that remain in conjunction with the engineering systems and traffic area, thereby constituting the GGB infrastructure (Table 1).
Traffic zones in the built-up areas are an important element that drastically changes the quality of the urban environment. The use of high albedo materials for pavements and implementation of a permeable structure have been able to significantly influence the level of local sustainability [22,24,25].
Loosened surfaces, with the possibility of introducing vegetation, are a specific case where a synergy of benefits occurs, and it results from the unsealing of the shielded cover and increasing the vegetation’s presence, thereby influencing the morphological indices to support a sustainable urban environment [7].
The design uses varying degrees of pavement loosening, incorporates vegetation into the pavement structure, and manipulates ground layers to improve the rainwater retention capacity.

2.2.2. Research Method

The research method consists in gradual, multi-faceted verification of the effectiveness of the implemented system of grey–green–blue infrastructure. The following aspects were analysed:
  • A comparative list of markers of biological activity in the area
In the planning practice, there are several types of measures that one can use to assess the influence of design intervention on the biological activity in the area. These scales are used for the identification of environmental features and for the evaluation of their ecological benefits [26]. Because of the multi-faceted nature of the GGB infrastructure, the BAF and GSF scales were used to explore the different aspects of projected intervention [26,27].
Essential for the area balance is its capacity to retain water, the size of the area covered with vegetation, and the type of introduced plant communities (considering their level of naturalness). The BAF scale promotes the connection between individual elements and the native soil, accommodating the plants with local conditions, and the ability to infiltrate rainwater (Table 2). In the GSF scale, the discriminant is constituted by the additional score granted by the greenery’s cubature of the area and implementation of the additional computational area for the size of trees and shrubs (Table 3) [27]. Intervention impact assessment involving two types of measures (GSF and BAF) reinforces the choice of the implemented project’s methods and highlights their comprehensiveness as far as shaping the area’s biological activity is concerned.
Quantification is performed on the basis of comparing the spatial dimension of a certain quality while bearing in mind the numerical quantity of the factor assigned to this quality concerning the area of the whole presumption, according to the following Equation (1) [26]:
BAF, GSF = ∑i(Fi × fi)/F
where: BAF, GSF—markers of biological activity in the area [-], Fi—partitive surface of certain land use [m2], fi-factor attributed to a certain land use (Table 2 and Table 3) [-], F—total area of the analysed land [m2].
  • Quantification of the potential for the reduction of stormwater runoff
The critical intensities method was applied to calculate the reduction of stormwater runoff (and, therefore, increasing the retention) from the analysed urban area [28]. This method is recommended for use in the catchment, the area of which is below 2 km2. In this case, it is assumed that the maximum flow of every computational section refers to the precipitation, the duration of which is the same as time needed for the water to reach the furthest section of the catchment. The method also considers the delays caused by the so-called area concentration and canal retention. Valid stream of volume Qm of rainfall [dm3/s] is calculated using the following Formula (2):
Qm = qmax(td,C)∙ψs∙A
where: qmax(td,C)—maximum unit intensity of rainfall for its duration (td (min)) and the frequency of occurrence of calculation rainfall (C (years)) [dm3/s ha], ψ_s—maximum (peak) rainwater runoff coefficient assumed depending on the sealing degree, land slope, and the frequency of calculated rainfall occurrence according to the DWA A-118:2006 [-] [29], A—surface of an urban area [ha].
The rainfall frequency C was assumed according to recommendations set out in the new standard PN-EN 752: 2017 [30] for city centres, areas of services, and industry (once every 5 years). The qmax value, calculated on the basis of a probabilistic model of maximum rainfall heights for the analysed area (from the observation period 1960–2009) for the duration of rainfall td = 15 min and for the rainfall frequency C = 5 years, according to the Regional Water Management Guidelines of the city of Wroclaw (2019) [31], qmax = 181.7 [dm3/s ha].
  • The influence of grey–green–blue infrastructure on thermal comfort conditions
The assessment of the effectiveness of urban green infrastructure on enhanced microclimatic conditions by modeling with the ENVI-met microclimatic software was implemented. The ENVI-met model was used to generate micro-climatic data for the selected area with two design scenarios; the first concerns the baseline scenario (the NoGreen scenario), and the second concerns the grey–green–blue (GGB) scenario (after implementation of green–blue infrastructure into grey infrastructure). ENVI-met, a computational fluid dynamics (CFD) model, simulates the microclimatic dynamics within a daily cycle in complex urban structures, and its high spatial and temporal resolution enables it to describe microclimate parameters at the pedestrian’s level [15,32]. Air temperature (PAT in °C), mean radiant temperature (MRT in °C), and hourly change in temperature (ATC in °C/h) for the selected day were calculated. PAT describes the so-called potential air temperature at reference (and model default) pressure; for the 3D model, it can be treated as the absolute air temperature. The idea behind using the mean radiant temperature (MRT) is that it allows for the assessment of the radiative exchange rate between a human and its environment, and MRT is the crucial parameter for describing the human energy balance, particularly during heatwaves [33,34]. The ATC parameter describes the changes in air temperature compared to the last hour (https://www.envi-met.com/software/; accessed on 15 May 2021).
ENVI-met simulations were performed under the meteorological conditions recorded on 27 August 2019, which is a representative day for heatwaves (Table S1 (Supplementary Materials)). The meteorological data used were gathered at the Meteorological Observatory of the University of Wroclaw (DCAP). The station is located about 2.5 km from the area of intervention. The Observatory is located in the eastern part of Wrocław, near the large Szczytnicki Park, about 5 km from the city centre and about 2.5 km from the area of intervention. The DCAP provides high-resolution, relevant information about the urban climate [35].
The average daily temperature for this day was 23.5 °C, with a daily maximum of temperature above 31 °C and a minimum temperature of around 17 °C. The average relative humidity was 69 %, and wind speed was 1.3 m/s (Table 4).
Given the geographic location, the radiation budget was calculated with an atmospheric model. The resulting data were stored at 1-h intervals. In area of intervention, taking into account the different land-use and GGB system, five receptors were selected to describe the impact of different types of small green infrastructures on microclimate conditions (Figure 2).
For the experimented cases, the situation was reconstructed in the model, including the characteristic morphology of the location, as well as mapping of the plant arrangements, including the traffic area, parking lot, and vegetation areas.
The computational domain covers a horizontal area of 50 m × 50 m and a vertical height of 20 m. The three-dimensional model is based on a grid domain, the cells of which define the vertical and horizontal extension ∆z as well as the resolution of the model. All grid cells have an identical extension of 2 m. The analysis was performed employing average leaf area density (LAD) parameters, taking different values for shrubs and trees. For the LAD of trees, a default value of 1.6 was chosen. In addition, groups of low vegetation were adopted: shrubs and creeping plants covering parking spaces and a pedestrian passage made with the living pavement technology.

3. Results

3.1. The Design Concept

The design concept proposes a hybrid GGB system comprising: bioretention elements (rain gardens, infiltration basins, bioswales), systems of traffic space with loose surfaces (green parking areas, and pedestrian passages with living pavement surface systems), and different types of vegetation (areas of arranged and decorative greenery, turf vegetation, groups of shrubs) (Figure 2 and Figure 3).

3.2. Multi-Criteria Evaluation of the Effectiveness of Solutions

3.2.1. Evaluation of Improvement in Biological Activity on the Designed Site

The results of the assessment of the GGB infrastructure system’s efficiency conducted before and after the introduction of the design idea using the BAF and GSF indicators are summarised in Table 5 and Table 6.
The analysis of the biological activity in the area using the BAF scale showed an upward trend from a value of 0.15 points, obtained for the site prior to the implementation of the design, up to a value of 0.24 points as a result of the implementation. The assessment on the GSF scale based on the evaluation of 15 types of land use showed a change from 0.16 points to 0.40 points. The GGB balance sheet for the area shows a decreasing trend in the percentage of grey area (from 84.7% to 72.0%), an increase in the share of green area (from 15.3% to 28.0%), and the distinguishing of the blue category with a size of 9.0% (Table 7).

3.2.2. Quantification of the Potential Increase in Water Retention

An increase in the greenfield areas, taking into account the systems that ensure the infiltration of rainwater without the retention or temporary retention of water in the bioretention systems, i.e., rain gardens, bioswales, allows for a reduction in the reliable flow rate, Qm, of the rainwater from 41.8 dm3/L to 37.8 dm3/L. Consequently, with newly designed land use, water retention can rise by more than 9% (Table 8). This is the amount of water that will remain on the spot of precipitation and then enter the groundwater and, thus, does not run unproductively in the sewerage network.

3.2.3. The Influence of the Green–Blue Infrastructure on Thermal Comfort Conditions

The effect of the replacement of conventional paving materials with cool water-permeable materials and vegetation was examined by means of an ENVI-met simulation. The extraction of 1.5 m of air temperature (expressed as PAT) and the mean radiant temperature (MRT) from the model were used to assess the thermal conditions during a selected day of a heatwave in Wroclaw. The results of the microclimate simulation show the limited but constant improvement of the thermal conditions throughout the analysed day. It should be noted that, within the analysed project, a mainly permeable structure and low vegetation with a small share of trees were introduced; therefore, the direct shading of a surface by greenery and the increase of the surface albedo by cool and green areas leads to a decrease in the net radiation of the surface underneath. The albedo of built-up areas can be around 0.1–0.2, whereas the albedo of green areas can reach values of 0.3 or higher [36,37,38,39,40]. Thus, in the case of the designed intervention, the reduction of solar radiation is expected. The previous studies show that an increase in the ground albedo from 50% to 80% leads to a variation in the surface temperature by approximately 5 °C [7,41] even though the best effect could be achieved by the synergy of the green infrastructure with cool materials and permeable surfaces [42].
In addition, any soil moisture changes from the implemented green–blue infrastructure impact the thermal properties of the soil and air by enhancing evaporative cooling [43]. The evaporative cooling contributes to reducing heat absorption by the ground surface, lowers the Bowen ratio (the partitioning between sensible and latent heat flux), and also decreases the air temperature of the area in the vicinity. This effect has greater importance during the day rather than at night because of the turbulent transport in the atmospheric surface layer predominant after sunrise [44,45].
A comparison of the thermal conditions before the introduction of green–blue infrastructure and after the modification indicates relatively small but significant changes in the thermal properties of the analysed area (Table 9). The average daily difference in the air temperature (expressed as PAT) in the selected points varies from 0.03 °C (point 5, close to grass car park) to 0.22 °C (point 1, above bioswales zone). In the reference points, the registered maximum diurnal air temperature variation ranges from 0.2 °C to 1.1 °C. A part of these reductions is also achieved thanks to the shading effect of the trees, higher shrubs, and walls of the main building. Generally, a comparison of the air temperature differences between reference points indicates that a cooling effect is found to increase with the rising number of trees and increasing the share of bioretention areas (e.g., bioswales zone).
The strategies employed have a more significant impact on the MRT values when it concerns the ambient temperature. The mean radiant temperature is one of the crucial parameters for describing human thermal comfort, and it influences all shortwave and longwave radiation fluxes on the human body [46,47]. The introduction of green–blue infrastructure contributes to the reduction of the MRT value from 1.43 °C to over 9 °C on average. The largest difference between the scenarios found is 34 °C in relation to the MRT values (Table 9). It should be highlighted that, within any urban area, MRT is the major driver of outdoor human thermal comfort and has a stronger effect on the wellbeing of the citizens than air temperature, particularly during heatwaves [48].
Moreover, MRT is more sensitive to the shading effect than air temperature, but an increase in surface reflectance could also increase the MRT value due to more heat absorbed by the human body (Figure 4). Based on the model simulation, the rising temperature rate during the day and cooling rate during the night were calculated (ATC air temperature changes index) (Table 9). Generally, at the reference points, slower changes in air temperature were noted after the introduction of green–blue infrastructure, on average from 0.02 °C/h to 0.13 °C/h. The ATC index for daytime hours achieved 1.4 °C/h for the baseline scenario vs. 1.1 °C/h for the GGB scenario in reference point 1. The maximum differences between the scenarios for the heating rate are around 0.2 °C/h (for point 1), while points 2 and 4 achieved only around 0.02 °C/h. Compared to the air temperature (PAT), there is no difference in the cooling rate during the afternoon and night between the two scenarios analysed, with the slightly lower temperature recorded during the night after the introduction of NBS being the outcome rather of the lower maximum temperature during the day.
Figure 4 illustrates the spatial variation in the air temperature (PAT in °C) and mean radiant temperature (MRT in °C) at 4 p.m. (the hour with the maximum air temperature) for the baseline and GGB scenarios. The results reflect the thermal conditions on a day with a heatwave. The range of the temperature values (PAT) shows a significant variability, ranging from 28 °C to above 30 °C for both scenarios, even though the analysis also indicates a greater spatial variation in this parameter after the introduction of NBS. Before the intervention, the lower air temperature was recorded in the west over the main building due to the impact of the existing greenery multiplied by the shading effect of the building during the hours after sunrise. After the NBS implementation, this area is still the coldest place, with a temperature of around 28 °C, but this is a visible reduction in the temperature due to the replacement of conventional materials. The significant lowering of the temperature (above 1 °C) was observed close to the rain gardens and bioswales zones, while less important changes were recorded above the permeable car park. The spatial distribution of the air temperature indicates that its variability is primarily determined by the presence of shaded areas around the trees or building and changes in the heat absorption and distribution due to the evaporative effect [49]. The introduction of green areas reduces the temperature, mainly in their immediate vicinity, but the so-called oasis effect, understood as a horizontal advection of cooler air [50], is visible about 10 m apart from the green infrastructure along with the main wind flow (Figure 4).
The analysis indicates a great variation in the radiant heat load (expressed by the MRT value) at the pedestrian level (1.5 m) within short distances, which varies from 34 °C to above 61 °C for the baseline scenario and from 30 °C up to 60 °C for the GGB one. Before the intervention, the MRT values at the spaces in the shadow of the building tended to be lower than above the unshaded sites with asphalt road and pavement. After the introduction of the GGB infrastructure, a greater spatial variability in the MRT is observed. The green-covered areas allow for the improvement in thermal comfort and, according to the analysis, the MRT value within the vicinity of the green–blue infrastructure is lower at up to 30 °C in reference to the baseline scenario. However, the results of modeling indicate that, at some small restricted areas, the intervention can lead to the deterioration in heat comfort due to the enhanced reflection of solar radiation by the brighter (cooler) pavement as well as the trunks and leaves of trees or shrubs (Figure 4). This effect was confirmed in different analyses, e.g., Middel et al. [51] and Sun et al. [52]. However, in the case of planned intervention, this effect is limited only to a few points. The area with a higher MRT value is still connected with uncovered areas, but the sites with MRT values close to 60 °C are strongly reduced in comparison to the baseline scenario.
The comparative analysis of the microclimatic conditions for the baseline scenario, when taking into account the NBS intervention, shows that even such a small share of greenery can improve the thermal comfort of pedestrians.

4. Discussion

The sustainable development paradigm has developed many urbanisation models that are described in different ways: “sustainable cities”, “green cities”, “eco cities”, as well as specialist-oriented variants, such as “low carbon cities” and “resilient cities” [53,54]. In the context of urban structures, among other things, the concepts of porous city and city-sponges have been developed to increase the potential for the ventilation, filtration, and retention of urban structures [55]. The concept of porous city, apart from its broad social connotations, provides the opportunity to refer to the architectural and urban features and qualities of the built environment developed as permeable. It should thus be considered in terms of the meaning of an open, flexible, ventilated, and connected smart city as opposed to terms such as sealed, isolated, and hermetic [56].
In the presented project, thanks to the applied GGB infrastructure solutions, the postulated “porosity” and “sponginess” effect was achieved, thereby increasing the proportion of biologically active surfaces (Table 7) and achieving higher land sustainability parameters, as shown in the specific analyses.
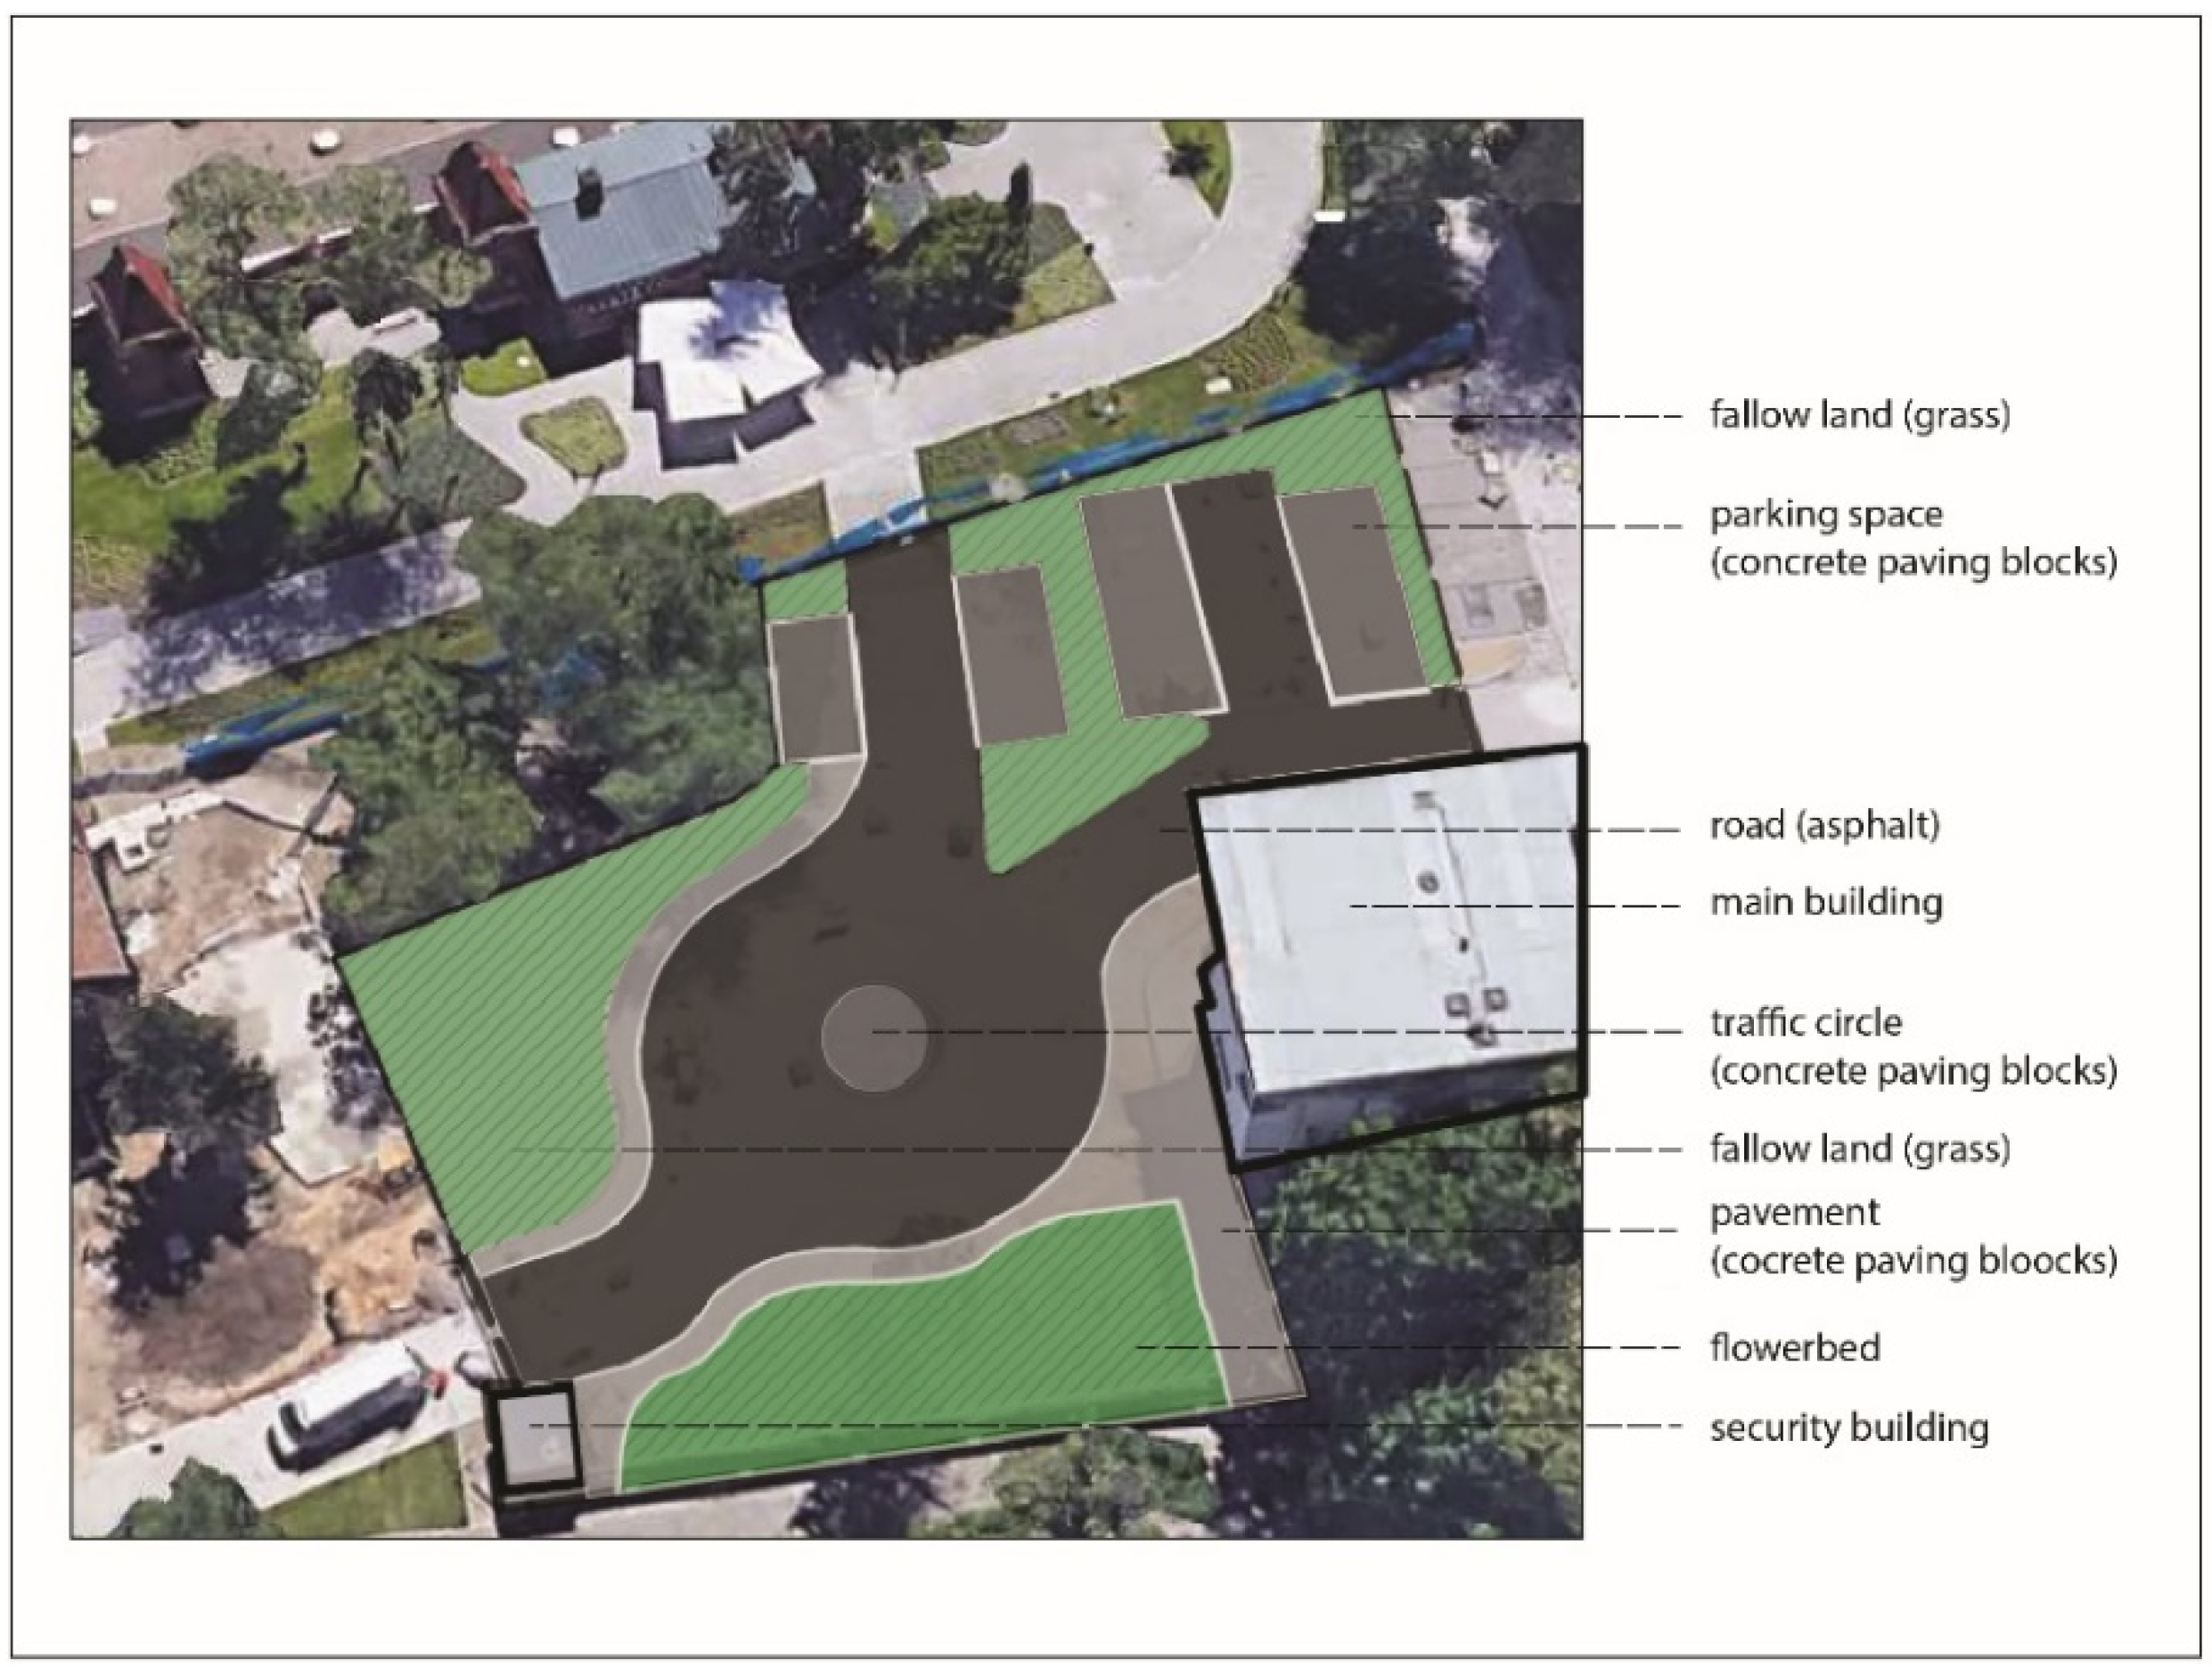
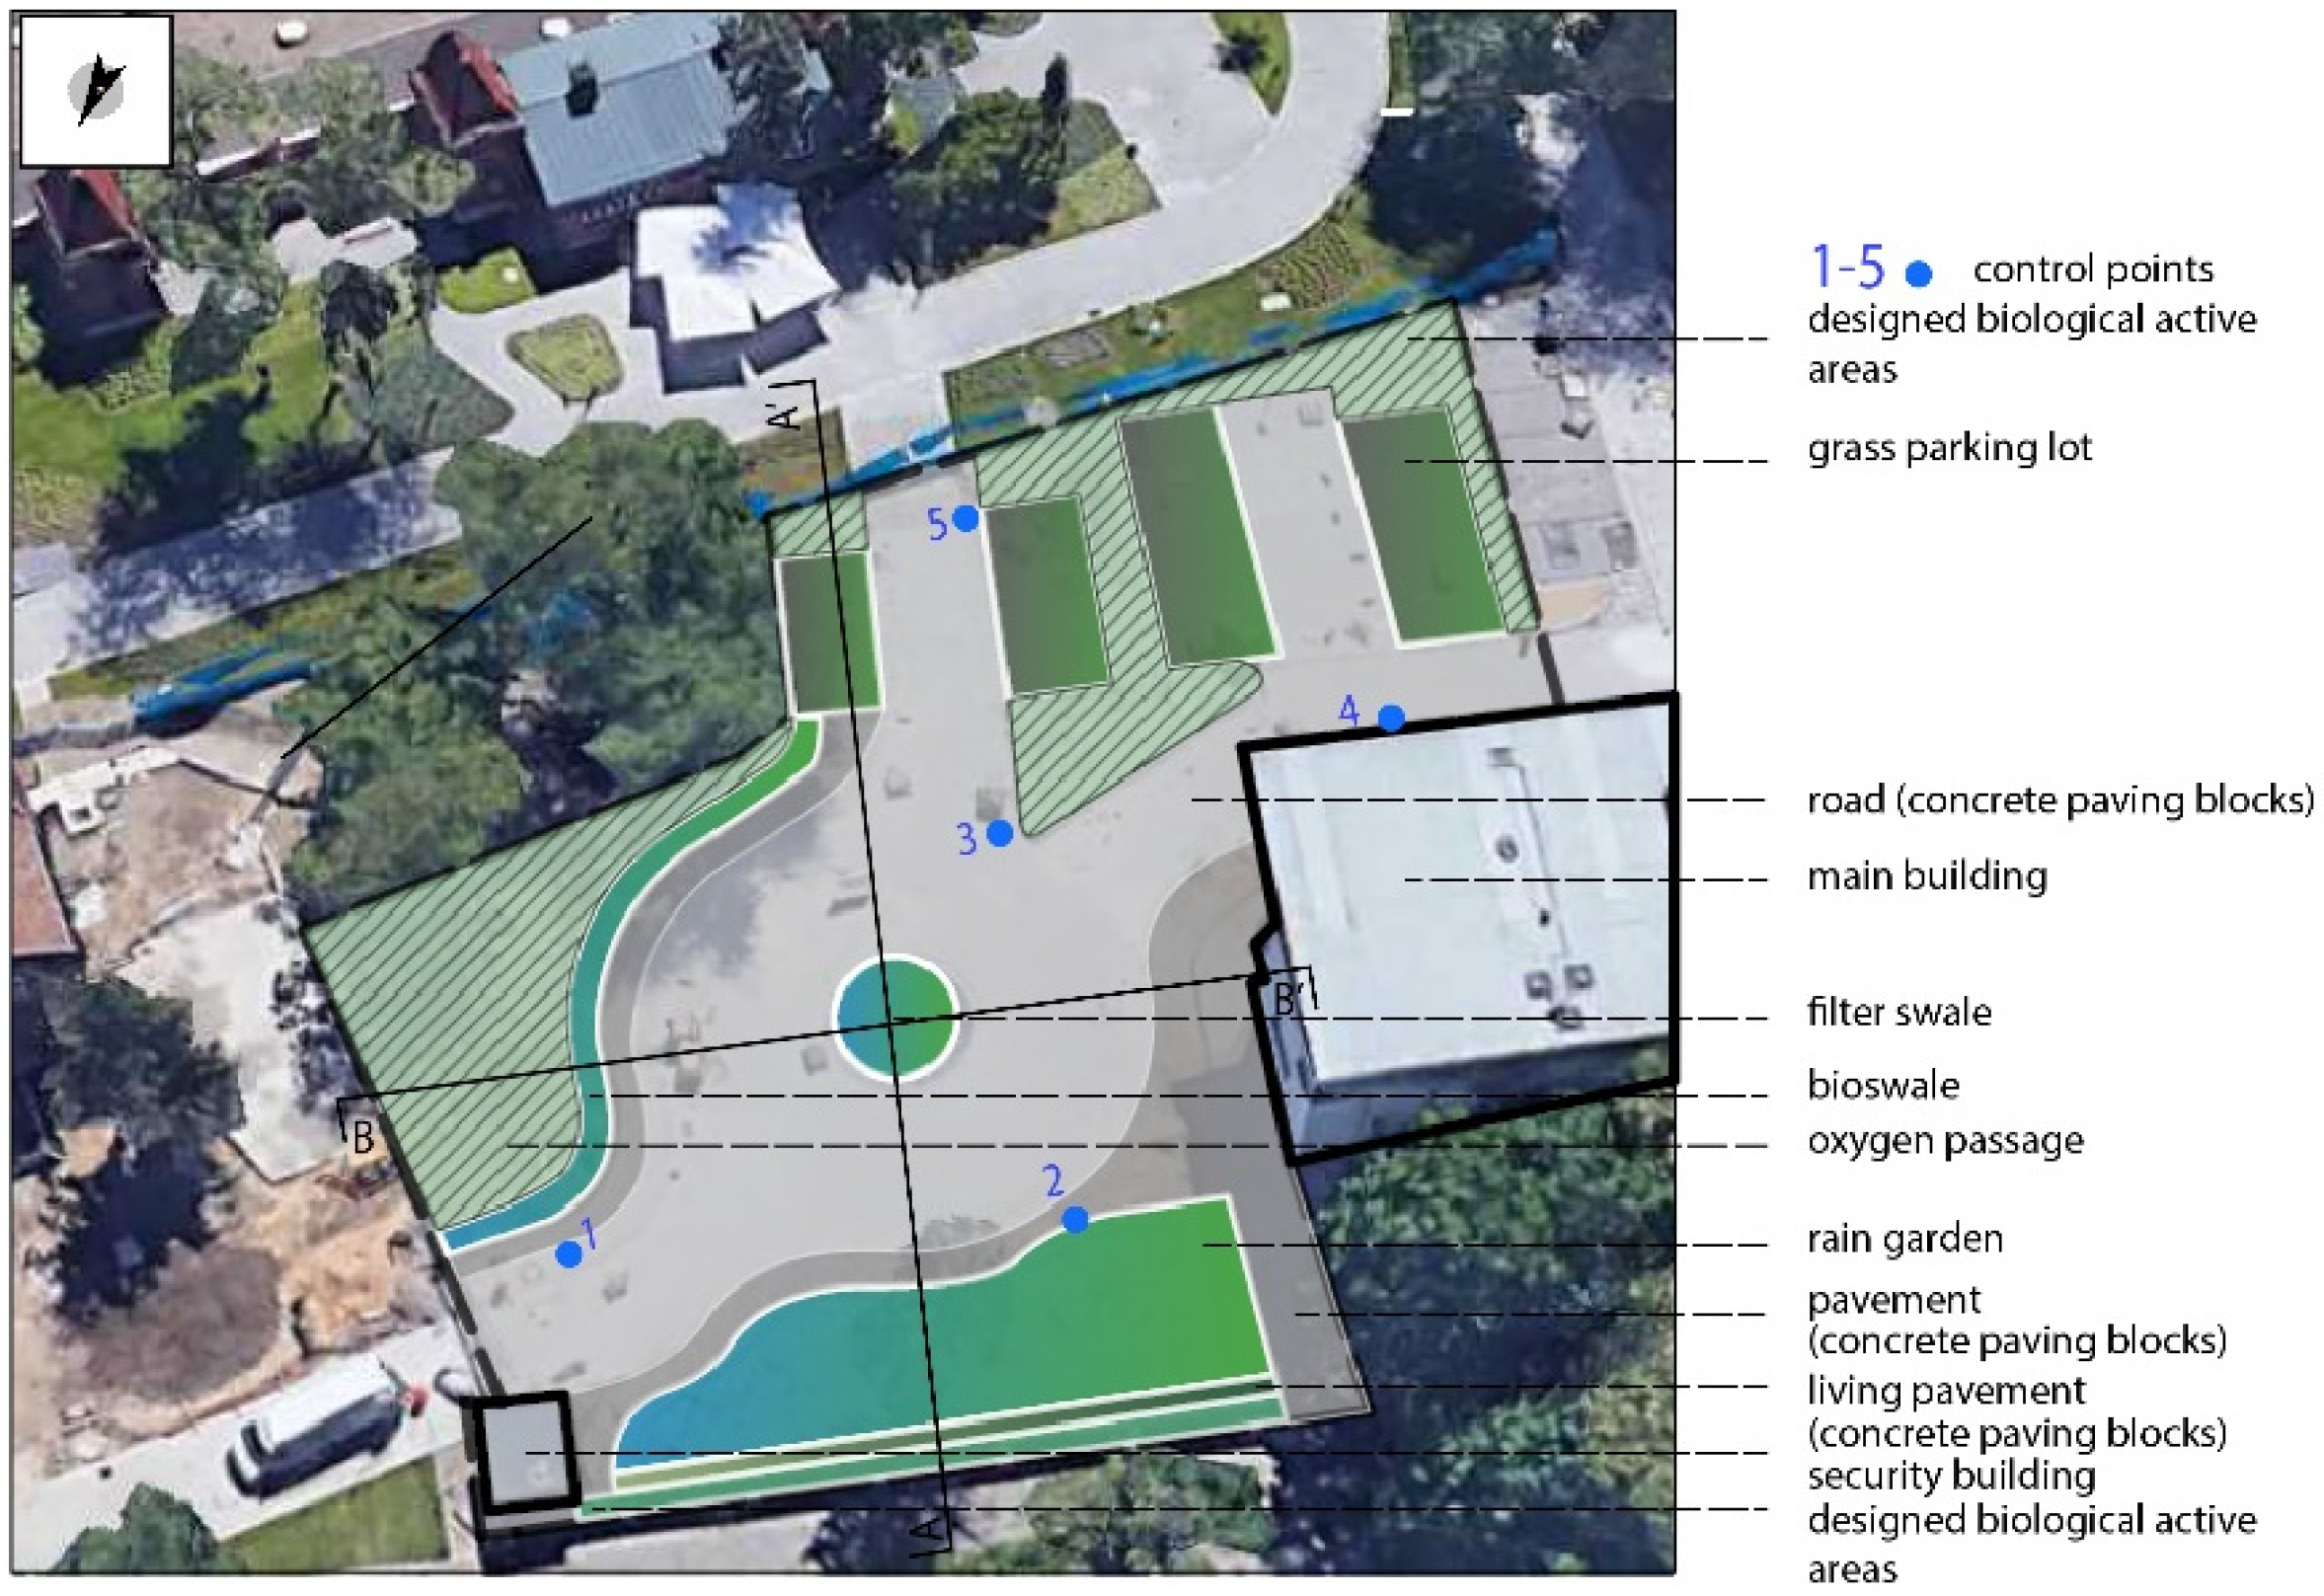
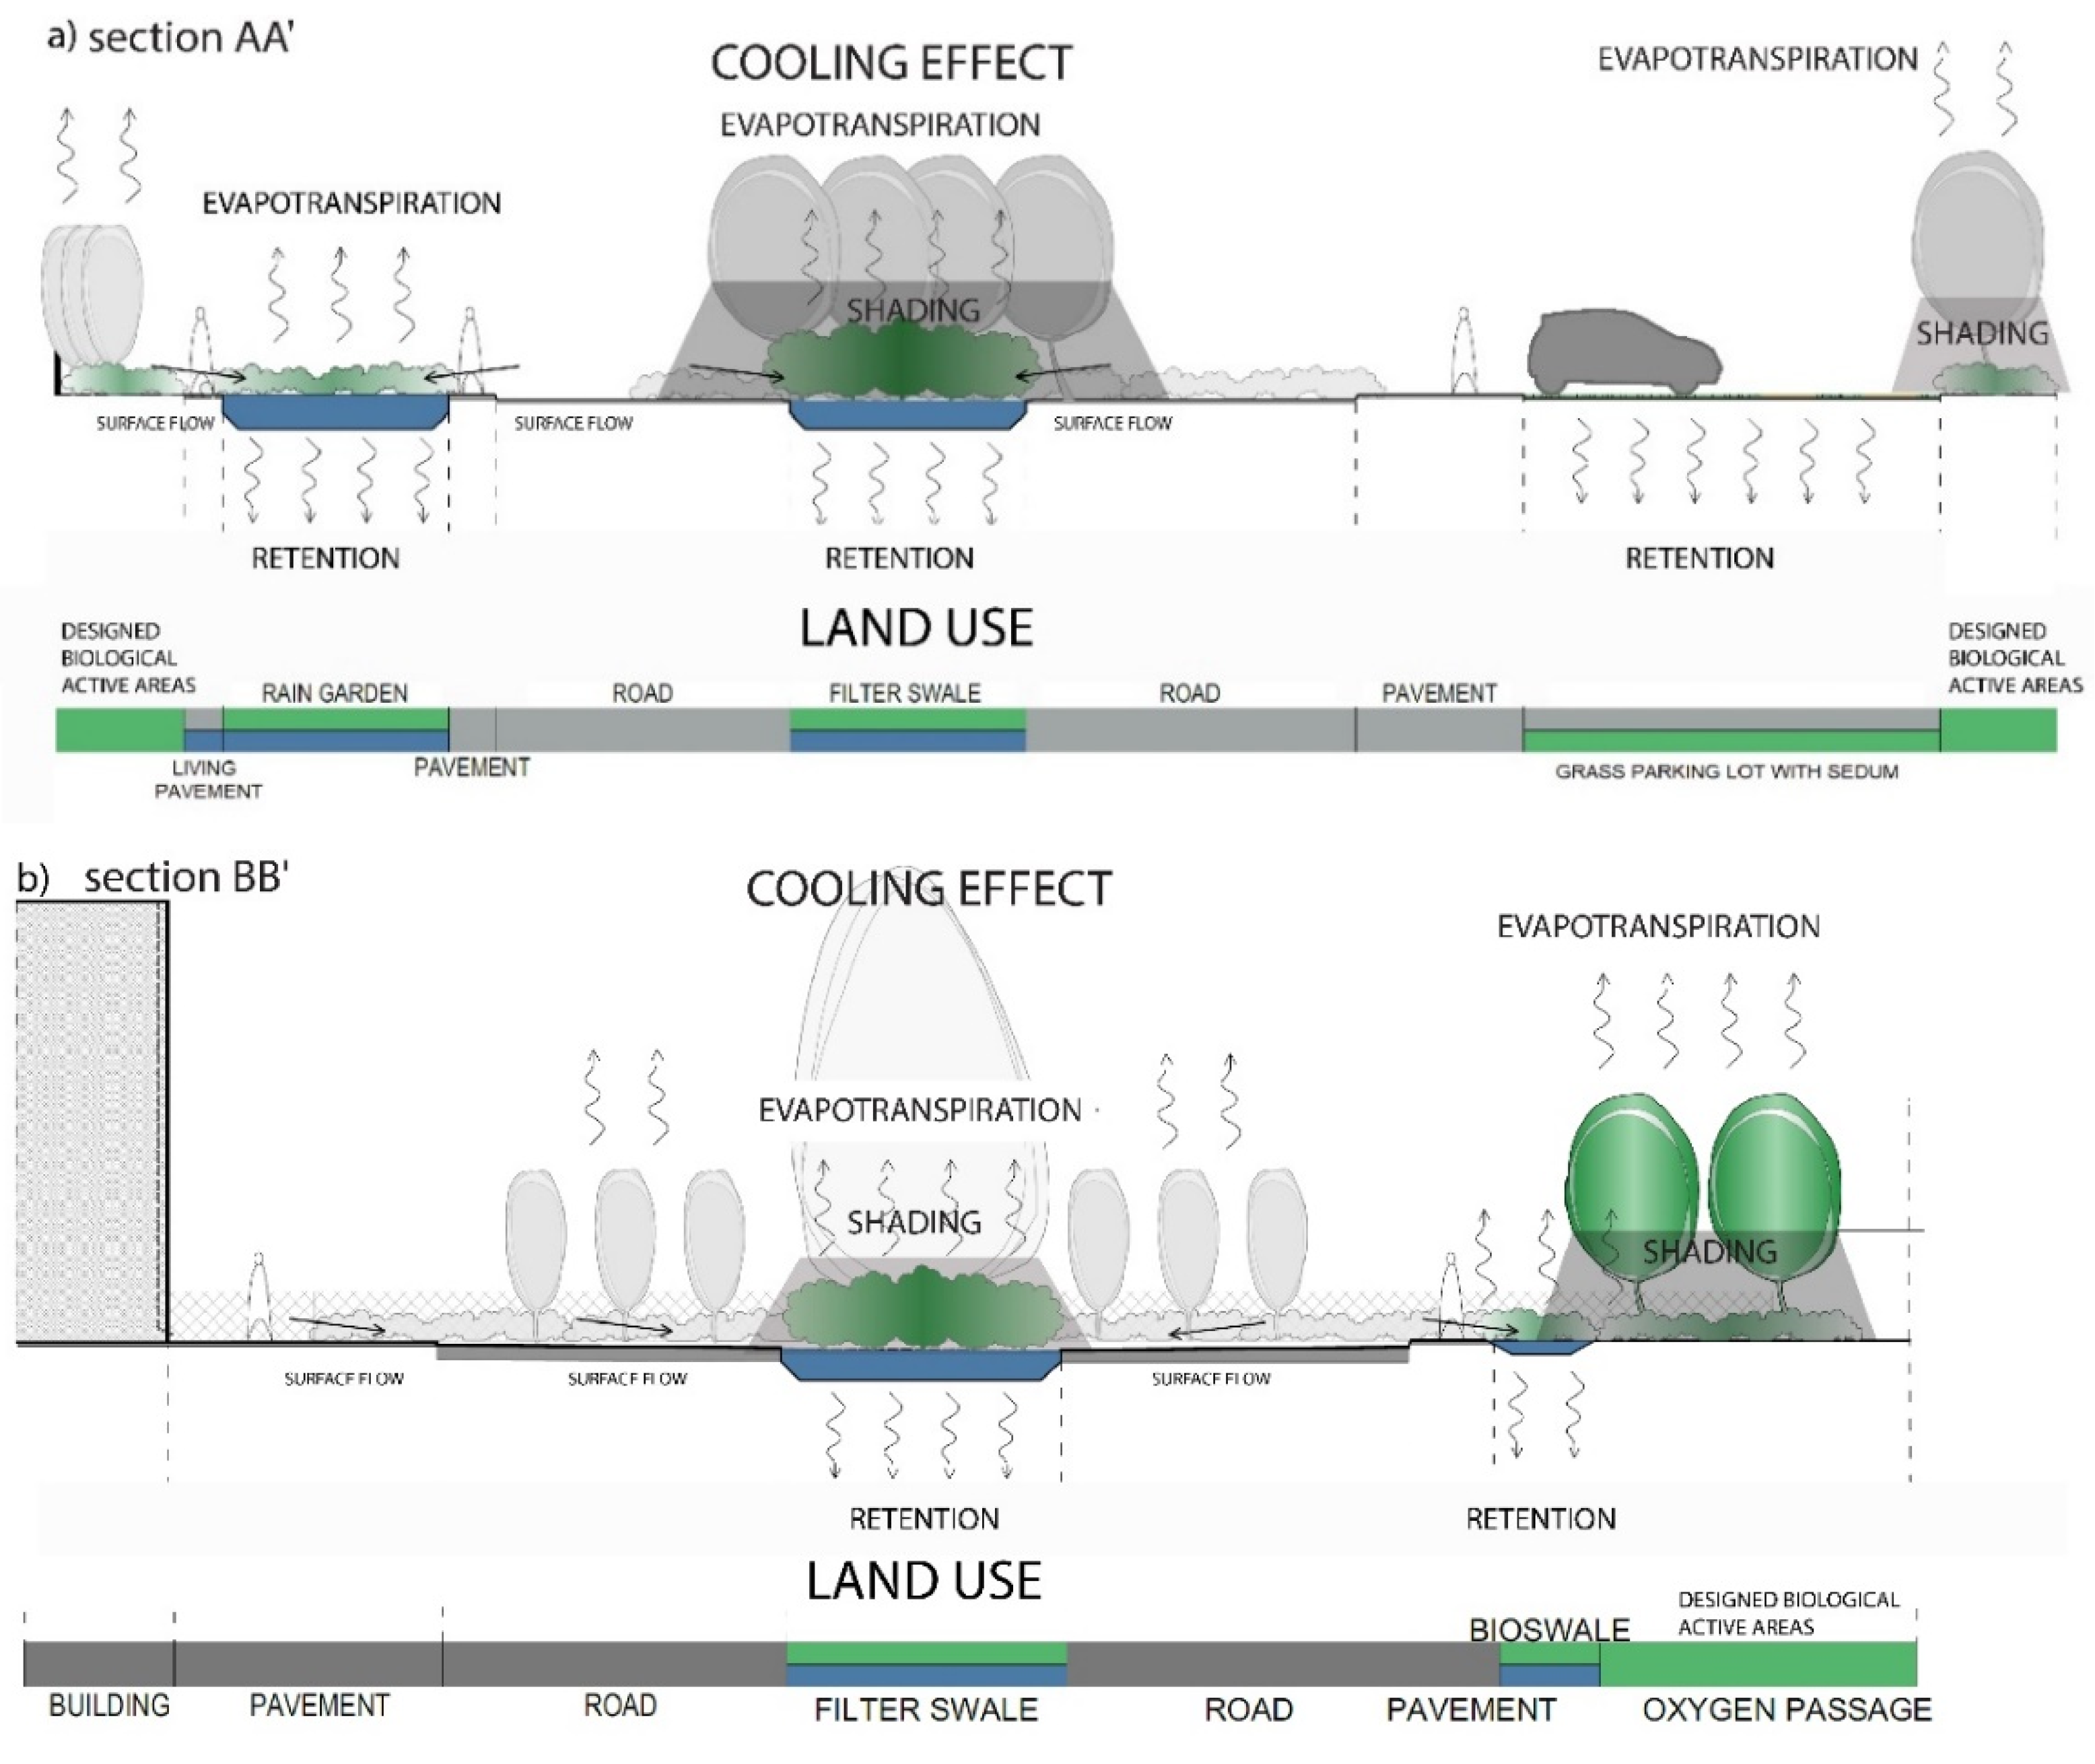
The cumulative effect of porosity and sponginess is achieved by the implementation of permeable surfaces (e.g., porous asphalt or cement, sustainable car park, living pavement systems), the scaling of green spaces, and also by a diversified form of greenery (starting with engineering structures and the associated vegetation and ending with some beginnings of a park habitat). This attempt allows for initiating some urban ecosystem and placing the design area within nature’s outer connected complex system.
The increased share of the biological factor within engineering structures provides an opportunity to reintegrate the urban processes with the natural cycles of nature and shape the framework of their circular, dynamic flow (appropriate for natural environments), which allows for the breaking of their linearity (typical for urban development), and, therefore, shaping the beginnings of the urban autarky [57].
An important element of shaping urban sustainability is the pursuit of a higher biodiversity in urban green areas, with the growing trend of naturalistic plantings in cities. Due to the adaptation of urban areas to many guidelines, including climate change, major modifications of plant systems are allowed, sometimes far from natural phytosociological patterns [58].
The individual parts of the project, although not shaped by actual phytosociological patterns, receive a visual impression of naturalness that affects the general quasi-naturalistic image of the object. In practice, such references are valuable so long as it is recognised that the pro-ecological value of the project also lies in fulfilling an educational function and shaping consumer patterns. Due to the role and popularity of the facility in the minds of the city’s inhabitants, this symbolic dimension should also be appreciated as an educational exhibition of sustainable shaping. When it comes to cities, it is accepted to establish habitats artificially so that they remain dependent on human care even though, in the natural sense, such compensatory habitats are considered to be of lesser value when compared to natural habitats. However, in the context of urban buildings, their value is significant, as is represented on the index scales created for the designed buildings, such as BAF(e.g., Berlin) or GSF (e.g., Malmö), which have also been introduced in this article [27,59].
The applied solutions from the nature-based group, by shaping the comprehensive set of GGB infrastructure, significantly increase the share of biologically active surface area within the built-up area, thus changing their quality.
The use of the BAF and GSF scales showed an increase in the area’s biological activity compared to the state before the introduction of the intervention. The BAF score improved by 0.9 points in relation to the situation before the intervention (0.15 before the intervention vs. 0.24 after the intervention). In the GSF scale, the intervention improved the level of biological activity in the area by 0.24 compared to the situation before the intervention (0.16 before the intervention vs. 0.40 after the intervention) (Table 5 and Table 6).
Despite the demonstrated improvement, the obtained values in relation to the guidelines in the same planning documents for European cities (e.g., Berlin’s Landscape Program, Masterplan Western Harbor, B01 Malmö), place the performed intervention at a level slightly below the lowest accepted values that would make it possible to recognise the ecological significance of the implementation. The BAF scale takes values from 0.6 for new residential units, public facilities, and nursery schools to 0.3 for commercial, city centre, and technical infrastructure. In the case of the GSF scale in relation to an environmentally sustainable urban district B01 (Malmö), the lowest value adopted was 0.5 points. The values obtained in the research were 0.24 points (BAF) and 0.40 points (GSF) despite demonstrating an overall improvement (on the BAF scale by 60 %, on the GSF scale by 150 %); still, these are below the accepted level of acceptance, This indicates the need to develop additional aspects towards increasing the facility’s level of environmental performance. Such a situation should be considered consistent with the intended use of tools, such as the BAF and GSF scales, which, being regulatory tools, should be used in the evaluation of the intervention’s effectiveness and to shape the attitude of a “creative” dialogue with the investor, allowing to clarify the course of action and guidelines aimed at increasing the ecological value of the facility [27].
In the literature, numerous studies have evaluated the hydrological performance of bioretention cells using different methodologies and tools in field and laboratory experiments, as well as in hydrological and hydraulic modelling. The majority of these studies have focused on the hydrological performance of a given type of bioretention system, i.e., rain gardens, green roofs, etc. To a limited extent, such analyses are performed for larger areas with different land uses. Generally, the results have indicated that nature-based solutions are useful to control runoff in urban areas. Managing water and urban drainage systems through the implementation of these systems allows for improving the hydrological response of urban areas. Mahmoud et al. [60] have evaluated a bioretention system and compared its performance with traditional asphalt pavement located in the same parking area. In this case, the average runoff volume from the bioretention cell was 82% lower than that of the traditional asphalt pavement section. The performance of bioretention cells on the reduction of runoff volume, peak runoff, and first flush under potential climatic changes of different design storms using a hydrology model (SWMM) was examined by Wang et al. [61]. The study results indicated that the hydrological performance of these systems is highly sensitive to their structure and scale, as well as to rainfall events. It was found [62] from a dataset of 49 rainfall events that 18% percent of the events were small enough so that the bioretention media were able to capture the entire inflow volume and no outflow was observed. Overall, from a hydrologic perspective, the runoff reduction decreased as the total rainfall increased. Hence, NBS cannot replace the grey infrastructure but should be integrated with it.
The perspective that should be discussed in the assessment of the presented project is, therefore, not only its unit efficiency but, above all, the possibility of including the facility in the designed variant of systems in urban sustainable areas. Analytical studies conducted for many cities show that the introduction of NBS systems to replicate the natural mechanisms of absorption and retention in the urban drainage network system provides multiple benefits, contributes to improvement in urban stormwater management, and has several other societal benefits, such as air quality improvements, reduction of heat island effects, and increasing the aesthetic and recreational values. This gives ample grounds to determine the new guidelines in the design and urban water management for climate change adaptation [12,63].
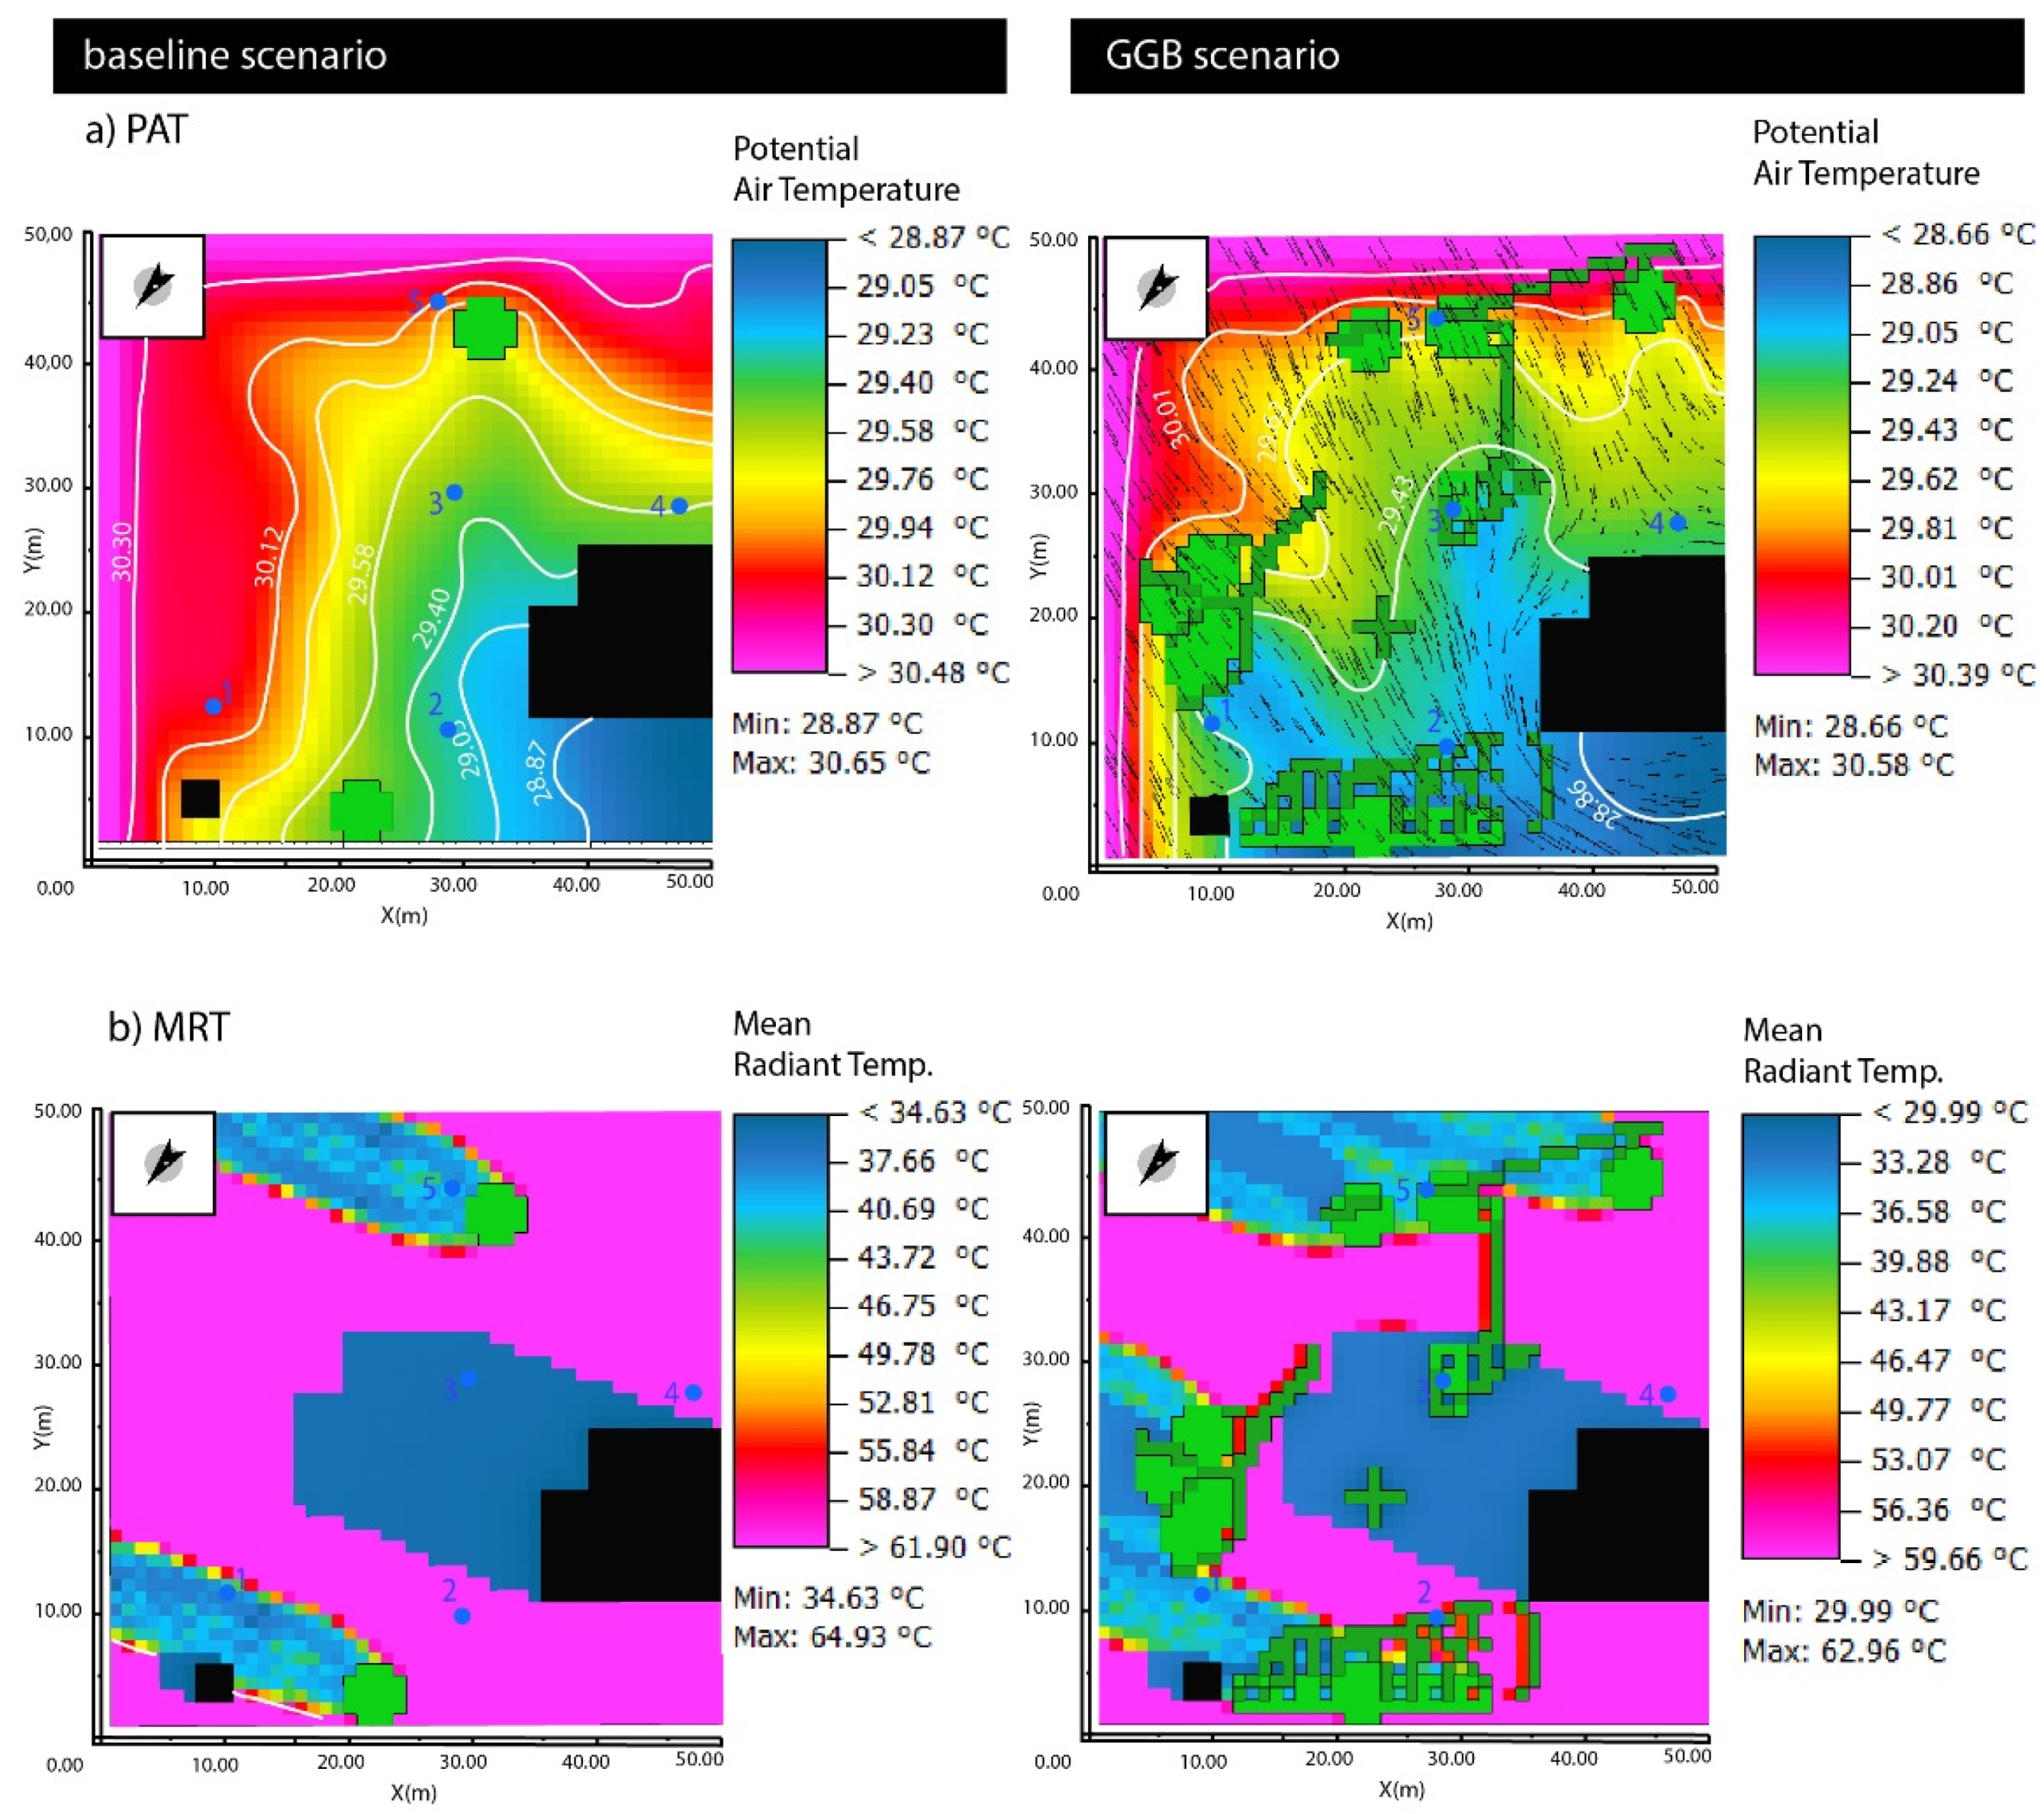
It was also shown that there was an improvement in the land’s retention capacity for rainwater at over 9 % (Table 8) and a development in the thermal conditions, which implies that the introduction of green infrastructure contributes to a reduction in the MRT index from 1.43 °C to over 9 °C on average (Table 9). Similar values have been achieved in other analyses of the cooling effect of small green infrastructures, but the final effect strongly depends on the type of greenery and its size, as well as the general meteorological condition. For example, in Thessaloniki, Greece, the cooler effect was characterised by very small differences in air temperature, up to 0.3 °C, but up to 17.5 °C in surface temperatures, and approximately 43 °C in MRT [64]. In Hong Kong, the researchers proved that pocket parks can reduce the daytime urban heat island effect by 0.5 °C [65]. An additional 5% of green area covered by shrubs or new trees further reduces the surface temperature by around 0.5 °C [66,67].
In light of the list presented above and, taking into account the small range of applied interventions, the proven improvement is not only satisfactory but also validates the choice of these types of solutions in larger-scale situations.
In recent decades, the sustainable development trend has noticeably succeeded in terms of quality improvement in Polish cities as well [68]. The implemented infrastructure modernisation and pro-ecological policy have resulted in pro-ecological solutions being applied in cities, thereby bettering the environmental quality. Based on an analysis of 25 variables, it was determined that, between the years 2004 and 2016, the value of the summative ecologisation index (SEI) of Polish cities increased on average by 6% [69]. The discussed example is a result of the long-term impact of the adopted aforesaid policy.
Overall, the facility presented is a representation of the best practices in the field of integrated sustainable design. When selecting strategies, indicators, technologies, and tools to assess the ecological aspect of sustainability, there is no explicit instruction to use prediction tools at the design stage. The introduced proposal to the effect that a research aspect should be included in the design process is an attempt to bridge the gap between the advancement in research and its practical application, which is of interest to many researchers [70]. A multi-criteria evaluation of the effectiveness of NBS solutions, suggested as a mandatory design stage, raises awareness of the interdependence of aspects and decisions. It also constitutes a move towards the development of appropriate design regulations and guidelines that could lead to higher quality built-up areas.

5. Conclusions

The synergistic application of the grey–green–blue infrastructure systems will allow for the attainment of many benefits. The results of the detailed analyses have shown that even a slight decrease in the tight and homogeneous quality of the surface or the inclusion of vegetation will not only diversify the form of development in an area but, more importantly, will also enable the creation of compact urban buildings with better sustainability parameters. The design interventions have resulted in an increase in the biologically active area by 12.7%, thereby indicating a rise in the indicators of BAF and GSF scales of, respectively, 0.09 points and 0.24 points when compared to the state before the development of the area. The introduction of the permeable surfaces and bioretention systems led to a reduction in the surface runoff that was later channeled to a receiving water body while, at the same time, increasing the capacity to retain rainwater in the area. The estimated increase in such retention, based on the design solution, has increased the water retention by 9.5%. Introducing the green infrastructure has contributed to a reduction in the MRT index from 1.43 °C to over 9 °C on average.
The positive results from a multi-criteria evaluation of the selected aspects have allowed us to assume the effectiveness of the implemented GGB solutions. The object-shaping method, based on a synchronisation of the influence of many factors, including plant material, passive technologies, and engineering systems, has become an effective tool for developing a sustainable form of urbanised areas. The methodology from this study could be transferred to other locations. However, it should be taken into account that the criteria for the NBS impact assessment should be set individually following the local guidelines in the fit-to-place design process.

Supplementary Materials

The following are available online at https://www.mdpi.com/article/10.3390/atmos12111464/s1, Table S1: The meteorological conditions during heatwaves in August 2019.

Author Contributions

Visualisation, B.P., T.S. and A.J.; Writing—original draft and rewriting at review stage, E.P., E.B.-A. and A.D.-O.; Writing—editing, M.Z. All authors have read and agreed to the published version of the manuscript.

Funding

This research received no external funding.

Institutional Review Board Statement

Not applicable.

Informed Consent Statement

Not applicable.

Data Availability Statement

Not applicable.

Acknowledgments

The publication stage was co-financed by the Leading Research Groups support project from the subsidy increased for the period 2020–2025 in the amount of 2% of the subsidy referred to Art. 387 (3) of the Law of 20 July 2018 on Higher Education and Science, obtained in 2019.

Conflicts of Interest

The authors declare no conflict of interest.

References

  1. Koch, F.; Bilke, L.; Helbig, C.; Schlink, U. Compact or cool? The impact of brownfield redevelopment on inner-city micro climate. Sustain. Cities Soc. 2018, 38, 31–41. [Google Scholar] [CrossRef]
  2. Chao, A.L.; Gallego, A.C.; Lopez-Chao, V.; Alvarellos, A. Indicators Framework for Sustainable Urban Design. Atmosphere 2020, 11, 1143. [Google Scholar] [CrossRef]
  3. Akbari, H.; Kolokotsa, D. Three decades of urban heat islands and mitigation technologies research. Energy Build. 2016, 133, 834–842. [Google Scholar] [CrossRef]
  4. Loibl, W.; Vuckovic, M.; Etminan, G.; Ratheiser, M.; Tschannett, S.; Österreicher, D. Effects of Densification on Urban Microclimate—A Case Study for the City of Vienna. Atmosphere 2021, 12, 511. [Google Scholar] [CrossRef]
  5. Brears, R.C. Blue-Green Infrastructure in Managing Urban Water Resources; Palgrave Macmillan: London, UK, 2017; pp. 43–61. [Google Scholar]
  6. Burszta-Adamiak, E.; Stańczyk, J.; Łomotowski, J. Hydrological performance of green roofs in the context of the meteorological factors during the 5-year monitoring period. Water Environ. J. 2018, 33, 144–154. [Google Scholar] [CrossRef] [Green Version]
  7. Silva, I.; Santos, R.; Lopes, A.; Araújo, V. Morphological Indices as Urban Planning Tools in Northeastern Brazil. Sustainability 2018, 10, 4358. [Google Scholar] [CrossRef] [Green Version]
  8. Norton, B.A.; Coutts, A.M.; Livesley, S.; Harris, R.J.; Hunter, A.M.; Williams, N. Planning for cooler cities: A framework to prioritise green infrastructure to mitigate high temperatures in urban landscapes. Landsc. Urban Plan. 2015, 134, 127–138. [Google Scholar] [CrossRef]
  9. Ng, E.; Chen, L.; Wang, Y.; Yuan, C. A study on the cooling effects of greening in a high-density city: An experience from Hong Kong. Build. Environ. 2012, 47, 256–271. [Google Scholar] [CrossRef]
  10. Peng, C.; Ming, T.; Cheng, J.; Wu, Y.; Peng, Z.-R. Modeling Thermal Comfort and Optimizing Local Renewal Strategies—A Case Study of Dazhimen Neighborhood in Wuhan City. Sustainability 2015, 7, 3109–3128. [Google Scholar] [CrossRef] [Green Version]
  11. Dorst, H.; van der Jagt, A.; Raven, R.; Runhaar, H. Urban greening through nature-based solutions—Key characteristics of an emerging concept. Sustain. Cities Soc. 2019, 49, 101620. [Google Scholar] [CrossRef]
  12. Ncube, S.; Arthur, S. Influence of Blue-Green and Grey Infrastructure Combinations on Natural and Human-Derived Capital in Urban Drainage Planning. Sustainability 2021, 13, 2571. [Google Scholar] [CrossRef]
  13. Kabisch, N.; Frantzeskaki, N.; Pauleit, S.; Naumann, S.; Davis, M.; Artmann, M.; Haase, D.; Knapp, S.; Korn, H.; Stadler, J.; et al. Nature-based solutions to climate change mitigation and adaptation in urban areas: Perspectives on indicators, knowledge gaps, barriers, and opportunities for action. Ecol. Soc. 2016, 21, 39. [Google Scholar] [CrossRef] [Green Version]
  14. European Commission. The EU and Nature-Based Solutions. Available online: https://ec.europa.eu/info/research-and-innovation/research-area/environment/nature-based-solutions_en (accessed on 1 December 2020).
  15. Makido, Y.; Hellman, D.; Shandas, V. Nature-Based Designs to Mitigate Urban Heat: The Efficacy of Green Infrastructure Treatments in Portland, Oregon. Atmosphere 2019, 10, 282. [Google Scholar] [CrossRef] [Green Version]
  16. Battisti, A.; Laureti, F.; Zinzi, M.; Volpicelli, G. Climate Mitigation and Adaptation Strategies for Roofs and Pavements: A Case Study at Sapienza University Campus. Sustainability 2018, 10, 3788. [Google Scholar] [CrossRef] [Green Version]
  17. Shashua-Bar, L.; Hoffman, M. Vegetation as a climatic component in the design of an urban street. Energy Build. 2000, 31, 221–235. [Google Scholar] [CrossRef]
  18. Gallagher, J.; Baldauf, R.; Fuller, C.H.; Kumar, P.; Gill, L.; McNabola, A. Passive methods for improving air quality in the built environment: A review of porous and solid barriers. Atmos. Environ. 2015, 120, 61–70. [Google Scholar] [CrossRef]
  19. Xing, Y.; Brimblecombe, P. Role of vegetation in deposition and dispersion of air pollution in urban parks. Atmos. Environ. 2019, 201, 73–83. [Google Scholar] [CrossRef]
  20. Wang, C.; Wang, Z.-H.; Wang, C.; Myint, S.W. Environmental cooling provided by urban trees under extreme heat and cold waves in U.S. cities. Remote Sens. Environ. 2019, 227, 28–43. [Google Scholar] [CrossRef]
  21. Rost, A.T.; Liste, V.; Seidel, C.; Matscheroth, L.; Otto, M.; Meier, F.; Fenner, D. How Cool Are Allotment Gardens? A Case Study of Nocturnal Air Temperature Differences in Berlin, Germany. Atmosphere 2020, 11, 500. [Google Scholar] [CrossRef]
  22. Shimazaki, Y.; Aoki, M.; Nitta, J.; Okajima, H.; Yoshida, A. Experimental Determination of Pedestrian Thermal Comfort on Water-Retaining Pavement for UHI Adaptation Strategy. Atmosphere 2021, 12, 127. [Google Scholar] [CrossRef]
  23. Langergraber, G.; Castellar, J.A.C.; Pucher, B.; Baganz, G.F.M.; Milosevic, D.; Andreucci, M.-B.; Kearney, K.; Pineda-Martos, R.; Atanasova, N. A Framework for Addressing Circularity Challenges in Cities with Nature-Based Solutions. Water 2021, 13, 2355. [Google Scholar] [CrossRef]
  24. Santamouris, M.; Kolokotsa, D. Urban Climate Mitigation Techniques; Routledge: Thames, UK, 2016; pp. 1–26. [Google Scholar]
  25. Bouzouidja, R.; Leconte, F.; Kiss, M.; Pierret, M.; Pruvot, C.; Détriché, S.; Louvel, B.; Bertout, J.; Aketouane, Z.; Wu, T.V.; et al. Experimental Comparative Study between Conventional and Green Parking Lots: Analysis of Subsurface Thermal Behavior under Warm and Dry Summer Conditions. Atmosphere 2021, 12, 994. [Google Scholar] [CrossRef]
  26. Vartholomaios, A.; Kalogirou, N.; Athanassiou, E.; Papadopoulou, M. The green space factor as a tool for regulating the urban microclimate in vegetation-deprived Greek cities. In Proceedings of the International Conference on “Changing Cities”: Spatial, Morphological, Formal & Socio-Economic Dimensions, Skiathos, Greece, 18–21 June 2013. [Google Scholar] [CrossRef]
  27. Szulczewska, B.; Giedych, R.; Borowski, J.; Kuchcik, M.; Sikorski, P.; Mazurkiewicz, A.; Stańczyk, T. How much green is needed for a vital neighbourhood? In search for empirical evidence. Land Use Policy 2014, 38, 330–345. [Google Scholar] [CrossRef]
  28. Kotowski, A. Fundamentals of Safe Land Drainage Dimensioning—Volume I—Sewer Networks, 2nd ed.; Seidel-Przywecki Publishing Ltd.: Warsaw, Poland, 2015; p. 399. (In Polish) [Google Scholar]
  29. DWA. DWA-A118:2006: Bemessung und Nachweis von Entwässerungssystemen; DWA: Hennef, Germany, 2006. (In German) [Google Scholar]
  30. PN-EN 752:2017 Drain and Sewer Systems Outside Building—Sewer System Management; Polish Committee for Standardization: Warsaw, Poland, 2013.
  31. Municipal Water and Sewage Company S.A. Guidelines for Rainwater Management in the City of Wroclaw; Design and Construction Guidelines; Municipal Water and Sewage Company S.A.: Wroclaw, Poland, 2019. [Google Scholar]
  32. Bruse, M. Die Auswirkungen Kleinskaliger Umweltgestaltung auf das Mikroklima. Entwicklung des Prognostischen Numerischen Modells ENVI-Met zur Simulation der Wind-, Temperatur- und Feuchteverteilung. Städtischen Strukturen; The Ruhr-University Bochum: Bochum, Germany, 1999. (In German) [Google Scholar]
  33. Naboni, E.; Meloni, M.; Coccolo, S.; Kämpf, J.; Scartezzini, J.-L. An overview of simulation tools for predicting the mean radiant temperature in an outdoor space. Energy Procedia 2017, 122, 1111–1116. [Google Scholar] [CrossRef]
  34. Trimmel, H.; Weihs, P.; Faroux, S.; Formayer, H.; Hamer, P.; Hasel, K.; Laimighofer, J.; Leidinger, D.; Masson, V.; Nadeem, I.; et al. Thermal conditions during heat waves of a mid-European metropolis under consideration of climate change, urban development scenarios and resilience measures for the mid-21st century. Meteorol. Z. 2021, 30, 9–32. [Google Scholar] [CrossRef]
  35. Szymanowski, M.; Drzeniecka-Osiadacz, A.; Sawiński, T.; Kryza, M. Historical and contemporary studies of Wrocław’s climate-measurements and models. Acta Geogr. Lodz. 2019, 108, 109–126. [Google Scholar] [CrossRef]
  36. Gatto, E.; Buccolieri, R.; Aarrevaara, E.; Ippolito, F.; Emmanuel, R.; Perronace, L.; Santiago, J.L. Impact of Urban Vegetation on Outdoor Thermal Comfort: Comparison between a Mediterranean City (Lecce, Italy) and a Northern European City (Lahti, Finland). Forests 2020, 11, 228. [Google Scholar] [CrossRef] [Green Version]
  37. Berardi, U.; GhaffarianHoseini, A.; GhaffarianHoseini, A. State-of-the-art analysis of the environmental benefits of green roofs. Appl. Energy 2014, 115, 411–428. [Google Scholar] [CrossRef]
  38. Kotak, Y.; Gul, M.; Muneer, T.; Ivanova, S. Investigating the impact of ground albedo on the performance of PV systems. In Proceedings of the CIBSE Technical Symposium, London, UK, 16–17 April 2015. [Google Scholar]
  39. Rodler, A.; Guernouti, S.; Musy, M.; Bouyer, J. Thermal behaviour of a building in its environment: Modelling, experimentation, and comparison. Energy Build. 2018, 168, 19–34. [Google Scholar] [CrossRef]
  40. Hamoodi, M.N.; Corner, R.; Dewan, A. Thermophysical behaviour of LULC surfaces and their effect on the urban thermal environment. J. Spat. Sci. 2019, 64, 111–130. [Google Scholar] [CrossRef]
  41. Chatzidimitriou, A.; Yannas, S. Microclimate design for open spaces: Ranking urban design effects on pedestrian thermal comfort in summer. Sustain. Cities Soc. 2016, 26, 27–47. [Google Scholar] [CrossRef]
  42. Hami, A.; Abdi, B.; Zarehaghi, D.; Bin Maulan, S. Assessing the thermal comfort effects of green spaces: A systematic review of methods, parameters, and plants’ attributes. Sustain. Cities Soc. 2019, 49, 101634. [Google Scholar] [CrossRef]
  43. Vahmani, P.; Ban-Weiss, G. Climatic consequences of adopting drought-tolerant vegetation over Los Angeles as a response to California drought. Geophys. Res. Lett. 2016, 43, 8240–8249. [Google Scholar] [CrossRef]
  44. Kotthaus, S.; Grimmond, C. Energy exchange in a dense urban environment—Part II: Impact of spatial heterogeneity of the surface. Urban Clim. 2014, 10, 281–307. [Google Scholar] [CrossRef] [Green Version]
  45. Nordbo, A.; Järvi, L.; Haapanala, S.; Moilanen, J.; Vesala, T. Intra-City Variation in Urban Morphology and Turbulence Structure in Helsinki, Finland. Boundary-Layer Meteorol. 2012, 146, 469–496. [Google Scholar] [CrossRef]
  46. Thorsson, S.; Lindberg, F.; Eliasson, I.; Holmer, B. Different methods for estimating the mean radiant temperature in an outdoor urban setting. Int. J. Climatol. 2007, 27, 1983–1993. [Google Scholar] [CrossRef]
  47. Zhao, Q.; Sailor, D.J.; Wentz, E.A. Impact of tree locations and arrangements on outdoor microclimates and human thermal comfort in an urban residential environment. Urban For. Urban Green. 2018, 32, 81–91. [Google Scholar] [CrossRef] [Green Version]
  48. Cohen, J. Measuring and improving school climate: A pro-social strategy that recognizes, educates and supports the whole child and the whole school community. In The Handbook of Prosocial Education; Brown, P.M., Corrigian, M.W., Higgins-D’Alessandro, A., Eds.; Rowman & Littlefield: Washington, DC, USA, 2012; p. 41. [Google Scholar]
  49. Salmond, J.A.; Tadaki, M.; Vardoulakis, S.; Arbuthnott, K.; Coutts, A.; Demuzere, M.; Dirks, K.N.; Heaviside, C.; Lim, S.; MaIntyre, H.; et al. Health and climate related ecosystem services provided by street trees in the urban environment. Environ. Health 2016, 15, S36. [Google Scholar] [CrossRef] [Green Version]
  50. Fan, C.; Myint, S.W.; Kaplan, S.; Middel, A.; Zheng, B.; Rahman, A.; Huang, H.-P.; Brazel, A.; Blumberg, D.G. Understanding the Impact of Urbanization on Surface Urban Heat Islands—A Longitudinal Analysis of the Oasis Effect in Subtropical Desert Cities. Remote Sens. 2017, 9, 672. [Google Scholar] [CrossRef] [Green Version]
  51. Middel, A.; Häb, K.; Brazel, A.J.; Martin, C.A.; Guhathakurta, S. Impact of urban form and design on mid-afternoon microclimate in Phoenix Local Climate Zones. Landsc. Urban Plan. 2014, 122, 16–28. [Google Scholar] [CrossRef]
  52. Sun, S.; Xu, X.; Lao, Z.; Liu, W.; Li, Z.; Garcia, E.H.; He, L.; Zhu, J. Evaluating the impact of urban green space and landscape design parameters on thermal comfort in hot summer by numerical simulation. Build. Environ. 2017, 123, 277–288. [Google Scholar] [CrossRef]
  53. De Jong, M.; Joss, S.; Schraven, D.; Zhan, C.; Weijnen, M. Sustainable–smart–resilient–low carbon–eco–knowledge cities; making sense of a multitude of concepts promoting sustainable urbanization. J. Clean. Prod. 2015, 109, 25–38. [Google Scholar] [CrossRef] [Green Version]
  54. Akande, A.; Cabral, P.; Gomes, P.; Casteleyn, S. The Lisbon ranking for smart sustainable cities in Europe. Sustain. Cities Soc. 2019, 44, 475–487. [Google Scholar] [CrossRef]
  55. Guan, X.; Wang, J.; Xiao, F. Sponge city strategy and application of pavement materials in sponge city. J. Clean. Prod. 2021, 303, 127022. [Google Scholar] [CrossRef]
  56. Wolfrum, S. Porous City-From Metaphor to Urban Agenda. In Porous City; Walter de Gruyter GmbH: Berlin, Germany, 2018; pp. 9–14. [Google Scholar]
  57. Atanasova, N.; Castellar, J.A.; Pineda-Martos, R.; Nika, C.E.; Katsou, E.; Istenič, D.; Pucher, B.; Andreucci, M.B.; Langergraber, G. Nature-Based Solutions and Circularity in Cities. Circ. Econ. Sustain. 2021, 1, 1–14. [Google Scholar] [CrossRef]
  58. Alizadeh, B.; Hitchmough, J. A review of urban landscape adaptation to the challenge of climate change. Int. J. Clim. Chang. Strat. Manag. 2019, 11, 178–194. [Google Scholar] [CrossRef]
  59. Dunnett, N.; Hitchmough, J. (Eds.) The Dynamic Landscape: Design, Ecology and Management of Naturalistic Urban Planting; Routledge: Thames, UK, 2004; pp. 1–32. [Google Scholar]
  60. Mahmoud, A.; Alam, T.; Rahman, Y.A.; Sanchez, A.; Guerrero, J.; Jones, K.D. Evaluation of field-scale stormwater bioretention structure flow and pollutant load reductions in a semi-arid coastal climate. Ecol. Eng. 2019, 142, 100007. [Google Scholar] [CrossRef]
  61. Wang, M.; Zhang, D.; Lou, S.; Hou, Q.; Liu, Y.; Cheng, Y.; Qi, J.; Tan, S.K. Assessing Hydrological Effects of Bioretention Cells for Urban Stormwater Runoff in Response to Climatic Changes. Water 2019, 11, 997. [Google Scholar] [CrossRef] [Green Version]
  62. Davis, A. Field Performance of Bioretention: Hydrology Impacts. J. Hydrol. Eng. 2008, 13, 90–95. [Google Scholar] [CrossRef] [Green Version]
  63. Locatelli, L.; Guerrero, M.; Russo, B.; Martínez-Gomariz, E.; Sunyer, D.; Martínez, M. Socio-Economic Assessment of Green Infrastructure for Climate Change Adaptation in the Context of Urban Drainage Planning. Sustainability 2020, 12, 3792. [Google Scholar] [CrossRef]
  64. Chatzidimitriou, A.; Chrissomallidou, N.; Yannas, S. Microclimatic modifications of an urban street in Northern Greece. In Proceedings of the 22nd PLEA Conference, Beirut, Lebanon, 12 November 2005; Volume 2, pp. 689–694. [Google Scholar]
  65. Giridharan, R.; Lau, S.; Ganesan, S.; Givoni, B. Lowering the outdoor temperature in high-rise high-density residential developments of coastal Hong Kong: The vegetation influence. Build. Environ. 2008, 43, 1583–1595. [Google Scholar] [CrossRef]
  66. Skelhorn, C.; Lindley, S.; Levermore, G. The impact of vegetation types on air and surface temperatures in a temperate city: A fine scale assessment in Manchester, UK. Landsc. Urban Plan. 2014, 121, 129–140. [Google Scholar] [CrossRef]
  67. Bochenek, A.; Klemm, K. The Impact of Passive Green Technologies on the Microclimate of Historic Urban Structures: The Case Study of Lodz. Atmosphere 2020, 11, 974. [Google Scholar] [CrossRef]
  68. Belčáková, I.; Świąder, M.; Bartyna-Zielińska, M. The Green Infrastructure in Cities as a Tool for Climate Change Adaptation and Mitigation: Slovakian and Polish Experiences. Atmosphere 2019, 10, 552. [Google Scholar] [CrossRef] [Green Version]
  69. Lewandowska, A.; Szymańska, D. Ecologisation of Polish cities in the light of selected parameters of sustainable development. Sustain. Cities Soc. 2021, 64, 102538. [Google Scholar] [CrossRef]
  70. Podhajska, E.; Halarewicz, A.A.; Zienowicz, M.; Deszcz, R.; Podhajski, B. Structural and parametric aspects of plant barriers as a passive method for improving urban air quality. City Environ. Interact. 2020, 8, 100048. [Google Scholar] [CrossRef]
Figure 1. The current state of the area near the Customer Support Centre.
Atmosphere 12 01464 g001
Figure 2. The diagram of the introduced design interventions and location of control points (1. control point above bioswales area, close to group of trees; 2. control point close to rain garden; 3. control point above grass car parks with carpet planting; 4. control point close to main building; 5. control point above grass car parks with sedum carpet, close to group of trees). Solid lines indicate the position of the cross sections AA’ and BB’.
Atmosphere 12 01464 g002
Figure 3. Introduction of hybrid infrastructure solutions: (a) section AA’ and (b) section BB’.
Atmosphere 12 01464 g003
Figure 4. Spatial distribution of (a) PAT and (b) MRT in baseline scenario (left) and GGB scenario (right).
Atmosphere 12 01464 g004
Table 1. Grey–green–blue infrastructure types used in design concept *.
Infrastructure TypeSurface Type
Grey1. area of the circular traffic—driving road2. area of the circular traffic—parking3. sealed pavement
Green1. green parking—geogrid2. pedestrian walkway—living pavement;
3. area of landscaped greenery—decorative
4. area of landscaped greenery—decorative
Blue1. rain gardens2. absorbent troughs3. bioswale
*—the colors used based on [23].
Table 2. Biotope area factor [28].
Surface TypeFactor
Sealed surface0.0
Partially sealed surfaces0.3
Semi-open surfaces-permeable to water and air0.5
Surfaces with vegetation unconnected to soil below, small substrate thickness0.5
Surfaces with vegetation unconnected to soil below, large substrate thickness0.7
Surfaces with vegetation connected to soil below1.0
Rainwater infiltration per m2 of roof area0.2
Vertical greenery up to 10 m in height0.5
Extensive and intensive green roofs0.7
Table 3. Green space factor [27].
Surface TypeFactor
Vegetation on ground1.0
Vegetation on trellis or facade0.7
Green roofs0.6
Vegetation on beams, soil depth between 200–800 mm0.7
Vegetation on beams, soil depth > 800 mm0.9
Water surfaces1.0
Collection and retention of stormwater0.2
Draining of sealed surfaces to surrounding vegetation0.2
Sealed areas0.0
Paved areas with joints0.2
Areas covered with gravel or sand0.4
Tree, stem girth 16–20 cm (at 20 m2 per tree)20.0
Tree, stem girth 20–30 cm (at 15 m2 per tree)15.0
Tree, stem girth > 30 cm (at 10 m2 per tree)10.0
Single bush higher than 3 m (at 2 m2 per bush)2.0
Table 4. ENVI-met configuration file setting.
DefinitionValue
Location: Wroclaw17°1′59″ E; 51°5′59″ N
Central European Standard TimeReference Longitude 15°
Total Simulation Time24 h
Meteorological factors
min and max value of air temperature17–31 °C
min and max value of relative humidity at 2 m a.g.l50–70%
wind direction90° for E
wind speed measured at 17 m a.g.l1.3 m/s
roughness length at measurement site0.10 m *
Vegetation factors
Trees15 m
Shrubs5 m
Creeping vegetation30 cm
Leaf Area Density1.6 (averaged value)
* according to [36].
Table 5. The results of BAF analysis.
Surface TypeFactorBaseline ScenarioNBS Scenario
Area [m2]Factor × AreaBAFArea [m2]Factor × AreaBAF
Sealed surface0.01894.00.00.151542.00.00.24
Semi-open surfaces-permeable to water and air0.5__352.0176.0
Surfaces with vegetation connected to soil below1.0423.0423.0423.0423.0
Rainwater infiltration per m2 of roof area0.2450.00.0450.090.0
Summary 2767.0423.02767.0689.0
Table 6. The results of GSF analysis.
Surface TypeFactorBaseline ScenarioNBS Scenario
Area [m2]Factor × AreaGFSArea [m2]Factor × AreaGFS
Vegetation on ground1.0423.0423.00.16775.0775.00.40
Collection and retention of stormwater0.2__250.050.0
Draining of sealed surfaces to surrounding vegetation0.2__142.028.0
Sealed areas0.02144.00.01792.00.0
Paved areas with joints0.2200.040.0200.040.0
Tree, stem girth 16–20 cm (at 20 m2 per tree)20.0__7 × u140.0
Tree, stem girth > 30 cm (at 10 m2 per tree)10.0__1 × u10.0
Single bush higher than 3 m (at 20 m2 per tree)2.0__35 × u70.0
u—number of trees or bushes.
Table 7. Area balance by type of grey–green–blue infrastructure.
Infrastructure TypeSurface Type *Summary
1234
Area [m2]Area [m2][%]
GreyBaseline scenario1894.0 450.0 2344.084.7
NBS scenario1542.0 450.0 1992.072.0
GreenBaseline scenario--222.0201.0423.015.3
NBS scenario314.039.5421.5 775.028.0
BlueBaseline scenario--- 0.00.0
NBS scenario142.038.070.0 250.09.0
Total share of Green–Blue AreaBaseline scenario 423.015.3
NBS scenario 775.028.0 (increase of 12.7%)
* the explanations of the numbers are placed in Table 1.
Table 8. Compilation of areas with different management techniques, reliable runoff of the rainwater Qm [dm3/s] before and after the design concept, and retention volume ∆R [%].
Land CoverBaseline ScenarioNBS Scenario
A [m2]A [%]A [m2]A [%]
Asphalt/concrete surface1894.068.31542.055.7
Area under the buildings450.016.3450.016.3
Pedestrian passage-living pavement--39.51.4
Lattice paving blocks--247.08.9
Green area222.08.0171.56.2
Rain garden--142.05.1
Infiltration basins--38.01.4
Bioswale--70.02.5
Stonecrop carpet--67.02.4
Unarranged green areas201.07.4--
Total area2767.01002767.0100
U [%]84.772.0
Ψs [-]0.860.77
Qm [dm3/s]41.8037.80
Δ R [%]9.5
Notes: A—area [m2, %]; U—share of impermeable area [%]; Ψs—averaged runoff coefficient [-].
Table 9. The main thermal characteristics of control points (S0 indicates baseline scenario, SGGB concerns situation after introduction of green–blue infrastructure).
Control PointScenarioMRT [°C]PAT [°C]Rising Rate of T after Sunrise (ATC) [°C/h]Cooling Rate during Night (ATC) [°C/h]
avgmaxminavgmaxminavgmaxminavgmaxmin
1036.969.89.524.030.217.71.21.41.1−0.9−0.8−1.1
GGB27.964.613.623.829.117.91.11.31.0−0.8−0.6−0.9
2036.469.610.024.029.418.11.11.31.0−0.8−0.7−0.8
GGB33.865.811.323.929.218.01.11.30.9−0.8−0.7−0.8
3036.369.89.724.029.617.91.21.31.1−0.8−0.8−0.9
GGB31.866.511.723.929.318.01.11.31.0−0.8−0.7−0.9
4035.169.59.924.029.617.91.21.41.0−0.8−0.7−0.9
GGB33.766.310.824.029.417.91.21.41.0−0.8−0.7−0.9
5034.669.710.324.130.217.61.31.31.2−0.9−0.8−0.9
GGB33.264.313.424.129.917.81.21.31.1−0.9−0.7−0.9
1Absolute differences (GGB-0)9.033.9−4.10.21.1−0.20.10.20−0.10−0.4
22.524.6−1.30.10.3−0.100.1−0.100−0.1
34.530.9−20.10.3−0.100.1000−0.1
41.48.1−6.30.10.2−0.100.1−0.100−0.1
51.425.5−3.100.3−0.100.1000−0.1
MRT [°C]—mean radiant temperature, PAT [°C]—potential air temperature at reference (and model default) pressure; for the 3D model, it can be treated like the absolute air temperature, ATC [°C/h]—hourly change in air temperature.
Publisher’s Note: MDPI stays neutral with regard to jurisdictional claims in published maps and institutional affiliations.

