Abstract
Climate change and air pollution pose multiple health threats to humans through complex and interacting pathways, whereas urban vegetation can improve air quality by influencing pollutant deposition and dispersion. This study estimated the amount of PM2.5 removal by the urban forest in the city of Shanghai by using remote sensing data of vegetation and a model approach. We also identified its potential contribution of urban forest presence in relation to human population and particulate matter concentration. Results show that the urban forest in Shanghai reached 46,161 ha in 2017, and could capture 874 t of PM2.5 with an average of 18.94 kg/ha. There are significant spatial heterogeneities in the role of different forest communities and administrative districts in removing PM2.5. Although PM2.5 removal was relatively harmonized with the human population distribution in terms of space, approximately 57.41% of the urban forest presented low coupling between removal capacity and PM2.5 concentration. Therefore, we propose to plant more trees with high removal capacity of PM2.5 in the western areas of Shanghai, and increase vertical planting in bridge pillars and building walls to compensate the insufficient amount of urban forest in the center area.
1. Introduction
The world’s urban population has rapidly increased from 751 million in 1950 to 4.2 billion in 2018 [1]. In recent years, climate change and air pollution have posed multiple health threats to humans through complex and interacting pathways [2], and urban air pollution has become a global environmental issue [3]. Particulate matter (PM) refers to the solid and liquid particles in the atmosphere; it is usually a key air pollutant that increases the occurrence probability of air pollution and haze events [4]. Air pollution adversely causes an increase in respiratory and cardiovascular diseases [5,6], excess mortality, and a decrease in life expectancy [7,8]. It is projected that climate change will continue to affect air quality, including ozone and fine particles [2].
Urban vegetation has been highlighted to offer a mitigation potential against atmospheric particulate pollution [9]. At the single tree scale, tree leaves can capture atmospheric PM through interception on the leaf surface and the absorption of heavy metal pollutants via leaf stomata [10]. The majority of studies reveal that complex leaf characteristics can determine the extent of PM removal, such as hair, trichomes, wax, stomata, shape, and others [11,12,13,14]. Other than the characteristics of a tree, meteorological factors (e.g., rainfall, wind) and underlying types (e.g., street, wetland) influence the transport of atmospheric particles at the stand scale, through pollutant deposition and dispersion [15]. A variety of PM dry deposition models on different vegetation underlying surfaces have been built [16,17,18], but uncertainties exist with every model [10]. For example, the hypothesis of wind speed directly affecting friction velocity is in all models, but several studies did not find a significant relationship between friction velocity and particle dry deposition velocity [16], because the relationship between them is not obvious when wind velocity is slow. In addition, particle dry deposition velocity is not only dependent on meteorological factors, but also on the species, leaf area index, canopy height, and other vegetation characteristics [10]. The CITY green model and the i-Tree model, which were developed by USDA Forest Service, can integrate meteorological, atmospheric pollutant, and urban forest structure variables into the simulation processes of dust removal, and have been used to estimate the total amount of PM removal by urban forests in several cities in the USA, Canada, Italy, Australia, and China [19,20,21,22,23]. The development of PM removal models allows for the quantification of the contribution of trees concerning air quality improvement at a city scale. However, forest presence and PM2.5 concentration are often heterogeneously distributed in an urban environment [24]. Whether the existing urban forests in different districts is enough or not to cope with the current concentration of PM2.5 is of great policy implications in regional afforestation layout and air pollution control [25,26].
Shanghai is located in the eastern Yangtze River Delta region and has the highest urbanization in China. The atmospheric particulate matter in Shanghai has continually escalated in recent years because of the rapid increase in motor vehicles, the expansion of urban areas, and the illegal burning of biomass [27,28]. Shanghai has a relatively high annual PM1 concentration, which accounts for 69% of PM2.5 [4]; thus, the city often suffers severe air pollution (characterized as PM and ozone) and low-visibility events [29]. Unfortunately, the economic cost of asthma patient visits that were attributed to ambient air pollutants (e.g., SO2, CO, O3, PM10, NO2, and PM2.5) in Shanghai was approximately 197 million USD in losses per year [30]. In recent years, the Shanghai government has exerted a considerable effort to reduce air pollution, such as the key industries in the Yangtze River Delta region (e.g., power plant, iron and steel, cement, and flat glass industries) being required to either initiate control measures or retrofit existing desulfurization, denitration, and dust removal facilities [31]. Although the PM2.5 concentration has presented a declining trend since 2013 [32], the role of urban forests for PM2.5 removal has still not been paid sufficient attention in urban planning and management, because urban trees are often selected for their aesthetic values and adaptability to the urban environment. This study will identify the spatial distribution of PM concentration, human population, and tree cover, and highlight how air purification can be improved through more effective urban forest planning.
This work aims to quantify the potential contribution of urban forests to PM2.5 removal in Shanghai, and estimate the spatial differences of PM2.5 removal role by urban forest in relation to human population and PM concentration. In this study, we will utilize the core calculation formula of the i-Tree model to quantify the contribution of trees to air quality improvement. Additionally, we assume that the atmospheric pollutant should be completely removed by urban forests, so the harmony analysis of supply and demand of the PM removal role will be proposed to highlight how the highly urbanized areas can adjust their tree cover to improve air quality. The remainder of this work is organized as follows. Section 2 provides a background of the study area and the assessment methods. Section 3 presents the results. Section 4 and Section 5 provide the discussion and conclusions, respectively.
2. Material and Methods
2.1. Study Area
Shanghai is located on the eastern edge of the Yangtze River Delta, with the East China Sea to the east, the Hangzhou Bay to the south, the provinces of Jiangsu and Zhejiang to the west, and the opening of the Yangtze River to the north [33]. The city has distinct seasons, moderate subtropical climate, and abundant rainfall. Moreover, the city is characterized by the northwest trade winds over Mainland China and the southwest summer monsoon trade winds from the Western Pacific Ocean. In 2017, the administrative area of Shanghai was 6340.50 km2, and its total population reached 24.18 million. Shanghai has a total of 16 districts, including 214 streets/towns. Nearly all 15 districts form the principal space for the Metropolitan region, except for Chongming District, which consists of Chongming, Changxing, and Hengsha islands [34]. This metropolitan region exhibits high-density urban population and an artificial ecological landscape. Thus, this region, which covers 5792 km2, has been adopted as the study area (Figure 1).
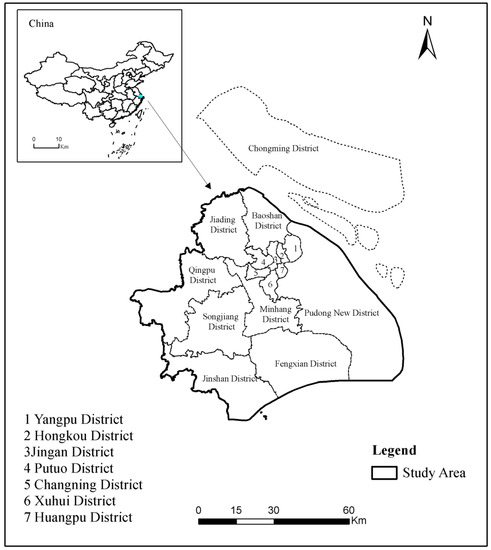
Figure 1.
Regional location and district compositions of the study area.
The 2017 Air Quality Index (AQI) report manifested that the average PM2.5 concentration in Shanghai reached 39 µg/m3 [32], exceeding by 4 µg/m3 that of the secondary environmental air quality standards in China. The PM2.5 was the major pollutant for 23 days in the whole year. The monthly dust-fall amount, including regional and road dust in urban areas, reached 134 kg/ha in 2017. According to the statistical data from the Shanghai Environmental Protection Bureau [32], the monthly changes of PM2.5 concentration, wind speed, and precipitation in Shanghai are showed in Figure 2.
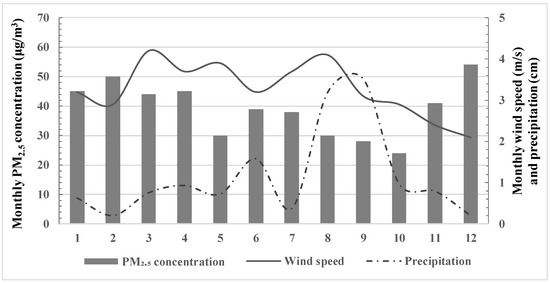
Figure 2.
Monthly PM2.5 concentration, wind speed, and precipitation in Shanghai.
2.2. Urban Forest
The local vegetation in Shanghai is dominated by evergreen forests, which is mainly composed of broad-leaved trees and mixed forests. However, rapid urbanization in recent years has transformed the landscape patterns in the city of Shanghai, and the mostly native forests have been replaced with more than 1000 tree species from other regions in China or abroad [35]. The area of urban green spaces in Shanghai rapidly increased from 3570 ha in 1990 to 136,327 ha in 2017, and the greening coverage rate of the urban built-up area reached 39.1%.
In order to acquire the spatial distribution of urban forest in Shanghai, we produced the digital forest map from 38 images with 2-m resolution in 2017 (Figure 3), which derived from the Satellite Environment Centre, Ministry of Environmental Protection in China. The supervised classification method with maximum likelihood clustering and digital elevation model data is used as a hybrid method to classify images. Pure pixels are selected as the training sample instead of mixed pixels. Mixed classes, such as forest and grass, are separated by manual visual interpretation. The urban forest categories are determined as broad-leaved, conifer, mixed, and shrubbery, in accordance with the Contents and Index of Fundamental Geographical Conditions Monitoring (GQJC03-2017). The spatial mapping of forest resources from the Shanghai Forestry Bureau has been performed to assist the image classification and validate the final results [36]. The overall classification accuracy is over 82%, and the simulation requirements are satisfied.
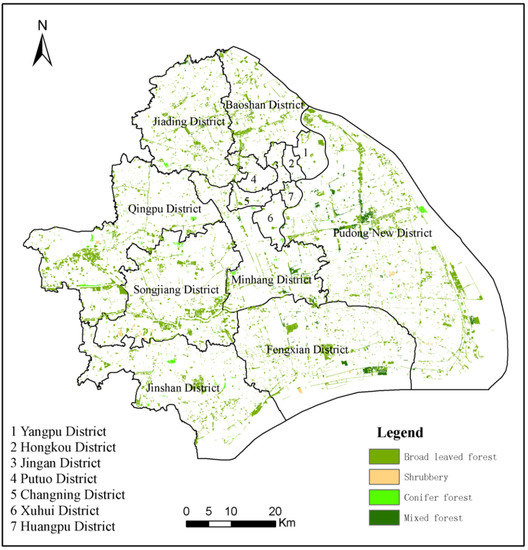
Figure 3.
Spatial distribution of forest communities in urban areas in Shanghai.
This study focuses on the urban forest located in the Metropolitan region, and the forest communities in Chongming District are excluded. We concluded that the urban forest areas in Shanghai reached 46,161 ha in 2017, and are approximately 83% covered by the broad-leaved forest. The coniferous and mixed forests cover 3023 ha and 4911 ha, respectively. The smallest area of urban forest is shrubbery, and it only occupies 26 ha. Apparently, the urban forest in Shanghai concentrates on the suburban districts, and the broad-leaved forest predominates in the central districts.
2.3. PM2.5 Removal by Urban Forest
Urban forest can remove air pollutants by intercepting PM on plant surfaces and absorbing gaseous pollutants through the leaf stomata [23]. The canopy area and structure (i.e., tree species), concentration of particles in the airstream, particle size distribution, and wind speed are important factors in determining particle uptake through vegetation [37]. Nowak et al. [19] constructed an empirical model to estimate the effect of PM2.5 removal via urban trees in 10 U.S. cities.
In this work, we first estimate the total leaf area index (LAI) per unit of tree cover by means of the LAI estimation model, which has been set up by Lin et al. [38] for Shanghai urban forests. After geometric correction and radiometric calibration, the modified soil adjust vegetation index (MSAVI) is calculated by using SPOT5 images (Equation (1)). Thus, the monthly LAI of each pixel can be obtained from the urban forest LAI and MSAVI model in Shanghai (Equation (2); m2/m2). The deposition velocities of PM2.5 to trees vary with wind speed. Zhang et al. [39] measured the PM2.5 dry deposition velocities of 15 commonly planted greening trees in Shanghai, and concluded that the velocities ranged from 0.01–0.12 cm/s in 2015. Thus, we assume the median deposition velocities (0.07 cm/s) to be the standard value for the average wind speed of 3 m/s [40]. According to the positive correlation of dry deposition velocity of the total suspended particles with wind speed [41], we can calculate the varied deposition velocities under different wind speeds (Equation (3); cm/s), on the basis of the results of Nowak et al. [19]. The resuspension rates of PM2.5 from trees also vary with wind speed. We adopt the average percent resuspension, which is assumed and detailed in Nowak et al. [19]. A total of 11 local meteorological stations from Shanghai Meteorological Service are used to obtain hourly wind speed and precipitation data for calculating pollution removal [42]. The daily PM2.5 concentration has been obtained from the Shanghai Environmental Protection Bureau and used to represent the hourly concentration values throughout the day. Previous investigations have concluded that the accumulated PM2.5 could be washed off to the ground surface when the magnitude of precipitation event exceeded 15 mm during precipitation events [43], and the maximum retention time of PM2.5 on a leaf during no-precipitation periods was 21 days [44,45,46]. Therefore, the amount of removed PM2.5 by urban forest can be estimated using the following formula:
where MASAVI is the modified soil adjust index, and are the apparent reflectance in the near-infrared band and red band, respectively; RAT represents the total amount of PM2.5 removal by urban forest (t), RAper is the amount of removed PM2.5 per unit of leaf area (μg/m2), Vd is the deposition velocity of PM2.5 by wind speed (cm/h), r is the percent resuspension by wind speed per unit leaf area (%), C represents the daily PM2.5 concentration (μg/m3), LAI is the leaf area index per unit of vegetation cover (m2/m2), and T represents the deposition time of PM2.5 between two adjacent rainfall events (h), and A is the area of urban forest (ha).
2.4. Harmony Analysis on the Supply and Demand of PM2.5 Removal
Influenced by terrain, vegetation, and meteorological factors, the PM2.5 concentrations over a continuous geographical space often show evident spatial differences. Ji et al. [24] found that the northern and western mountainous areas in Beijing had an apparently lower PM2.5 concentration than the eastern and southern areas. Thus, the vegetation with powerful purification ability should be planted in the areas with high PM2.5 concentration. The cities are characterized by spatially heterogeneous population distribution and movement [47]. The densely populated areas tend to need a high removal role of PM2.5 by urban forests.
We adopt a coupling degree of air purification supply and demand in space to estimate the space coordination of urban forests for PM2.5 removal in Shanghai. The supply space can be determined by the PM2.5 removal ability of urban forests, and the demand space depends on the environment concentration or human population density. We firstly interpolate the spatial distribution of PM2.5 concentration by using the geographically weighted regression-kriging model [48] and the daily PM2.5 concentration from nine air quality stations in Shanghai. Then, the spatial maps of the PM2.5 concentration and removal capacity of urban forest are graded according to the Table 1 and overlaid by means of the spatial analysis tool in ArcGIS 10.0. We also interpolate the population in each block based on the sixth population census data of Shanghai to produce the spatial map of human population [49]. The population density can be reclassified into five grades according to the rules in Table 1, and the spatial maps of the human population and removal capacity of urban forests are also overlaid. Finally, we compare the grade values between removal capacity and PM2.5 concentration or human population to determine the coupling degree (HL) of each grid cell (10 m × 10 m). The calculation formula can be expressed as follows:
where HL is the coupling degree between the removal capacity and environment concentration or human population, Si represents the score of removal capacity by urban forest, Di represents the scores of PM2.5 concentration or human population density, and i is the raster of urban forests.

Table 1.
Grades of human population density (PD), PM2.5 concentration (EC), and removal capacity (RA) in Shanghai.
3. Results
3.1. Amount of PM2.5 Removal by Urban Forest
The PM2.5 concentration in Shanghai from 2012 to 2016 displayed a low value in the summer and a high one in the winter, and presented a lowest value of 16–36 µg/m3 in August [50]. According to the local city weather data, there were 125 rainy days with greater than 15 mm in 2017, and the non-precipitation periods that exceeded the maximum retention time threshold (21 days) were 28 days, so we concluded the effective dust retention periods of urban forests reached 212 days. Our estimated results show that the daily amount of PM2.5 removal ranged from 0 to 11.57 t, and urban forests performed a larger amount of pollutant removal in summer and autumn (Figure 4). The urban forests can intercept approximately 6.81 t/day of PM2.5 in summer. The average values of PM2.5 removed by Shanghai’s forests in spring and autumn reached 2.92 and 2.77 t/day, respectively. The removal capacity of urban forests decreased to 1.95 t/day in winter because of the fall of leaves. We also observed that the removal amounts of PM2.5 possibly dropped to 0 because of the precipitation wash-off effect on continuous rainy days from April to December and the suspension of dust retention when vegetation reached its maximum retention capacity from February to April. Thus, the urban forests in Shanghai can remove 874.09 t PM2.5, and their average retention capacity reached 18.94 kg/ha.
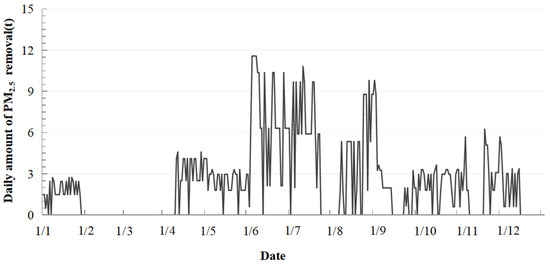
Figure 4.
Daily amount of PM2.5 removal by the urban forests in 2017.
The role of PM2.5 removal greatly varies among the urban forest communities in Shanghai. The broad-leaved forest covered 38,200 ha and could remove approximately 728 t of PM2.5 in 2017. Specifically, such a forest provides approximately 83% of the estimated removal of PM2.5 because of Shanghai’s forest. The amount of PM2.5 removed annually by mixed and coniferous forests are 91 t and 55 t, respectively. The shrubbery only reduces 0.18 t of PM2.5 (Figure 5). However, the differences of removal capacity of PM2.5 among various forest communities are small except for the shrubbery, which can be attributed to the similarity of LAI and coverage rate of trees in Shanghai. The broad-leaved forest exhibited the strongest retention capacity of 19.06 kg/ha, followed by the mixed and coniferous forests with 18.51 kg/ha and 18.20 kg/ha, respectively. Some studies have confirmed that the high proportion of artificial evergreen broad-leaved forests in Shanghai could prolong the duration time of PM on the tree leaves [51], and increase the average value of PM2.5 removal capacity for the broad-leaved forest. The lowest retention capacity of 6.85 kg/ha is presented by the shrubbery in Shanghai.
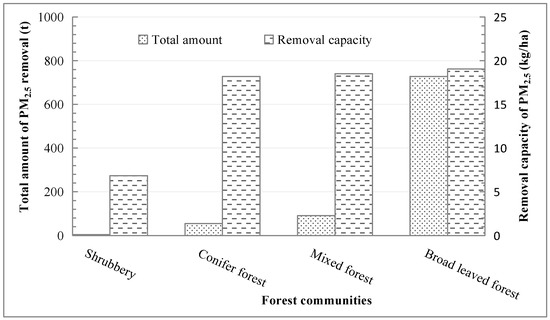
Figure 5.
Amount of PM2.5 removed by the urban forests in the city of Shanghai.
3.2. Regional Difference of PM2.5 Removal
From the digital forest map, we can observe that the urban forest in Shanghai is predominated by broad-leaved forest and is concentrated in the suburban districts. The large areas of urban forest patches are distributed in Pudong New District, Qingpu District, Fengxian District, and Songjiang District [36]; the mixed forest is distributed in the eastern region of Shanghai (Figure 3). Accordingly, the role of PM2.5 removal across different districts is greatly varied. The urban forest in Pudong New District can capture approximately 196 t of PM2.5 and contribute a large proportion of PM2.5 removal in Shanghai (23.98%). The urban forests in the districts of Qingpu and Songjiang removed approximately 150 t and 124 t PM2.5 in 2017. The amounts of PM2.5 removed by urban forests in the districts of Fengxian, Jinshan, Jiading, Minhang, and Baoshan districts range from 46 t to 95 t. The urban forests in central districts, including Huangpu, Hongkou, Jing’an, Xuhui, Putuo, Yangpu, and Changning, only generate a small portion of PM2.5 removal. The combined proportion of total amount of removed PM2.5 reaches 2.50%.
The urban forest in Qingpu District, however, shows the highest capacity in PM2.5 removal with 23.33 kg/ha, followed by the forests in the districts of Changning, Songjiang, Jinshan, and Jiading. The removal capacity of PM2.5 ranges from 18 kg/ha to 21 kg/ha. The average amount of PM2.5 removal by urban forests in the districts of Huangpu, Hongkou, Jing’an, Yangpu, and Xuhui is is lower than 15 kg/ha. The urban forest in Hongkou District generates a low capacity of PM2.5 removal with 10.39 kg/ha (Figure 6). The urban forest in Shanghai is widely distributed in suburban areas rather than core districts, and the air has been more heavily polluted in western regions than that in eastern areas and coastal areas [52], so the spatial heterogeneities of PM concentration and urban forest communities has resulted in differences of PM2.5 removal capacity in various districts.
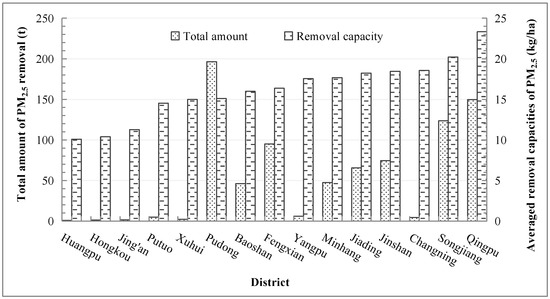
Figure 6.
Estimated amount of PM2.5 removal due to urban forests of 15 districts in Shanghai.
3.3. Coupling Degree between Removal Capacity and PM2.5 Concentration
The environment concentration of PM2.5 showed higher values in the western areas than in the eastern areas in 2017 [32]. The results show that approximately 57.41% of the urban forest presents low coupling with PM2.5 concentration and is mainly distributed in the districts of Qingpu, Songjiang, and Jinshan. Only 22.37% of the urban forests, which is mainly planted in the districts of Jiading, Minhang, and Fengxian, show high coupling between the removal capacities and the PM2.5 concentration. The remaining 20.23% of urban forests generate common coupling in PM2.5 removal capacity with environmental concentration, and they concentrate in the districts of Pudong New District, Baoshan, and the eastern part of Fengxian (Figure 7). The spatial distribution of atmospheric PM is sensitive to geographic location and proximity to neighboring regions, and the average values of observed PM2.5 in Shanghai indicated that the highest concentrations occurred in western areas and the lowest concentrations were located in coastal areas [52]. However, the capacity of PM2.5 removal by urban forests in the western areas are relatively lower than in eastern areas and coastal areas of Shanghai, so the spatial harmony between the PM2.5 removal role of urban forests and the environmental concentration is low, and the spatial patterns of urban forests in Shanghai should be optimized according to the air purification demand.
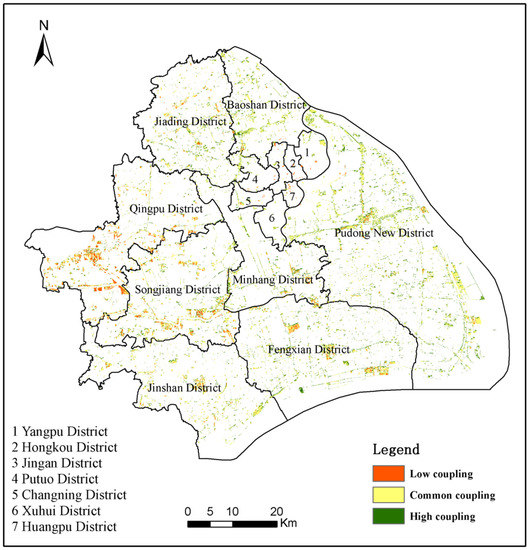
Figure 7.
Coupling degrees between removal capacity of urban forests and PM2.5 concentration.
3.4. Coupling Degree between PM2.5 Removal and Human Population
Shanghai is still a statistically monocentric city, and its human population presents a high gradient from the northeast to the southwest. The results show that only 7.38% of the urban forests in Shanghai present low coupling in PM2.5 removal with human population distribution. These forests are concentrated in the central zones and the northwest of Pudong New District and the north of Minhang District. Approximately 28.75% of the urban forest highly couple with human population, and are mainly distributed in the southern part of the districts of Jiading, Pudong New District, Fengxian, and Minhang. The urban forests in the districts of Qingpu, Jinshan, Songjiang, and east of Pudong New District show common coupling in PM2.5 removal capacity with human population distribution. The total areas occupy approximately 63.87% of the urban forest in Shanghai (Figure 8). In recent decades, a low or even negative human population growth has occurred in the core districts (Huangpu, Jingan, and Hongkou). The urban fringe (Xuhui, Yangpu, Putuo, and Changning) had a moderate rate of human population growth, and the suburban areas (Jiading, Qingpu, Songjiang, Fengxian, Jinshan, and Chongming) presented the fastest growth in human population [53], so the demand on air quality improvement has sharply increased in the southwest suburban areas. Although the PM2.5 removal role by urban forests relatively harmonizes in space with the human population distribution in Shanghai, the inconsistency between demand and supply of PM2.5 removal should be paid more attention.
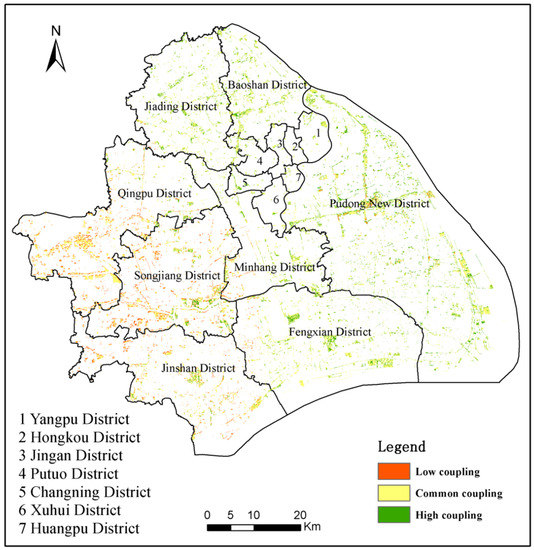
Figure 8.
Coupling degrees between PM2.5 removal capacity and human population in Shanghai.
4. Discussion
Vegetation can serve as an effective measure to mitigate urban air quality problems, and this paper conducted a quantification of the potential contribution of urban forests to PM2.5 removal in Shanghai through dry deposition model. The results indicated that the urban forests in Shanghai could have removed approximately 874 tons of PM2.5 in 2017, and the capacities of PM2.5 removal significantly varied with forest communities, districts, and seasons. Xiao et al. [54] concluded that the amount of PM2.5 removal by Beijing’s forest land ranged from 22.71 kg/ha to 33.36 kg/ha. By contrast, this work modeled the PM2.5 removal capability by forests at an average of 18.94 kg/ha, mainly because the PM2.5 concentration (89.5 µg/m3) in Beijing was significantly higher than that in Shanghai (39 µg/m3). Liu and Yu [55] estimated the PM2.5 detention capacity of green spaces in the Haidian District of Beijing to be 11 kg/ha, which is less than our estimated result. The main reason is that the green space in Haidian is composed of forest land, grassland and farmland, which averages the capacity of PM2.5 removal by urban forests. In addition, the capacity of PM2.5 removal in Chinese cities often presents higher value than that in other districts, such as the removal capacity of urban trees on PM2.5 in US cities ranging from 1.30 kg/ha to 1.60 kg/ha [19], and Selmi et al. [56] concluded that the public trees of Strasbourg approximately reduced 2.30 kg/ha for PM2.5. This phenomenon was due to the concentration difference of the atmospheric PM. For example, the daily PM2.5 concentration in Shanghai varied from 49 µg/m3 to 55 µg/m3 during 2012–2016 [50], whereas the highest value of PM2.5 concentration among the 10 U.S. cities only reached 12.6 µg/m3 [19]. Other than the differences of atmospheric, meteorological, and forest structure variables, we added leaf-wash threshold and saturation time to identify the effective dust retention periods in the methodology used in this study, which differed from that implemented by Nowak et al. [19].
The urbanization level in Shanghai dramatically increased to 90% in 2015, and the population density gradually decreased from the central city to the suburbs [33]. In the meantime, the distribution of PM2.5 concentration in Shanghai is more sensitive to geographic location and proximity to neighboring regions [52,57]. This work built a space coupling model to investigate the potential contribution of urban forest presence to PM2.5 removal in relation to human population and particulate matter concentration. The results indicate that approximately 63.87% of the urban forest could meet the air quality improvement demand of human population in the space, whereas only 22.37% were in agreement with the spatial distribution of PM2.5 concentration, so the PM2.5 removal role of urban forests harmonizes more with the human population than its environment concentration in Shanghai. However, the coupling degree between the PM2.5 removal role of urban forest and environment concentration in the western areas is low, and the rapid increase of resident population in southwest areas further aggravates the demand of air quality improvement. Although vegetation can be used as an ecosystem service for air quality improvements [9,58], the design and choice of urban vegetation is crucial [15,25]. An investigation on particulates deposited on plant leaves of typical tree species in two industrial regions in Shanghai revealed that Sabina chinensis and Platanus acerifolia presented exclusive adsorption characteristics to some specific chemical compositions [59]. The PM2.5 concentrations in western areas of Shanghai often are influenced by the centralized distribution of industrial areas, so more cypress should be planted in the surrounding areas of metal smelting industry and more platanus in the chemical industry area. In addition, the urban forests in central districts present a low capacity for PM2.5 removal, and only contribute a small portion of PM2.5 removal due to the severe shortage of urban green spaces. Although abundant viaducts and buildings are distributed in the central districts of Shanghai, the climbing plants on bridge pillars, especially Ficus pumila Linn, Hedera nepalensis var. Sinensis (Tobl.) Rehd, Parthenocissus quinquefoliai (L.) Planch, and Parthenocissus tricuspidata, have obvious capture ability for atmospheric PM [60], so a large increase in three-dimensional greening will improve the PM2.5 removal role in the centre area of Shanghai. We also noticed that some tree species can produce particles (e.g., pollen) to limit pollutant dispersion and increase the local pollutant concentrations [61,62], so planting more trees is not the only way to remove atmospheric PM. The selection of tree species, the arrangement of forest communities, and the design of landscape patterns are also crucial for the improvement of air quality. Additionally, this study is focused on PM removal by urban forests; other ecosystem services performed by trees must be considered in future planning.
Nevertheless, several limitations of this research should be stated. First, this study only estimated the PM2.5 removal role of urban forests; however, farmland, grassland, and wetland in the urban environment also capture the atmospheric fine particles [63]. Second, we greatly focused on the PM with a diameter <2.5 μm. The particulate air pollutants are considerably sophisticated for different components and size classes. Zhou et al. [4] identified that the annual mean PM1 concentration over Shanghai accounted for 69% of fine particles of PM2.5, and varied with the scales of days, weeks, months, and years. In addition to PM2.5, trees also remove other air pollutants, such as ozone, sulfur dioxide, and nitrogen dioxide [64]. The deposition velocity of PM2.5 and percent resuspension are easily influenced by various environmental factors, such as wind speed, air humidity, and leaf characteristics. We neglected the capacity difference of PM2.5 removal because of tree species [65]; however, the different tree species in reality had an exclusive character of adsorption to some specific chemical compositions [53]. Although we revised some parameters by means of observation results in Shanghai from Zhang et al. [39] and Zhao [66], some errors may be observed in the estimated amount of PM2.5 removal. Therefore, further work is still needed to confirm the PM2.5 removal role by using a larger sample size and in-depth studies.
5. Conclusions
Our results estimate that urban forests in Shanghai reached 46,161 ha in 2017 and removed 874 t of PM2.5 with an average of 18.94 kg/ha. Such values varied with season, forest communities, and districts. The broad-leaved forest provides approximately 83% of the PM2.5 removal role and possesses a strong retention capacity of 19.06 kg/ha. The urban forest in Pudong New District contributes a large proportion of the PM2.5 removal. By contrast, the urban forest in Qingpu District shows a high capacity in PM2.5 removal with 23.33 kg/ha. Although the PM2.5 removal role of urban forests relatively harmonizes in space with the human population distribution, the spatial coordination of the removal role by urban forests and PM2.5 concentration is poor. Approximately 57.41% of the urban forests cannot meet the demand of PM2.5 removal. Thus, the pattern optimization of urban forests in Shanghai should be implemented. More trees with high absorption capacity for PM2.5 should be planted in the western areas of Shanghai, and vertical planting in bridge pillars and building walls will be encouraged to increase in the central district. This study can provide scientific reference for the control of air pollution and urban forest design in Shanghai.
Author Contributions
Conceptualization, B.Z.; methodology, B.Z., and X.S.; validation, B.Z., and X.S.; investigation, Z.X and X.S.; resources, J.G..; data curation, X.S. and Z.X.; writing—original draft preparation, B.Z. and X.S.; writing—review and editing, B.Z. and Z.X.; visualization, B.Z., X.S and Z.X.; project administration, J.G.; funding acquisition, J.G. All authors have read and agreed to the published version of the manuscript.
Funding
This research was funded by the Shanghai Municipal Bureau of Ecology and Environment for the research project on the monitoring and assessment of urban ecological functions in Shanghai, grand number Hu Huan Ke <2018> No.2.
Institutional Review Board Statement
Not applicable.
Informed Consent Statement
Not applicable.
Data Availability Statement
The data presented in this study are available on request from the corresponding author. The data are not publicly available due to database access restrictions.
Acknowledgments
This research was funded by the Shanghai Municipal Bureau of Ecology and Environment for the research project on the monitoring and assessment of urban ecological functions in Shanghai.
Conflicts of Interest
The authors declare no conflict of interest.
References
- United Nations Departments of Economic and Social Affairs. 2018 Revision of World Urbanization Prospects; United Nations: New York, NY, USA, 2018. [Google Scholar]
- Xiao, X.; Gao, M. Overview of climate change, air pollution, and human health. In Air Pollution, Climate, and Health: An Integrated Perspective on Their Interactions; Gao, M., Wang, Z.F., Carmichael, G., Eds.; Elsevier: Amsterdam, The Netherlands, 2021; pp. 3–12. [Google Scholar]
- Alimissis, A.; Philippopoulos, K.; Tzanis, C.; Deligiorgi, D. Spatial estimation of urban air pollution with the use of artificial neural network models. Atmos. Environ. 2018, 191, 205–213. [Google Scholar] [CrossRef]
- Zhou, G.; Xu, J.; Gao, W.; Gu, Y.; Mao, Z.; Cui, L. Characteristics of PM1 over Shanghai, relationships with pre-cursors and meteorological variables and impacts on visibility. Atmos. Environ. 2018, 184, 224–232. [Google Scholar] [CrossRef]
- Chiang, T.; Yuan, T.; Shie, R.; Chen, C.; Chan, C. Increased incidence of allergic rhinitis, bronchitis and asthma, in children living near a petrochemical complex with SO2 pollution. Environ. Int. 2016, 96, 1–7. [Google Scholar] [CrossRef]
- Li, T.; Lin, G. Examining the role of location-specific associations between ambient air pollutants and adult asthma in the United States. Health Place 2014, 25, 26–33. [Google Scholar] [CrossRef]
- Geng, F.; Hua, J.; Mu, Z.; Peng, L.; Xu, X.; Chen, R.; Kan, H. Differentiating the associations of black carbon and fine particle with daily mortality in a Chinese city. Environ. Res. 2013, 120, 27–32. [Google Scholar] [CrossRef]
- Shang, Y.; Sun, Z.; Cao, J.; Wang, X.; Zhong, L.; Bi, X.; Li, H.; Liu, W.; Zhu, T.; Huang, W. Systematic review of Chinese studies of short-term exposure to air pollution and daily mortality. Environ. Int. 2013, 54, 100–111. [Google Scholar] [CrossRef] [PubMed]
- Xu, C.; Dong, L.; Yu, C.; Zhang, Y.; Cheng, B. Can forest city construction affect urban air quality? The evidence from the Beijing-Tianjin-Hebei urban agglomeration of China. J. Clean. Prod. 2020, 264, 121607. [Google Scholar] [CrossRef]
- Han, D.; Shen, H.; Duan, W.; Chen, L. A review on particulate matter removal capacity by urban forests at different scales. Urban For. Urban Green. 2019, 48, 126565. [Google Scholar] [CrossRef]
- Gajbhiye, T.; Pandey, S.K.; Kim, K.H.; Szulejko, J.; Prasad, S. Airborne foliar transfer of PM bound heavy metals in Cassia siamea: A less common route of heavy metal accumulation. Sci. Total Environ. 2016, 573, 123–130. [Google Scholar] [CrossRef] [PubMed]
- Leonard, R.J.; McArthur, C.; Hochuli, D.F. Particulate matter deposition on roadside plants and the importance of leaf trait combinations. Urban For. Urban Green. 2016, 20, 249–253. [Google Scholar] [CrossRef]
- Perini, K.; Ottelé, M.; Giulini, S.; Magliocco, A.; Roccotiello, E. Quantification of fine dust deposition on different plant species in a vertical greening system. Ecol. Eng. 2017, 100, 268–276. [Google Scholar] [CrossRef]
- Popek, R.; Łukowski, A.; Karolewski, P. Particulate matter accumulation-further differences between native Prunus padus and non-native P. serotina. Dendrobiology 2017, 78, 85–95. [Google Scholar] [CrossRef] [Green Version]
- Janhäll, S. Review on urban vegetation and particle air pollution—Deposition and dispersion. Atmos. Environ. 2015, 105, 130–137. [Google Scholar] [CrossRef]
- Liu, J.; Zhu, L.; Wang, H.; Yang, Y.; Liu, J.; Qiu, D.; Ma, W.; Zhang, Z.; Liu, J. Dry deposition of particulate matter at an urban forest, wetland and lake surface in Beijing. Atmos. Environ. 2016, 125, 178–187. [Google Scholar] [CrossRef]
- Zhang, Z.; Liu, J.; Wu, Y.; Yan, G.; Zhu, L.; Yu, X. Multi-scale comparison of the fifine particle removal capacity of urban forests and wetlands. Sci. Rep. 2017, 7, 46214. [Google Scholar] [CrossRef] [PubMed] [Green Version]
- Giardina, M.; Buffffa, P. A new approach for modeling dry deposition velocity of particles. Atmos. Environ. 2018, 180, 11–22. [Google Scholar] [CrossRef]
- Nowak, D.J.; Hirabayashi, S.; Bodine, A.; Hoehn, R. Modeled PM2.5 removal by trees in ten US cities and associated health effects. Environ. Pollut. 2013, 178, 395–402. [Google Scholar] [CrossRef]
- Cao, H.; Yin, S.; Zhang, X.; Xiong, F.; Zhu, P.; Liu, C. Modeled PM2.5 removal by urban forest in Shanghai. J. Shanghai Jiaotong Univ. Agric. Sci. 2016, 34, 76–83. [Google Scholar]
- Ning, Z.; Chambers, R.; Abdollahi, K. Modeling air pollutant removal, carbon storage, and CO2 sequestration potential of urban forests in Scotlandville, Louisiana, USA. iForest Biogeosci. For. 2016, 9, 860–867. [Google Scholar] [CrossRef]
- Jayasooriya, V.; Ng, A.; Muthukumaran, S.; Perera, B. Green infrastructure practices for improvement of urban air quality. Urban For. Urban Green. 2017, 21, 34–47. [Google Scholar] [CrossRef]
- Nowak, D.J.; Hirabayashi, S.; Doyle, M.; McGovern, M.; Pasher, J. Air pollution removal by urban forests in Canada and its effect on air quality and human health. Urban For. Urban Green. 2018, 29, 40–48. [Google Scholar] [CrossRef]
- Ji, W.; Wang, Y.; Zhuang, D. Spatial distribution differences in PM2.5 concentration between heating and non-heating seasons in Beijing, China. Environ. Pollut. 2019, 248, 574–583. [Google Scholar] [CrossRef]
- Grzędzicka, E. Is the existing urban greenery enough to cope with current concentrations of PM2.5, PM10 and CO2? Atmos. Pollut. Res. 2018, 10, 219–233. [Google Scholar] [CrossRef]
- Lin, Y.; Yang, X.; Li, Y.; Yao, S. The effect of forest on PM2.5 concentrations: A spatial panel approach. For. Policy Econ. 2020, 118, 102261. [Google Scholar] [CrossRef]
- Cao, L.; Zeng, J.; Liu, K.; Bao, L.; Lingling, C. Characterization and Cytotoxicity of PM<0.2, PM0.2–2.5 and PM2.5–10 around MSWI in Shanghai, China. Int. J. Environ. Res. Public Health 2015, 12. [Google Scholar] [CrossRef] [Green Version]
- Hu, Q.; Fu, H.; Wang, Z.; Kong, L.; Chen, M.; Chen, J. The variation of characteristics of individual particles during the haze evolution in the urban Shanghai atmosphere. Atmos. Res. 2016, 181, 95–105. [Google Scholar] [CrossRef]
- Zhou, G.; Yang, F.; Geng, F.; Xu, J.; Yang, X.; Tie, X. Measuring and modeling aerosol: Relationship with haze events in Shanghai, China. Aerosol Air Qual. Res. 2014, 14, 783–792. [Google Scholar] [CrossRef] [Green Version]
- Guo, H.; Chen, M. Short-term effect of air pollution on asthma patient visits in Shanghai area and assessment of economic costs. Ecotoxicol. Environ. Saf. 2018, 161, 184–189. [Google Scholar] [CrossRef]
- Li, H.; Wang, D.; Cui, L.; Gao, Y.; Huo, J.; Wang, X.; Zhang, Z.; Tan, Y.; Huang, Y.; Cao, J.; et al. Characteristics of atmospheric PM2.5 composition during the implementation of stringent pollution control measures in shanghai for the 2016 G20 summit. Sci. Total Environ. 2018, 648, 1121–1129. [Google Scholar] [CrossRef] [PubMed]
- Shanghai Environmental Protection Bureau. Shanghai Environmental Bulletin in 2017; Shanghai Environmental Protection Bureau: Shanghai, China, 2017.
- Gu, X.; Tao, S.; Dai, B. Spatial accessibility of country parks in Shanghai, China. Urban For. Urban Green. 2017, 27, 373–382. [Google Scholar] [CrossRef]
- Hong, S.; Huang, X. Study on the concept and definition of Metropolitan Areas. Urban Plan. Int. 2007, 22, 50–57. [Google Scholar]
- Wang, M.; Li, J.; Kuang, S.; He, Y.; Chen, G.; Huang, Y.; Song, C.; Anderson, P.; Łowicki, D. Plant diversity along the urban-rural gradient and its relationship with urbanization degree in Shanghai, China. Forests 2020, 11, 171. [Google Scholar] [CrossRef] [Green Version]
- Gao, X.; Dai, Y.; Han, Y. Study on Monitoring Distribution and Network Construction of Continuous Inventory System for Forest Ecology in Shanghai; China Forestry Publishing: Beijing, China, 2016. [Google Scholar]
- Tallis, M.; Taylor, G.; Sinnett, D.; Freer-Smith, P. Estimating the removal of atmospheric particulate pollution by the urban tree canopy of London, under current and future environments. Landsc. Urban Plan. 2011, 103, 129–138. [Google Scholar] [CrossRef]
- Lin, W.; Wang, C.; Zhao, M.; Huang, J.; Shi, R.; Liu, Y.; Gao, J. Estimation urban forests NPP based on forest inventory data and remote sensing. Ecol. Environ. 2008, 17, 766–770. [Google Scholar]
- Zhang, X.; Yin, B.; Jiang, C.; Xiong, F.; Zhu, P.; Zhou, P. PM2.5 deposition velocity and impact factors on leaves of typical tree species in Shanghai. J. East China Norm. Univ. Nat. Sci. 2016, 6, 27–37. [Google Scholar]
- China Meteorological Information Center Meteorological; Building Science and Technology Department of Tsinghua University. Chinese Building Thermal Environment Analysis of Specialized Meteorological Data Collection; Chinese Architecture Industry Press: Beijing, China, 2005.
- Chen, L.; Peng, S.; Liu, J.; Hou, Q. Dry deposition velocity of total suspended particles and meteorological influence in four locations in Guangzhou, China. J. Environ. Sci. 2012, 24, 632–639. [Google Scholar] [CrossRef]
- Shi, J.; Cui, L.; Yang, H.; Sun, L. Spatial pattern and temporal change of climate in Shanghai. J. Geoinf. Sci. 2015, 17, 1348–1354. [Google Scholar]
- Fang, Y.; Wang, B.; Niu, X. Atmospheric particles-capturing capability of main afforestation tree species in Central Shaanxi plain. Chine. J. Ecol. 2015, 34, 1516–1522. [Google Scholar]
- Wang, Z.; Li, J. Capacity of dust uptake by leaf surface of Euonymus Japonicus Thunb. and the morphology of capture particle in air polluted city. Ecol. Environ. 2006, 15, 327–330. [Google Scholar]
- Zhang, J.; Zhou, J.; Ren, M.; Hu, H. Comparison of dust retention capacities by 20 urban road afforestation trees. J. Northwest Norm. Univ. Nat. Sci. 2013, 49, 113–120. [Google Scholar]
- Wang, R. Difference analysis on dust retention effect of urban landscape plants. J. Anhui Agric. Sci. 2014, 42, 11799–11800, 11874. [Google Scholar]
- Luo, W.; Gao, P.; Cassels, S. A large-scale location-based social network to understanding the impact of human geo-social interaction patterns on vaccination strategies in an urbanized area. Comput. Environ. Urban Syst. 2018, 72, 78–87. [Google Scholar] [CrossRef] [PubMed]
- Shao, Y.; Wang, J.; Ge, Y. Spatial mapping of PM2.5 concentration in China with geographically weighted regression kriging model. Remote Sens. Technol. Appl. 2018, 33, 1103–1111. [Google Scholar]
- Xiao, Y.; Wang, D.; Fang, J. Exploring the disparities in park access through mobile phone data: Evidence from Shanghai, China. Landsc. Urban Plan. 2018, 181, 80–91. [Google Scholar] [CrossRef]
- Wang, Y.; Wang, Z. Characteristics of PM2.5 concentration variability and its meteorological factors in Shanghai. Arid. Land Geogr. 2018, 41, 1088–1096. [Google Scholar]
- Zhi, P.; Shan, X. Community characteristics and species diversity of artificial evergreen broad-leaved forest in Shanghai. Shanxi For. Sci. Technol. 2016, 6, 10–15. [Google Scholar]
- Liu, C.; Henderson, B.; Wang, D.; Yang, X.; Peng, Z. A land use regression application into assessing spatial variation of intra-urban fine particulate matter (PM2.5) and nitrogen dioxide (NO2) concentrations in city of Shanghai, China. Sci. Total Environ. 2016, 565, 607–615. [Google Scholar] [CrossRef] [PubMed]
- Wu, S.; Cheng, J.; Lo, S.; Chen, C.; Bai, Y. Coordinating urban construction and district-level population density for balanced development: An explorative structural equation modeling analysis on Shanghai. J. Clean. Prod. 2021, 312, 127646. [Google Scholar] [CrossRef]
- Xiao, Y.; Wang, S.; Li, N.; Xie, G.; Lu, C.; Zhang, B.; Zhang, C. Atmospheric PM2.5 removal by green spaces in Beijing. Resour. Sci. 2015, 37, 1149–1155. [Google Scholar]
- Liu, W.; Yu, Z. Simulation on PM2.5 detention service of green space in Haidian district, Beijing, China. Ying Yong Sheng Tai Xue Bao J. Appl. Ecol. 2016, 27, 2580–2586. [Google Scholar]
- Selmi, W.; Weber, C.; Rivière, E.; Blond, N.; Mehdi, L.; Nowak, D.J. Air pollution removal by trees in public green spaces in Strasbourg city, France. Urban For. Urban Green. 2016, 17, 192–201. [Google Scholar] [CrossRef] [Green Version]
- Zhang, L.; Yang, G.; Li, X. Mining sequential patterns of PM2.5 pollution between 338 cities in China. J. Environ. Manag. 2020, 262, 110341. [Google Scholar] [CrossRef]
- Liu, T.; Cai, Y.; Feng, B.; Cao, G.; Lin, H.; Xiao, J.; Li, X.; Liu, S.; Pei, L.; Fu, L.; et al. Long-term mortality benefits of air quality improvement during the twelfth five-year-plan period in 31 provincial capital cities of China. Atmos. Environ. 2018, 173, 53–61. [Google Scholar] [CrossRef]
- Jiang, C.; Yin, S.; Tao, T.; Zhu, P.; Liu, C. Ion composition and variance analysis of particulates deposited on plant leaves of typical tree species in Shanghai. Environ. Sci. Technol. 2018, 41, 85–90. [Google Scholar]
- He, K.; Zeng, Y.; Chi, J.; Li, X.; Wang, Y. Research on the dust detention effect of climbing plants on viaduct columns in Shanghai. Jiangsu Agric. Sci. 2018, 46, 273–277. [Google Scholar]
- Salmond, J.; Williams, D.; Laing, G.; Kingham, S.; Dirks, K.; Longley, I.; Henshaw, G. The influence of vegetation on the horizontal and vertical distribution of pollutants in a street canyon. Sci. Total Environ. 2012, 443, 287–298. [Google Scholar] [CrossRef]
- Wania, A.; Bruse, M.; Blond, N.; Weber, C. Analysing the influence of different street vegetation on traffic-induced particle dispersion using microscale simulations. J. Environ. Manag. 2012, 94, 91–101. [Google Scholar] [CrossRef]
- Kang, X.; Cui, L.; Zhao, X.; Li, W.; Zhang, M.; Wei, Y.; Lei, Y.; Ma, M. Effect of wetlands on reducing atmospheric fine particles PM2.5 in Beijing. Chine. J. Ecol. 2015, 34, 2807–2813. [Google Scholar]
- Nowak, D.J.; Crane, D.E.; Stevens, J.C. Air pollution removal by urban trees and shrubs in the United States. Urban For. Urban Green. 2006, 4, 115–123. [Google Scholar] [CrossRef]
- Nguyen, T.; Yu, X.; Zhang, Z.; Liu, M.; Liu, X. Relationship between types of urban forest and PM2.5 capture at three growth stages of leaves. J. Environ. Sci. 2015, 27, 33–41. [Google Scholar] [CrossRef] [PubMed]
- Zhao, Y.; Xiong, L.; Wang, M.; Shi, D.; Shi, S. Relevance of the air negative ion concentrations to the ecological prop-erties of the sampling areas in Shanghai. J. Saf. Environ. 2015, 15, 322–328. [Google Scholar]
Publisher’s Note: MDPI stays neutral with regard to jurisdictional claims in published maps and institutional affiliations. |
© 2021 by the authors. Licensee MDPI, Basel, Switzerland. This article is an open access article distributed under the terms and conditions of the Creative Commons Attribution (CC BY) license (https://creativecommons.org/licenses/by/4.0/).