Article

Vertical Characteristics of Secondary Aerosols Observed in the Seoul and Busan Metropolitan Areas of Korea during KORUS-AQ and Associations with Meteorological Conditions

1
Department of Atmospheric Sciences, Pusan National University, Busan 46241, Korea
2
Institute of Environmental Studies, Pusan National University, Busan 46241, Korea
*
Author to whom correspondence should be addressed.
Atmosphere 2021, 12(11), 1451; https://doi.org/10.3390/atmos12111451
Submission received: 29 September 2021 / Revised: 28 October 2021 / Accepted: 29 October 2021 / Published: 2 November 2021
(This article belongs to the Special Issue Influence of Sea Breeze on Urban Meteorology)

Abstract

:
In this study, the chemical components of aerosols observed at ground level and in upper layers during the Korea–United States Air Quality (KORUS-AQ) campaign were analyzed in two representative metropolitan areas of Korea: the Seoul metropolitan area (SMA) and the Busan-containing southeastern metropolitan area (BMA). First, we characterized emissions using the Clean Air Policy Support System (CAPSS) emission statistics, and compared them with both ground- and aircraft-based measurements obtained during the KORUS-AQ campaign. The emission statistics showed that the SMA had higher NOx levels, whereas BMA had significantly higher SO2 levels. Ground-level observations averaged for the summer season also showed SMA–nitrate and BMA–sulfate relationships, reflecting the CAPSS emission characteristics of both areas. However, organic carbon (OC) was higher in BMA than SMA by a factor of 1.7, despite comparable volatile organic compound (VOC) emissions in the two areas. DC-8 aircraft-based measurements showed that, in most cases, nitrogen-rich localities were found in the SMA, reflecting the emission characteristics of precursors in the two sampling areas, whereas sulfur-rich localities in the BMA were not apparent from either ground-based or aircraft observations. KORUS-AQ measurements were classified according to two synoptic conditions, stagnant (STG) and long-range transport (LRT), and the nitrate-to-sulfate (N/S) ratio in both ground and upper layers was higher in the SMA for both cases. Meanwhile, organic aerosols reflected local emissions characteristics in only the STG case, indicating that this stagnant synoptic condition reflect local aerosol characteristics. The LRT case showed elevated peaks of all species at altitudes of 1.0–3.5 km, indicating the importance of LRT processes for predicting and diagnosing aerosol vertical distributions over Northeast Asia. Other chemical characteristics of aerosols in the two metropolitan areas were also compared.

1. Introduction

Particulate matter less than 2.5 μm in size (PM2.5) in the atmosphere is directly emitted as a pollutant through processes such as fossil fuel combustion in factories and automobiles, and is also generated secondarily through atmospheric chemical reactions from gas-phase precursors. The main chemical components of PM2.5 are inorganic ion components and carbon species. Inorganic ion components are nitrate (NO3), sulfate (SO42−), and ammonium salt (NH4+), as well as the carbon species such as organic carbon (OC) and elementary carbon (EC) [1,2,3]. Inorganic components such as nitrate (NO3), sulfate (SO42−), and ammonium salt (NH4+) are mainly aerosol chemical components that are secondarily generated from gas-phase precursors, including nitrogen oxides (NOx), sulfur dioxide (SO2), and ammonia (NH3), through various chemical reactions in the atmosphere. OC was dominated by both primary and secondary generated species, with a potentially important contribution from biomass burning in winter, whereas secondary processes dominated OC production from volatile organic compounds (VOCs) in summer. Thus, the major components of measured PM2.5 particles are involved in both secondary inorganic aerosol (SIA) and secondary organic aerosol (SOA) production [4,5,6].
Previous studies of PM2.5 chemical components in Korea have been carried out mostly based on in situ ground measurements until recently, and have shown frequent peaks of PM2.5 concentrations, where sometimes SOA is an important region in Northeast Asia [4,7]. However, cause analyses of high PM2.5 episodes, such as source–receptor relationship analysis, have been conducted only based on ground measurement data, and therefore systematic research on quantitative source–receptor relationships have not been conducted, mainly due to the lack of non-surface measurements. To date, unlike in situ ground measurements, most upper-layer measurements and analysis methods, including aircraft-based and remote-sensing observations, have been extremely limited in both space and time, aside from comprehensive aircraft measurement campaigns [8,9].
In South Korea, the KORUS-AQ (Korea–United States Air Quality) campaign was conducted by the National Institute of Environmental Research (NIER) of South Korea and the US National Aeronautics and Space Administration (NASA) to observe air quality across the Korean Peninsula [10]. The KORUS-AQ campaign is a multi-organizational mission aimed at collecting comprehensive and detailed measurements of pollutants (both trace gases and aerosol particle properties) across the Korean Peninsula using aircraft from 1 May to 12 June 2016 (https://www-air.larc.nasa.gov/missions/korus-aq/: last accessed on 30 October 2021). During the KORUS-AQ campaign, both in situ surface measurements and aircraft observations of the upper layers were collected concerning air pollutants, including secondarily generated aerosols, VOCs, ozone, and cloud condensation nuclei (CCN), and some impact analysis studies were conducted in the main metropolitan area [11,12,13,14,15]. Although numerous observational and numerical studies have employed the large-scale regional measurements taken during the KORUS-AQ campaign, these studies have mainly focused on the Seoul metropolitan area (SMA) and its neighboring areas, such as nearby industrial complexes and the Yellow Sea [14,16].
Over urban areas in southeastern Korea, such as Busan, its second largest city, and Ulsan, the largest industrial area in Korea, previous studies on local physicochemical properties has been carried out intermittently over the area [17,18,19]. Recent studies on the chemical components of PM2.5 in urban areas including the Busan and Ulsan areas have noted the importance of secondary PM2.5 generation, especially during the heat wave period of the summer season [17,20,21]. Despite employing in situ ground measurements in southeastern Korea in these studies, the results showed large differences from those in the SMA, with higher surface sulfate and SOA fractions of PM2.5 in the southeastern areas of Korea [22]. In contrast to surface measurements, no attempts have been made to observe non-surface (or upper-layer) aerosol components, other than the DC-8 aircraft measurements of KORUS-AQ, although there have been few aircraft observations solely targeting gaseous air pollutants such as SO2 and NOx in Korea [9,23].
In the absence of other observations, the DC-8 aircraft measurements obtained during the KORUS-AQ campaign allow for the analysis of vertical PM2.5 structures from disaggregated chemical components using both ground measurements and aircraft observations (measurements of upper layers). Such paired aerosol measurements, coupling and integrating data from the surface (or lower atmosphere) to the upper layer, can be used to determine source distributions such as industrial complexes, port facilities, and thermal power plants, as well as external PM2.5 inflow routes in the real atmosphere, which are essential for understanding aerosol features from a source and receptor perspective.
The present study explores the DC-8 aircraft measurements of PM2.5 chemical components obtained during the KORUS-AQ campaign over the Busan-containing southeastern metropolitan area (BMA), and assesses the vertical structures through comparisons with those in the SMA. In addition to upper-layer aircraft observations, surface-level measurements were taken in SMA and BMA, and then compared in terms of the distributions of mass and chemical components, as well as associations with local circulation patterns.

2. Data and Methods

The KORUS-AQ campaign is an international and multi-organizational mission for observing air quality across the Korean Peninsula and surrounding areas, initiated by NIER and NASA. The mission and other details on KORUS-AQ have been well-documented in previous studies (https://www-air.larc.nasa.gov/missions/korus-aq/: last accessed on 30 October 2021). The KORUS-AQ campaign collected detailed measurements of pollutants, including trace gases, PM2.5 mass concentrations, and chemical components of aerosols observed during DC-8 flights with extensive spatial and vertical coverage from 1 May through 12 June 2016. The measurement instruments used during the KORUS-AQ campaign have been described in previous studies [24,25,26,27].
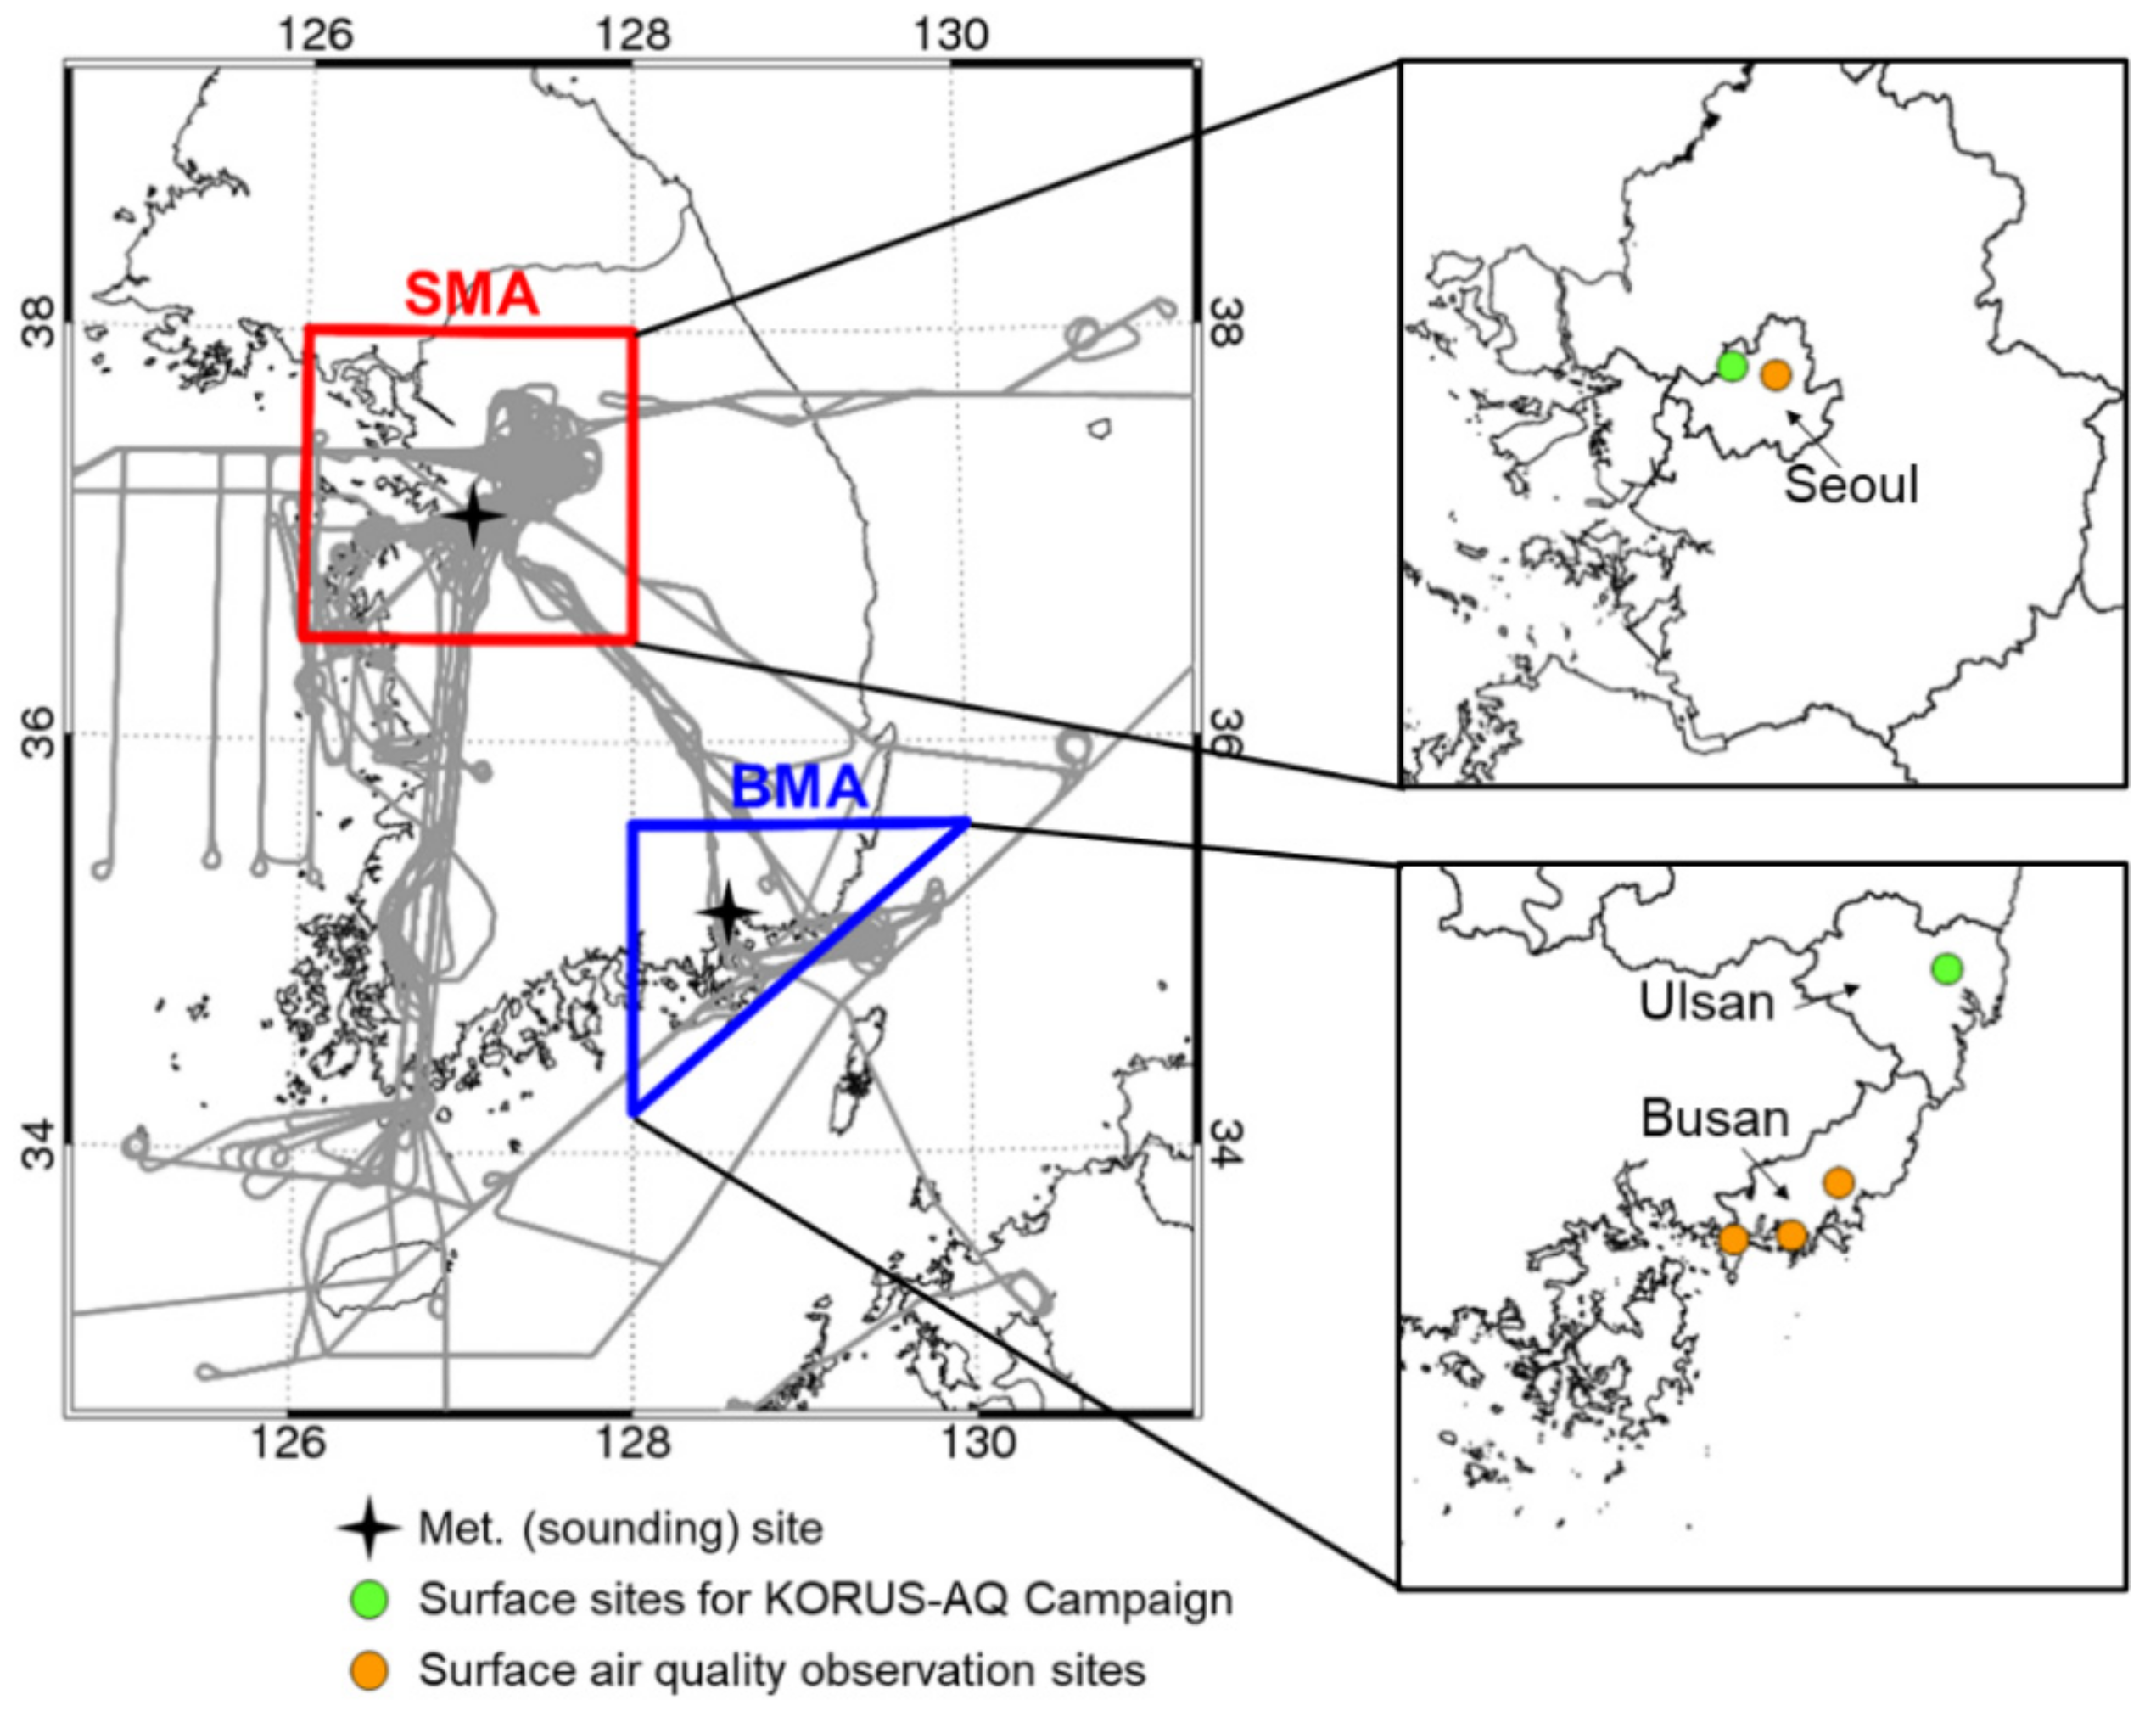
Figure 1 illustrates the areas of both SMA (36.5° N to 38° N, 126° E to 128° E) and BMA (34.2° N to 35.6° N, 128° E to 130° E) during the KORUS-AQ campaign. The DC-8 aircraft observation routes are also illustrated (in gray) in Figure 1. In this study, BMA does not refer exclusively to the Busan administrative district; rather, it includes a broader urban area of southeastern Korea, including Busan (Figure 1). This broad BMA area, as indicated in Figure 1, was selected because very few KORUS-AQ measurement zones are present within the Busan administrative district specifically.
In the present study, chemical components including nitrates, sulfates, and SOA obtained from DC-8 aircraft measurements were employed as non-surface and upper-layer observation data for both the BMA and SMA areas. For ground-level chemical component observations, nitrate, sulfate, and OC observations taken at the Bulkwang site and the Korea University site [28] were used in this study for SMA, whereas chemical PM measurements of nitrates, sulfates, and OC at three stations in Busan, namely, Janglim, Yeonsan, and Shinhang, along with some Ulsan sites, were used for BMA (see Figure 1). Due to differences in the instruments used for SOA measurement between in situ surface (measured as ‘OC’) and non surface DC-8 measurements (measured as ‘OA’), we employed the constant 1.74 for the estimation of OC from OA concentrations (i.e., OA = 1.74 × OC), as previously used by Ahmadov et al. [29].
We also obtained data on local and meteorological characteristics, such as vertical upper wind speed and direction, sonde meteorological observations at the Osan meteorological site (for the interpretation of SMA), and equivalent meteorological data at the Changwon site (for the interpretation of BMA), as also illustrated in Figure 1. In addition, we obtained the total annual emissions of NOx, SOx, and VOCs for both SMA and BMA, in the year 2014, from the Clean Air Policy Support System (CAPSS), to compare emission characteristics between two representative urban areas in Korea—SMA and BMA.

3. Results

3.1. Emissions and Surface Measurements

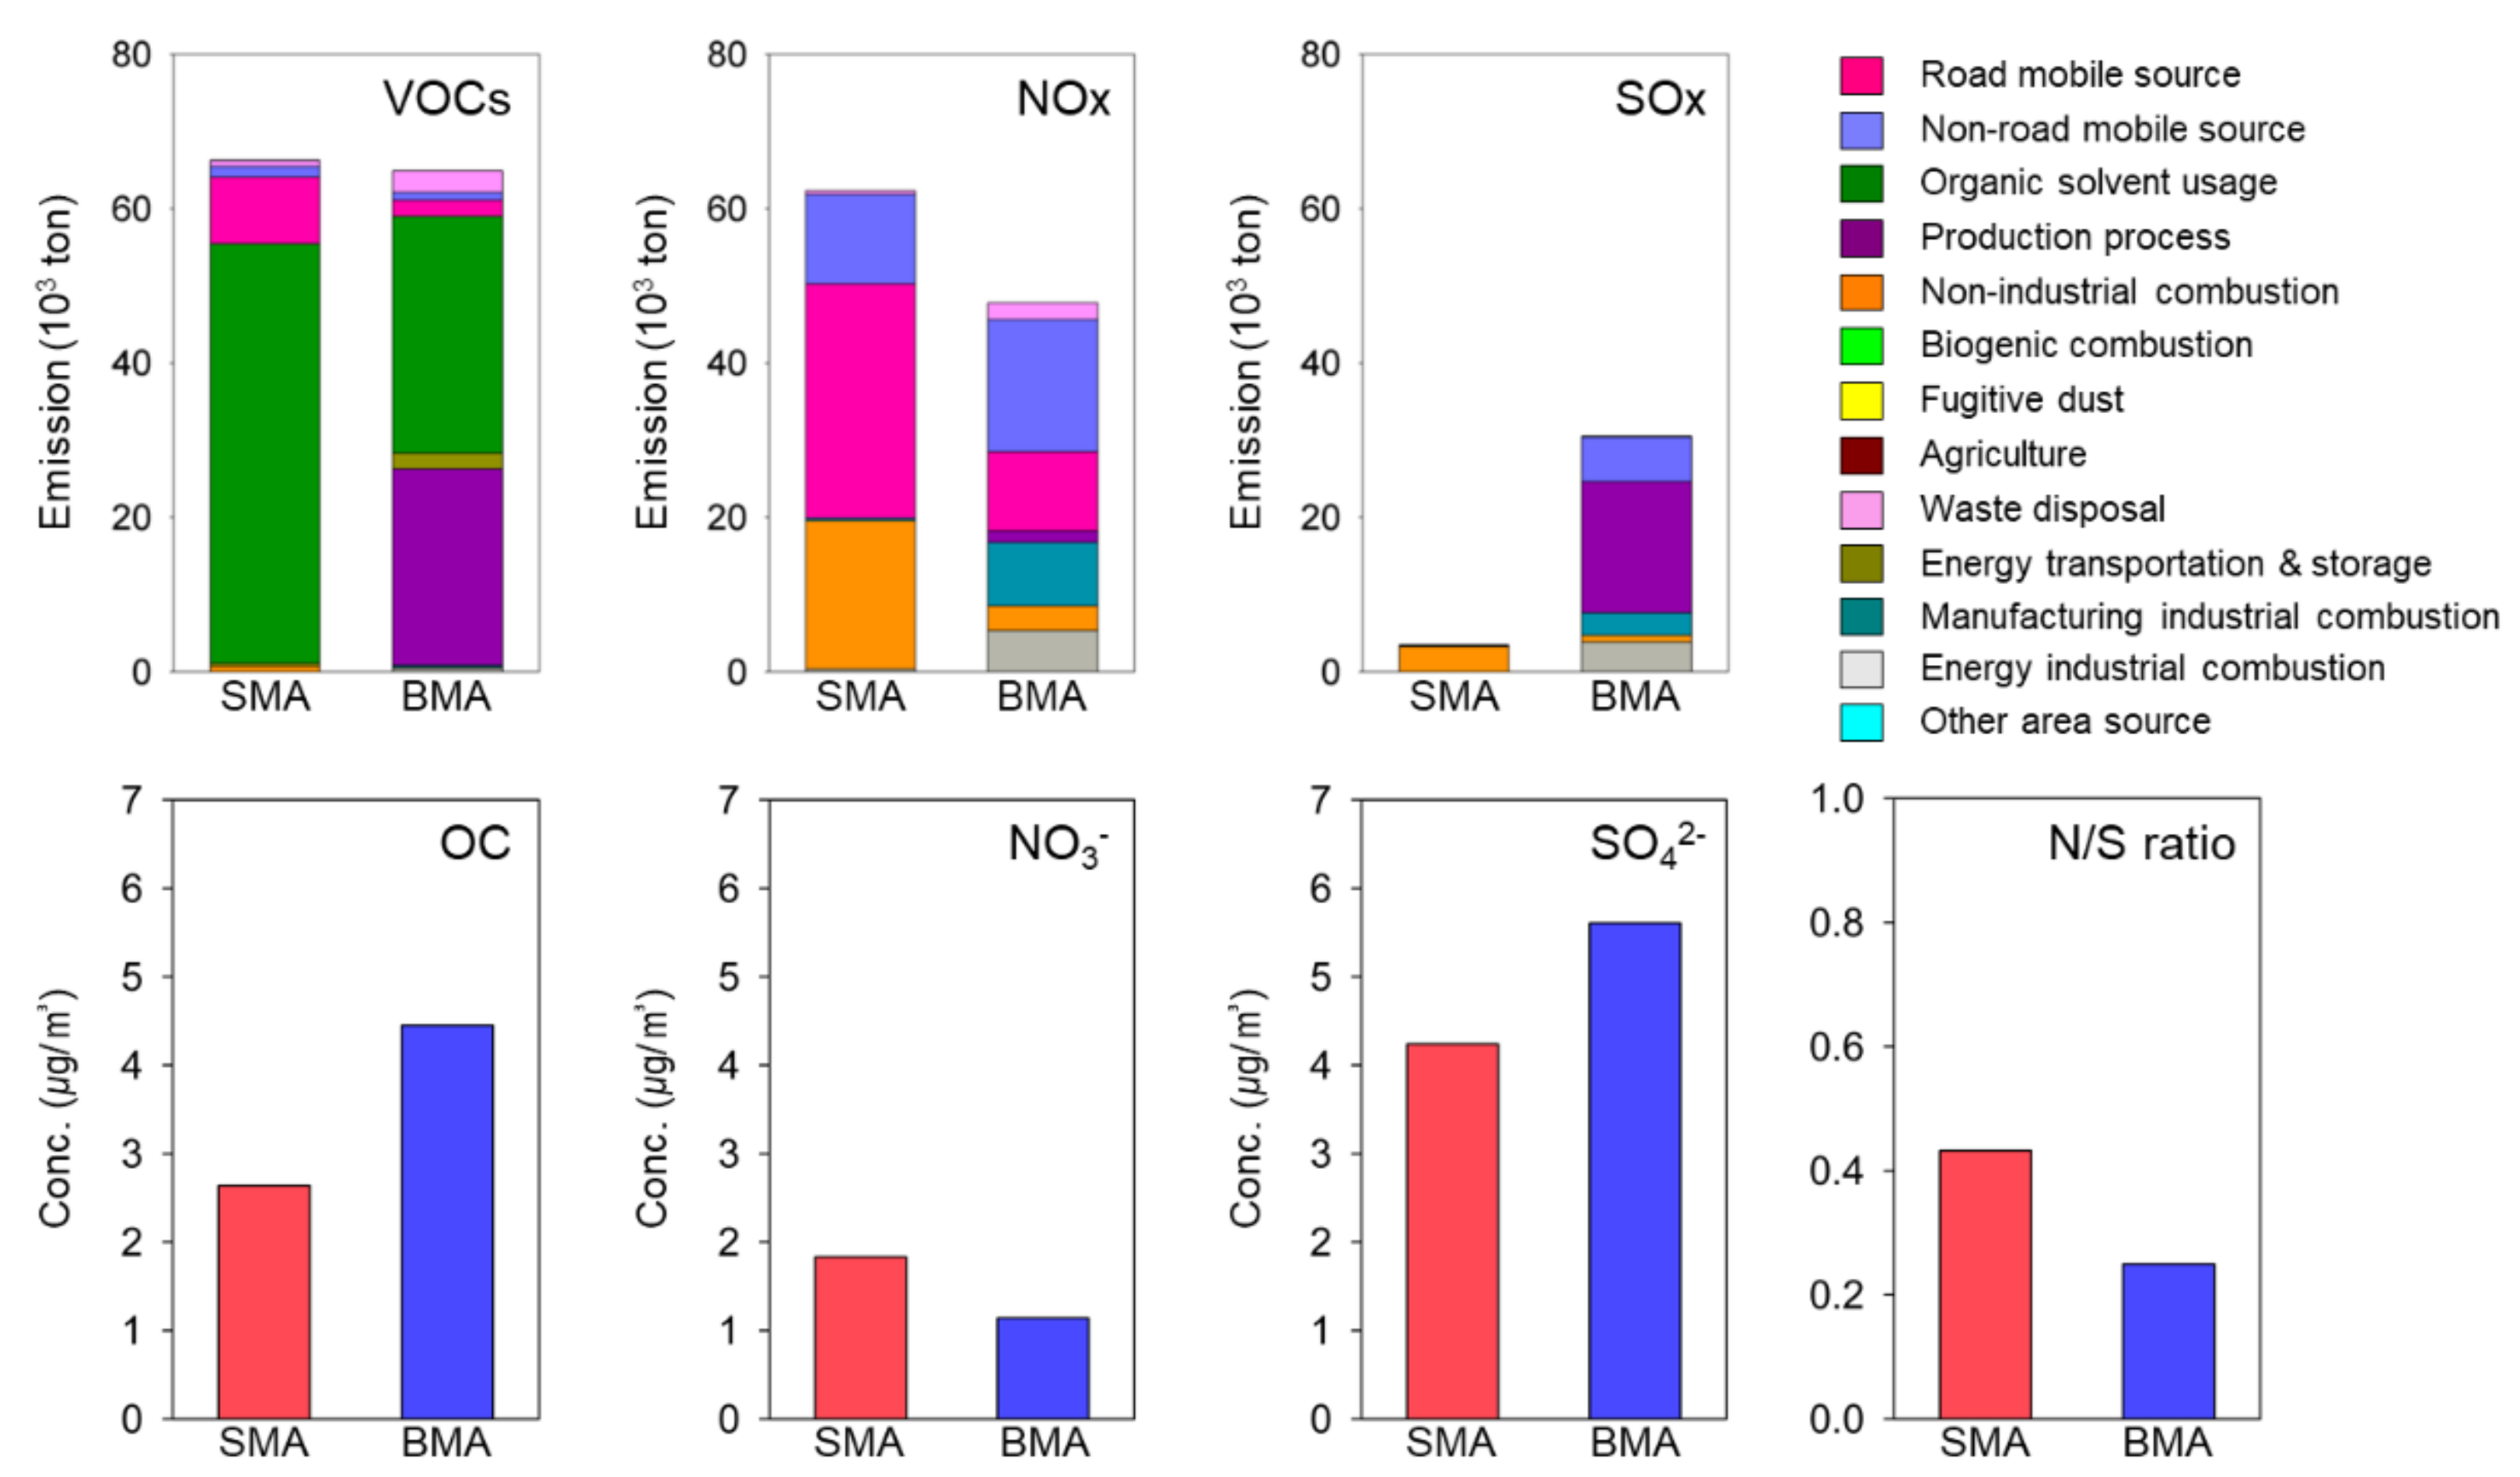
First, we explored the emissions characteristics in two areas, SMA and BMA, through the assessment of the annual total NOx, SOx, and VOC emissions according to CAPSS data for the year 2014 (Figure 2). Detailed sectorial information is provided in Table S1, and the relevant abbreviations are listed in Table S2. The emissions of NOx were higher in SMA (62,350 tons/year) than in BMA (47,804 tons/year) by a factor of 1.3. The sector with the highest emissions in SMA was the road transport sector, accounting for 48.7% of the total NOx emissions, whereas non-road transport was highest in BMA, at 35.8%. For SOx, the total annual emissions were about 3527 tons in Table S1 and 30,529 tons in BSA, indicating significantly (8.7 times) higher emissions in BMA than in SMA. By sector, non-industrial combustion accounted for the majority of emissions in SMA (about 92.3%), whereas production processes (about 55.7%) were dominant in BMA. These emission characteristics are featured by higher SOx emissions in SMA, whereas higher NOx emissions were found in BMA. Therefore, the high N observed in SMA and the high S observed in BMA are believed to reflect differences in the measured SIAs, including nitrate and sulfate. In particular, sulfate levels in PM would be a good indicator for differentiating between the two areas based on emissions. For VOC emissions, the difference between SMA (66,289 tons/year) and BMA (64,901 tons/year) was only approximately 2%, suggesting similar emission contributions to SOA concentrations in both areas.
Next, we investigated the ground-observed chemical components of SIAs and SOAs in the two study areas. We conducted observations only during the summer season, when external inflow was significantly lower than in other seasons, so that local emission characteristics would be more likely to affect the measurements. The observations from all sites (Figure 1) showed that annual average nitrate concentrations were 1.8 μg/m3 in SMA and 1.4 μg/m3 in BMA, indicating levels that were approximately 1.3 times higher in SMA, as also suggested by the emissions analysis results. The sulfate concentration was 4.2 μg/m3 in SMA and 5.6 μg/m3 in BMA, and thus the levels were about 1.3 times higher in BMA. These results represent a smaller difference than that found for SO2 emissions, which was 8.7 times greater in BMA than SMA (see Table S1). As a result, the nitrate-to-sulfate (N/S) ratio was higher in SMA than in BMA, reflecting the emissions characteristics of the two metropolitan areas: N-dominant (by road mobile sources) SMA and S-dominant (by non-road mobile sources) BMA in Korea.
The observed OC showed unexpected results. SMA had a level of 2.6 μg/m3, whereas that in BMA was about 4.5 μg/m3, indicating significant differences between the two areas (1.73 times higher in BMA) despite similar VOC emissions, as listed in Table S1. Due to the difference in the OC concentrations, area-specific OC formation processes should be assessed separately, or more accurate re-assessment of VOC emissions would be needed to generate effective abatement plans in the two areas.

3.2. Ground-Based Measurements versus Aircraft Measurements in SMA and BMA

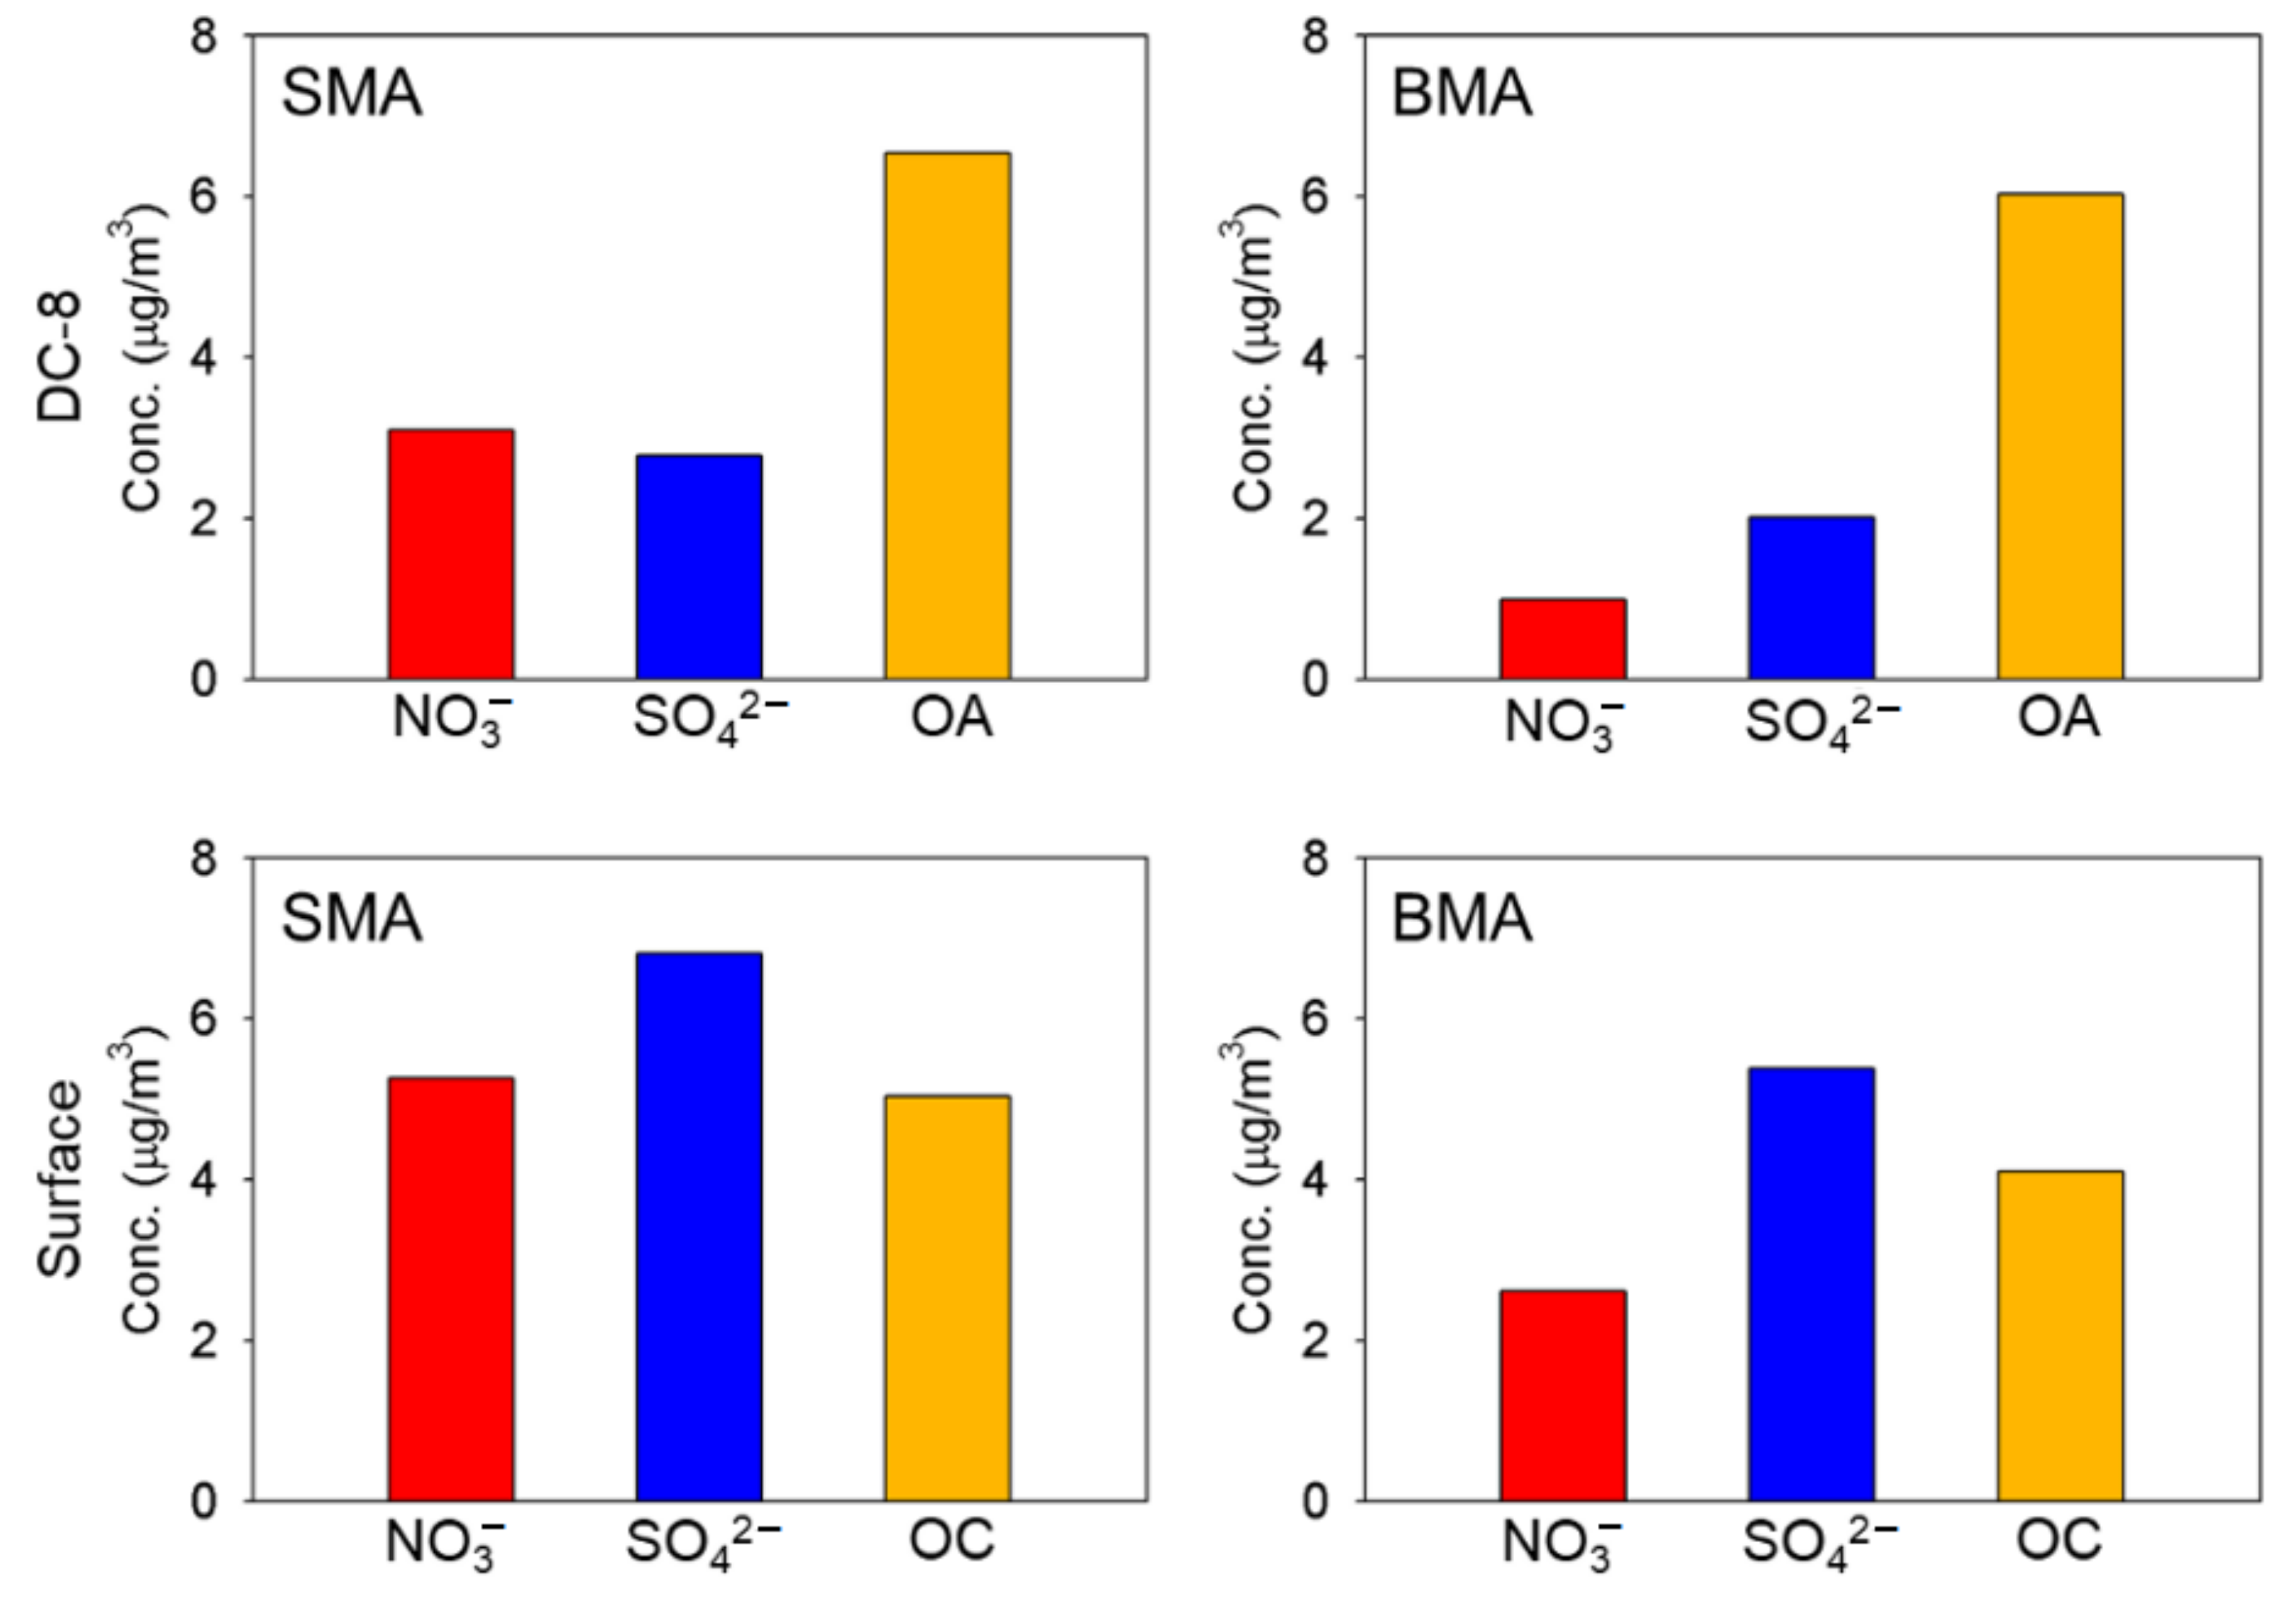
To elucidate the vertical characteristics of the PM2.5 concentration and its influencing factors in the two study areas, we investigated both ground measurements and upper-layer aircraft observations taken during the KORUS-AQ campaign. Figure 3 shows the ground- and aircraft-observed chemical components of PM2.5, SIAs (nitrates and sulfates) and OAs, obtained through DC-8 observations in the two areas (as indicated in Figure 1) during the KORUS-AQ campaign. Upper-layer aircraft observations from KORUS-AQ provided the average levels of nitrates (3.1 μg/m3), sulfates (2.8 μg/m3), and OAs (6.5 μg/m3) over SMA, as well as those of nitrates (1.0 μg/m3), sulfates (2.0 μg/m3), and OAs (6.0 μg/m3) over BMA, which were lower for all species in BMA in the order of nitrates (35.7%), sulfates (71.4%), and OAs (92.3%).
Notably, the aircraft-based average sulfate concentration was lower in BMA than in SMA, reflecting the surface measurements taken during KORUS-AQ, but contrasting with the sulfur emissions levels (Table S1) of the two areas. Ground observations throughout the KORUS-AQ campaign period showed higher levels of nitrates (5.3 μg/m3), sulfates (6.8 μg/m3), and OAs (5.0 μg/m3) in SMA, whereas nitrate (2.6 μg/m3), sulfate (5.4 μg/m3), and OA (4.1 μg/m3) levels in BMA were lower, with reductions on the same order as those of the aircraft measurements, namely in nitrates (49.1%), sulfates (79.4%), and OAs (82.0%). Note that the ground-level averages during the KORUS-AQ period (1 May–12 June) are not equivalent to the seasonal averages (1 June–31 August) described in Section 3.1.
Comparing the ground measurements with upper-layer aircraft observations of SIA components, the vertical distributions of sulfates sharply decreased by 40%–45% from the surface to the upper atmospheric layers over both SMA and BMA. However, the decreasing rate of nitrates in SMA was relatively lower (reduced by 56.8%) in SMA than that in BMA (reduced by 42.9%). The causes of the higher nitrate level in the upper atmosphere can be interpreted based on the recent increase in nitrate sdue to the characteristics of the ammonia-sulfate-nitrate aerosol formation in response to the recent SO2 emission reduction in China. Nitrates had begun to increase in these ‘SO2–poor’ conditions in the Beijing area in China, and were then transported toward the Yellow Sea area and SMA. This is also confirmed by the recent observational data. For example, the measured ratio of ionic species to PM2.5 at the Baengnyeong supersite showed changes in aerosol inorganic chemical compositions from sulfates in 2014 to nitrates in 2015–2016 [30], indicating the increase in the nitrate level in upper atmosphere over SMA.
On the other hand, OA decreased steadily (or maintained higher levels than SIA components) from the surface to the upper layer, with a more pronounced tendency toward high-level OA over SMA than over BMA (data not shown here). In contrast to the higher average OA level in BMA than in SMA in the summer of 2018, OA was generally higher in SMA than in BMA. This difference appears to be due to higher levels of SOA in the SMA; the ground temperature was 21.2 °C ± 4.6 °C in the SMA but 19.5 °C ± 3.9 °C in BMA during the KORUS-AQ campaign, indicating more active photochemical reactions in SMA.
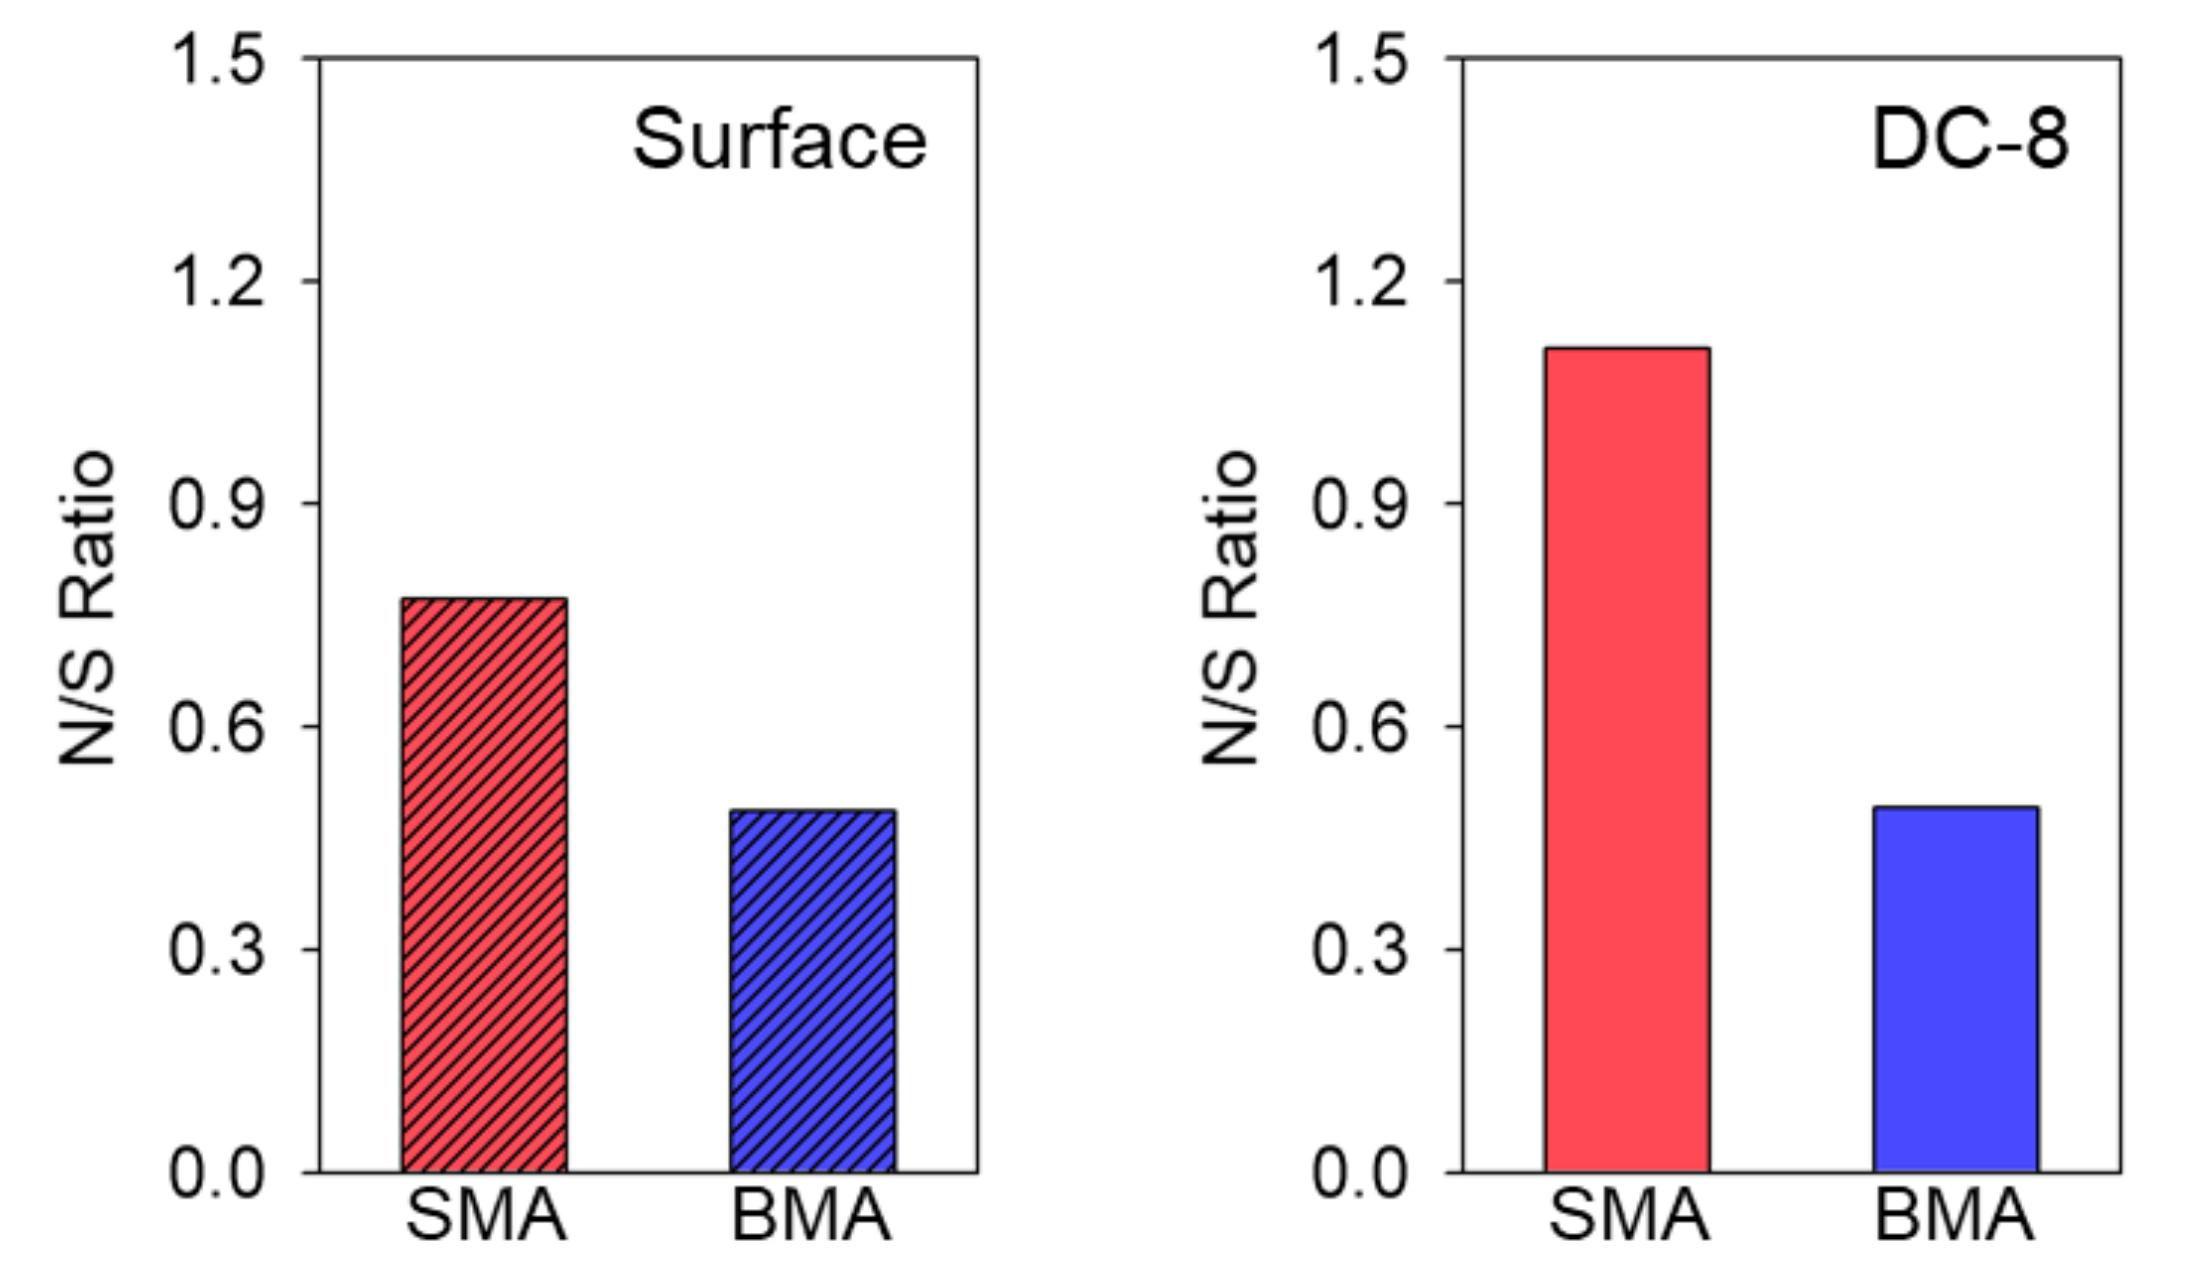
Figure 4 shows the N/S ratios obtained from aircraft measurements versus ground observations throughout the KORUS-AQ campaign. At ground level, the N/S ratios were 0.77 and 0.49 in SMA and BMA, respectively, indicating a clearly higher fraction of nitrates (by a factor of 1.6) in SMA, consistent with the trend in the emissions characteristics. The aircraft-measured N/S ratio of 1.11 in SMA was 2.3 times higher than the equivalent value of 0.49 in BMA; these results differed quantitatively from the ground observations but reflected the same characteristics.
In conclusion, aside from the overall tendency of SIA measurements to decrease from the ground to the upper atmosphere, the N/S ratio was consistently higher in SMA than in BMA. This difference reflected the N-rich emissions revealed by both ground-level and upper-layer analyses, and was similar to the emissions characteristics of precursors in the two areas. On the other hand, S-rich emissions were not observed in BMA based on either ground-level or aircraft-based observations in comparative SIA analysis; therefore, further studies on the emission–concentration relationship is needed to determine the local characteristics of SIAs in BMA.

3.3. Impact of Synoptic Conditions: Long-Range Transport versus Stagnant Conditions

PM2.5 particles in urban areas originate from both primary sources and their precursors, and may be significantly affected by regionally transported aerosols. Therefore, quantifying and distinguishing local contributions to the observed PM2.5 concentrations from the contribution of long-range transport process in a given area remains challenging. These two contributors (local and transported) to PM2.5 concentrations have been studied extensively [9,22] based on two typical synoptic meteorological conditions.
Thus, for the KORUS-AQ campaign, identifying PM2.5 concentrations in accordance with the two commonly used synoptic weather conditions, long-range transport (LRT) and stagnant (STG) contributions, would be useful. Peterson et al. [31] described four distinct synoptic meteorological patterns throughout the campaign period: the dynamic period (1–16 May), the STG period (18–23 May), the LRT period (25–31 May) and the blocking period (1–7 June). In the current study, our selection of LRT (25–31 May) and STG (18–23 May) from KORUS-AQ data was based on the criteria described by Jo and Kim [32], i.e., was based on 3-day forward and backward trajectories; the data of these two periods were used herein without modification.
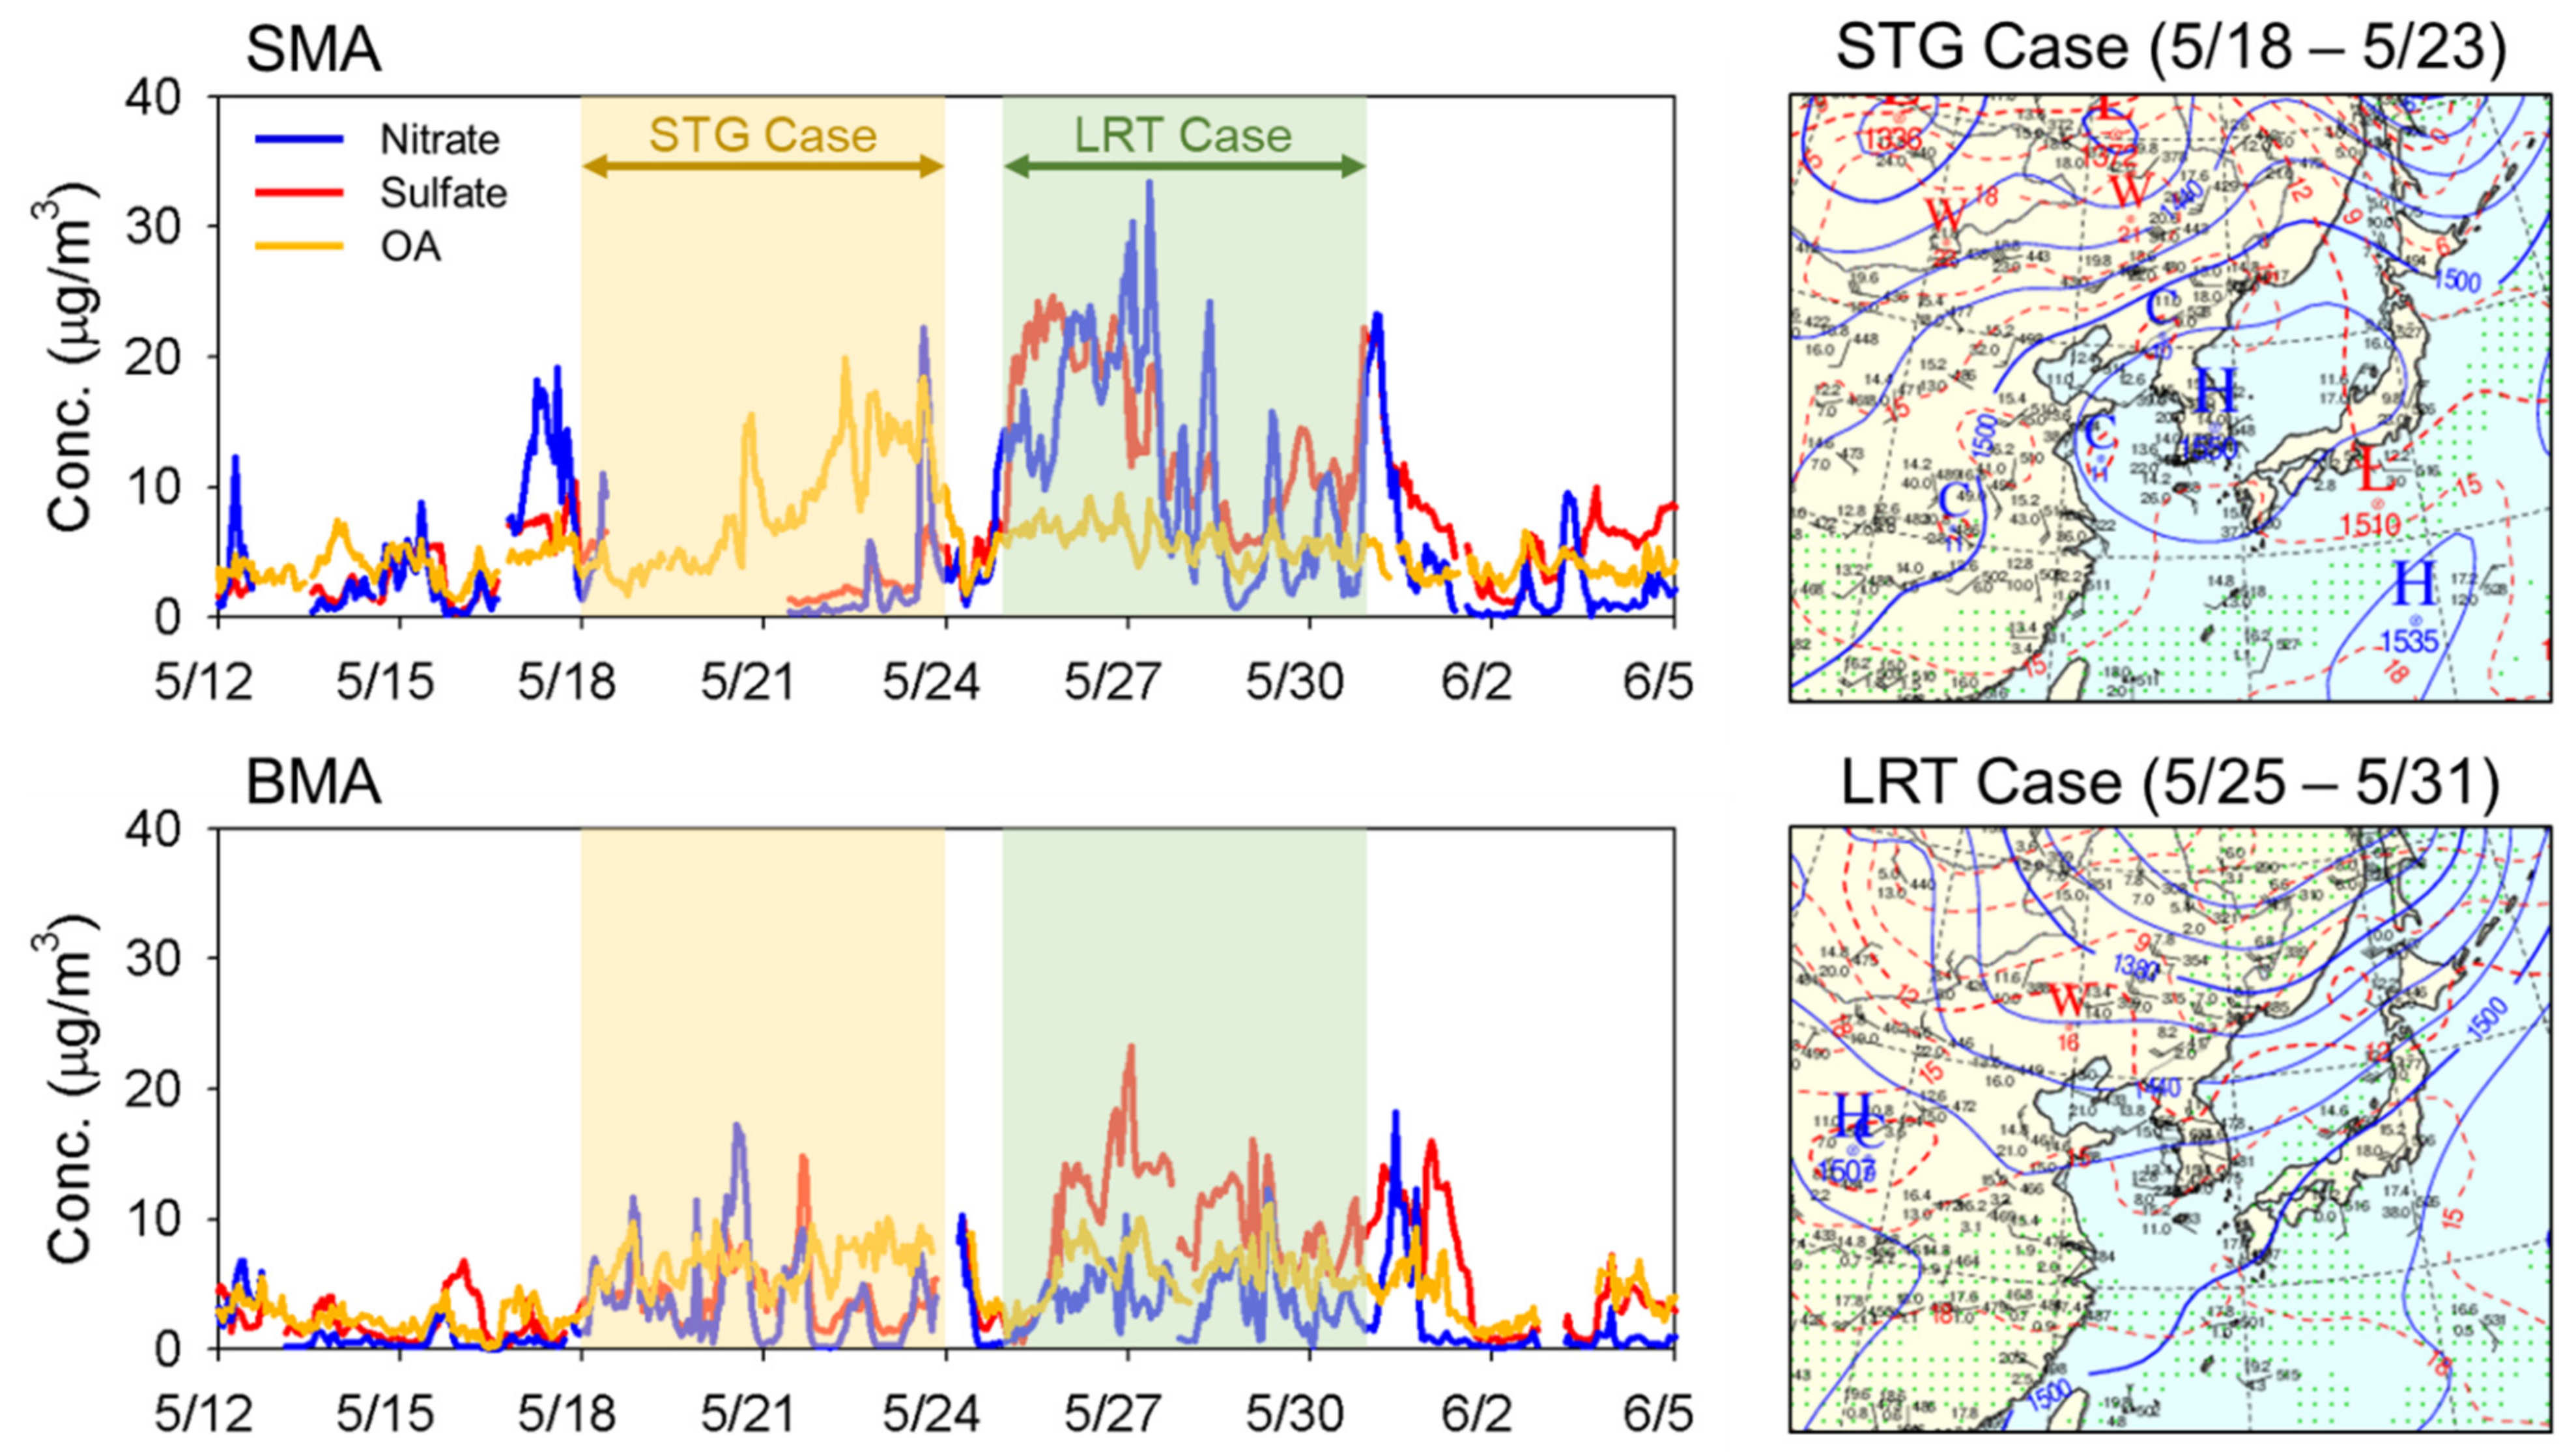
Figure 5 shows the ground-measured nitrate, sulfate, and OA species during the KORUS-AQ campaign period, with the STG and LRT periods indicated. Unfortunately, ground-based nitrate and sulfate observations during the STG period were mostly missing for SMA, as shown in Figure 5. Only OA concentrations were measured in SMA, which steadily increased to 33.9 μg/m3 during the STG period. In BMA, nitrate, sulfate, and OA levels increased to 17.2, 14.8 and 17.1 μg/m3, respectively. On the other hand, under LRT conditions, PM2.5 concentrations were generally high for nitrate (33.4 μg/m3), sulfate (24.7 μg/m3) and OA (16.0 μg/m3) in SMA, with similar (or lower) levels of nitrate (18.2 μg/m3), sulfate (23.3 μg/m3) and OA (18.9 μg/m3) seen in BMA. Figure 5 also suggests that the nitrate and sulfate in the case of LRT were much higher in SMA than in BMA, and were also higher than those in the case of STG. Jo et al. [30] analyzed the ground measurements of the PM2.5 mass concentration observed at the Baengnyeong site, finding that sulfates and nitrates accounted for 9.7% to 39.8% and 2.5% to 7.1%, respectively, in 2014, whereas, in 2015 and 2016, sulfates and nitrates accounted for 6.5% to 18.6% and 5.6% to 21.9% of the PM2.5 mass concentration, respectively. Considering that the Baengnyeong site is located on the westernmost island of the Korean Peninsula for the measurement of long-range transported air pollutants from the outside, this indicates that the long-range transported nitrate began to increase in SMA since 2014; nevertheless, sulfates remained an important component of the long-range transported PM2.5 mass concentration in 2014–2016, including the KORUS-AQ campaign period.
Notably, the synoptic conditions associated with the STG case can cause atmospheric congestion due to the stationary high-pressure system located above the Korean Peninsula. In contrast, the LRT-favorable synoptic conditions were driven by a cold front located south of the Korean Peninsula (as shown in Figure 5), leading to effective inflow of external pollutants with the southwesterly wind. Ground-measured PM2.5 concentrations depend on the level of inflow from outside the region. In our case, elevated levels of SIA species were measured, and SOA species were not unusual.
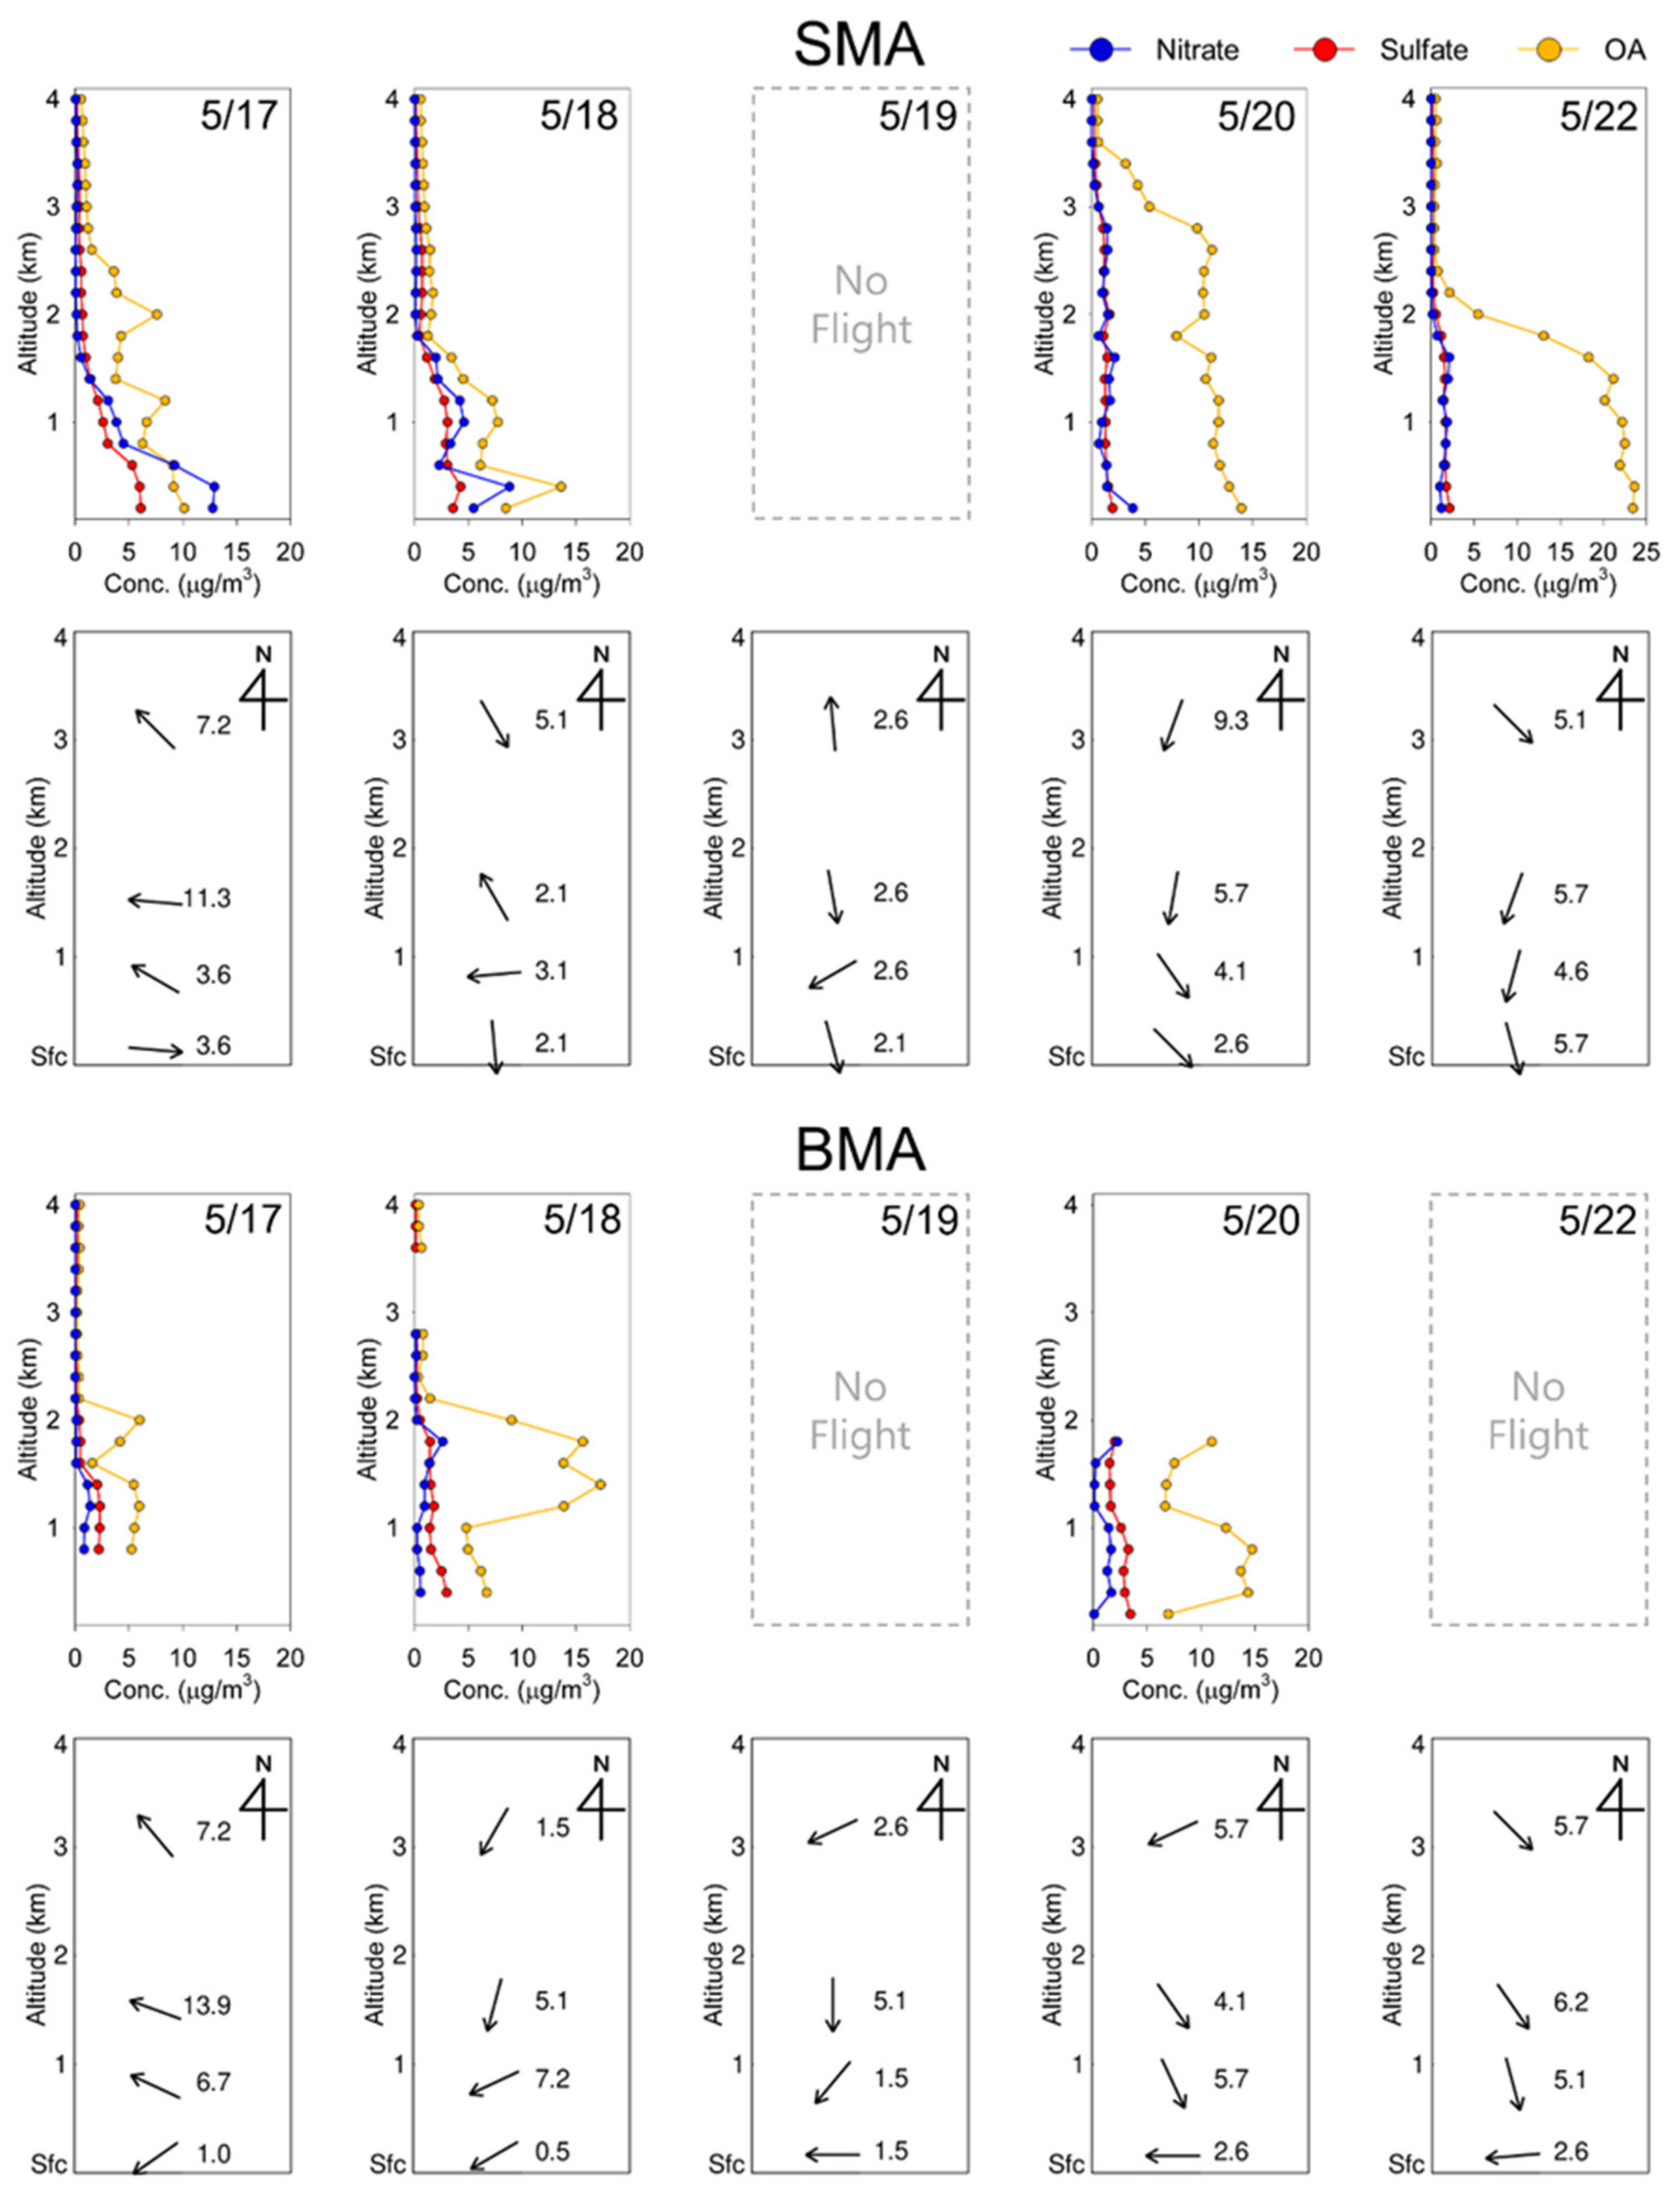
Figure 6 shows the vertical distributions of the average concentrations of nitrates, sulfates, and OAs, along with wind direction and speed for the STG case. The OA concentration in SMA increased steadily, reaching 13.6, 14.0, and 23.6 μg/m3 on 18 May, 20 May, and 22 May, respectively. In BMA, the OA measured in the upper layer was 17.3 and 14.8 μg/m3 on 18 May and 20 May, respectively, showing similar peaks to those observed in SMA. The wind speed in SMA was 3.9 ± 1.9 m/s, which was lower than the average value (7.1 ± 6.0 m/s) over the entire KORUS-AQ period. In BMA, the observed wind speed was 3.8 ± 1.8 m/s, which was similarly lower (by approximately 50%) to that in SMA (6.9 ± 6.4 m/s) over the entire KORUS-AQ period. During the STG period, the OA concentration increased in both areas. The high OA concentrations in both ground-level and upper-layer observations were undoubtedly attributable to the accumulation of OA due to low surface wind speeds and inactive vertical mixing under the STG synoptic conditions.
In the STG case, the influences of the atmospheric boundary layer (ABL) can also be seen to some extent. For example, on 18 May, nitrates, sulfates, and OAs showed almost identical or similar vertical distributions at an altitude of less than 2 km, at which all concentrations approached zero. These vertical characteristics implied active vertical mixing in the ABL over SMA. All of the nitrate, sulfate, and OA concentrations were almost zero at an altitude of more than 2 km in SMA. These strong trappings of pollutants below ~2 km were also observed on 22 May. However, the characteristics of vertical distribution in BMA showed rather different vertical profiles from the surface up to 2 km. The highest OA peak was seen at around 1.5 km on 18 May, and at around 0.5 km on 22 May. This suggests indirectly that it might be affected by the local circulations with the easterly on 17–18 May, which is well suited to the geographic distribution of BMA, as indicated in Figure 1. As the sea breeze limits the vertical mixing, since it is a relatively cool layer close to the surface and is therefore stable, the relevant local redistributions associated with the sea breeze and small-scale local circulations in BMA might be related to the elevated (but lower than 2 km) peaks of pollutants on 17–18 May and 20 May, which were not found in SMA at all. Therefore, the expected roles of the penetrated stable layer, which acts as a lid to the vertical dispersion of the pollutants in BMA, could be further studied in order to understand the vertical structures in BMA, a typical coastal urban area in Korea.
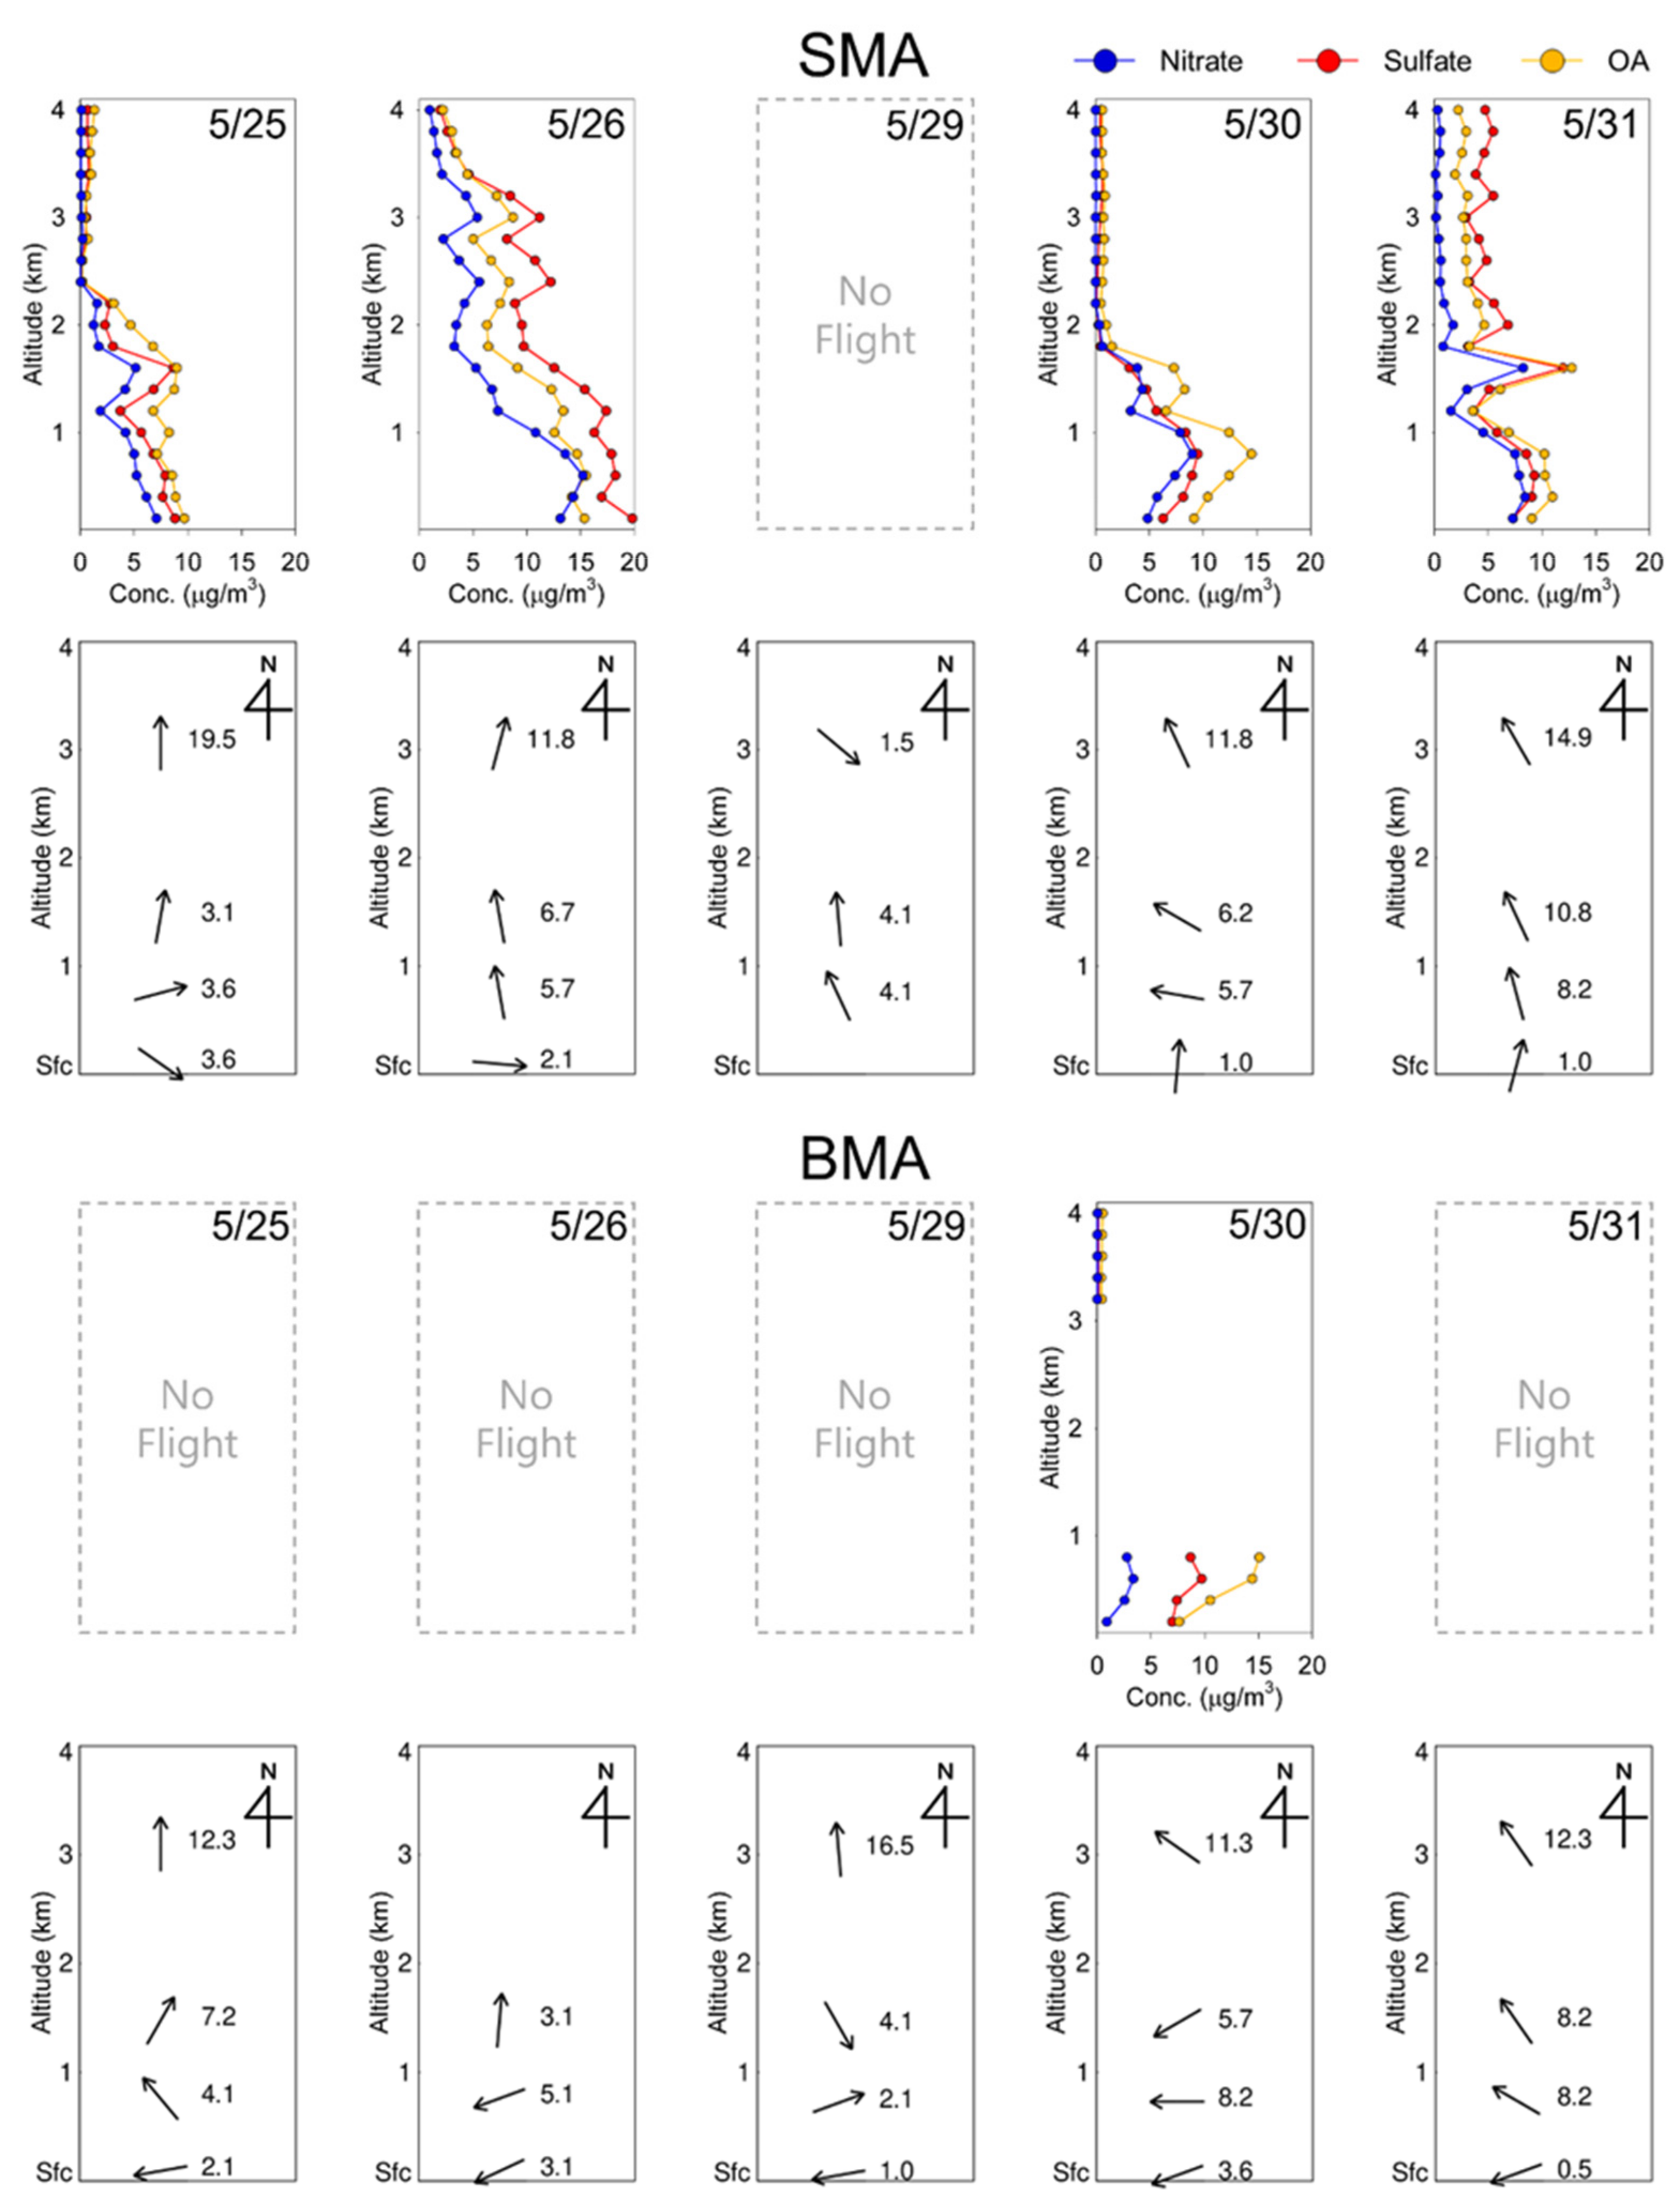
Vertical distributions of the average concentrations of nitrates, sulfates, and OAs, along with wind direction and speed during the LRT case, are also shown in Figure 7. The concentrations of all chemical components in the upper layer over SMA increased during the LRT period. As shown in Figure 7, a high-concentration plume was detected at an altitude of 1–2 km on 25–30 May in the case of LRT. On 26 May, high-concentration plumes were present at about 1–3.5 km. These vertical high-concentration layers indicate the inflow of transported pollutants from outside the study area at specific altitudes of 1–3.5 km over SMA. However, we were unable to verify the presence of upper-level elevated concentrations, as no aircraft observations were available (except for 30 May) over BMA. A vertical atmospheric structure and vertical movements of long-range transported pollutants are key factors affecting predictions of surface air quality in leeward regions [33]. Thus, more detailed or better-designed sampling campaigns in BMA are needed to confirm the presence of vertical concentration distribution patterns similar to those observed in SMA.
The two synoptic cases showed differences in their vertical distributions by wind speed and direction. In the STG case, the changes in nitrate and sulfate concentrations were small, whereas the change in OA was significant. In addition, little change in vertical concentrations was found with altitude. These results were mainly driven by the high temperature and generally low wind speed of the STG case, which supported the accumulation of OA. In the LRT case, in contrast, the nitrate, sulfate, and OA concentrations decreased more sharply with altitude. The main difference between the LRT and STG cases is that high-concentration peaks at high altitudes appeared only in the LRT case at around 1–3 km. These LRT features indicate the inflow of pollutants at specific altitudes, and broader distributions at higher altitudes. Overall, the concentration of OAs was exceptionally high in the upper layer, without secondary peaks, in the case of STG, whereas the nitrate and sulfate concentrations were high in the LRT case. This difference is presumably due to the difference in atmospheric chemical and physical environments inside and outside of the receptor areas affecting SIA or SOA generation mechanisms in source areas, or during the LRT process [34,35]. This finding highlights the importance of investigating the vertical behaviors of these species-specific chemical reactions in the upper and lower atmospheric layers in and around the Korean Peninsula. Other physical and chemical features of the difference between STG and LRT can be found in numerous studies [36,37,38,39].
Aside from SIA components, it seems unlikely that OA is relevant to the local anthropogenic VOC emissions even under the specific meteorological conditions. One of the major causes for this is that there were very few cases of BMA aircraft measurements. This implies that SOA formations including local gas-phase VOC-O3 photochemical reactions should be unveiled through better-designed aircraft experiments, together with comprehensive modeling studies for a considerable time period, and laboratory experiments (i.e., smog-chamber experiments) if necessary.

4. Summary and Conclusions

In this study, chemical components of PM in the upper and lower layers of the atmosphere were comparatively analyzed in two representative metropolitan areas of Korea: SMA and BMA. First, emission features in the two metropolitan areas were characterized based on CAPSS data, and ground measurements and aircraft observations were assessed for the KORUS-AQ campaign period. The results of the analysis of the CAPSS data showed that NOx emissions in SMA were higher than those in BMA, whereas SO2 emissions were significantly higher, by a factor of 8.7, in BMA than in SMA. VOC emissions in the two areas were comparable. The summer-averaged ground measurements indicated that the predominant factor in SMA was nitrate, whereas that in BMA was sulfate. However, summer-averaged OC was higher in BMA, which is inconsistent with the trend of VOC emissions, presumably due to complex and non-linear factors affecting the SOA generation mechanism.
The DC-8 aircraft measurements obtained during the KORUS-AQ campaign were explored in both metropolitan areas. In most cases, the results showed nitrogen-rich characteristics in SMA based on both the ground and aircraft measurements, reflecting the emissions characteristics of the precursors in that area. On the other hand, sulfur-rich characteristics in BMA were not clear from either ground or aircraft-observations, and further studies of emission–concentration relationships with the consideration of sulfur chemistry are needed to identify local SIA characteristics in BMA. Aircraft-measured OA levels were characterized during KORUS-AQ, and higher upper-layer OA concentrations were found in SMA. The high OA levels present at high altitudes in SMA were discussed from the perspective of photochemistry, and we confirmed that higher temperature and lower wind speed in SMA compared to BMA could be important factors driving this difference during the KORUS-AQ campaign period.
Two synoptic cases, STG and LRT, were compared using ground-based and upper-level measurements collected during the KORUS-AQ campaign. The N/S ratios measured at ground level and in the upper layers were higher in SMA than in BMA for both the STG and LRT cases. However, OA reflected local emissions characteristics only in the STG case, suggesting that synoptic atmospheric conditions are of great importance for determining local secondary aerosol generation characteristics. In the LRT case, the nitrate and sulfate in the upper atmosphere were shown to be higher than those in the STG case, and were sometimes higher in SMA than in BMA, implying that, although nitrate began to increase in SMA in 2014, long-range transported sulfate remained an important component of the long-range transported PM2.5 mass concentrations during the KORUS-AQ campaign period. In addition, all chemical compounds in the LRT case showed remarkably high peaks at altitudes of 1–3.5 km, indicating the transport of a pollutant plume, generated secondarily in an outside source area.
This study presents a measurement-based diagnostic analysis of the localization of secondary aerosol generation in two representative urban areas of Korea. However, our results were based on aircraft measurement data collected over a limited period, so research using comprehensive data, including aircraft-based and remote sensing measurements, as well as analytical and numerical analyses, are needed to draw more solid conclusions about secondary aerosol characteristics in urban areas of Korea.

Supplementary Materials

The followings are available online at https://www.mdpi.com/article/10.3390/atmos12111451/s1, Table S1. Summary of paired comparisons of PM2.5 emission characteristics between Seoul metropolitan area (SMA) and Busan-containing metropolitan area (BMA), Table S2. Abbreviation list.

Author Contributions

Conceptualization, J.-M.K.; Data curation, H.-J.L., H.-Y.J. and Y.-J.J.; Formal analysis, J.-M.K.; Investigation, C.-H.K.; Methodology, J.-M.K.; Visualization, H.-J.L., H.-Y.J. and Y.-J.J.; Writing—Original draft, J.-M.K.; Writing—Review and editing, C.-H.K. All authors have read and agreed to the published version of the manuscript.

Funding

This research was supported by Basic Science Research Program through the National Research Foundation of Korea (NRF) funded by the Ministry of Education (No. 2020R1A6A1A03044834). Special thanks are given to anonymous reviewers for their helpful comments.

Institutional Review Board Statement

Not applicable.

Informed Consent Statement

Not applicable.

Data Availability Statement

The aircraft measurement data during KORUS-AQ campaign period from 1 May to 12 June 2016, are available online at https://www-air.larc.nasa.gov/missions/korus-aq/, accessed on 28 October 2021.

Conflicts of Interest

The authors declare no conflict of interest.

References

  1. Lonati, G.; Giugliano, M.; Butelli, P.; Romele, L.; Tardivo, R. Major Chemical Components of PM2.5 in Milan (Italy). Atmos. Environ. 2005, 39, 1925–1934. [Google Scholar] [CrossRef]
  2. Zhang, W.; Peng, X.; Bi, X.; Cheng, Y.; Liang, D.; Wu, J.; Tian, Y.; Zhang, Y.; Feng, Y. Source Apportionment of PM2.5 Using Online and Offline Measurements of Chemical Components in Tianjin, China. Atmos. Environ. 2021, 244, 117942. [Google Scholar] [CrossRef]
  3. Ricciardelli, I.; Bacco, D.; Rinaldi, M.; Bonafè, G.; Scotto, F.; Trentini, A.; Bertacci, G.; Ugolini, P.; Zigola, C.; Rovere, F.; et al. A Three-year Investigation of Daily PM2.5 Main Chemical Components in Four Sites: The Routine Measurement Program of the Supersito Project (Po Valley, Italy). Atmos. Environ. 2017, 152, 418–430. [Google Scholar] [CrossRef]
  4. Choi, J.K.; Heo, J.B.; Ban, S.J.; Yi, S.M.; Zoh, K.D. Chemical Characteristics of PM2.5 Aerosol in Incheon, Korea. Atmos. Environ. 2021, 60, 583–592. [Google Scholar] [CrossRef]
  5. Mbengue, S.; Fusek, M.; Schwarz, S.; Vodička, P.; Šmejkalová, A.H.; Holoubek, I. Four Years of Highly Time Resolved Measurements of Elemental and Organic Carbon at a Rural Background Site in Central Europe. Atmos. Environ. 2018, 182, 335–346. [Google Scholar] [CrossRef]
  6. Plaza, J.; Artíñano, B.; Salvador, P.; Gómez-Moreno, F.J.; Pujadas, M.; Pio, C.A. Short-term Secondary Organic Carbon Estimations with a Modified OC/EC Primary Ratio Method at a Suburban Site in Madrid (Spain). Atmos. Environ. 2011, 45, 2496–2506. [Google Scholar] [CrossRef]
  7. Zhong, Y.; Chen, J.; Zhao, Q.; Zhang, N.; Feng, J.; Fu, Q. Temporal Trends of the Concentration and Sources of Secondary Organic Aerosols in PM2.5 in Shanghai during 2012 and 2018. Atmos. Environ. 2021, 261, 118596. [Google Scholar] [CrossRef]
  8. Kim, C.H.; Lee, H.J.; Kang, J.E.; Jo, H.Y.; Park, S.Y.; Jo, Y.J.; Lee, J.J.; Yang, G.H.; Park, T.H.; Lee, T.H. Meteorological Overview and Signatures of Long-range Transport Processes during the MAPS-Seoul 2015 Campaign. Aerosol Air Qual. Res. 2018, 18, 2173–2184. [Google Scholar] [CrossRef] [Green Version]
  9. Kim, C.H.; Chang, L.S.; Kim, J.S.; Meng, F.; Kajino, M.; Ueda, H.; Zhang, Y.; Son, H.Y.; He, Y.; Xu, J.; et al. Long-term Simulations of the Sulfur Concentrations over the China, Japan and Korea: A Model Comparison Study. Asia-Pacific J. Atmos. Sci. 2011, 47, 399–411. [Google Scholar] [CrossRef]
  10. Crawford, J.H.; Ahn, J.Y.; Al-Saadi, J.; Chang, L.; Emmons, L.K.; Kim, J.; Lee, G.; Park, J.H.; Park, R.J.; Woo, J.H.; et al. The Korea–United States Air Quality (KORUS-AQ) field study. Elementa-Sci. Anthrop. 2021, 9, 00163. [Google Scholar] [CrossRef]
  11. Nault, B.A.; Campuzano-Jost, P.; Day, D.A.; Schroder, J.C.; Anderson, B.; Beyersdorf, A.J.; Blake, D.R.; Brune, W.H.; Choi, Y.; Corr, C.A.; et al. Secondary Organic Aerosol Production from Local Emissions Dominates the Organic Aerosol Budget over Seoul, South Korea, during KORUS-AQ. Atmos. Chem. Phys. 2018, 18, 17769–17800. [Google Scholar] [CrossRef] [Green Version]
  12. Kim, H.; Zhang, Q.; Heo, J. Influence of Intense Secondary Aerosol Formation and Long-range Transport on Aerosol Chemistry and Properties in the Seoul Metropolitan Area during Spring Time: Results from KORUS-AQ. Atmos. Chem. Phys. 2018, 18, 7149–7168. [Google Scholar] [CrossRef] [Green Version]
  13. Simpson, I.J.; Blake, D.R.; Blake, N.J.; Meinardi, S.; Barletta, B.; Hughes, S.C.; Fleming, L.T.; Crawford, J.H.; Diskin, G.S.; Emmons, L.K.; et al. Characterization, Sources and Reactivity of Volatile Organic Compounds (VOCs) in Seoul and Surrounding Regions during KORUS-AQ. Elementa-Sci. Anthrop. 2020, 8, 37. [Google Scholar] [CrossRef]
  14. Schroeder, J.R.; Crawford, J.H.; Ahn, J.Y.; Chang, L.; Fried, A.; Walega, J.; Weinheimer, A.; Montzka, D.D.; Hall, S.R.; Ullmann, K.; et al. Observation-based Modeling of Ozone Chemistry in the Seoul Metropolitan Area during the Korea-United States Air Quality Study (KORUS-AQ). Elementa-Sci. Anthrop. 2020, 8, 3. [Google Scholar] [CrossRef]
  15. Park, S.Y.; Lee, H.J.; Kang, J.E.; Lee, T.; Kim, C.H. Aerosol Radiative Effects on Mesoscale Cloud–Precipitation Variables over Northeast Asia during the MAPS-Seoul 2015 Campaign. Atmos. Environ. 2018, 172, 109–123. [Google Scholar] [CrossRef]
  16. Kim, H.; Gil, J.; Lee, M.; Jung, J.; Whitehill, A.; Szykman, J.; Lee, G.; Kim, D.S.; Cho, S.; Ahn, J.Y.; et al. Factors Controlling Surface Ozone in the Seoul Metropolitan Area during the KORUS-AQ Campaign. Elementa-Sci. Anthrop. 2020, 8, 46. [Google Scholar] [CrossRef]
  17. Yang, G.H.; Jo, Y.J.; Lee, H.J.; Song, C.K.; Kim, C.H. Numerical Sensitivity Tests of Volatile Organic Compounds Emission to PM2.5 Formation during Heat Wave Period in 2018 in Two Southeast Korean Cities. Atmosphere 2020, 11, 331. [Google Scholar] [CrossRef] [Green Version]
  18. Kim, T.K.; Song, S.K.; Lee, H.W.; Kim, C.H.; Oh, I.B.; Moon, Y.S.; Shon, Z.H. Characteristics of Asian Dust Transport Based on Synoptic Meteorological Analysis over Korea. J. Air Waste Manag. Assoc. 2006, 56, 306–316. [Google Scholar] [CrossRef] [Green Version]
  19. Kim, C.H.; Son, H.Y. Measurement and Interpretation of Time Variations of Particulate Matter Observed in the Busan Coastal Area in Korea. Asian J. Atmos. Environ. 2011, 5, 105–112. [Google Scholar] [CrossRef]
  20. Tai, A.P.; Mickley, L.J.; Jacob, D.J. Correlations between Fine Particulate Matter (PM2.5) and Meteorological Variables in the United States: Implications for the Sensitivity of PM2.5 to Climate Change. Atmos. Environ. 2010, 44, 3976–3984. [Google Scholar] [CrossRef]
  21. Wang, D.; Zhou, B.; Fu, Q.; Zhao, Q.; Zhang, Q.; Chen, J.; Yang, X.; Duan, Y.; Li, J. Intense Secondary Aerosol Formation due to Strong Atmospheric Photochemical Reactions in Summer: Observations at a Rural Site in Eastern Yangtze River Delta of China. Sci. Total Environ. 2016, 571, 1454–1466. [Google Scholar] [CrossRef]
  22. Kim, J.M.; Jo, Y.J.; Yang, G.H.; Heo, G.; Kim, C.H. Analysis of Recent Trends of Particulate Matter Observed in Busan—Comparative Study on Busan vs. Seoul Metropolitan Area (I). J. Environ. Sci. Int. 2020, 29, 177–189. [Google Scholar] [CrossRef]
  23. Kim, B.G.; Han, J.S.; Park, S.U. Transport of SO2 and Aerosol over the Yellow Sea. Atmos. Environ. 2001, 35, 727–737. [Google Scholar] [CrossRef]
  24. Lee, H.J.; Jo, H.Y.; Song, C.K.; Jo, Y.J.; Park, S.Y.; Kim, C.H. Sensitivity of Simulated PM2.5 Concentrations over Northeast Asia to Different Secondary Organic Aerosol Modules during the KORUS-AQ Campaign. Atmosphere 2020, 11, 1004. [Google Scholar] [CrossRef]
  25. Park, R.J.; Oak, Y.J.; Emmons, L.K.; Kim, C.H.; Pfister, G.G.; Carmichael, G.R.; Saide, P.E.; Cho, S.Y.; Kim, S.; Woo, J.H.; et al. Multi-Model Intercomparisons of Air Quality Simulations for the KORUS-AQ Campaign. Elementa-Sci. Anthrop. 2021, 9, 00139. [Google Scholar] [CrossRef]
  26. Park, S.Y.; Kim, C.H. Interpretation of Aerosol Effects on Precipitation Susceptibility in Warm Clouds Inferred from Satellite Measurements and Model Evaluation over Northeast Asia. J. Atmos. Sci. 2020, 78, 1947–1963. [Google Scholar] [CrossRef]
  27. Lee, H.J.; Jo, H.Y.; Park, S.Y.; Jo, Y.J.; Jeon, W.; Ahn, J.Y.; Kim, C.H. A Case Study of the Transport/Transformation of Air Pollutants Over the Yellow Sea During the MAPS 2015 Campaign. J. Geophys. Res-Atmos. 2019, 124, 6532–6553. [Google Scholar] [CrossRef]
  28. NIER (National Institute of Environmental Research). Construction and Improvement of Air Quality Modeling System Based on the Measurement (III); NIER: Incheon, Korea, 2019. [Google Scholar]
  29. Ahmadov, R.; McKeen, S.A.; Robinson, A.L.; Bahreini, R.; Middlebrook, A.M.; de Gouw, J.A.; Meagher, J.; Hsie, E.Y.; Edgerton, E.; Shaw, S.; et al. A Volatility Basis Set Model for Summertime Secondary Organic Aerosols over the Eastern United States in 2006. J. Geophys. Res-Atmos. 2012, 117, D06301. [Google Scholar] [CrossRef]
  30. Jo, Y.J.; Lee, H.J.; Jo, H.Y.; Woo, J.H.; Kim, Y.H.; Lee, T.H.; Heo, G.Y.; Park, S.M.; Jung, D.H.; Park, J.H.; et al. Changes in Inorganic Aerosol Compositions over the Yellow Sea Area from Impact of Chinese Emissions Mitigation. Atmos. Res. 2020, 240, 104948. [Google Scholar] [CrossRef]
  31. Peterson, D.A.; Hyer, E.J.; Han, S.O.; Crawford, J.H.; Park, R.J.; Holz, R.; Kuehn, R.E.; Eloranta, E.; Knote, C.; Jordan, C.E.; et al. Meteorology Influencing Springtime Air Quality, Pollution Transport, and Visibility in Korea. Elementa-Sci. Anthrop. 2019, 7, 57. [Google Scholar] [CrossRef]
  32. Jo, H.Y.; Kim, C.H. Identification of Long-Range Transported Haze Phenomena and Their Meteorological Features over Northeast Asia. J. Appl. Meteorol. Climatol. 2013, 52, 1318–1328. [Google Scholar] [CrossRef]
  33. Lee, H.J.; Jo, H.Y.; Kim, S.W.; Park, M.S.; Kim, C.H. Impacts of Atmospheric Vertical Structures on Transboundary Aerosol Transport from China to South Korea. Sci. Rep. 2019, 9, 13040. [Google Scholar] [CrossRef] [PubMed]
  34. Kim, C.H.; Meng, F.; Kajino, M.; Lim, J.H.; Tang, W.; Lee, J.J.; Kiriyama, Y.; Woo, J.H.; Sato, K.; Kitada, T.; et al. Comparative Numerical Study of PM2.5 in Exit-and-Entrance Areas Associated with Transboundary Transport over China, Japan, and Korea. Atmosphere 2021, 12, 469. [Google Scholar] [CrossRef]
  35. Kim, C.H.; Park, S.Y.; Kim, Y.J.; Chang, L.S.; Song, S.K.; Moon, Y.S.; Song, C.K. A Numerical Study on Indicators of Long-range Transport Potential for Anthropogenic Particulate Matters over Northeast Asia. Atmos. Environ. 2012, 58, 35–44. [Google Scholar] [CrossRef]
  36. Park, D.H.; Kim, S.W.; Kim, M.H.; Yeo, H.D.; Park, S.S.; Nishizawa, T.; Shimizu, A.; Kim, C.H. Impacts of Local Versus Long-range Transported Aerosols on PM10 Concentrations in Seoul, Korea: An Estimate Based on 11-year PM10 and Lidar Observations. Sci. Total Environ. 2021, 750, 141739. [Google Scholar] [CrossRef] [PubMed]
  37. Lee, K.H.; Kim, K.H.; Lee, J.H.; Yun, J.Y.; Kim, C.H. Modeling of Long Range Transport Pathways for Radionuclides to Korea During the Fukushima Dai-ichi Nuclear Accident and Their Association with Meteorological Circulations. J. Environ. Radioact. 2015, 148, 80–91. [Google Scholar] [CrossRef] [PubMed]
  38. Lee, H.J.; Jo, H.Y.; Nam, K.P.; Lee, K.H.; Kim, C.H. Measurement, Simulation, and Meteorological Interpretation of Medium-range Transport of Radionuclides to Korea During the Fukushima Dai-ichi Nnuclear Aaccident. Ann. Nucl. Energy 2017, 103, 412–423. [Google Scholar] [CrossRef]
  39. Park, I.S.; Lee, S.J.; Kim, C.H.; Yoo, C.; Lee, Y.H. Simulating Urban-Scale Air Pollutants and Their Predicting Capabilities over the Seoul Metropolitan Area. J. Air Waste Manag. 2004, 54, 695–710. [Google Scholar] [CrossRef] [Green Version]
Figure 1. DC-8 flight pathways during the KORUS-AQ campaign, the domains of SMA (Seoul metropolitan area) and BMA (Busan-containing metropolitan area), and the locations of monitoring and sounding meteorological stations for SMA and BMA within South Korea. Gray lines indicate flight pathways during KORUS-AQ.
Atmosphere 12 01451 g001
Figure 2. Emissions (annual), summertime (June–August) ground observations, and N/S ratios in SMA and BMA.
Atmosphere 12 01451 g002
Figure 3. Aircraft-based (KORUS-AQ) upper-layer measurements versus ground-level observations of nitrates, sulfates, and OC in SMA and BMA.
Atmosphere 12 01451 g003
Figure 4. N/S ratios of aircraft measurements versus ground-based observations over SMA and BMA for the entire KORUS-AQ campaign.
Atmosphere 12 01451 g004
Figure 5. Time series of chemical components of PM2.5 over periods of stagnant and long-range transport during KORUS-AQ. Synoptic maps for both periods are also shown. Two 850 hPa synoptic maps from 18 May (right, top) and 25 May (right, bottom) are also shown as representative days for both periods.
Atmosphere 12 01451 g005
Figure 6. Aircraft-measured vertical distributions of chemical components during KORUS-AQ and observed wind profiles for the stagnant period (18–23 May).
Atmosphere 12 01451 g006
Figure 7. Same results as those shown in Figure 6, but for the long-range transport period (25–31 May).
Atmosphere 12 01451 g007
Publisher’s Note: MDPI stays neutral with regard to jurisdictional claims in published maps and institutional affiliations.