Review

Air Pollution in New Delhi during Late Winter: An Overview of a Group of Campaign Studies Focusing on Composition and Sources

1
Department of Civil Engineering, Indian Institute of Technology Kanpur, Kanpur 208016, India
2
Institute for Advanced Sustainability Studies, 14467 Potsdam, Germany
3
Physical Research Laboratory, Space and Atmospheric Sciences Division, Ahmedabad 380009, India
4
Physical Research Laboratory, Geosciences Division, Ahmedabad 380009, India
*
Author to whom correspondence should be addressed.
Atmosphere 2021, 12(11), 1432; https://doi.org/10.3390/atmos12111432
Submission received: 21 August 2021 / Revised: 24 October 2021 / Accepted: 25 October 2021 / Published: 29 October 2021

Abstract

:
In recent times, a significant number of studies on the composition and sources of fine particulate matters and volatile organic compounds have been carried out over Delhi, either initiated by or in association with the researchers from the Indian Institute of Technology Kanpur (IIT Kanpur), in collaboration with researchers from within and outside India. All these studies utilized highly time-resolved, campaign-mode observations made with state-of-the-art instrumentation during the late winter months (mid-January to March) of 2018. Individually, each of these studies were rigorous in nature, containing explicit detailing about different types of ambient air pollutants in Delhi such as organic aerosols, inorganic elements, metals, carbonaceous aerosols, and volatile organic compounds. This study consolidates the extremely useful knowledge on source attribution of these air pollutants in the Delhi National Capital Region currently contained in these fragmented studies, which is vital to further enhancing our understanding of composition, characteristics, and sources of air pollutants over Delhi, as well as to designing appropriate mitigation measures tailored to local specifics.

Graphical Abstract

1. Introduction

Delhi, the capital of India, experiences extreme level of air pollution. In a recent study [1] it was reported that the PM2.5 level in Delhi exceeded the Indian National Ambient Air Quality Standards (NAAQs) on 200 days in a year. Especially in winter, the pollution level being coupled with the dynamics of the shallow planetary boundary layer (PBL), the situation becomes worse than other seasons [2]. It has been reported that the adverse health impact of ambient air pollution (due to both PM2.5 and PM10) has taken around 1.7 million lives in India every year on average since 1990 [3,4], and this makes it utterly important to measure and monitor particulate matters of all sizes. Recent studies revealed that PM2.5 can be a potential parameter to promote the transmission of COVID-19 [5,6]. However, it has been mentioned that the role of air pollution in the COVID-19 pandemic needs further analysis to assess whether aerosols are able to carry the virus, or the higher concentration of pollutant aerosol only turns mild cases into severe [6]. Studies from the last two decades reported consistent high concentration of fine particulate pollutant in Delhi. Srivastava et al. using 2005–2006 wintertime measurements, reported that the mean concentration of fine mode particulates in Delhi was 183 ± 26.9 µg m−3 [7]. A similar observation reported by Tiwari et al. found the concentrations of PM2.5 (aggregate mass of particles with aerodynamic diameter ≤ 2.5 µm) in winter (from December 2011–March 2012) were 186.5 ± 149.7 µg m−3, which is much higher than the Indian NAAQ’s limit of 40 µg m−3 for annual PM2.5 concentration [8]. Although these studies performed source apportionment, they could reveal only few major sources such as vehicular emission, coal combustion, and crustal dust [7,8]. Pant et al. in 2015, reported an average PM2.5 concentration during winter (15 December 2013 to 15 January 2014) of 276.9 ± 99.9 µg m−3 [2]. Sharma et al. in 2016, reported, using observations from January 2013 to December 2014, that the average mass concentration of PM2.5 during winter months was 216 ± 93.2 µg m−3 (with 22.3% of PM2.5 composed of major and trace elements); and using the PMF (positive matrix factorization) model, major sources of PM2.5 were determined as secondary aerosols (21.3%), followed by soil dust (20.5%), vehicle emissions (19.7%), biomass burning (14.3%), fossil fuel combustion (13.7%), industrial emissions (6.2%), and sea salt (4.3%) [9]. More precise determination of the composition and sources of pollutants in the atmosphere of Delhi National Capital Region (NCR) have become utterly necessary day by day, for mitigation purposes and due to several other policymaking issues. In recent times (mostly in 2018), a group of rigorous studies was carried out based on campaign observations (both in online and offline modes) over Delhi, either initiated by or conducted in association with the air quality researchers of the Indian Institute of Technology Kanpur (IIT), in collaboration with researchers from national and international institutes. The common period in all these studies was between mid-January andmid-March of 2018, which is considered the late winter period. Most importantly, all these studies investigated the chemical composition and source apportionment of fine particulate matter, carbonaceous aerosols, elements in aerosols, and gaseous volatile organic compounds (VOCs) [10,11,12,13,14,15]. More specifically, Tobler et al. and Lalchandani et al. studied the highly time-resolved chemical characterization of fine particulate matter and source apportionment of organic aerosols and black carbon [10,11]. Rai et al. worked on the quantification, chemical composition, and source apportionment of highly time-resolved elements in PM10 and PM2.5 (with an aggregate mass of particles with aerodynamic diameter less or equal to 10 µm and 2.5 µm, respectively) [12]. Temporal and spatial variability of carbonaceous species in PM2.5 was studied by Bhowmik et al. using filter sampling at five sites on the Indo-Gangetic Plain (IGP) and their offline analysis [14]; and very recently, characteristics and sources of light-absorbing fine particulates were examined by Singh et al. [15]. Rastogi et al., in 2021, reported on the diurnal variability in the entire spectra (300 to 600 nm) of water-soluble brown carbon (WS-BrC), which revealed many interesting features of WS-BrC [16]. Wang et al. investigated the characteristics and sources of VOCs [13]. Puthussery et al. conducted a study on the measurements of the oxidative potential of PM2.5 to link the aerosol exposure to its adverse health effects [17]. Regarding the need for these hours of research, the aforementioned studies have contributed to a very crucial dimension of investigation, analysis, and assessment of Delhi’s air quality. Singh et al. and Puthussery et al. conducted their study in 2019, but in the rest of the studies, the common period of sampling/measurements was the late winter months (mid-January to mid-March) of 2018. These extensive research works individually presented exclusive details about different types of air pollutants in Delhi. Now, the purpose of this study is to provide an overview of all these fragmented studies in order to give a comprehensive synthesis about their important findings. This can increase the applicability of these fragmented studies and will help reduce the knowledge gaps, supporting the design of future studies as well as policy developments. Within this framework, the discussions in the following sections will focus on the components of fine pollutant particulate matter and VOCs, and their measurement and source apportionment precisely.

2. Sites and Instruments Used in Past Studies

In this section, a brief description of the instruments that have been used in the aforementioned group of studies is presented. The set of instruments used in these studies make it possible to perform collocated monitoring of a broad range of chemical compounds present in aerosols in the atmosphere, including nonrefractory particulate matters (NR PM2.5), BC, major ions, metals, and VOCs, both in online and offline mode. This group of studies presented the measurements of the individual parameters and described the corresponding instrument details in the respective papers. The sampling sites in Delhi for these studies were the Indian Institute of Technology Delhi (IITDelhi) (28.54° N, 77.19° E) and the Indian Institute of Tropical Meteorology Delhi (IITMDelhi) (28.62° N, 77.17° E), as well as a third site located at Faridabad, Haryana, around 40 km northwest of New Delhi, the Manav Rachna International Institute of Research and Studies (MRIIRS) (28.45° N, 77.28° E). To investigate the evolution of PM2.5 concentration and composition with high time resolution in New Delhi, Tobler et al., used a time-of-flight aerosol chemical speciation monitor (ToF-ACSM) (Aerodyne Research Inc., Billerica, MA, USA) [11,18] and an aethalometer (Magee Scientific, model AE-33). Lalchandani et al. used a high-resolution long-time-of-flight aerosol mass spectrometer (L-ToF-AMS) equipped with a PM2.5 aerodynamic lens (Aerodyne Research Inc., Billerica, MA, USA) at the IITDelhi site; a ToF-ACSM at the IITMDelhi site; and a high-resolution time-of-flight aerosol mass spectrometer (HR-ToF-AMS) at the MRIIRS site. An aethalometer (AE-33) and a single-particle soot photometer (SP2) were also used in their study for the measurement of BC aerosol [10]. An Xact 625i® Ambient Metals Monitor (Cooper Environmental Services, Tigard, ON, USA) was used by Rai et al. [12] at the IITDelhi site, and Wang et al. used a proton-transfer-reaction time-of-flight mass spectrometer (PTR-ToF-MS 8000) (Ionicon Analytical GmbH, Innsbruck, Austria) to measure gaseous VOCs at IITDelhi and MRIIRS [13]. On the other hand, for the offline analysis at IITDelhi site, a high-volume sampler (HVS) was used to collect PM2.5 samples on quartz filter media. The post-sampling offline analysis was carried out for elemental carbon (EC) and organic carbon (OC) using an EC-OC analyzer, for water-soluble organic carbon (WSOC) using TOC-L analyzer, for major anions and cations using an ion chromatograph (IC), and for and heavy and trace metals using inductively coupled plasma mass spectroscopy (ICP-MS). Moreover, a real-time oxidative potential (OP) instrument to measure health-related metrics was introduced in the study by Puthussery et al. at the IITDelhi site [17]. In this section, the instruments are very briefly described; elaborate discussions of individual instruments are available in the corresponding papers as cited. The information on the instruments for measuring different pollutant parameters at different sites are presented in Table 1, followed by short details in the text.

2.1. High-Resolution Time-of-Flight Aerosol Mass Spectrometer (HR-ToF-AMS)

The HR-ToF-AMS is used to measure size-resolved mass spectra of the nonrefractory (NR) fraction of either PM1 or PM2.5 (respectively denoted as NR-PM1 and NR-PM2.5), depending on the installed inlet and aerodynamic lens. The detailed working principles of the HR-ToF-AMS were described by DeCarlo et al. [19]. In brief, aerosol particles are sampled through a 100 μm diameter critical orifice, and particles entering the aerodynamic lens system are focused into a narrow beam. A combination of inlet and aerodynamic lens systems allows particles of vacuum aerodynamic diameter less than 1 or 2.5 μm [19]. The focused particle beam approaches the sizing chamber, where the particle size is determined by measuring the time taken by the particle to travel the fixed length of the sizing chamber. The particle beam then impacts a vaporizer heated at 600 °C, which evaporates the nonrefractory particles. The resulting gas molecules are ionized by electron ionization at 70 eV, and the ions formed are detected by a time-of-flight mass spectrometer according to their mass-to-charge ratio (m/z). An L-ToF-AMS has similar working principles and operation as an HR-ToF-AMS, but with an approximately twofold length of the mass spectrometer compared to an HR-ToF-AMS, enabling it provide twice the mass resolution that an HR-ToF-AMS provides in V-mode.

2.2. Time-of-Flight Aerosol Chemical Speciation Monitor

The ToF-ACSM has similar working principles to AMS, except for the capability of measuring the size of the particles. An ACSM measures ambient air and particle-free air generated using a particle filter in the sampling line, alternatively every 20 s, and the difference between the two mass spectra represents the particle mass spectra. A detailed description of the ToF-ACSM can be found in Fröhlich et al. [18].

2.3. Proton-Transfer-Reaction Time-of-Flight Mass Spectrometer (PTR-ToF-MS)

Wang et al. used a proton-transfer-reaction time-of-flight mass spectrometer (PTR-ToF-MS) to measure VOCs for their study in 2018 [13]. The PTR-ToF-MS measures nonmethane organic gases (NMOG) with a proton affinity higher than water, which is the most common features of VOCs. Data collected in this study included the mixing ratios of VOCs, NOx, and CO, and meteorological parameters. A detailed description of the instrument can be found in Jordan et al. [20].

2.4. Aethalometer (Model AE-33)

An aethalometer measures the light attenuation by particles collected on a quartz fiber filter at seven wavelengths (370, 470, 520, 590, 660, 880, and 950 nm) The equivalent black carbon (eBC) concentrations are estimated using the mass absorption cross section (MAC)value of 7.77 m2 g−1 for the measurement at the 880 nm wavelength. The aethalometer (AE33) used by Tobler et al. and Lalchandani et al. for their studies at IITDelhi and IITMDelhi was a dual spot aethalometer, which was capable of taking into account and compensating for light attenuation and surface loading effects. Details of the AE33 have been discussed elsewhere [11,21].

2.5. PILS-LWCC-TOC Analyzer

Online measurements of BrC were performed using an assembled system including a particle-into-liquid sampler, a portable UV–visible spectrophotometer with a liquid waveguide capillary cell, and a total carbon analyzer (PILS-LWCC-TOC). This assembled system was capable of measuring the absorption of ambient aerosol extracts at the wavelengths ranging from 300 to 600 nm with 2 min integration time, and water-soluble organic carbon (WSOC) with 4 min integration time over a polluted megacity, New Delhi. Details of this instrumental setup can be found elsewhere [16].

2.6. Single-Particle Soot Photometer (SP2)

A single-particle soot photometer (SP2) measures real-time BC mass concentration in the size range of 70–500 nm. SP2 uses an intracavity Nd:YAG laser beam to intercept the aerosol flow in a perpendicular plane, and heats individual BC particles to their vaporization temperature, resulting in the BC particle to emitting incandescent light. This is then detected using avalanche photodiodes and is used to estimate BC mass. The working principle and details of SP2 are explained elsewhere [22,23].

2.7. Xact 625i® Ambient Metals Monitor

An Xact 625i® ambient metals monitor (Cooper Environmental Services, Tigard, ON, USA) was used by Rai et al. in their study to measure elemental compositions of ambient aerosols [12]. It is a sampling and analysing, nondestructive, energy dispersive X-ray fluorescence (XRF) spectrometer designed for online, semicontinuous measurements of elements in aerosols. In the Xact, aerosols are sampled on a Teflon filter tape at a flow rate of 16.7 lpm. After each sampling interval of 1 h, the tape is moved forward to the analysis area, where the sample is illuminated with X-rays. The resultant excited X-ray fluorescence photons are collected with a silicon drift detector (SDD). During one XRF analysis, the next sample is collected at a clean spot on the filter tape, and then this cycle is repeated. The spectra are then analyzed and calibrated online. The Xact is calibrated using thin film standards for the individual elements. The details of the instrument are described in Rai et al. [12].

2.8. EC-OC Analyzer, TOC-L Analyzer, and Ion Chromatography

Bhowmik et al. performed offline OC-EC analysis on an EC-OC carbon analyzer (Model 4F, Sunset Laboratory Inc., Hillsborough, NC, USA) following the European Supersites for Atmospheric Aerosol Research (EUSAAR_2) protocol (Karanasiou et al., 2011) over National Institute for Occupational Safety and Health (NIOSH870) and Interagency Monitoring of Protected Visual Environments (IMPROVE_A). Quartz filter papers (Whatman; 8 × 12 inches) were used for collecting PM2.5 aerosols [14]. Water extracts from the filters were used for analyzing WSOC and major cations and anions using a TOC-L analyzer (Model SHIMADZU-TOC-L-CPN, Shimadzu Corporation) and an ion chromatograph (Metrohm 883 Basic IC plus for cations and 882 Compact IC plus for anions), respectively. The choice of protocol in OC-EC analysis and amount of water used for extraction can have an effect on the results. Details of the instrumentation and protocols can be found in [14].

2.9. Real-Time Oxidative Potential (OP) Instrument

The oxidative potential (OP), a potential health metric of particulate matter, is the ability of particles to consume antioxidants, and estimates the toxicity of particulate matters. To estimate the OP of ambient particulate matter, a dithiothreitol (DTT) assay is one of the commonly used chemical assays. DTT, in the presence of ambient particulate matters, acts as an electron donor and converts oxygen to its superoxide radical, and the rate of oxidation of DTT during this reaction (termed as DTT activity) is considered to be proportional to the amount of redox-active species present in ambient PM. Puthussery et al. performed the first-ever measurements of a health-related metric, oxidative potential (OP), in Delhi using an indigenous online instrument based on the DTT assay. The details of the instrument are provided in the article by Puthussery et al. [17]. In this instrument, PM2.5 is collected by connecting a PM2.5 cyclone inlet (42 lpm flow rate) at the inlet port of a mist chamber (MC) using a copper tube (with an outer diameter of 0.5 in). The MC is kept filled with a predefined volume of water. As air flows through the MC, mist forming inside the chamber continuously washes out the particles collected onto the PTFE filter, forming a PM2.5 suspension in water. After every hour, this PM2.5 suspension is withdrawn and fed into an analytical system. In the analytical component of the automated system, the PM2.5 suspension is mixed with potassium phosphate buffer (pH 7.4, 0.5 μM) and DTT (final concentration in the reaction vial is100 μM) and incubated at 37 °C using a thermomixer (at 400 rpm). The analytical system measures the decay of DTT with time, based on a spectrophotometric technique, coupled to a miniature online spectrophotometer assembly using dithiobis (2-nitrobenzoic acid), and determines the volume normalized DTT activity in units of nanomoles of DTT consumed per minute per cubic meter of air.

3. Overview of Groups’ Results and Discussion

3.1. Types of Fine Pollutants in the Environment of Delhi Megacity

The group of published studies we will be discussing here have investigated the composition and sources of nonrefractory particulate matter (NR-PM), BC, elements, and VOCs in the New Delhi area using highly time-resolved online measurements, some at a single site (IITDelhi) and others at multiple sites (IITDelhi, IITMDelhi, and MRIIRS). The types of air pollutants reported during the campaign in the Delhi-NCR area by these studies [10,11,12,13,14] in the late winter period of 2018 were categorized mainly as organics, chloride, ammonium, sulfate, nitrate, BC, elements, and VOCs. Lalchandani et al. found during the observation period of mid-January to mid-March at IITD that the mean hourly average of PM2.5 (eq.) concentration (sum of NR-PM2.5 and BC) was 153.8 ± 109.4 µgm−3, with a maximum concentration up to 596.2 µgm−3 (observed during the night at 10 pm) [11]. The sum of NR-PMx (x = 1 or 2.5) and BC is represented here as the equivalent PMx concentration, which does not include refractory elements such as metals. At the IITMDelhi site, it was around 127.8 ± 83.2 µgm−3, with the maximum concentration reaching up to 391.3 µgm−3 (observed during the morning at 9 am); whereas the mean hourly average PM1 (eq.) concentration during the sampling period at MRIIRS was 72.3 ± 44.0 µgm−3, with a maximum concentration of 250 µgm−3 (observed during late night at 1 am). Chloride concentrations during the campaign were noted as very high at all three campaign sites (IITDelhi, IITMDelhi, and MRIIRS), with campaign mean concentrations of 20.4 ± 30.3 µgm−3 (max. 209.5 µgm−3), 22.3 ± 27.6 µgm−3 (max. 126.4 µgm−3), and 7.7 ± 9.7 µgm−3 (max 68.2 µgm−3), respectively. Several other studies also reported high particulate chloride concentrations in Delhi [2,3]. Pant et al. reported 27.8 µgm−3 of chloride in winter and identified coal combustion, biomass burning, and waste burning as the probable sources of particulate chloride [2]. Rai et al. found the mean of the total elemental PM10 mass was ~271 µgm−3 in the 2018 (20 January–11 March) campaign, and it was ~300 µgm−3 in the 2019 (15 January–9 February) campaign; the mean of total PM2.5 mass was ~180 µgm−3 during the 2019 campaign [12]. As reported by Wang et al., the sum of mixing ratios of all VOCs was 27.6 ppbv at IITDelhi and 19.4 ppbv at MRIIRS during the study period of 18 January to 10 March 2018 [13]. The means over the sampling period of organics, nitrate, sulfate, ammonium, chloride, BC, and elemental PM2.5 reported by Lalchandani et al. and Rai et al. are listed in Table 2.

3.2. Source Apportionment of Different Types of Aerosols Using a PMF Model

In the studies by Lalchandani et al., Tobler et al., Rai et al. and Wang et al. source apportionment for the different types or sources of pollutants [10,11,12,13] was performed using the PMF model [24]. The multilinear engine (ME-2) algorithm (Paatero, 1999) was used to solve the PMF, and it was controlled via Source Finder (SoFi, Datalystica Ltd., Villigen, Switzerland) [25], interface version 6.6. The details of the model and its application are discussed in Lalchandani et al., Rai et al. and Wang et al. [10,12,13]. PMF is a receptor model. It is used to solve bilinear unmixing equations. A given quantity is factorized into a linear combination of a set of constant factor profiles and their corresponding time series. However, the limitation of PMF is that it can give mathematically accurate but not unique solutions, as it results in several linear combinations of the factor profile and time series, known as the rotations [26,27]. As a result, the factor profiles may appear in mixed status, and this will lead to an inaccurate estimation of the contribution of factors [25,28,29]. Applying ME-2, these rotations are efficiently explored by constraining one or more elements of the factor profile and/or time series in the PMF model and incorporating known information of source profile(s) and/or temporal variation as a priori information, referred to as the a-value approach. The a-value represents the degree of constraint on the known source profile and/or time series.

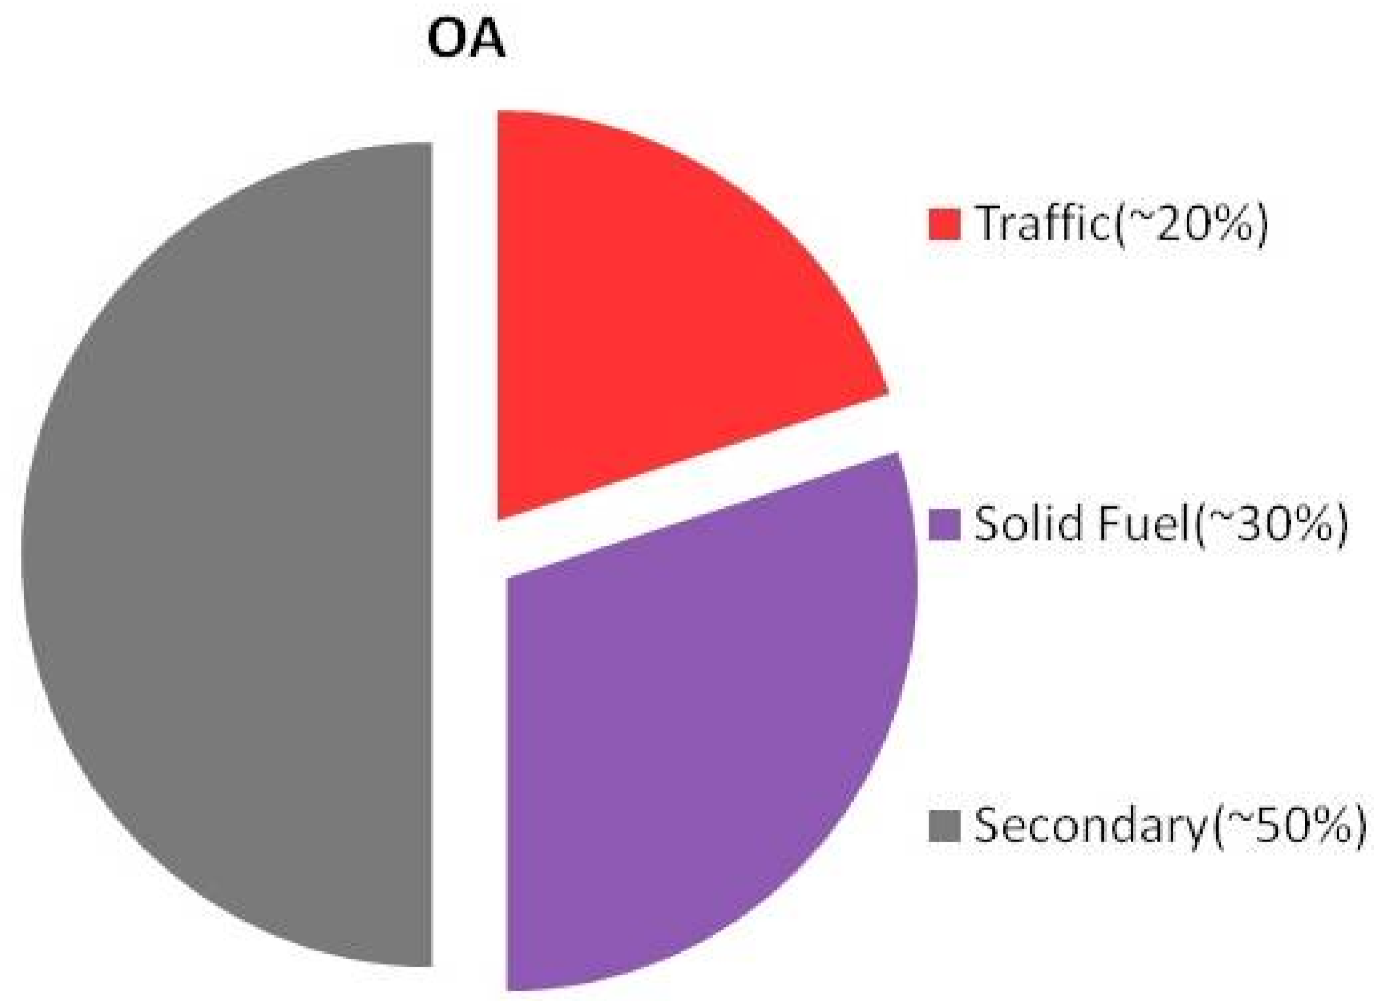
3.2.1. Source Apportionment of Organic Aerosols (OAs)

Tobler et al. and Lalchandani et al. have performed source apportionment of ambient organic aerosols (OAs) using a PMF model for New Delhi that revealed three main components of OAs, namely hydrocarbon-like OA (HOAs), which are related to vehicular emissions; solid fuel combustion OAs (SFC OAs); and oxygenated OAs (OOAs) [10,11]. The percentage contributions of these three components are shown in Figure 1. Lalchandani et al. used high-resolution mass spectra acquired with an HR-ToF-AMS to further apportion these three components into six factors consisting of one related to traffic (HOA), two related to solid fuel combustion (SFC-1 and SFC-2), three secondary factors (two freshly oxidized factors (SVOOA-1 and SVOOA-2) and one highly oxidized factor (LVOOA)) [10]. Primary OA factors such as HOAs and SFCs can be termed as locally generated, whereas oxidized OA factors such as LVOOAs and SVOOAs can be associated with regional and/or transported emissions, although a large fraction of OOAs also can be formed locally. Thus, it may become difficult to differentiate local and regional, based only on OA factorization. Trajectory analysis of the factors can be used as a supportive agent to inspect which fractions originated from long distances and which originated locally, but at finer transport scales; this again becomes associated with more uncertainty with reference to the processes involving the microphysical/chemical evolution of aerosol particles and downwind dispersion [30,31] (Anderson et al., 2003; Campbell et al., 2016).
Tobler et al. and Lalchandani et al. both confirmed the presence of aliphatic hydrocarbon in HOAs and anhydrous sugars in SFC-OAs [10,11]. Lalchandani et al. more explicitly categorized the HOA mass by the presence of aliphatic hydrocarbon signals at m/z 41 (C3H5), 43 (C3H7), 55 (C4H7), 57 (C4H9), 69 (C5H9), and 71 (C5H11) [10], all of which are characteristically linked with vehicular emissions [32]. The HOA factor showed a diurnal cycle at all sites, with a moderate peak in the morning hours between 9 to 10 am local time, and a sharp peak in the evening between 6 and 11 pm. Moreover, high overnight concentrations were observed, indicating high night-time vehicular emissions coupled with a shallow nocturnal boundary layer [8]. In this study, SFC-1 and SFC-2 factors were categorized by the presence of the signals of anhydrous sugars at m/z 60 (C2H4O2) and m/z 73 (C3H5O2), and other oxidized fragments at m/z 29 (CHO), m/z 43 (C2H3O), and m/z 44 (CO2). SFC-1 consists of ions (fragments) of chemical compounds that come from coal combustion, and also contains a small contribution of polycyclic aromatic hydrocarbons (anthracene and pyrene), which are usually emitted during incomplete combustion processes, whereas SFC-2 is found associated most likely with wood-burning emissions [10]. Both studies showed that the diurnal pattern of SFC had a small peak in the morning between 7 and 9 am, and a more prominent peak in the evening between 6 and 11 pm, which was reasonably consistent with residential cooking, heating, and other burning activities. Finally, for secondary factors, Tobler et al. found a major contribution of thermal decomposition of highly oxygenated organic acids, and some aliphatic organics [11]. Lalchandani et al. found that SVOOA-1 mass spectra could be characterized by signals at m/z 53 (C4H5), 67 (C5H7), 81 (C6H9), 95 (C7H11), and 109 (C8H13), along with aromatic fragments at m/z 63 (C5H3), 77 (C6H5), 91 (C7H7), and 105 (C8H9) [10]. The presence of aromatic compounds indicated that it originated from the oxidation of primary emissions rich in aromatic compounds emitted from vehicular exhausts, whereas SVOOA-2 consisted of nitrogen-containing fragments (CHN and CHNO) at m/z 27, 30, 40, 41, and 42, along with traces of biomass burning fragments at m/z 60 and 73, indicating the oxidation of solid-fuel burning emissions. LVOOAs were categorized by very high signals at m/z 44 (CO2+), a relatively lower signal at m/z 43 (C2H3O), and negligible signals at m/z > 44, representing the presence of aged species in this factor [33].
Traffic-related emissions were the largest contributor to the total OA mass at the IITDelhi site (~40% of the total OAs at midnight), whereas solid-fuel burning emissions were a major contributor (~40% at midnight) to OAs at the IITMDelhi site, and the dominant contributor (~60% at midnight) at the MRIIRS site. On the other hand, OOAs were found to be contributing a major (often dominant) part to the total OA mass (average relative contribution of 45–55% and up to ~70–80% during the afternoon hours), which was evidence of enhanced photo-oxidation of organics during the daytime. The concentrations varied significantly across the sites, but similarity of the PM chemical compositions and diurnal variations between the sites suggested similar types of sources and regional scale atmospheric processing of PM in Delhi and adjoining cities. Of course, the difference in mass concentrations across different sites indicated the influence of local emissions at the location of the particular site, rather than sources/emissions coherent across the whole region. The average (mean) of the components of OAs in PM2.5 data from IITDelhi and IITMDelhi (MIIRS was excluded, being a downwind site, but not exactly in Delhi) reported by Lalchandani et al. revealed that during the campaign span of mid-January to mid-March of 2018,the HOAs and SFC (i.e., both primary organic aerosols, POAs) contributed 20.5% and 29.5%, respectively, and oxygenated OAs (i.e., mostly secondary organic aerosols, SOAs)contributed 50% to the total OA mass in Delhi’s atmosphere [10].

3.2.2. Primary and Secondary Fraction of OAs from Offline Analysis

In parity with the online estimation of primary and secondary fractions of OAs by Lalchandani et al. and Tobler et al. it is relevant to mention the results from the offline analysis by Bhowmik et al. to estimate POAs and SOAs [10,11,14]. SOAs have been estimated through an indirect method, based on the fact that EC can be used as a tracer for anthropogenic primary organic carbon (POC), as EC comes from primary emissions and is mostly inert in nature. This method is known as the EC-tracer method (Turpin et al., 1991). SOA and POA quantification by this method depends highly on the value of the primary (OC/EC) ratio. The primary OC/EC ratio is first used to estimate the secondary organic carbon (SOC). Then, the SOA mass concentration is estimated by multiplying SOC by a constant factor that takes into account the mass of other species present in secondary organic aerosols. In this study, a value of 2 was used based on the AMS-derived average ratio of organic matter to organic carbon (OM/OC) of 2.0 ± 0.19 (i.e., OM = 2.0 × OC) [10]. Thus, it was estimated using offline analysis that SOA and POA fractions over Delhi during mid-January to mid-March 2018 shared 50.3% and 49.7%, respectively, of the OAs, which was clearly in good agreement with POA, and SOA fractions of OAs estimated by Lalchandani et al. using the online measurements [10].

3.2.3. Source Apportionment of BC

BC from biomass burning absorbs light in the ultraviolet (UV) and lower visible range more strongly than BC from fossil fuel combustion (e.g., traffic emissions), and therefore BC from these two sources have a different absorption Ångström exponent (AAE). This feature is used to apportion the proportional contributions of biomass burning and fossil fuel combustion emissions to total BC loading. Tobler et al. used an AAE value of 0.9 for traffic emissions and 1.5 for biomass burning emissions [11]. As observed by Lalchandani et al. at the IITDelhi site during the study period of mid-January to mid-March 2018, the fractional contributions from traffic emissions and biomass burning emissions were ~67.5% and ~32.5% of the total BC concentration, respectively, whereas at the IITMDelhi site, for the same study period, the contribution fractions of traffic emissions and biomass burning emissions were ~55.7% and ~44.3%, respectively [10]. Singh et al. discussed that so far, BC was considered the only light-absorbing aerosol, and OC was considered to be a light-scattering aerosol [15]. Recent studies reported that a fraction of organic aerosols also absorbed light in the near-UV to the visible region, and thus such fraction of organic aerosols was categorized as brown carbon (BrC) [34]. BC is emitted directly into the atmosphere [35], while BrC can either be emitted directly into the atmosphere or formed through secondary processes in the atmosphere. The contributions of BC and BrC absorption to the total absorption were estimated using the AAE method for both surface and columnar measurements [36].

3.2.4. Source Apportionment of WS-BrC

Rastogi et al. performed a PMF analysis of the total OAs (for the HR-LToF-AMS measured nonrefractory submicron aerosols) that provided six factors, namely hydrocarbon-like OAs (HOAs), two types of solid-fuel combustion OAs (SFCOA-1, SFCOA-2), two types of semivolatile oxygenated OAs (SVOOA-1, SVOOA-2), and low volatile oxygenated OAs (LVOOAs) [16]. A multiple regression analysis was performed between OA factors and BrC absorption observed at different wavelengths. The slope values (representing MAE of that factor) decreased exponentially from UV to visible regions for all the factors. The order of these MAEs were SFCOA-1 > SVOOA-1 > SVOOA-2 > SFCOA-2 > HOAs > LVOOAs indicating the absorption capacity of BrC from these respective source factors [16].
Additionally, a PMF analysis of WS-BrC spectra was also performed that resulted into a four-factor solution, representing specific sources of BrC. Three factors demonstrated substantial diurnal variability with higher concentrations observed during morning rush hour. Factor 4 showed an unusual trend, peaking similar to SOAs, suggesting the presence of secondary BrC.
Differences in spectral characteristics of these four factors indicated that BrC came from different emission sources. Factor1 depicted the absorption in the UV region (at 300 nm). This could be due to the presence of nitrate or other inorganic constituents in the spectrum. Factor2 displayed the absorption at both UV and visible regions, representing a typical BrC spectrum with higher absorption at UV and gradually reduced absorption values at higher wavelengths. Factor3 presented a very distinct BrC spectrum, with two humps peaking at 300 nm and 500 nm. The second hump at 500 nm was likely associated with secondary BrC. Factor 4 was high during the day in spite of dilution, indicating a secondary nature [16].

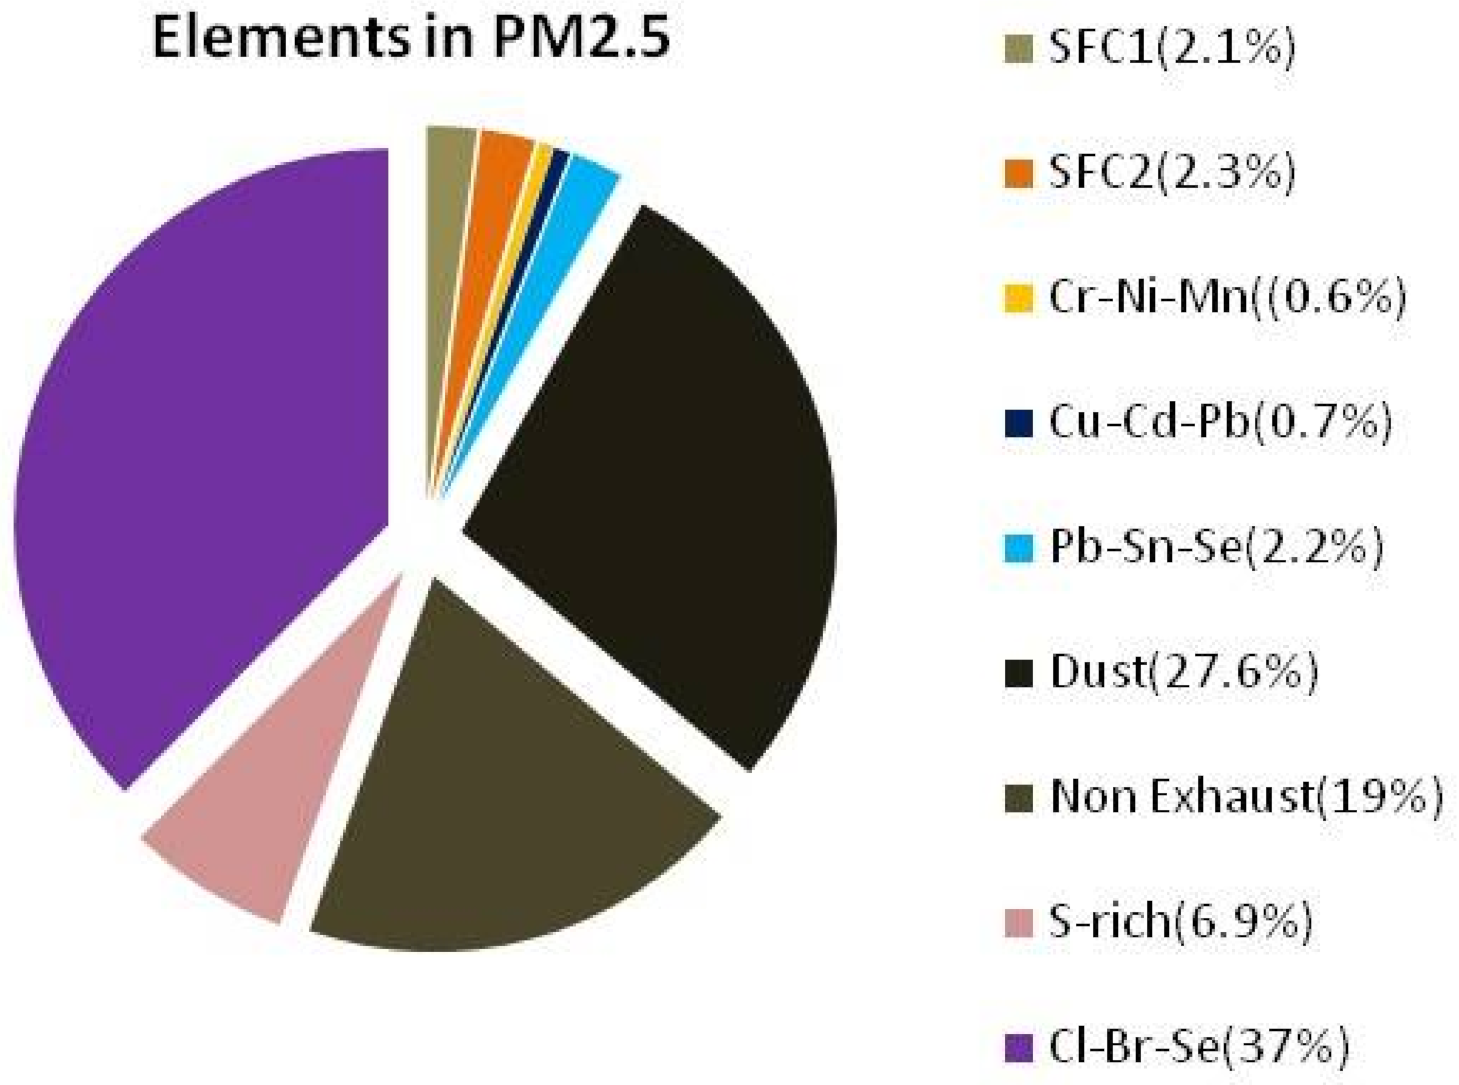
3.2.5. Source Apportionment of Elements in PM

Rai et al. carried out the measurement of elements in PM10 and PM2.5 (denoted hereinafter as PM10elements and PM2.5elements, respectively) using an Xact 625i in Delhi during two consecutive winters (2018 and 2019), and performed their source apportionment using the PMF model [12]. This study reported details on elements in PM10 and PM2.5, their sources in Delhi such as dust and inorganic constituents (e.g., chloride), and potential health risks due to very high concentrations of carcinogenic elements (Cr, Ni, As, Pb) and other elements (Cl, Zn, Cu, Mn, V, etc.). The ME-2 analysis yielded nine source profiles/factors in total, interpreted as dust, nonexhaust, SFC1, SFC2, and S-rich, with the remaining four related to industrial/combustion aerosol plume events (Cr-Ni-Mn, Cl-Br-Se, Cu-Cd-Pb, and Pb-Sn-Se). Their fractional contributions are shown in Figure 2. Furthermore, the size-segregated SA analysis revealed that dust and nonexhaust sources dominantly contributed to PM10el, while the remaining factors (except Cr-Ni-Mn) were in PM2.5el. It was reported that for Delhi, the features of the nonexhaust sources obtained were nearly similar to those of the road dust samples containing more than 60% Si, Ca, Ti, and V together with Sr, and ~40% of Al, Fe, and Rb together. The mass of this factor (fractional composition) was dominated by Si, Ca, Fe, Al, and K. The nonexhaust factor contributed major fractions of total Ba (95%) and Zr (75%); 20–40% of Al, Si, Ca, Ti, Mn, Fe, Rb, and Sr; and ~16%Cu. These metals are related to brake and tire wear. The time series of this factor showed a strong correlation with HOAs and traffic-related VOC factors. Next, the SFC1 factor contributed >30% to the total K, Sb, and in; and 15–20% to Mn, As, Rb, and Sn. The mass of the factor was dominated by two elements, K (51%) and S (25%). The possible sources of SFC1 factor were crop residue burning, wood and coal combustion. Likewise, the SFC2 factor was composed mainly of Zn, S, Cl, and K (26%, 26%, 24%, and 23% of the factor mass, respectively). SFC2 factors are supposed to be emitted from industrial/electronic waste burning, coal combustion and plastic burning. The S-rich factor was composed of S (92% of the factor mass) as the dominant fraction among Se, Cd, and in (from residue of thermal coal-based power plants). The Cr-Ni-Mn factor profile contained high relative contributions ofCr (98%), Ni (64%), and Mn (20%), although Fe (25%), Al (19%), and S (16%) dominate the mass. Cr, Ni, and Mn were found to have association with traffic-related activities, industrial activities, waste incineration, solid waste dumping, and oil combustion. The Cu-Cd-Pb factor profile showed high relative contributions of Cu (78%), Cd (53%), and Pb (19%), plus non-negligible contributions of Sn (19%), Sb (18%), and Br (15%). However, Cl (33%) and S (30%) dominated the mass in this factor. The elements in this factor profile primarily were linked with various types of industrial emissions. The Pb-Sn-Se factor profile showed high relative contributions of Pb (78%), Sn (54%), and Se (19%), whereas the mass was dominated by S (37%), Pb (33%), and Cl (20%), and these were associated with emissions from open waste/plastic burning [12].
The Cl-Br-Se factor showed high relative contributions for Cl (95%), Br (62%), Se (32%), and Al (20%), while the dominant mass was of Cl (89%). The high concentration of chlorine in Delhi could be due to HCL fumes reacting with ammonia gas present in the atmosphere. The HCL fumes are emitted from steel-processing industries present in Punjab and Haryana. The strong correlation of Al with Cl and Br as found in this study indicated that this profile was likely to come from metallurgical/chemical industries, coal combustion, and trash burning. Br has been reported to also come from wood combustion, waste incineration, and auto emissions. A comparative analysis dividing the campaign span of 2018 into two periods of cold (20 January–21 February) and warm (22 February–11 March), based on the ambient temperatures, was presented in Rai et al. (2020), and showed that the concentrations of the Cl-Br-Se and Pb-Sn-Se factors decreased with increases in ambient temperature and wind speed and a decrease in RH (relative humidity). In contrast, an enhancement in the dust factor during the warm period was noted as consistent with dryness in the ambient conditions [12].
Geographical origins of the resolved sources were also determined in the same study using the combination of an air mass back trajectory cluster footprint model and a concentration weighted trajectory (CWT) model. Dust, nonexhaust, and SFC1 were found to be of local origin (within Delhi). The sources of Cl-Br-Se were likely predominantly located northwest of the measurement site and influenced partly by the regional sources in Punjab and Haryana and partly by the local sources within Delhi. The S-rich and Cr-Ni-Mn factors were associated with air masses that originated in/passed over Uttar Pradesh (northeast to southeast). The Cu-Cd-Pb factor was associated with air masses from Nepal and Uttar Pradesh (east), and Pb-Sn-Se and SFC2 were found associated with air masses originating in Haryana, Punjab, and Pakistan (northwest) [12].

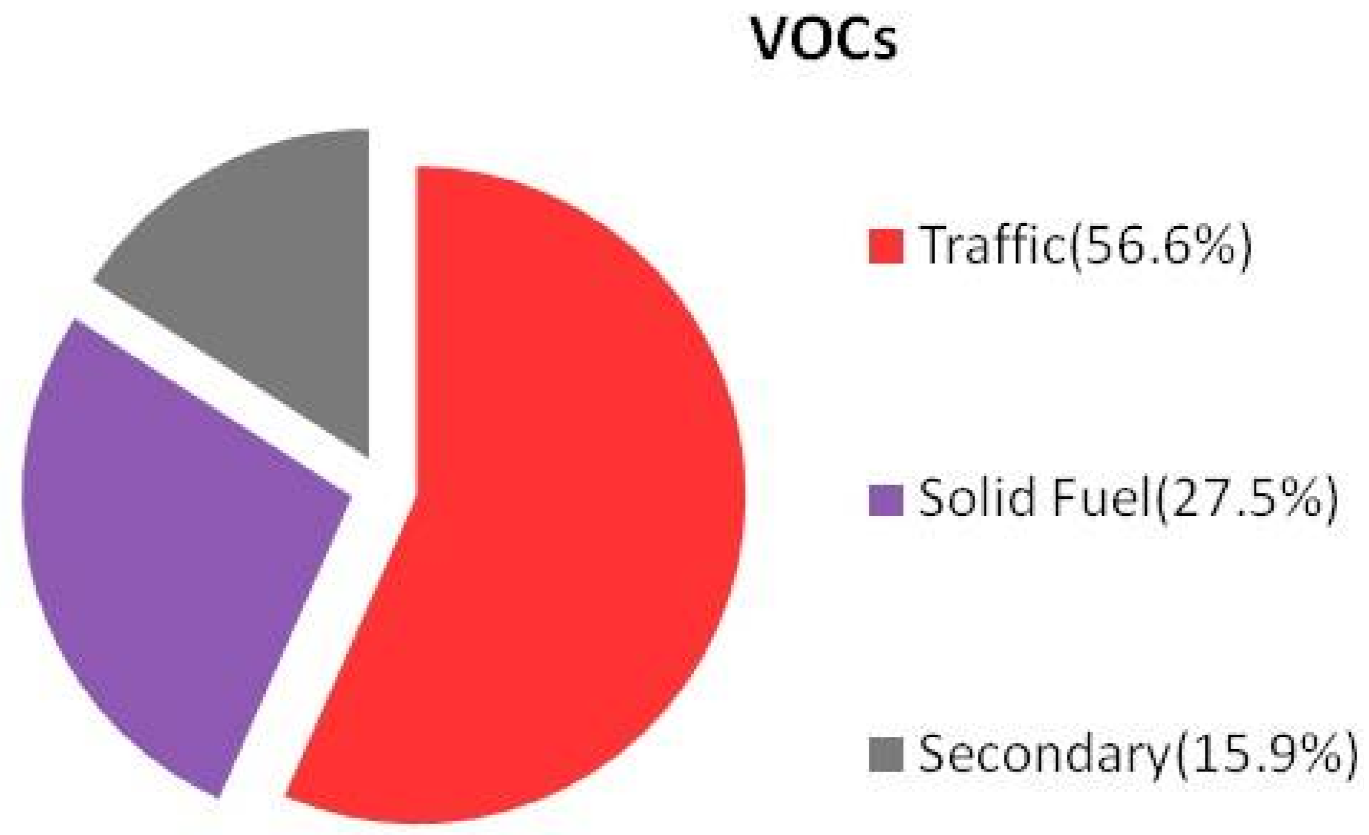
3.2.6. Source Apportionment of VOCs

A study by Wang et al. investigated the characteristics and sources of VOCs with highly time-resolved measurements using a proton-transfer-reaction time-of-flight mass spectrometer (PTR-ToF-MS) at two different sites simultaneously in New Delhi (at IITDelhi, an urban site; and at MRIIRS, a suburban site) from January–March 2018 [13]. Higher mixing ratios of VOCs were observed at the IITDelhi site, with higher night-time contributions from anthropogenic emissions compared to those at the MRIIRS site. The PMF resolved a six-factor solution at both sites that consisted of two factors each related to traffic, solid fuel combustion (SFC), and secondary sources, as shown in Figure 3.
The first two factors (Traffic1 and Traffic2) were linked to vehicular emissions. The Traffic 1 factor was mainly contributed by light motor vehicles (LMVs), and Traffic 2 was related to emissions from heavy motor vehicles (HMVs). Both showed an increase during the night hours and a decrease during the daytime. The mass spectra of both Traffic1 and Traffic2 showed abundance of aromatic CxHy compounds, namely C6H6 (m/z = 79.054), C7H8 (m/z = 93.070), C8H10 (m/z = 107.086), C9H12 (m/z = 121.101), and C10H14 (m/z = 135.117). These ions were likely due to benzene, toluene, and C8 to C10 aromatics, which are well-known markers for vehicular emissions (Yao et al., 2015; Cao et al., 2016). In addition, Traffic2 also included relatively high contributions from nonaromatic hydrocarbons and some oxygenated organic compounds [13].
Two solid fuel combustion factors were named as SFC1 and SFC2. SFC1 was characterized by high loadings of aromatics, as well as oxygenated ions, such as C6H6(CnH2n) O1, C6H6(CnH2n)O2,C4H4(CnH2n)O1, C4H4(CnH2n)O2, and C5H4O1-2, which were likely due to phenolic compounds and furans (Stockwell et al., 2015; Bruns et al., 2017). SFC1 was found prominently related to primary emissions from solid fuel combustion, which might include many types of biomass burning, combustion of coal, and even trash combustion. Benzene was the dominant species in the SFC2 factor, followed by toluene, and only small amounts of reactive phenols and furans were present. Moreover, SFC2 consisted of a significant fraction of nocturnal nitrophenol mixing ratios, indicating the night-time aging of SFC emissions. In addition, it included a high mass fraction of N-containing compounds, such as C3H3N, C4H5N, and C7H5N [13].
VOCs are reactive and significantly contribute to secondary organic aerosol (SOA) formation. Two secondary VOCs factors (SecVOC1 and SecVOC1) were distinguished from the other factors by the prevailing presence of oxygenated compounds. SecVOC1 consisted of large fractions of C2H4O3 and C4H2O3, and the m/z spectrum was dominated by C4H8O, C3H4O2, C3H6O2, and C3H6O3 fragments, although their relative contributions to these ions were comparably lower than to C2H4O3 and C4H2O3. The diurnal pattern of SecVOC1 followed that of the solar radiation, with a sharp increase starting from around 7 am local time (LT), then declining continuously after 1pm LT. Many of these ions can be formed rapidly during the daytime, and they may have a short lifetime due to the possibilities of gas-to-particle partitioning process (Wang et al., 2020). SecVOC2 had noteworthy contributions from C3H4O2 and C3H6O2 as well, but the relative contributions to C3H4O2, C4H6O2-3, C6H6O2, C8H8O3, and C6H5NO3 weremuch higher than for the SecVOC1, along with many oxygenated compounds with higher molecular weight. Thus, it was inferred by Wang et al. (2020) that SecVOC1 was a mix of first-generation products and later-generation oxidation products, while SecVOC2 was likely to be linked with second-generation products and night-time chemistry [13].
Anthropogenic emissions were shown to be major VOC sources at both sites. More precisely, at the urban site (IITDelhi), traffic-related emissions were found to be the dominant source, contributing 56.6%; while SFC contributed 27.5%; and secondary formation, which is the most important source of VOCs during daytime, had contributed 15.9% to the total analyzed VOC mixing ratio. At the suburban site (MRIIRS), traffic-related emissions were 36.0%, followed by secondary formation and SFC contributions of 33.6% and 30.4%, respectively, to the total VOC mixing ratio. Higher mixing ratios of oxygenated VOCs were found at the suburban site, feasibly due to the suppression of oxidant levels in the urban atmosphere and a comparatively longer aging time at the suburban site. The diurnal patterns and profiles of the factors indicated that the anthropogenic sources were similar at both sites, even though the VOC mixing ratios at MRIIRS were much lower than at IITDelhi. In contrast, both the diurnal variations and spectra of secondary factors were significantly different at the two sites, exhibiting higher mixing ratios and contributions at the suburban site, especially during the daytime. At IITDelhi, the two secondary VOC factors were found to have different aging processes such as fast photochemical formation and later-generation production under strong primary emissions, whereas at the MRIIRS suburban site, local oxidation and regional aging, such asformation of peroxyacetyl nitrate (PAN), were dominant in VOC oxidation with NOx [37] (de Gouw and Warneke, 2007). In addition, evaluation of biogenic markers (methyl vinyl ketone and methacrolein) indicated a very small contribution from biogenic emissions and their oxidation products. The findings prominently indicated the major role of anthropogenic sources in the pollution levels and variations in characteristics of ambient VOCs in Delhi [13].

3.3. Case Study: Analysis of Changes in All Pollutants during a Two-Week Span

The time series of PM2.5, elements, and VOCs over the study period of 17 January–11 March 2018 presented in Lalchandani et al., Rai et al. and Wang et al. [10,12,13] respectively showed a notable span of two weeks from 13–26 February 2018 (as shown if Figure 4 and elaborated in Figure 5) when VOCs, OA, SO4, NO3, BC, and all elements (excluding Cl containing factor) had shown a gradual but steady increase (shown in Figure 4 and Figure 5) at their corresponding sites (Figure 4 and Figure 5 show only IITDelhi site plots, as it is a common site regarding all pollutant data availability), while NH4 and chloride (mostly in the form of NH4Cl) had decreased. At the end of the two weeks, concentrations of every pollutant, exceptNH4 and chloride, showed a sudden fall, whereas NH4 and chloride began increasing at this point.
The increase or decrease in species mentioned above may be interestingly correlated with any changes in the meteorological conditions or changes in sources. It can be mentioned here that BC from traffic showed much more prominent increase compared to BC from wood burning during this two-week period, as found in the figures by Lalchandani et al. and in the figures by Wang et al., it was found that the increase in the traffic (1 and 2) factors was more rapid and stronger compared to SFC factors in this two-week period [10,13]. The concentrations of particulate chloride and NH4 may have decreased gradually due to higher ambient temperatures and a lower relative humidity, conditions that are not favorable for the formation of/partition into particulate phase NH4Cl, over the two-week period [2,12] Wang et al. reported a sharp increase in ambient temperatures after 21 February 2018 and a sudden drop at the end of the two-week period, likely associated with a rainfall event, but not mentioned in their studies [13]. However, the sudden fall in concentrations of other pollutants after 26 February 2018 indicated a sudden change, such as the washout effect that normally occurs due to rains.

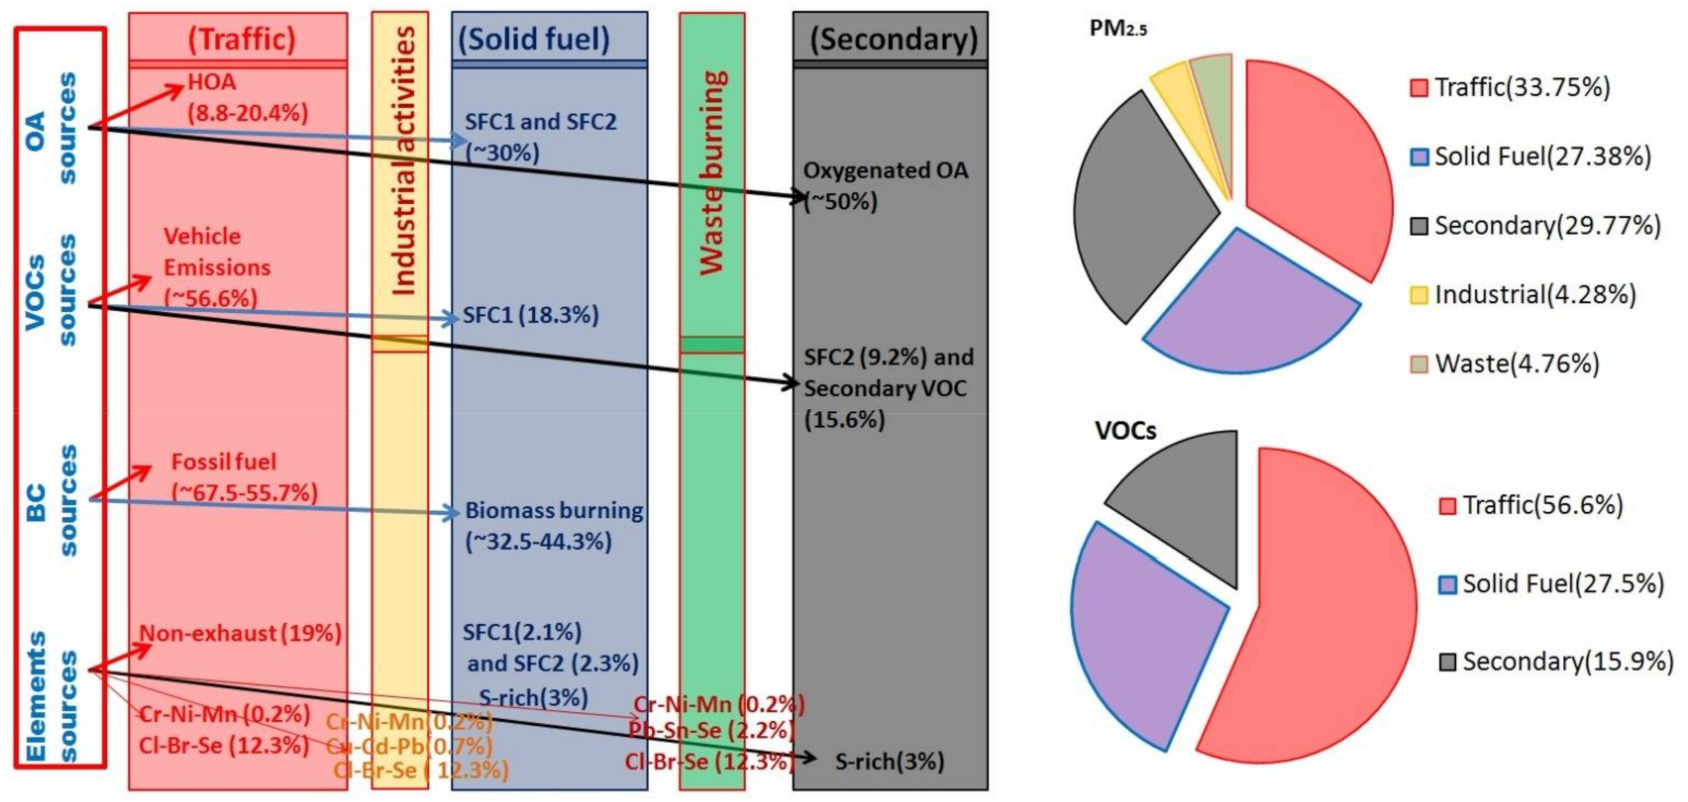
3.4. Categorization of the Sources of PM2.5 and VOCs

The abovementioned past studies created a scope of categorization of the sources of PM2.5 and VOCs in Delhi. It can be noted from all the SA analyses performed that all types of fine aerosols and VOCs were emitted from five major sources that are simultaneously contributing to the total loading of the OA, BC, elements in PM2.5, and VOCs in the atmosphere over Delhi-NRC. These five sources (as shown in Figure 6) are: (i) traffic-related emissions (which contribute to OA, BC, elements, and VOCs); (ii) solid fuel combustion (which contributes to OA, BC, elements, and VOC); (iii) secondary sources (which contribute major fractions to OA and VOCs); (iv) industrial activities (which contribute to elements); and (v) waste-burning events (which contribute to elements).
It can be inferred from the fractional contributions of these five sources of different pollutants in Delhi that together, emissions from traffic-related and solid fuel combustion, the two primary sources, are vital sources of the total loading of pollutants in Delhi’s environment, and therefore control of these two primary sources may decrease the formation of secondary pollutants, as well as total pollutant concentration to some extent.

3.5. PM2.5 Pollution Scenario as Reported from Some Important Urban Sites in Asia

This section highlights PM2.5 source-attribution studies from other important sites in Asia conducted in the recent past to reach a comparative understanding of PM2.5 levels and sources in Delhi. In Beijing, the mean PM2.5 concentration as reported by Zang et al. during April 2009–January 2010 was 135 ± 63 μgm−3, and they attributed ambient PM2.5 to main seven potential sources: secondary inorganic aerosols, industrial pollution, coal combustion, mineral dust, biomass burning, traffic, and waste incineration [38]. Yu et al. (2013) reported an annual average PM2.5 concentration of 55.4 ± 40.2 μg/m3 in 2010 (daily mean in the range 9.8–219 μgm−3) and identified seven sources and their fractional contributions in Beijing: secondary sulfur (26.5%), vehicle exhaust (17.1%), fossil fuel combustion (16.0%), road dust (12.7%), biomass burning (11.2%), soil dust (10.4%), and metal processing (6.0%) [39]. In Haikou, the capital city of Hainan Province in southern China, the average PM2.5 concentration was 23.3 μgm−3 for the period of 2013–2015 [40] with major contributions from secondary sulfate (9.9–21.4%), resuspended dust (10.1–19.0%), and vehicle exhaust (10.5–20.2%). The annual average PM2.5 concentration in Seoul, South Korea, as reported by Heo et al. (2009) was 43.5 μgm−3 [41]. Nine PM2.5 source categories were identified: secondary nitrate (20.9%), secondary sulfate (20.5%), gasoline vehicles (17.2%), biomass burning (12.1%), diesel emissions (8.1%), soil (7.4%), industry (6.7%), road salt and two-stroke vehicles (5.1%), and aged sea salt (2.2%). Similarly, a study over the port city of Busan (South Korea) [42] found that the annual average PM2.5 concentration was 26.1 ± 15.3 µgm−3,and it was shown that the secondary formation of aerosols was the dominant (45–60%) contributor to PM2.5 loading. The PMF and PCA/APCS analyses suggested that ship emissions were a non-negligible contributor to PM2.5 (up to about 10%) in the study area. Here, this annual average PM2.5 in Busan was comparable with that in one of the major hub port cities of the world, Hong Kong (30.5 µg/m3) [43]. For a roadside site in Hong Kong, Cheng et al. (2014) reported the annual average mass concentration for PM2.5 was 55.5 ± 25.5, and seven sources were resolved using a PMF model: vehicle emissions (~29%), secondary inorganic aerosols (~27%), waste incinerator/biomass burning (~23%), residual oil combustion (~10%), marine aerosols (~6%), industrial exhaust(~4%), and resuspended road dust (~1%). It is remarkable to note here that secondary sources of PM2.5 wereubiquitous and abundant (sometimes contributing up to 40%) over most of East Asia [44].
A study in Bangkok, Thailand, by Wimolwattanapun et al. (2011) [45] reported the annual average mass concentrations of PM2.5 was 23.2 μgm−3, and source apportionment using PMF identified these factors: construction/soil (13.68 ± 9.66%), soil (coarse)(12.16 ± 9.71%), road dust (9.08 ± 7.97%), traffic (7.65 ± 4.42%), aged sea salt (5.35 ± 4.70%),biomass (4.51 ± 4.17%), secondary sulfate (2.39 ± 2.49%), soil (fine) (2.21 ± 2.00%), sea salt (1.27 ± 1.50%), and Zn-rich (0.88 ± 0.79%). Similarly, in the Kathmandu Valley, Nepal, located in the foothills on the southern flank of the central Himalayas in South Asia, Islam et al. (2020) [46] reported, based on daytime and night-time filter sampling, an average (mean) PM2.5 concentration of 68.2 ± 34.7 µg m−3 during 11–24 April 2015, mainly composed of (nonwater mass of PM2.5) organic matter (48%), sulfate (16%), elemental carbon (13%), ammonium (9%), nitrate (4%), chloride (2%), calcium (1%), potassium (1%), and magnesium (0.05%). Furthermore, the CMB analysis of OC, combined with source tracers, in Kathmandu Valley revealed five primary sources (garbage burning 18.1 ± 4.5%, gasoline and diesel engines 18.0 ± 9.2%, open biomass burning 17.2 ± 9.5%, coal combustion 5.0 ± 2.3%, and vegetative detritus 1.6 ± 0.9%), four secondary sources (naphthalene SOC 9.8 ± 4.0%, β-caryophyllene SOC 4.6 ± 1.5%, α-pinene SOC 0.13 ± 0.07%), and one unresolved or other source of OC (25.4 ± 16.6%) (Islam et al., 2020). Table 3 presents a comparison between the above-mentioned sites.
It was notable in the above-mentioned studies that Delhi’s PM2.5 concentration was higher than at all these important urban sites. The percentage contribution of biomass burning to PM2.5 in capitals such as Beijing, Seoul, or Bangkok, as reported, were less than that in Delhi; whereas contributions of traffic emissions and secondary sources to PM2.5 in Delhi were comparable to the other sites mentioned here.

3.6. Potential Health Impacts of Offline Particulate Matters Using Oxidative Potential

Fine particulate matter, due to its tiny size and the presence of toxic elements, can cause severe health impacts such asasthma, cardiovascular diseases, and pulmonary and respiratory illnesses. It has been found that ultrafine air pollutants can significantly affect the central nervous system (CNS) and can cause neurological diseases either by directly entering into the CNS or through developing systemic inflammations [47,48] (Bandyopadhyay, 2016; Genc et al., 2012). Air pollution (mainly particulate matter) accounts for >12.5% of the total deaths in a year in India [4] (Balakrishnan et al., 2019). Delhi experiences the worst air quality, especially in winter due to low wind speeds and a shallow boundary layer. The hourly averaged PM2.5 mass concentrations have been reported to exceed even 500 μgm−3, which is >8 times higher than the National Ambient Air Quality Standards (60 μgm−3 for 24 h average concentration), and exposure to this intensity of PM2.5 is a major public health risk and certainly a major concern for any nation.
In their study, Puthussery et al.,worked on measuring the potential of the adverse health impacts of PM2.5 over Delhi (for ~1 week) utilizing the oxidative potential (OP), which is a metric commonly used to determine aerosol exposure and its adverse health effects [17]. This study was the first to articulate real-time measurements of ambient PM2.5 OP based on a dithiothreitol (DTT) assay in Delhi, during the late winter season of 2019 (February 2019). The OP of PM is known as the ability of particles to produce reactive oxygen species (ROS) or consume antioxidants. The DTT assay is a commonly used, low-cost, and easy-to-use chemical assay to measure the OP of ambient PM. DTT acts as electron donor in the presence of ambient PM and converts oxygen to its superoxide radical. The rate of oxidation of DTT during this reaction (referred to as the DTT activity) is assumed to be proportional to the amount of redox-active types present in ambient PM. Puthussery et al. performed the first-ever measurements of the real-time PM2.5 OP in Delhi using an indigenous online instrument based on a DTT assay [17]. The real-time OP instrument had the benefit of capturing 1 h time-resolved data and showed fewer chances to lose short-lived radicals and unstable redox-active types. In this study, it was shown that DTT activity was best correlated with the oxygenated organic aerosols (OOAs). On the other hand, correlation among SO42−, OOAs and OP led the authors to the hypothesis that both intrinsically redox-active SOAs formed during the afternoon, and the elevated aerosol mass concentrations at night, due to a stable nocturnal boundary layer mostly influencing the OP. In addition to the oxygenated organics, OP showed correlation with K which is commonly used as a tracer for biomass burning (BB) emissions.

4. Summary and Conclusions

The traditional approach of source attribution of particulate matter (PM) combining PM chemical composition (through filter sampling and offline analysis) and application of source-apportionment tools such as chemical mass balance (CMB) or positive matrix factorization (PMF), or more sophisticated chemical-transport modeling tools (e.g., WRF-Chem, CMAQ, CAMx), helps to estimate proportional contributions of various potential sources to observed PM concentrations. The recent advances in online measurement of different components of PM or mixing ratios of various gaseous species (e.g., VOVs) provides unprecedented opportunities to gain insights into the detailed composition of PM or characteristics of gaseous species and their potential sources, and when combined with PMF or CBM techniques, can help identify major sources and quantify their proportional contributions. This study provided a comprehensive assessment of the findings of recent studies using offline and online methods in Delhi, the capital city of India. Recent studies that used online techniques [10,11,12] reported organics, chloride, ammonium, sulfate, nitrate, black carbon, and elements as the major components of PM2.5 in the Delhi-National Capital Region (NCR) during the campaign in the late winter period of 2018. The highest PM concentrations during the campaign were observed at the Indian Institute of Technology Delhi (IITDelhi) site in Delhi city area, with a campaign hourly average PM2.5 (eq.) (NR-PM2.5 + BC) concentration of 153.8 ± 109.4 µgm−3, and a maximum concentration reaching up to 596.2 µgm−3. Source apportionment of organic aerosols (OAs) using online measurements revealed a six-factor solution consisting of one traffic-related factor (HOAs), two solid-fuel combustion(SFC) related factors (SFC-1 and SFC-2), and three secondary factors (two freshly oxidized factors (SVOOA-1 and SVOOA-2) and one highly oxidized factor (LVOOA)). The offline technique estimated the contribution of SOAs (50.3%) and POAs (49.7%) to PM2.5 over Delhi during January to March 2018, which agreed well with the estimation of primary and secondary OA fractions estimated using the online measurements. Furthermore, source apportionment of the elements in PM10 and PM2.5 (i.e., PM10element and PM2.5element) yielded nine source profiles that were interpreted as dust, nonexhaust, SFC-1, SFC-2, sulfur-rich, and four industrial/combustion aerosols related to plume events (Cr-Ni-Mn, Cl-Br-Se, Cu-Cd-Pb, and Pb-Sn-Se).
PMF analysis of water-soluble BrC spectra resulted in a four-factor solution, representing specific sources of BrC. Three factors demonstrated substantial diurnal variability with higher concentrations observed during the morning rush hour. Factor 4 showed an extraordinary trend, peaking similar to SOA, suggesting the presence of secondary BrC.
Sources of volatile organic compounds (VOCs) at two different sites in New Delhi (an urban site at IITDelhi and a suburban site at MRIIRS), India, from January to March 2018, as reported using positive matrix factorization (PMF), were two traffic factors, two solid fuel combustion (SFC) factors, and two secondary factors.
Overall, from all the results of the SA analyses performed in the mentioned individual studies, it was found that there were five major sources of fine PM and VOCs that pollute the atmosphere over Delhi-NRC: (i) traffic-related emissions (which contribute to OA, BC, elements, and VOCs); (ii) solid fuel combustion (which contributes to OA, BC, elements, and VOC); (iii) secondary aerosol formation (which contributes mainly to OA and VOCs); (iv) industrial activities (which contribute mainly to elements); and (v) waste-burning events (which contribute mainly to elements).
Furthermore, a report from a first-ever real-time measurement of ambient PM2.5 oxidative potential (OP), a metric commonly used to determine aerosol exposure and its adverse health effects based on a dithiothreitol (DTT) assay, in Delhi during a late winter season of 2019 (February 2019), revealed DTT activity was best correlated with the oxygenated organic aerosols (OOAs).
Air pollution in Delhi (or in India as a whole) is a dynamic process with very strong seasonal variations due to seasonal changes in meteorological conditions, such as monsoon circulation and rains, and major sources such as agro-residue burning and brick production. It is expected that the nature of sources and characteristics of air pollutants will continue to change over the years with rapidly growing socio-economic activities and implementation of various clean air solutions and other policy measures. Therefore, it is of utmost importance to continue comprehensive source apportionment of particulate matter and gaseous air pollutants (e.g., VOCs) together, at least once every season, which is currently not available, so that the policy responses can be tailored appropriately and made adaptive to the evolving dynamics of air pollution in Delhi.
This study, which consolidated the recent findings on sources of PM and VOCs in Delhi based on state-of-the art sophisticated measurement and analysis techniques, will be useful in making a comprehensive assessment of the sources (and their contributions) of fine particulate pollutants and gaseous VOCs together in the Delhi National Capital Region; such assessment is currently contained in fragments in different studies. This will be vital to further enhancing our understanding of the composition, characteristics, and sources of air pollutants over Delhi in order to take one step ahead toward appropriate future research studies and mitigation measures for the local conditions informed by solid scientific evidence.

Author Contributions

Conceptualization, S.T. and S.N.T.; data curation, V.L., H.S.B., A.K.S., N.T., J.D. and N.R.; investigation, S.N.T.; resources, V.L., M.R., H.S.B., A.K.S., V.M., R.S., V.J., J.D., N.R., and L.S.; supervision, S.N.T.; visualization, S.T. and V.L.; writing—original draft, S.T., S.N.T., V.L., and M.R.; writing—review and editing, S.T., S.N.T., V.L., M.R., H.S.B., A.K.S., V.M., R.S., V.J., N.T., N.R. and L.S. All authors have read and agreed to the published version of the manuscript.

Funding

This work was financially supported by the Central Pollution Control Board (CPCB), Government of India, and conducted under grant no. AQM/Source apportionment_EPC Project/2017.

Institutional Review Board Statement

Not applicable.

Informed Consent Statement

Not applicable.

Data Availability Statement

The data presented in this study are available on request from the corresponding author. The data are not publicly available due to ethical restrictions.

Acknowledgments

We gratefully acknowledge the National Clean Air Program, and we extend our thanks to the National Knowledge Network. Part of this work was done while S.N. Tripathi was a fellow at the Institute for Advanced Sustainability Studies (IASS) in Potsdam, Germany. M. Rupakheti acknowledges the support provided by the IASS, which is funded by the German Federal Ministry for Education and Research (BMBF) and the Brandenburg Ministry for Science, Research, and Culture (MWFK).

Conflicts of Interest

The authors declare no conflict of interest. The funders had no role in the design of the study; in the collection, analyses, or interpretation of data; in the writing of the manuscript; or in the decision to publish the results.

Abbreviations

BCBlack carbon
BrCBrown carbon
CMBChemical mass balance
DTTDithiothreitol
ECElemental carbon
HR-ToF-AMSHigh-resolution time-of-flight aerosol mass spectrometer
HOAHydrocarbon-like organic aerosol
ICP-MSInductively coupled plasma mass spectroscopy
L-ToF-AMSHigh-resolution long-time-of-flight aerosol mass spectrometer
LVOOALow-volatile oxygenated organic aerosol
MEMultilinear engine
NCRNational Capital Region
NMOGNonmethane organic gases
NRNonrefractory
OCOrganic carbon
OAOrganic aerosol
OM/OCOrganic matter to organic carbon ratio
OPOxidative potential
PANPeroxyacetyl nitrate
PMParticulate matter
PMFPositive matrix factorization
PBLPlanetary boundary layer
PTR-ToF-MSProton-transfer-reaction time-of-flight mass spectrometer
POAPrimary organic aerosol
ROSReactive oxygen species
SDDSilicon drift detector
SoFiSource Finder
SOASecondary organic aerosol
SFCSolid fuel combustion
SVOOASemivolatile oxygenated organic aerosol
ToF-ACSMTime-of-flight aerosol chemical speciation monitor
TOCTotal organic carbon
VOCsVolatile organic compounds
WS-BrCWater-soluble brown carbon
XRFX-ray fluorescence

References

  1. Singh, V.; Singh, S.; Biswal, A. Exceedances and trends of particulate matter (PM2.5) in five Indian megacities. Sci. Total Environ. 2021, 750, 141461. [Google Scholar] [CrossRef] [PubMed]
  2. Pant, P.; Shukla, A.; Kohl, S.D.; Chow, J.C.; Watson, J.; Harrison, R.M. Characterization of ambient PM2.5 at a pollution hotspot in New Delhi, India and inference of sources. Atmos. Environ. 2015, 109, 178–189. [Google Scholar] [CrossRef]
  3. Tiwari, S.; Thomas, A.; Rao, P.; Chate, D.; Soni, V.; Singh, S.; Ghude, S.; Singh, D.; Hopke, P.K. Pollution concentrations in Delhi India during winter 2015–2016: A case study of an odd-even vehicle strategy. Atmos. Pollut. Res. 2018, 9, 1137–1145. [Google Scholar] [CrossRef]
  4. Balakrishnan, K.; Dey, S.; Gupta, T.; Dhaliwal, R.S.; Brauer, M.; Cohen, A.J.; Stanaway, J.D.; Beig, G.; Joshi, T.K.; Aggarwal, A.N.; et al. The Impact of Air Pollution on Deaths, Disease Burden, and Life Expectancy across the States of India: The Global Burden of Disease Study 2017. Lancet Planet. Health 2019, 3, 26−39. [Google Scholar] [CrossRef] [Green Version]
  5. Li, H.; Xu, X.-L.; Dai, D.-W.; Huang, Z.-Y.; Ma, Z.; Guan, Y.-J. Air pollution and temperature are associated with increased COVID-19 incidence: A time series study. Int. J. Infect. Dis. 2020, 97, 278–282. [Google Scholar] [CrossRef]
  6. Lolli, S.; Chen, Y.-C.; Wang, S.-H.; Vivone, G. Impact of meteorological conditions and air pollution on COVID-19 pandemic transmission in Italy. Sci. Rep. 2020, 10, 16213. [Google Scholar] [CrossRef]
  7. Srivastava, A.; Gupta, S.; Jain, V. Winter-time size distribution and source apportionment of total suspended particulate matter and associated metals in Delhi. Atmos. Res. 2009, 92, 88–99. [Google Scholar] [CrossRef]
  8. Tiwari, S.; Srivastava, A.; Chate, D.; Safai, P.; Bisht, D.; Beig, G. Impacts of the high loadings of primary and secondary aerosols on light extinction at Delhi during wintertime. Atmos. Environ. 2014, 92, 60–68. [Google Scholar] [CrossRef]
  9. Sharma, S.K.; Mandal, T.K.; Jain, S.; Saraswati; Sharma, A.; Saxena, M. Source Apportionment of PM2.5 in Delhi, India Using PMF Model. Bull. Environ. Contam. Toxicol. 2016, 97, 286–293. [Google Scholar] [CrossRef]
  10. Lalchandani, V.; Kumar, V.; Tobler, A.; Thamban, N.M.; Mishra, S.; Slowik, J.G.; Bhattu, D.; Rai, P.; Satish, R.; Ganguly, D.; et al. Real-time characterization and source apportionment of fine particulate matter in the Delhi megacity area during late winter. Sci. Total Environ. 2021, 770, 145324. [Google Scholar] [CrossRef] [PubMed]
  11. Tobler, A.; Bhattu, D.; Canonaco, F.; Lalchandani, V.; Shukla, A.; Thamban, N.M.; Mishra, S.; Srivastava, A.K.; Bisht, D.S.; Tiwari, S.; et al. Chemical characterization of PM2.5 and source apportionment of organic aerosol in New Delhi, India. Sci. Total Environ. 2020, 745, 140924. [Google Scholar] [CrossRef] [PubMed]
  12. Rai, P.; Furger, M.; El Haddad, I.; Kumar, V.; Wang, L.; Singh, A.; Dixit, K.; Bhattu, D.; Petit, J.-E.; Ganguly, D.; et al. Real-time measurement and source apportionment of elements in Delhi’s atmosphere. Sci. Total Environ. 2020, 742, 140332. [Google Scholar] [CrossRef]
  13. Wang, L.; Slowik, J.G.; Tripathi, N.; Bhattu, D.; Rai, P.; Kumar, V.; Vats, P.; Satish, R.; Baltensperger, U.; Ganguly, D.; et al. Source characterization of volatile organic compounds measured by PTR-ToF-MS in Delhi, India. Atmos. Chem. Phys. 2020, 20, 9753–9770. [Google Scholar] [CrossRef]
  14. Bhowmik, H.S.; Naresh, S.; Bhattu, D.; Rastogi, N.; Prévôt, A.S.; Tripathi, S.N. Temporal and spatial variability of carbonaceous species (EC; OC.; WSOC and SOA) in PM2.5 aerosol over five sites of Indo-Gangetic Plain. Atmos. Pollut. Res. 2021, 12, 375–390. [Google Scholar] [CrossRef]
  15. Singh, A.; Rastogi, N.; Kumar, V.; Slowik, J.G.; Satish, R.; Lalchandani, V.; Thamban, N.M.; Rai, P.; Bhattu, D.; Vats, P.; et al. Sources and characteristics of light-absorbing fine particulates over Delhi through the synergy of real-time optical and chemical measurements. Atmos. Environ. 2021, 252, 118338. [Google Scholar] [CrossRef]
  16. Rastogi, N.; Satish, R.; Singh, A.; Kumar, V.; Thamban, N.; Lalchandani, V.; Shukla, A.; Vats, P.; Tripathi, S.; Ganguly, D.; et al. Diurnal variability in the spectral characteristics and sources of water-soluble brown carbon aerosols over Delhi. Sci. Total Environ. 2021, 794, 148589. [Google Scholar] [CrossRef] [PubMed]
  17. Puthussery, J.V.; Singh, A.; Rai, P.; Bhattu, D.; Kumar, V.; Vats, P.; Furger, M.; Rastogi, N.; Slowik, J.G.; Ganguly, D.; et al. Real-Time Measurements of PM2.5 Oxidative Potential Using a Dithiothreitol Assay in Delhi, India. Environ. Sci. Technol. Lett. 2020, 7, 504–510. [Google Scholar] [CrossRef]
  18. Fröhlich, R.; Cubison, M.J.; Slowik, J.G.; Bukowiecki, N.; Prévôt, A.S.H.; Baltensperger, U.; Schneider, J.; Kimmel, J.R.; Gonin, M.; Rohner, U.; et al. The ToF-ACSM: A portable aerosol chemical speciation monitor with TOFMS detection. Atmos. Meas. Technol. 2013, 6, 3225–3241. [Google Scholar] [CrossRef] [Green Version]
  19. DeCarlo, P.F.; Kimmel, J.R.; Trimborn, A.; Northway, M.J.; Jayne, J.T.; Aiken, A.C.; Gonin, M.; Fuhrer, K.; Horvath, T.; Docherty, K.S.; et al. Field-Deployable, High-Resolution, Time-of-Flight Aerosol Mass Spectrometer. Anal. Chem. 2006, 78, 8281–8289. [Google Scholar] [CrossRef]
  20. Jordan, A.; Haidacher, S.; Hanel, G.; Hartungen, E.; Märk, L.; Seehauser, H.; Schottkowsky, R.; Sulzer, P.; Märk, T. A high resolution and high sensitivity proton-transfer-reaction time-of-flight mass spectrometer (PTR-TOF-MS). Int. J. Mass Spectrom. 2009, 286, 122–128. [Google Scholar] [CrossRef]
  21. Drinovec, L.; Močnik, G.; Zotter, P.; Prévôt, A.S.H.; Ruckstuhl, C.; Coz, E.; Rupakheti, M.; Sciare, J.; Müller, T.; Wiedensohler, A.; et al. The “dual-spot” Aethalometer: An improved measurement of aerosol black carbon with real-time loading compensation. Atmos. Meas. Technol. 2015, 8, 1965–1979. [Google Scholar] [CrossRef] [Green Version]
  22. Thamban, N.M.; Tripathi, S.N.; Moosakutty, S.P.; Kuntamukkal, P.; Kanawade, V.P. Internally mixed black carbon in the Indo-Gangetic Plain and its effect on absorption enhancement. Atmos. Res. 2017, 197, 211–223. [Google Scholar] [CrossRef]
  23. Stephens, M.; Turner, N.; Sandberg, J. Particle identification by laser-induced incandescence in a solid-state laser cavity. Appl. Opt. 2003, 42, 3726. [Google Scholar] [CrossRef] [PubMed]
  24. Paatero, P.; Tapper, U. Positive matrix factorization: A non-negative factor model with optimal utilization of error estimates of data values. Environmetrics 1994, 5, 111–126. [Google Scholar] [CrossRef]
  25. Canonaco, F.; Crippa, M.; Slowik, J.G.; Baltensperger, U.; Prévôt, A.S.H. SoFi, an IGOR-based interface for the efficient use of the generalized multilinear engine (ME-2) for the source apportionment: ME-2 application to aerosol mass spectrometer data. Atmos. Meas. Technol. 2013, 6, 3649–3661. [Google Scholar] [CrossRef] [Green Version]
  26. Paatero, P.; Hopke, P.K. Rotational tools for factor analytic models. J. Chemom. 2009, 23, 91–100. [Google Scholar] [CrossRef]
  27. Ulbrich, I.M.; Canagaratna, M.R.; Zhang, Q.; Worsnop, D.R.; Jimenez, J.L. Interpretation of organic components from Positive Matrix Factorization of aerosol mass spectrometric data. Atmos. Chem. Phys. Discuss. 2009, 9, 2891–2918. [Google Scholar] [CrossRef] [Green Version]
  28. Canonaco, F.; Slowik, J.G.; Baltensperger, U.; Prévôt, A.S.H. Seasonal differences in oxygenated organic aerosol composition: Implications for emissions sources and factor analysis. Atmos. Chem. Phys. Discuss. 2015, 15, 6993–7002. [Google Scholar] [CrossRef] [Green Version]
  29. Crippa, M.; Canonaco, F.; Lanz, V.A.; Äijälä, M.; Allan, J.D.; Carbone, S.; Capes, G.; Ceburnis, D.; Dall’Osto, M.; Day, D.A.; et al. Organic aerosol components derived from 25 AMS data sets across Europe using a consistent ME-2 based source apportionment approach. Atmos. Chem. Phys. Discuss. 2014, 14, 6159–6176. [Google Scholar] [CrossRef] [Green Version]
  30. Anderson, T.L.; Charlson, R.J.; Winker, D.M.; Ogren, J.; Holmén, K. Mesoscale Variations of Tropospheric Aerosols*. J. Atmos. Sci. 2003, 60, 119–136. [Google Scholar] [CrossRef]
  31. Campbell, J.R.; Ge, C.; Wang, J.; Welton, E.J.; Bucholtz, A.; Hyer, E.; Reid, E.A.; Chew, B.N.; Liew, S.C.; Salinas, S.V.; et al. Applying Advanced Ground-Based Remote Sensing in the Southeast Asian Maritime Continent to Characterize Regional Proficiencies in Smoke Transport Modeling. J. Appl. Meteorol. Clim. 2016, 55, 3–22. [Google Scholar] [CrossRef]
  32. Canagaratna, M.; Jayne, J.; Jimenez, J.; Allan, J.; Alfarra, M.; Zhang, Q.; Onasch, T.; Drewnick, F.; Coe, H.; Middlebrook, A.; et al. Chemical and microphysical characterization of ambient aerosols with the aerodyne aerosol mass spectrometer. Mass Spectrom. Rev. 2007, 26, 185–222. [Google Scholar] [CrossRef]
  33. Ng, N.L.; Canagaratna, M.R.; Zhang, Q.; Jimenez, J.L.; Tian, J.; Ulbrich, I.M.; Kroll, J.H.; Docherty, K.S.; Chhabra, P.S.; Bahreini, R.; et al. Organic aerosol components observed in Northern Hemispheric datasets from Aerosol Mass Spectrometry. Atmos. Chem. Phys. 2010, 10, 4625–4641. [Google Scholar] [CrossRef] [Green Version]
  34. Kirchstetter, T.W.; Novakov, T.; Hobbs, P.V. Evidence that the spectral dependence of light absorption by aerosols is affected by organic carbon. J. Geophys. Res. Atmos. 2004, 109, 1−12. [Google Scholar] [CrossRef] [Green Version]
  35. Singh, A.; Rastogi, N.; Patel, A.; Satish, R.V.; Singh, D. Size-segregated characteristics of carbonaceous aerosols over the north western Indo-Gangetic Plain: Year-round temporal behavior. Aerosol. Air Qual. Res. 2016, 16, 1615–1624. [Google Scholar] [CrossRef] [Green Version]
  36. Ramachandran, S.; Rupakheti, M.; Lawrence, M.G. Black carbon dominates the aerosol absorption over the Indo-Gangetic Plain and the Himalayan foothills. Environ. Int. 2020, 142, 105814. [Google Scholar] [CrossRef]
  37. de Gouw, J.; Warneke, C. Measurements of volatile organic compounds in the earth’s atmosphere using proton-transfer-reaction mass spectrometry. Mass Spectrom. Rev. 2007, 26, 223–257. [Google Scholar] [CrossRef] [PubMed]
  38. Zhang, R.; Jing, J.; Tao, J.; Hsu, S.-C.; Wang, G.; Cao, J.; Lee, C.S.L.; Zhu, L.; Chen, Z.; Zhao, Y.; et al. Chemical characterization and source apportionment of PM2.5 in Beijing: Seasonal perspective. Atmos. Chem. Phys. Discuss. 2013, 13, 7053–7074. [Google Scholar] [CrossRef] [Green Version]
  39. Yu, L.D.; Wang, G.F.; Zhang, R.J.; Zhang, L.M.; Song, Y.; Wu, B.B.; Li, X.F.; An, K.; Chu, J.H. Characterization an source apportionment of PM2.5 in an urban environment in Beijing. Aerosol. Air Qual. Res. 2013, 13, 574–583. [Google Scholar] [CrossRef] [Green Version]
  40. Liu, B.; Li, T.; Yang, J.; Wu, J.; Wang, J.; Gao, J.; Bi, X.; Feng, Y.; Zhang, Y.; Yang, H. Source apportionment and a novel approach of estimating regional contributions to ambient PM2.5 in Haikou, China. Environ. Pollut. 2017, 223, 334–345. [Google Scholar] [CrossRef] [PubMed]
  41. Heo, J.-B.; Hopke, P.K.; Yi, S.-M. Source apportionment of PM2.5 in Seoul, Korea. Atmos. Chem. Phys. Discuss. 2009, 9, 4957–4971. [Google Scholar] [CrossRef] [Green Version]
  42. Jeong, J.H.; Shon, Z.H.; Kang, M.; Song, S.K.; Kim, Y.K.; Park, J.; Kim, H. Comparison of source apportionment of PM2.5 using receptor models in the main hub port city of East Asia: Busan. Atmos. Environ. 2017, 148, 115–127. [Google Scholar] [CrossRef]
  43. Yau, P.S.; Lee, S.C.; Cheng, Y.; Huang, Y.; Lai, S.C.; Xu, X.H. Contribution of ship emissions to the fine particulate in the community near an internationalport in Hong Kong. Atmos. Res. 2013, 124, 61–72. [Google Scholar] [CrossRef]
  44. Cheng, Y.; Lee, S.; Gu, Z.; Ho, K.; Zhang, Y.; Huang, Y.; Chowa, J.C.; Watson, J.G.; Cao, J.; Zhang, R. PM2.5 and PM10-2.5 chemical composition and source apportionment near a Hong Kong roadway. Particuology 2014, 18, 96–104. [Google Scholar] [CrossRef]
  45. Wimolwattanapun, W.; Hopke, P.K.; Pongkiatkul, P. Source apportionment and potential source locations of PM2.5 and PM2.5–10 at residential sites in metropolitan Bangkok. Atmos. Pollut. Res. 2011, 2, 172–181. [Google Scholar] [CrossRef] [Green Version]
  46. Islam, M.; Jayarathne, T.; Simpson, I.J.; Werden, B.; Maben, J.; Gilbert, A.; Praveen, P.S.; Adhikari, S.; Panday, A.K.; Rupakheti, M.; et al. Ambient air quality in the Kath-mandu Valley, Nepal during the pre-monsoon: Concentrations and sources of particulate matter and trace gases. Atmos. Chem. Phys. 2020, 20, 2927–2951. [Google Scholar] [CrossRef] [Green Version]
  47. Bandyopadhyay, A. Neurological Disorders from Ambient (Urban) Air Pollution Emphasizing UFPM and PM2.5. Curr. Pollut. Rep. 2016, 2, 203–211. [Google Scholar] [CrossRef] [Green Version]
  48. Genc, S.; Zadeoglulari, Z.; Fuss, S.H.; Genc, K. The adverse effects of air pollution on the nervous system. J. Toxicol. 2012, 2012, 782462. [Google Scholar] [CrossRef] [Green Version]
Figure 1. Fractional contributions of three major components of ambient organic aerosols (OAs) observed at IITDelhi (during 16 January–11 March 2018).
Atmosphere 12 01432 g001
Figure 2. Fractional contributions of the factors of elements in PM2.5 samples collected in Delhi inwinter 2019.
Atmosphere 12 01432 g002
Figure 3. Fractional contribution of the factors of VOCs at IITDelhi (during 16 January–11 March 2018).
Atmosphere 12 01432 g003
Figure 4. Time series of particulate OA, NO3, BC, SO4, NH4, Chl, gaseous VOCs, and nine factors of elements at the IIT Delhi site for the span of the study period from Lalchandani et al., Wang et al. and Rai et al. [10,12,13]. Vertical red lines indicate the phase of gradual changes in all pollutants during the two-week period of 13–26 February 2018.
Atmosphere 12 01432 g004
Figure 5. Time series of particulate OA, NO3, BC, SO4, NH4, Chl, gaseous VOCs, and nine factors of elements (dust, nonexhaust, SFC1, SFC2, S-rich, Cr-Ni-Mn, Cl-Br-Se, Cu-Cd-Pb, and Pb-Sn-Se) during 13–26 February 2018 at the IITDelhi site.
Atmosphere 12 01432 g005
Figure 6. Fractional contributions of the major five sources of different types of PM2.5 and VOCs in Delhi during late winter.
Atmosphere 12 01432 g006
Table 1. The information on the instruments used for measuring different pollutant parameters at different sites (the details are in the main text).
InstrumentsSite of Sample CollectionSampling PeriodType of Samples and VolumeParameters
High-resolution time-of-flight aerosol mass spectrometer (HR-ToF-AMS)MRIIRS
Faridabad
IITDelhi
27 January–15 March 2018
17–19 January 2018 and
5 February–11 March 2018
Ambient air 0.0.08 L/minReal-time nonrefractory and size-resolved PM2.5 speciation
Time-of-flight aerosol chemical speciation monitor (ToF-ACSM)IITMDelhi17 February–15 March 2018ambient air (0.1 L/min)Real-time bulk nonrefractory PM2.5 speciation
Proton-transfer-reaction time-of-flight mass spectrometer (PTR-ToF-MS)IITDelhi
MRIIRS
Faridabad
18 January–10 March 2018
16 January–8 March 2018
ambient air (0.06 L/min)High time- and mass-resolved online measurements of volatile organic compounds
Aethalometer (AE 33)IITDelhi
IITMDelhi
17–19 January 2018
and 5 February–11 March 2018
17 February–15 March 2018
Ambient air
sampled
on a quartz filter tape
(3 L/min)
Black carbon mass concentration
PILS-LWCC-TOC analyzerIITDelhi9 January–3 March 2018PILS liquid,
sample flow rate (0.7 mL/min) and air sampling flow rate
(16.7 L/min)
Ambient aerosol
extracts at wavelengths ranging from 300 to 600 nm and water-soluble BrC
Single-particle soot photometer (SP2)MRIIRS
Faridabad
27 January–15 March 2018Ambient airBlack carbon (BC) mass concentration, BC number concentration, BC size distribution, BC mixing state
Xact 625i® ambient metals monitorIITDelhi20 January–11 March in 2018
15 January–9 February 2019
Ambient air
Sampled
on Teflon filter tape
(16.7 L/min)
Equipped to report the following 44 elements—Al, Si, P, S, Cl, K, Ca, Ti, V, Cr, Mn, Fe, Co, Ni, Cu, Zn, Ga, Ge, As, Se, Br, Rb, Sr, Y, Zr, Mo, Pd, Ag, Cd, In, Sn, Sb, Te, Cs, Ba, La, Ce, W, Pt, Au, Hg, Tl, Pb, and Bi
High-volume samplerIITDelhiJanuary–December 2018Ambient air
sampled on quartz filter media
PM2.5
EC-OC analyzer, TOC-L analyzer and ion chromatography, inductively coupled plasma mass spectroscopy (ICP-MS)IITDelhi
IITMDelhi
MRIIRS
Faridabad
January–December 2018Offline analysis of quartz filter mediaElemental carbon (EC), organic carbon (OC), and total organic carbon (TOC), and major anions and cations (Na+, K+, Ca2+, Cl and SO42−)
Real-time oxidative potential (OP) instrumentIITDelhi3–9 February 2019Ambient airMeasures the ability of particles to consume antioxidants and estimates the toxicity of particulate matters
Table 2. The sampling period mean concentrations of organics, nitrate, sulfate, ammonium, chloride, BC, elemental PM2.5, and VOCs (values are in µgm−3 ± standard deviation, except for VOCs, which arein ppbv) as reported by Lalchandani et al. and Rai et al. [10,12].
IITDelhiIITMDelhiMRIIRS, Delhi
Organics65.3 ± 51.6855 ± 37.432.4 ± 20.5
NO313.3 ± 12.111.1 ± 88 ± 6.2
SO412 ± 10.112.5 ± 5.38.9 ± 6.2
NH414.3 ± 13.513.6 ± 11.49 ± 6.9
Cl20.4 ± 30.322.3 ± 27.67.7 ± 10
BC24.5 ± 20.614.4 ± 9.93.3 ± 2.4
* PM2.5elements32.6
VOCs27.6 19.4
* Unlike the other types, PM2.5elements data obtained from Rai et al. is for the year 2019 in late winter instead of 2018, but for the same span of 17 January–11 March. No measurement for PM2.5elements was available for 2018 [12].
Table 3. The fractional contributions (in%) of three major sources to PM2.5 at different urban sites in Asia (the details are in the main text).
Site (Sampling Year)Traffic EmissionsBiomass Burning/SFCSecondary Aerosols
Delhi (2018)33.7527.3829.77
Beijing (2010)17.111.226.5
Haikou (2013–2015)10.5–20.2----9.9–21.4
Seoul (2009)27.913.6 ± 11.441.4
Hong Kong (2014)292327
Bangkok (2011)7.65 ± 4.424.51 ± 4.172.39 ± 2.49
Publisher’s Note: MDPI stays neutral with regard to jurisdictional claims in published maps and institutional affiliations.

