Article

Global Radiative Sky Cooling Potential Adjusted for Population Density and Cooling Demand

1
Department of Mechanical Engineering, University of Colorado, Boulder, CO 80309, USA
2
Materials Science & Engineering Program, University of Colorado, Boulder, CO 80309, USA
3
School of Energy and Power Engineering, Huazhong University of Science and Technology, Wuhan 430074, China
4
State Key Laboratory of Coal Combustion, Huazhong University of Science and Technology, Wuhan 430074, China
*
Authors to whom correspondence should be addressed.
Atmosphere 2021, 12(11), 1379; https://doi.org/10.3390/atmos12111379
Submission received: 15 September 2021 / Revised: 17 October 2021 / Accepted: 18 October 2021 / Published: 21 October 2021

Abstract

:
Thanks to recent advances in nanophotonics and scalable manufacturing of metamaterials, radiative sky cooling has emerged as a “self-reliant” cooling technology with various potential applications. However, not every region across the globe is well suited for the adoption of radiative cooling technologies, depending on the local climate, population density, cooling demand, air conditioning saturation, economic prosperity, etc. Because the atmospheric downward longwave radiation, especially the portion from the atmospheric window (8–13 µm), is substantially affected by weather conditions, the performance of a well-designed radiative cooler can be vastly different across regions and seasons. Here, we first map the global radiative sky cooling potential in the form of net cooling power density. We then further evaluate it based on the global population density and cooling demand. In terms of the adjusted potential, we show that geographically and demographically “transitional” regions, located between wet and dry climates as well as sparsely and densely populated regions, are better suited for the adoption of radiative cooling technologies because of their temperate climate and moderate population density. Even in densely populated and humid regions, the cumulative impact and other accompanying benefits must not be ignored.

1. Introduction

Radiative sky cooling refers to the process of passively cooling a sky-facing object by maximizing its net emission of longwave thermal radiation and minimizing its absorption of downward shortwave radiation. As illustrated in Figure 1, this process takes advantage of the atmospheric window (8–13 µm) [1] and the extremely low temperature of the universe, i.e., the deep space at ~2.7 K [2]. When a horizontally placed surface with high emissivity, preferably in the atmospheric window, emits more radiation than it receives from the sun and the atmosphere, its temperature can drop below the ambient temperature [3]. The Earth itself is the largest radiative cooling object, manifesting its sub-ambient cooling potential through occasional occurrences of dew or frost in some clear-sky mornings [4]. This self-cooling capability of sky-facing surfaces gives the inspiration that a highly solar-reflective and yet highly infrared-emissive object can relentlessly maintain its coolness even during the day.
Significant research progress has been made in recent years to demonstrate daytime sub-ambient radiative sky cooling through materials design [3,5,6,7,8,9,10,11] and systems engineering [12,13,14,15,16]. Radiative sky cooling can be an attractive complement or even an alternative to traditional cooling technologies such as power-intensive air conditioning [15,17,18,19,20] and water-intensive and thermally polluting wet cooling in thermal power plants [21,22,23,24,25]. It also has the potential of improving the performances of solar cells [26,27,28], thermoelectric devices [29,30,31], clothing textiles [32,33,34], smart materials [35,36,37], and colored objects [38,39,40]. Thanks to its intrinsic capability to dissipate heat directly into the deep space through the atmospheric window as opposed to dumping it into the surrounding environment, radiative sky cooling can even possibly mitigate the urban heat island effect to achieve temperature reductions in cities around the world [41,42].
However, even for a well-designed radiative cooler, how much benefit it eventually brings depends on the local climate. In this regard, studies have been conducted to theoretically and/or experimentally investigate the effect of weather conditions (mainly temperature and humidity) on radiative sky cooling [13,43,44,45]. A broader understanding of radiative cooling potential is desirable for all prospective regions across the globe to evaluate its feasibility [46,47]. More importantly, the seasonal anomaly of cooling potential, population density, and global cooling demand are important factors that determine the applicability and effectiveness of radiative sky cooling. For example, dry regions tend to have high radiative cooling potential but low population density, diminishing the interest in implementing radiative cooling in these regions. However, humid regions tend to have low radiative cooling potential but high population density, again weakening the interest in radiative cooling if land availability and individual impact become a concern. In this work, we create global maps of radiative sky cooling potential with considerations of weather conditions, seasonal cooling anomaly, global population density, and cooling demand.

2. Methodology

2.1. Radiative Cooling Model

Creating a global map of radiative cooling potential requires a radiative heat transfer model that is accurate, comprehensive, and yet readily applicable. Although spectral radiative cooling models have been used to estimate the net cooling power of radiative coolers that agrees with specific experimental measurements [3,48,49,50], there are still misunderstandings and unrealistic practices in the modeling of radiative sky cooling. For example, a common practice is the use of ambient weather conditions such as the surface air temperature and humidity instead of the altitude-dependent atmospheric profiles to evaluate the atmospheric downward longwave radiation. This practice of treating the atmosphere as a solid surface appears counter-intuitive because, as illustrated in Figure 1, the downward longwave radiation comes from various altitudes of the atmosphere with different temperatures, pressures, and water vapor contents. Since the ambient temperature represents the maximum temperature of the lowest and densest layer of the atmosphere, we can easily conclude that using only the ambient temperature (as opposed to the atmospheric temperature profile) leads to an overestimated atmospheric downward radiation. The temperature plays two roles here: a direct role in Planck’s blackbody emission to determine the atmospheric downward radiation, and an indirect role in limiting the atmospheric precipitable water (PW) [13,51,52]. Here, precipitable water is defined as the thickness of the atmospheric water vapor when condensed into liquid water. Precipitable water in the atmosphere dynamically changes throughout a day depending on the temperature and relative humidity, thus affecting the atmospheric transmittance or its effective emissivity, especially in the atmospheric window of 8–13 µm [3]. The atmospheric effective emissivity may be better defined as (1—Transmittance) because the atmosphere is not a solid surface and does not have uniform density, composition, and temperature across its thickness. Therefore, the accuracy of temperature and precipitable water in the model used eventually affects the validity of the atmosphere spectral emissivity and thus the downward longwave radiation. We briefly discuss below why and when using only surface air temperature and relative humidity is acceptable.
Under clear-sky conditions, downward longwave monochromatic radiation received at a given altitude z in the sky and a zenith angle θ can be calculated by integrating radiation from all altitudes above this altitude z [51]. Considering the attenuation of radiation as it travels through the atmosphere, it is expressed as
P λ , θ , z , c l e a r = z k λ cos θ ρ ( ξ ) E λ ( T ( ξ ) ) · { exp [ z ξ k λ cos θ ρ ( ζ ) d ζ ] } d ξ ,
where ρ ( ξ ) and T ( ξ ) are respectively the altitude-dependent atmospheric density and temperature profiles, k λ is the wavelength-dependent absorption coefficient of atmospheric species, and E λ ( T ) is the blackbody spectral radiance. The above equation satisfies the boundary condition that at the top of the atmosphere downward longwave radiation is zero; that is, P λ , θ , z = = 0 .
The atmospheric radiation absorbed by a radiative cooling surface on the Earth’s surface ( z = 0 ) under clear-sky conditions can be then obtained by integrating over all altitudes, directions, and wavelengths as
P a t m , z = 0 , c l e a r = 0 0 2 π 0 π 2 ε s ( λ , θ ) P λ , θ , z = 0 sin θ cos θ d θ d φ d λ ,  
where ε s ( λ , θ ) is the spectral and angular emissivity or absorptivity of the radiative cooling surface.
Although the above equations accurately describe the total atmospheric downward radiation absorbed by a radiative cooling surface under clear-sky conditions, it requires well-defined atmospheric profiles for temperature, species densities (HO2, O2, CO2, O3, N2O, CH4, etc.), spectral absorption coefficients of species, etc., at each geographical location [51,52]. Among these parameters, the temperature and precipitable water vapor are the most dynamic, whereas other parameters such as O2 and CO2 densities are relatively stable over short periods. Complex atmospheric profiles can be defined, and atmospheric downward longwave radiation can be solved with specialized tools such as MODTRAN [52,53].
In recent studies, as an approximation by treating the atmosphere as a solid surface, the ambient temperature ( T a m b ), rather than the altitude-dependent temperature profile, has often been used. In this simplified case,
P λ , θ , z = 0 , c l e a r I B ( T a m b , λ ) · ε a t m ( λ , θ ,   P W ,   ) ,
where the effective atmospheric spectral emissivity ε a t m can be evaluated from the transmittance of the atmosphere as a function of various compositions, especially PW. In case PW is not directly known, it may be estimated from the ambient temperature ( T a m b ) and the specific humidity (SH) or relative humidity (RH). Even though PW is technically an integrated water vapor over the altitude, both Tamb and RH are specific to the near-surface ambient [13,54]. That is,
S H = R H · 3800 exp ( 17.625 T a m b + 243.04 )   p a m b ,   a n d   P W a · S H + b ,
where SH is the surface air specific humidity (g/kg), p a m b is the near-surface ambient pressure (Pa), the surface air ambient temperature T a m b has the unit of °C, PW has the unit of mm, and a and b are constants. Here, the value of coefficient a mostly varies within 2~2.5 depending on the altitude and sky clarity based on our regression analyses of the US weather data. Meanwhile, the value of b is of less significance compared to the value of generally observed precipitable water.
Upward radiation from the radiative cooling surface working at the ambient temperature, P s u r f a c e ( T a m b ) , can be readily calculated using its spectral emissivity [13]. Solar absorption by the surface, P s o l a r = α s o l a r P s u n , should be taken into consideration for daytime radiative cooling. The net cooling power is then expressed as
P n e t , r a d = P s u r f a c e ( T a m b ) P a t m , z = 0 P s o l a r .
The above model is applicable under clear-sky conditions. However, clouds can have substantial effects on the net cooling power of a cooler, especially under humid tropical and subtropical climates. The downward radiation from clouds varies significantly depending on the cloud base height, base temperature, thickness, and properties [55]. As only the global cloud cover fraction data is available in this work, we consider the cloud cover effect on the global radiative cooling potential by following the evaluated approaches from Ref. [56]. By parameterizing the atmospheric downward longwave radiation received at the Earth surface into clear-sky and cloudy-sky two components, P a t m , z = 0 is written as
P a t m , z = 0 = ( 1 f ) P a t m , Z = 0 , c l e a r + f P a t m , Z = 0 , c l o u d y ,
where f is the cloud cover fraction. P a t m , Z = 0 , c l o u d y is evaluated using the method described below.
Regarding the downward radiation from clods, two major uncertain factors are cloud temperature and cloud emissivity. Martin et al. [57]. argued that the cloud factor (different from the cloud cover fraction) is expected to be small for high (cold) clouds and to be near unity for low (warm) clouds, and that it is exponentially proportional to the cloud base temperature or cloud base height. Since we have only cloud cover fraction data on the global scale, we argue in a similar manner next. (i) If the sky is completely covered by clouds ( f = 1 ), the cloud base is near the Earth’s surface and acts as a black body ( T c l o u d T a m b   and   ε c l o u d = 1 ) . (ii) If the sky is partially covered by clouds ( f < 1 ), the cloud base tends to be higher and colder, and the cloud cover fraction is exponentially proportional to the cloud base temperature,
f = exp ( T a m b T c l o u d Δ T o ) ,
where Δ T o is a reference temperature difference. We still assume the cloud emissivity is unity since the main component of clouds is water crystals that can have an emissivity of 1 even in the atmospheric window of 8–13 µm [58]. Targeting the least overall error across the globe, we assume Δ T o = 10   ° C (see Section 3.1). Therefore, the cloud base temperature may be evaluated from the cloud cover fraction as
T c l o u d = ln ( f ) Δ T o + T a m b .
The net cooling power with the cloud effect is then
P n e t , r a d = P s u r f a c e ( 1 f ) P a t m , Z = 0 , c l e a r f σ T c l o u d 4 P s o l a r .
Above, when the cloud cover fraction approaches 0, the cloud temperature is allowed to be very low since f σ T c l o u d 4 also approaches zero. When the cloud cover fraction is 1, the cloud temperature is the same as the ambient temperature.
Further uncertainties in the net cooling power may be introduced by insufficient temporal resolutions of the ambient temperature, precipitable water, and cloud cover fraction datasets. The uncertainties in the net cooling power associated with model simplification, temporal resolution, and data inaccuracies are discussed in Section 3.1.

2.2. Effective Atmospheric Emissivity

The clear-sky effective atmospheric spectral emissivity was modeled using a complete set of atmospheric profiles. Among the atmospheric compositions, CO2, O2, O3, N2O, CH4, and many other gases including refrigerants are relatively constant, whereas PW changes over the range of 2.5~60 mm [59,60]. Default profiles of temperature and water vapor column density provided within MODTRAN are shown in Figure 2a,b, respectively, for the mid-latitude summer atmosphere model. By taking advantage of the relatively constant lapse rate at a given latitude and across a layer of the atmosphere, various temperature profiles were generated by shifting the default temperature profiles, e.g., as in Figure 2a. Specifically, atmospheric profiles at various latitudes and temperatures were generated by modifying 5 default atmospheric models in MODTRAN (tropical, mid-latitude summer, mid-latitude winter, sub-arctic summer, and sub-arctic winter). Default atmospheric models were extracted as text files, which were then edited with new precipitable water values and new shifted temperature profiles. The modified atmospheric profiles were then put back into MODTRAN to carry out the computations of necessary data such as atmospheric spectral transmittance and downward longwave radiation.
Precipitable water is directly defined by specifying values in MODTRAN, which is then scaled back to H2O column density profiles as in Figure 2b. In case the relative humidity exceeds 100% in an atmospheric layer, MODTARN places the excess water vapor in other layers of the atmosphere. Under actual atmospheric conditions, the atmospheric temperature and precipitable water can be closely related [14,43]. For instance, cold weather in winter tends to have low precipitable water content, and hot weather in summer tends to have high precipitable water content. Hot and humid weather, of course, has a very high precipitable water content [59]. A relation between precipitable water, ambient temperature, and relative humidity can be obtained based on experimental observations and thermodynamic formulations [13,54]. Based on Equation (4) and assuming a = 2.15 (for ~1600 m elevation in Boulder, CO) [13], Figure 2c shows that precipitable water increases with rising ambient temperature or relative humidity.
In modeling, other atmospheric profiles such as pressure and chemical compositions except for PW were based on standard profiles as they remain relatively constant over time and so are their effects on the atmospheric emissivity. Indeed, those profiles can also be modified to define a specific atmosphere, which is beyond the scope of our work.
We modeled the effects of temperature, precipitable water, and zenith angle on the effective atmospheric spectral emissivity by using altitude-dependent atmospheric profiles with MODTRAN [52,53]. As shown in Figure 3a, the atmospheric temperature profile (represented by the ambient temperature) does not have a substantial effect on the effective atmospheric emissivity. However, as shown in Figure 3b, precipitable water (PW) significantly affects the effective atmospheric emissivity, especially in the atmospheric window (8–13 µm). Since the atmospheric window is essential for the upward radiation from a radiative cooling surface into the deep space, an atmosphere with high precipitable water content essentially traps this upward radiation from the surface and amplifies the greenhouse effect [61,62]. Figure 3c shows that the effective atmospheric spectral emissivity increases as the air mass increase with the zenith angle, which is also much more significant in the atmospheric window.

2.3. Radiative Cooling Potential

We modeled the clear-sky atmospheric downward radiation, Patm,z=0,clear, and the net cooling power of an “ideal black” radiative cooler by using both ambient-temperature-based and temperature-profile-based approaches. The “ideal black” radiative cooler here refers to a solid surface with 95% solar reflectivity in the range of 0.3–2.5 µm and 100% infrared emissivity at all other wavelengths, whereas an “ideal selective” radiative cooler has 100% emissivity in the atmospheric window and zero emissivity at all other wavelengths. The reason for choosing the “ideal black” radiative cooler is that it has better cooling performance when the surface temperature is higher than or the same as the ambient temperature [3,63]. In the simplified ambient-temperature-based approach, the atmosphere is treated as a solid surface with a given temperature and spectral emissivity. Based on our trials, assuming the cooler surface temperature is the same as the ambient, the simplified approach gives the least error when we use Tamb, which is the highest in the densest atmospheric layer, and the zenith-0° atmospheric emissivity, which is the lowest over the hemisphere.
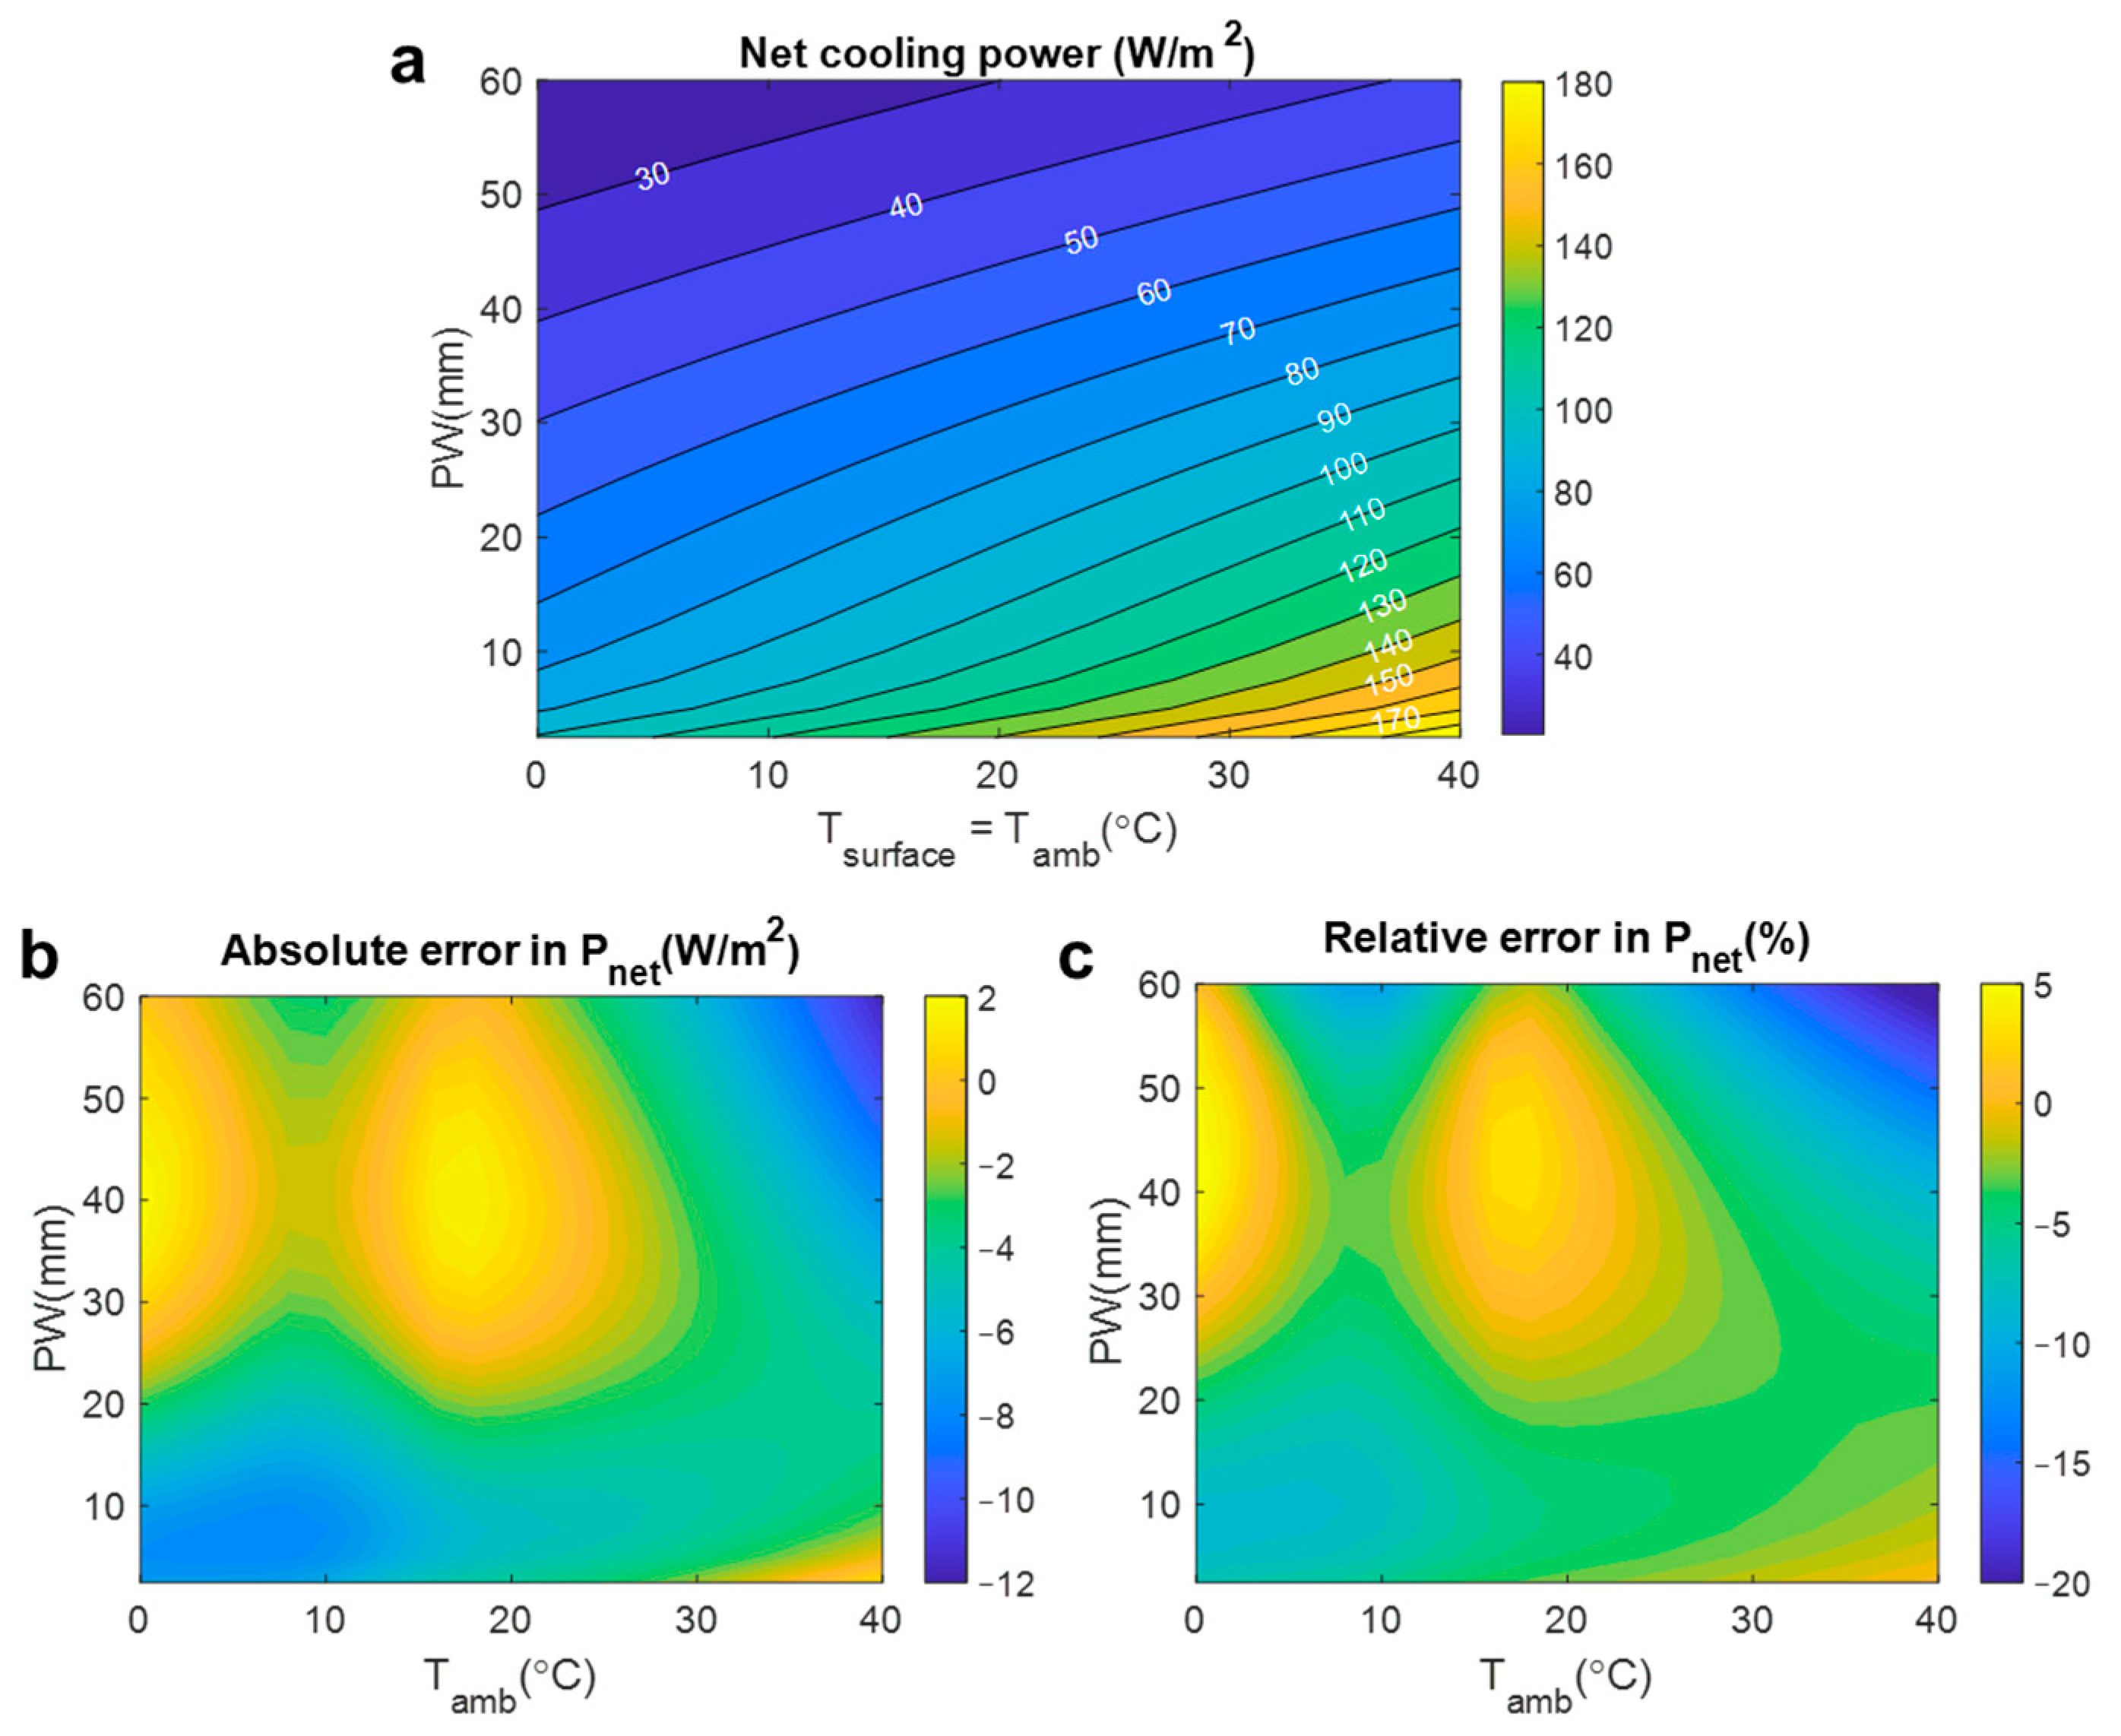
For the ambient temperature range of 0–40 °C and the precipitable range of 2.5–60 mm, we compare in Figure 4 the results from the ambient-temperature-based and temperature-profile-based approaches. The direct observation from the contour lines in Figure 4a is that net cooling power goes up with increasing Tamb and decreasing PW in the atmosphere, although the rate depends on the specific Tamb and PW. It can be easily inferred that hot but dry regions can benefit the most from radiative cooling, although humid and hot regions can still see benefits to a much lesser extent. No solar absorption is included in Figure 4a as it can be simply subtracted.
Absolute and relative errors associated with the net cooling power are given in Figure 4b,c, respectively. Negative and positive signs are retained to highlight overestimation and underestimation. The absolute error in the net cooling power is mostly within ±5 W/m2, with occasional overestimation of 10 W/m2 or more. The corresponding relative error is mostly within ±10%, rarely with 20% underestimation. Reviewing Figure 2c, exceptionally high precipitable water (e.g., PW > 40 mm) only occurs at high ambient temperatures and very high humidity levels (e.g., Tamb > 40 °C and RH > 70%,). Therefore, for frequently observed weather conditions, calculating radiative cooling power using the simplified ambient-temperature-based approach is expected to result in less than 5% relative error for clear-sky conditions.
A lookup table (Table 1) of the baseline net cooling power was also created for the “ideal black” radiative cooler as a function of Tamb and PW when the cooler surface temperature is the same as the ambient temperature. In this table, the intervals of Tamb and PW are 2.0 °C and 2.5 mm, respectively. Solar absorption is not included in the table as it can be easily extracted from the baseline net cooling power if necessary. If 5% solar absorption is also included, the modeled cooling power values in Figure 4a and Table 1 agree reasonably well with previously reported experimental data [13,64].

2.4. Global Datasets of Weather, Population Density, and Cooling Degree Days

To create global radiative cooling potential maps, we collected global monthly weather datasets of the most recent five years (2015–2019), global population density, as well as global cooling degree days from climate observation and data publishing sources (see Table 2 for the data information). The datasets of air temperature at 2 m above the surface and the datasets of horizontal downward solar irradiance were obtained from the European Commission’s Copernicus Climate Change Service [65]. In addition, the datasets of observed downward longwave radiation from the atmosphere were also obtained from Ref. [65]. to evaluate errors in the modeled cooling potential. The atmospheric precipitable water datasets and cloud cover fraction datasets were obtained from the NASA Earth Observatory [66]. 2015 global population density data were obtained from the NASA Socioeconomic Data and Applications Center [67]. The datasets of global monthly cooling degree days were obtained from PANGAEA–Data Publisher for Earth & Environmental Science [68,69]. The datasets were interpolated, if necessary, to have a spatial resolution of 2.5 min, approximately equivalent to 4.6 km at the Equator.
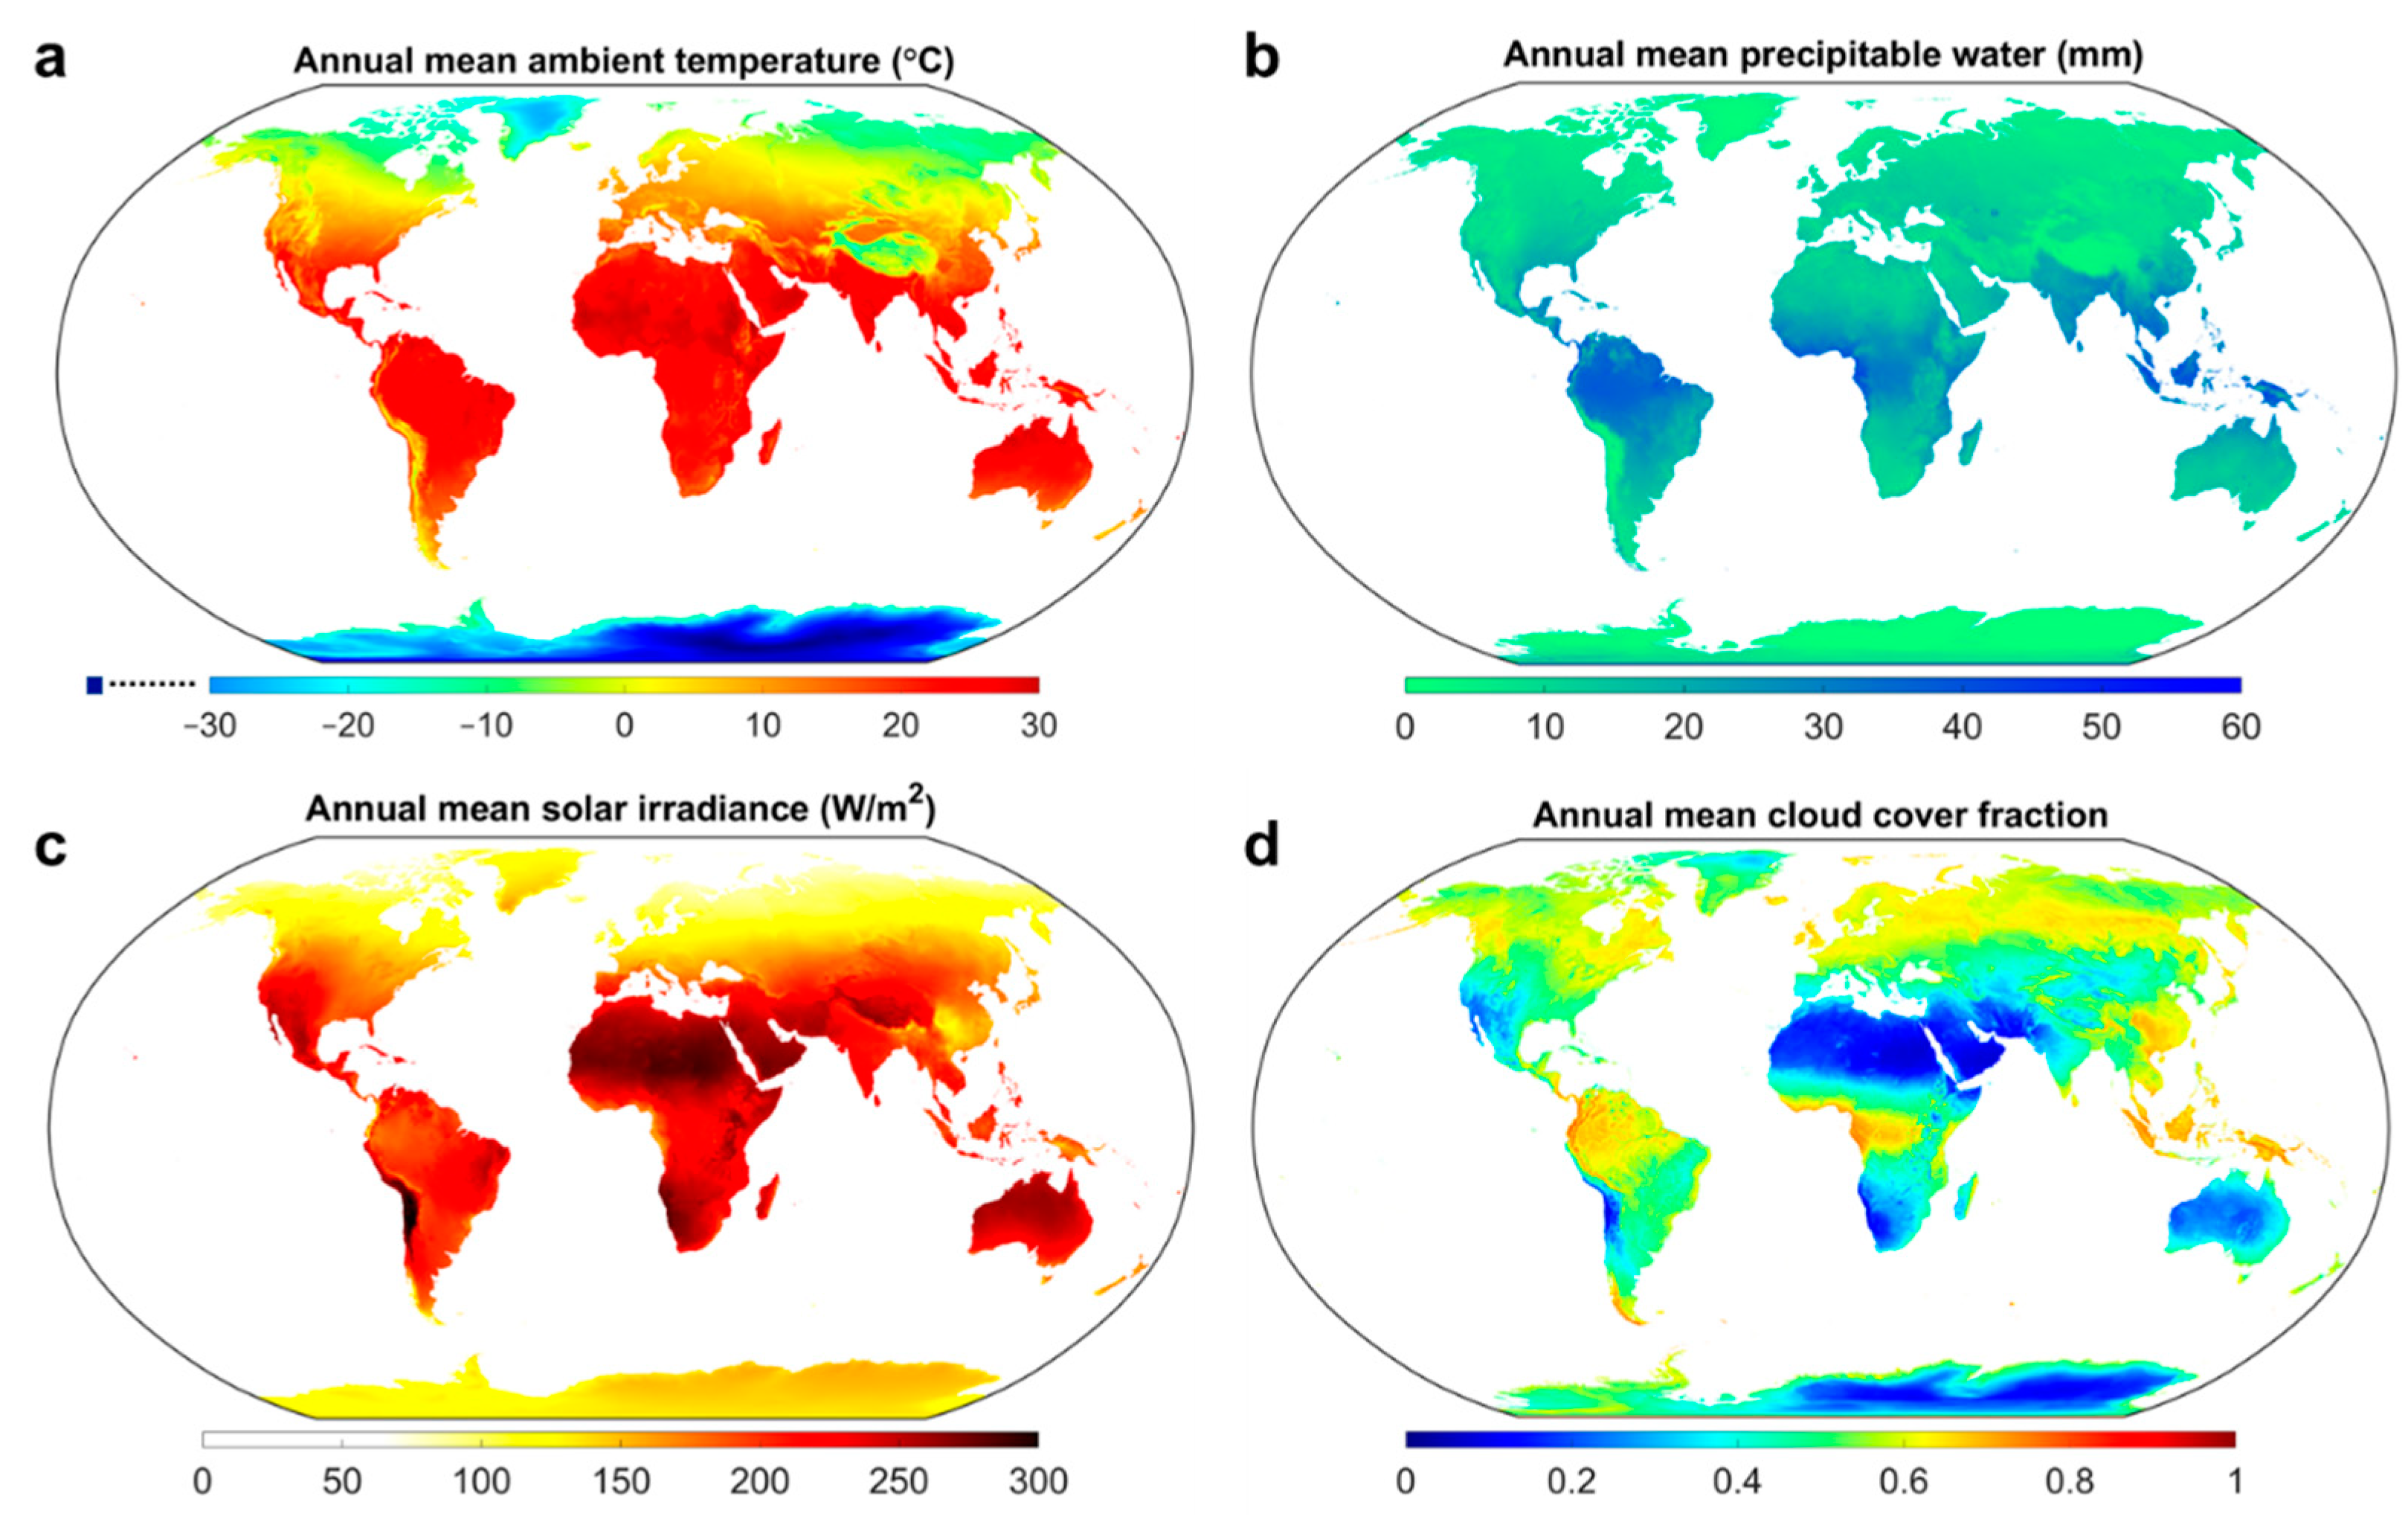
Global maps of the annual mean ambient temperature, precipitable water, solar irradiance, and cloud cover fraction are given in Figure 5a–d, respectively (only data for land surfaces are presented). Except for the two polar regions, northern parts of North America and the Eurasian continents, and the Tibetan plateau, most other regions have an annual average temperature of around or above 18 °C (Figure 5a), indicating that there is a global-scale cooling demand despite the varying degrees of air conditioning adoption rates around the world [70]. The annual average temperature reaches as high as 30 °C at some locations in the tropical regions. The annual average precipitable water map (Figure 5b) shows similar patterns with some exceptions. All regions of high precipitable water also tend to have high ambient temperatures. However, not all regions of high ambient temperature have high precipitable water, with typical exceptions being dry inland areas of Western Asia, Northern Africa, Australia, and the southwestern US. Those dry regions can be ideal locations for radiative cooling applications, although they also tend to have high solar irradiance (Figure 5c). The cloud cover map (Figure 5d) is similar to the precipitable water patterns, showing the close relationship between the two.

3. Results

3.1. Global Radiative Cooling Potential

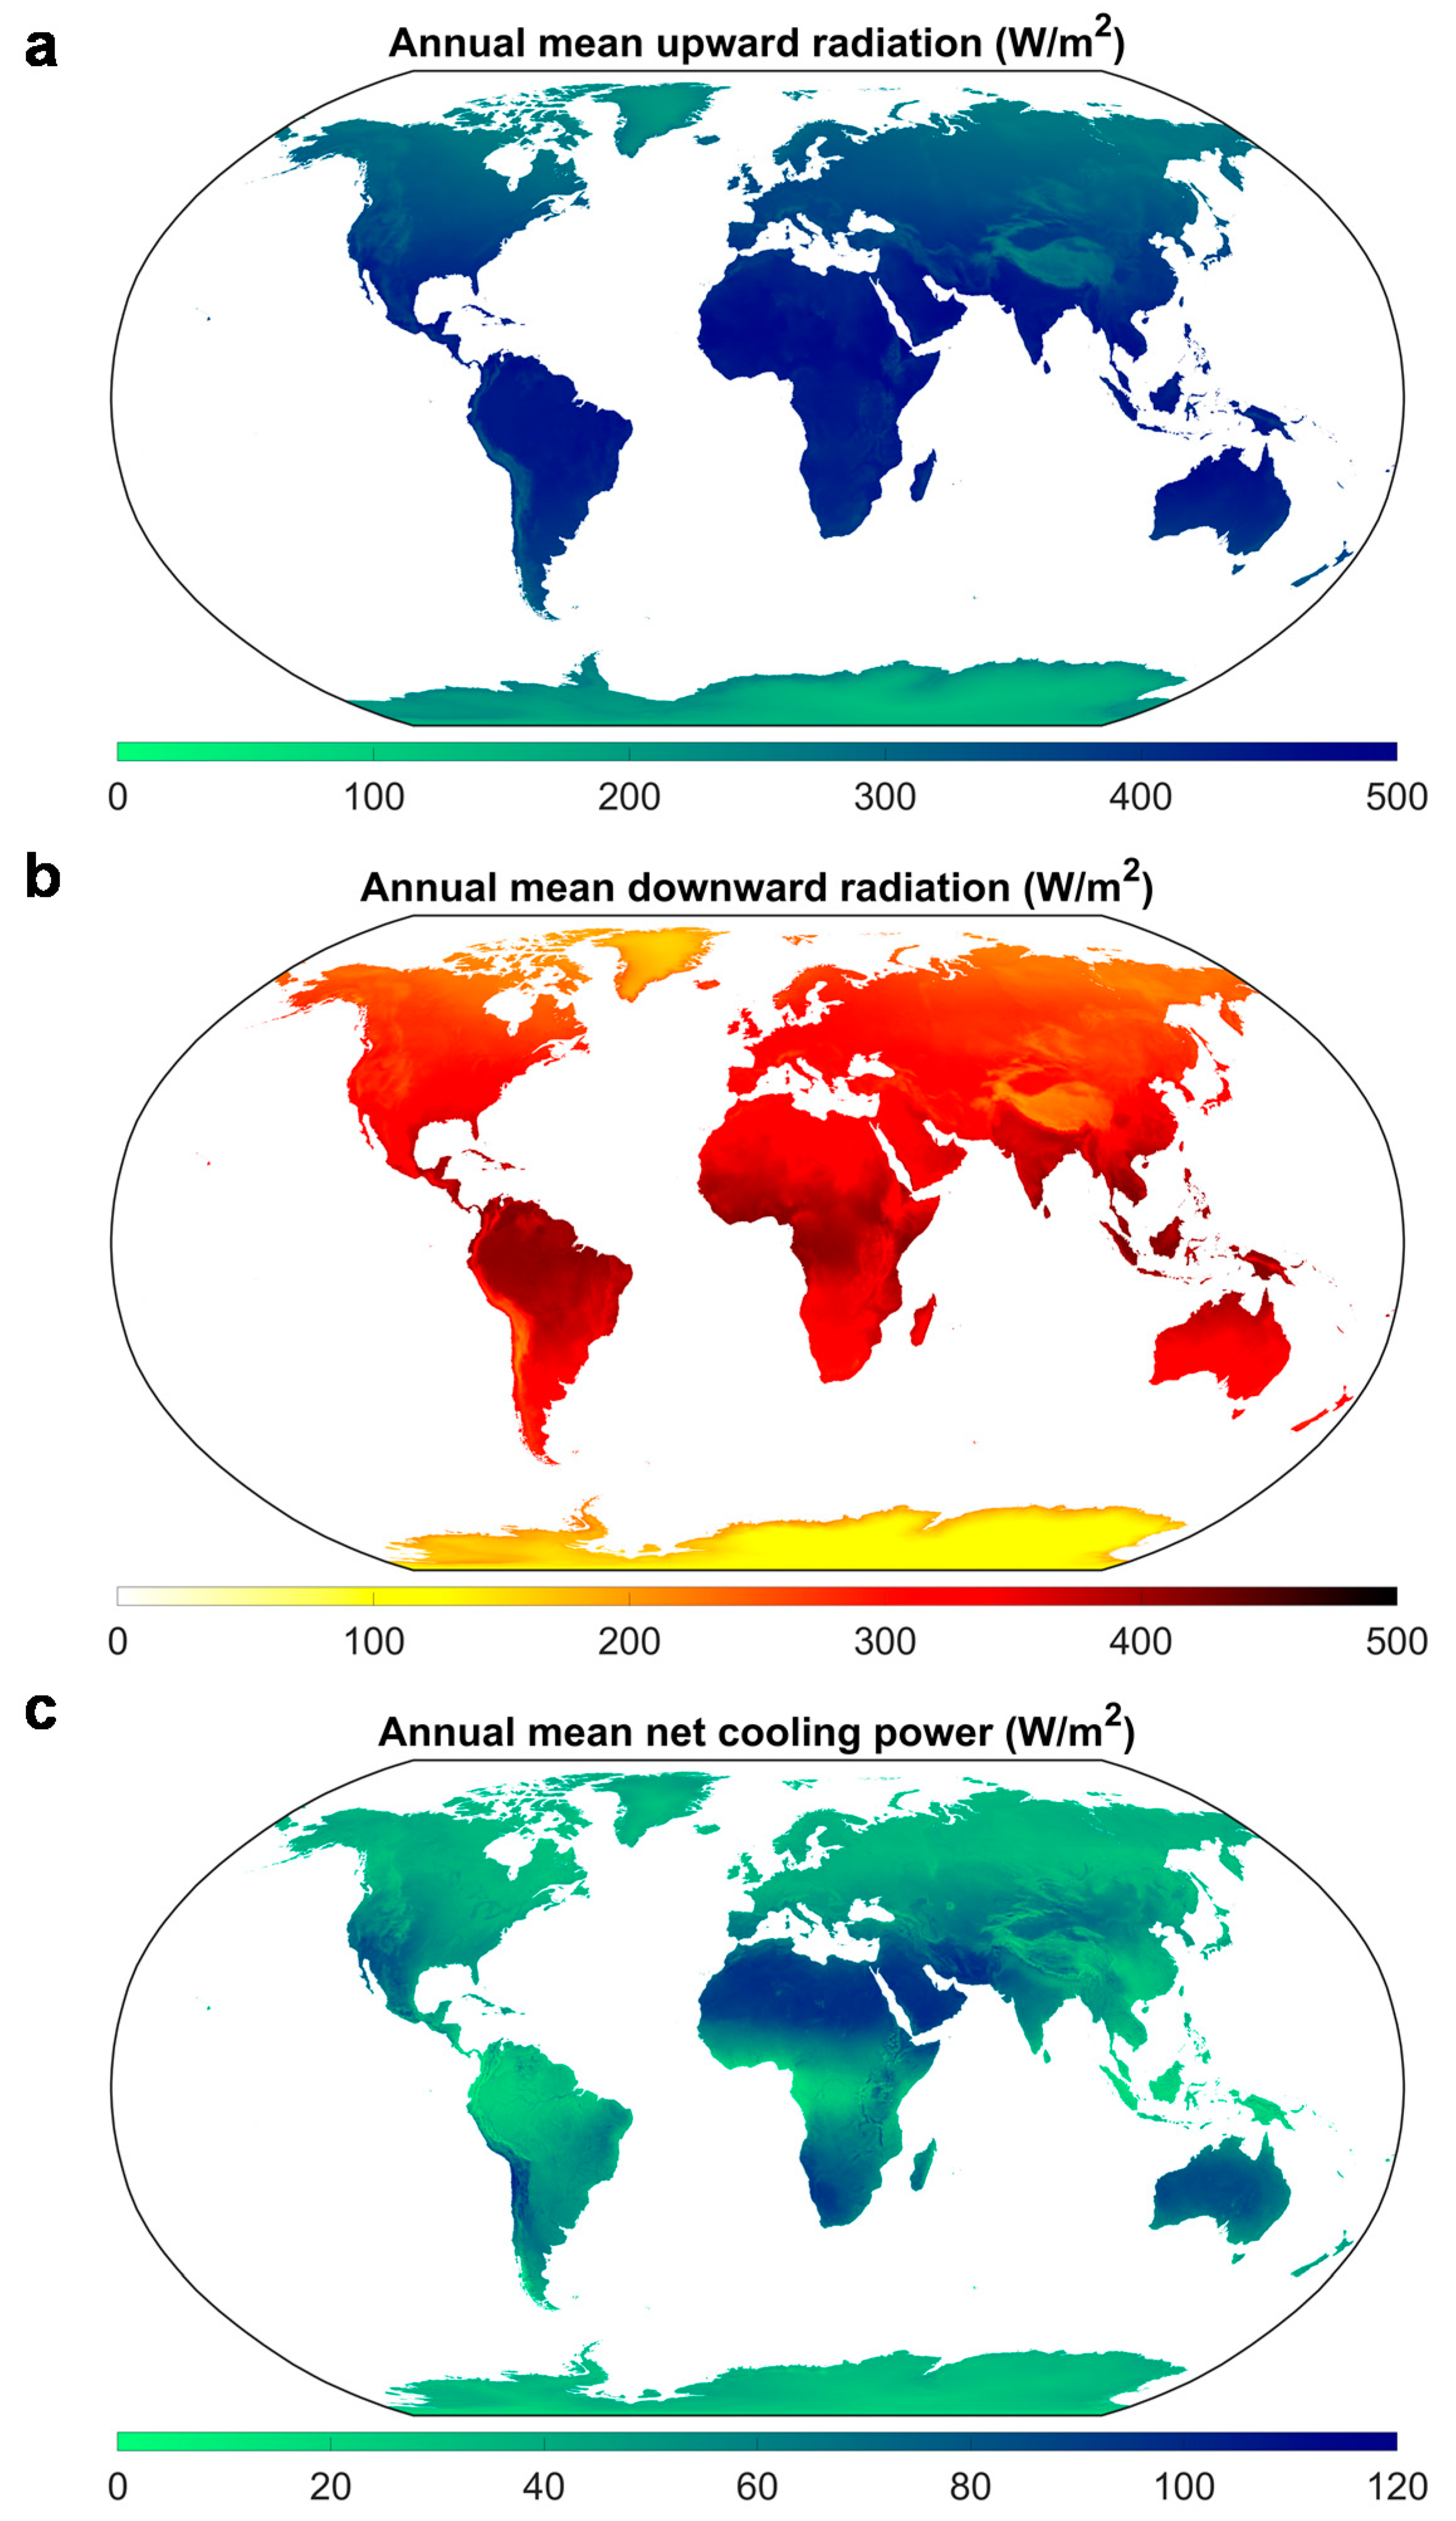
Using the monthly mean weather datasets, the radiative cooling potential of the globe was computed for the “ideal black” radiative cooler with 5% solar absorptivity and working temperature the same as the ambient temperature. Figure 6 shows global maps of the annual mean upward longwave radiation from the cooler, downward longwave radiation from the atmosphere, and the net cooling power. Here, the upward and downward longwave radiations are integrated over the wavelength range of 2.5–100 µm. The downward longwave radiation from the atmosphere also includes cloud cover effects. The net cooling power density includes the upward and downward longwave radiations, as well as the absorbed solar irradiance.
The upward radiation map in Figure 6a resonates well with the temperature map, showing the “ideal black” cooler emits as much as 500 W/m2 into the sky in hot regions. Note that the upward radiation at a given location differs if the cooler works at a temperature different from the ambient temperature, or if the cooler is not “ideal black”. However, the atmospheric downward radiation map in Figure 6b is the result of combined effects from the ambient temperature, precipitable water, and cloud cover, meaning hot and humid regions are subject to the most downward radiation of more than 400 W/m2 from the atmosphere. Here, all atmospheric downward radiation is absorbed by the “ideal black” radiative cooler. The atmospheric downward radiation map agrees well with previous reports [71,72,73].
As shown in the annual mean net radiative cooling potential map (Figure 6c), hot and dry regions are the ideal places for the application of radiative cooling as the cooling potential is in the higher range of 80–110 W/m2. By comparison, hot and humid regions have substantially lower radiative cooling potential in the range of only 10–40 W/m2. Based on the varying degrees of radiative cooling potential across different regions, hot and humid regions may require a much larger radiative cooling area than hot and dry regions to generate the same amount of cold. Consequently, the cost-effectiveness of radiative cooling varies significantly across the globe. If other aspects, such as population density, cooling demand, air conditioning adoption, air pollution, city skylines, etc., are considered, the radiative cooling potential and its cost-effectiveness across the globe can be even more vastly different. Note that the radiative cooling potential map in Figure 6c is an update to the clear-sky cooling potential map in Ref. [47] by including the cloud cover effects.
The cloud cover effects are included in the above results, even though the downward longwave radiation from clouds is subject to significant uncertainties. Precipitable water and cloud cover are closely correlated [66], although clouds tend to be discreetly distributed with a thickness unlike the altitude-dependent continuous distribution of precipitable water. Large uncertainties remain in the estimation of cloud impact on the atmospheric radiation as it is strongly affected by the cloud type, height, thickness, and temperature [55], which is beyond the scope of this work. In addition to errors associated with clouds, the low temporal resolution of temperature and precipitable water datasets may also introduce substantial errors to the atmospheric downward radiation and thus to the net cooling power as they are not linearly related to temperature and precipitable water. Note that for the upward longwave radiation from the “near black” cooler surface, a simple analysis shows that the insufficient temporal resolution does not introduce significant error within a generally observed temperature range in a month (e.g., σ T ˜ 4 ( σ T 4 ) ˜ 1.1   W / m 2   f o r   T = 10 ,   11 , ,   29 ,   30   , where ~ means average).
Using the observed global downward longwave radiation from the atmosphere [65], we re-evaluated the global annual mean radiative cooling potential and compared it against the modeled cases with and without the cloud effects (only the net cooling power with cloud cover effects is given in Figure 6c). Figure 7 shows the histogram of errors across the globe, where the counts are weighted by the cosine of the corresponding latitudes because the datasets are uniformly distributed on the geographic coordinate system. In the case without cloud cover, the annual mean cooling potential is mostly overestimated with a large spread, with most overestimations being in tropical and sub-tropical climates. In the case with cloud cover, the annual mean cooling potential is only overestimated or underestimated with a narrow spread, with overestimations being in humid and hot coastal regions and underestimations being in dry and cold regions. We attribute the reductions in errors across the globe to the inclusion of clove cover and scaling of the cloud temperature with cloud cover. The remaining errors are mainly due to the insufficient temporal resolution of the temperature and PW datasets, uncertainties in the cloud temperature and emissivity, and uncertainties in the modeled clear-sky atmospheric emissivity.

3.2. Global Radiative Cooling Potential Anomaly

Considering most cooling demands occur during the summer, it is important to understand how radiative cooling potential is affected by the summer weather across the globe. We mapped in Figure 8 the global seasonal cooling potentials and their anomaly for summer and winter, respectively. Here, the summer refers to June, July, and August, and the winter refers to January, February, and December. The radiative cooling potential anomaly is defined as the deviation of the seasonal mean cooling potential from the annual mean. A positive anomaly means an increase in the cooling potential and a negative anomaly means a reduction. As Figure 8a,b shows, hot and dry regions can still yield cooling potential as high as 80–110 W/m2. However, regions with subtropical or tropical climates, such as the Indian subcontinent and Southeast Asia, see the most deterioration in the radiative cooling potential during the summer, falling to as low as 10–30 W/m2, because of a substantial increase in precipitable water in their atmosphere. African regions that transition from tropical savanna climates to semi-arid climates see modest declines in the radiative cooling potential to 20–40 W/m2. Other subtropical regions such as the southern US and eastern China also see a slight drop to 20–40 W/m2. The cooling potential of regions with tropical rainforest climates in Africa and South America remains low in the summer because of year-round high precipitable water vapor in their atmosphere. In winter, the opposite of the above changes is mostly true, as shown by Figure 8c,d. The hottest regions with low cooling potential in the summer are also the most densely populated, implying a mismatch between the cooling demand and the radiative cooling potential, which is discussed in Section 3.2.
The mean radiative cooling potential tells how radiative cooling overall performs across the globe. This is especially useful in passive applications such as radiative cooling paints, rooftops, pavements, outdoor clothing, etc., as well as in active cooling systems. The cooling anomaly, however, can also be useful for evaluating if and how large cold storage is needed for active systems such as large-scale cold-water generators [14]. Cold can be better generated during cool seasons or hours, stored, and then used during hot seasons or hours. Regions with a large seasonal cooling potential anomaly may require massive cold storage, if feasible. If the cooling potential anomaly occurs only at a daily or hourly scale, small cold storage can satisfy the need. Underground cold-water reservoirs could sever this purpose for district cooling [74], and insulated water storage tanks for individual home cooling [14].

3.3. Global Radiative Cooling Potential Adjusted for Population Density and Cooling Demand

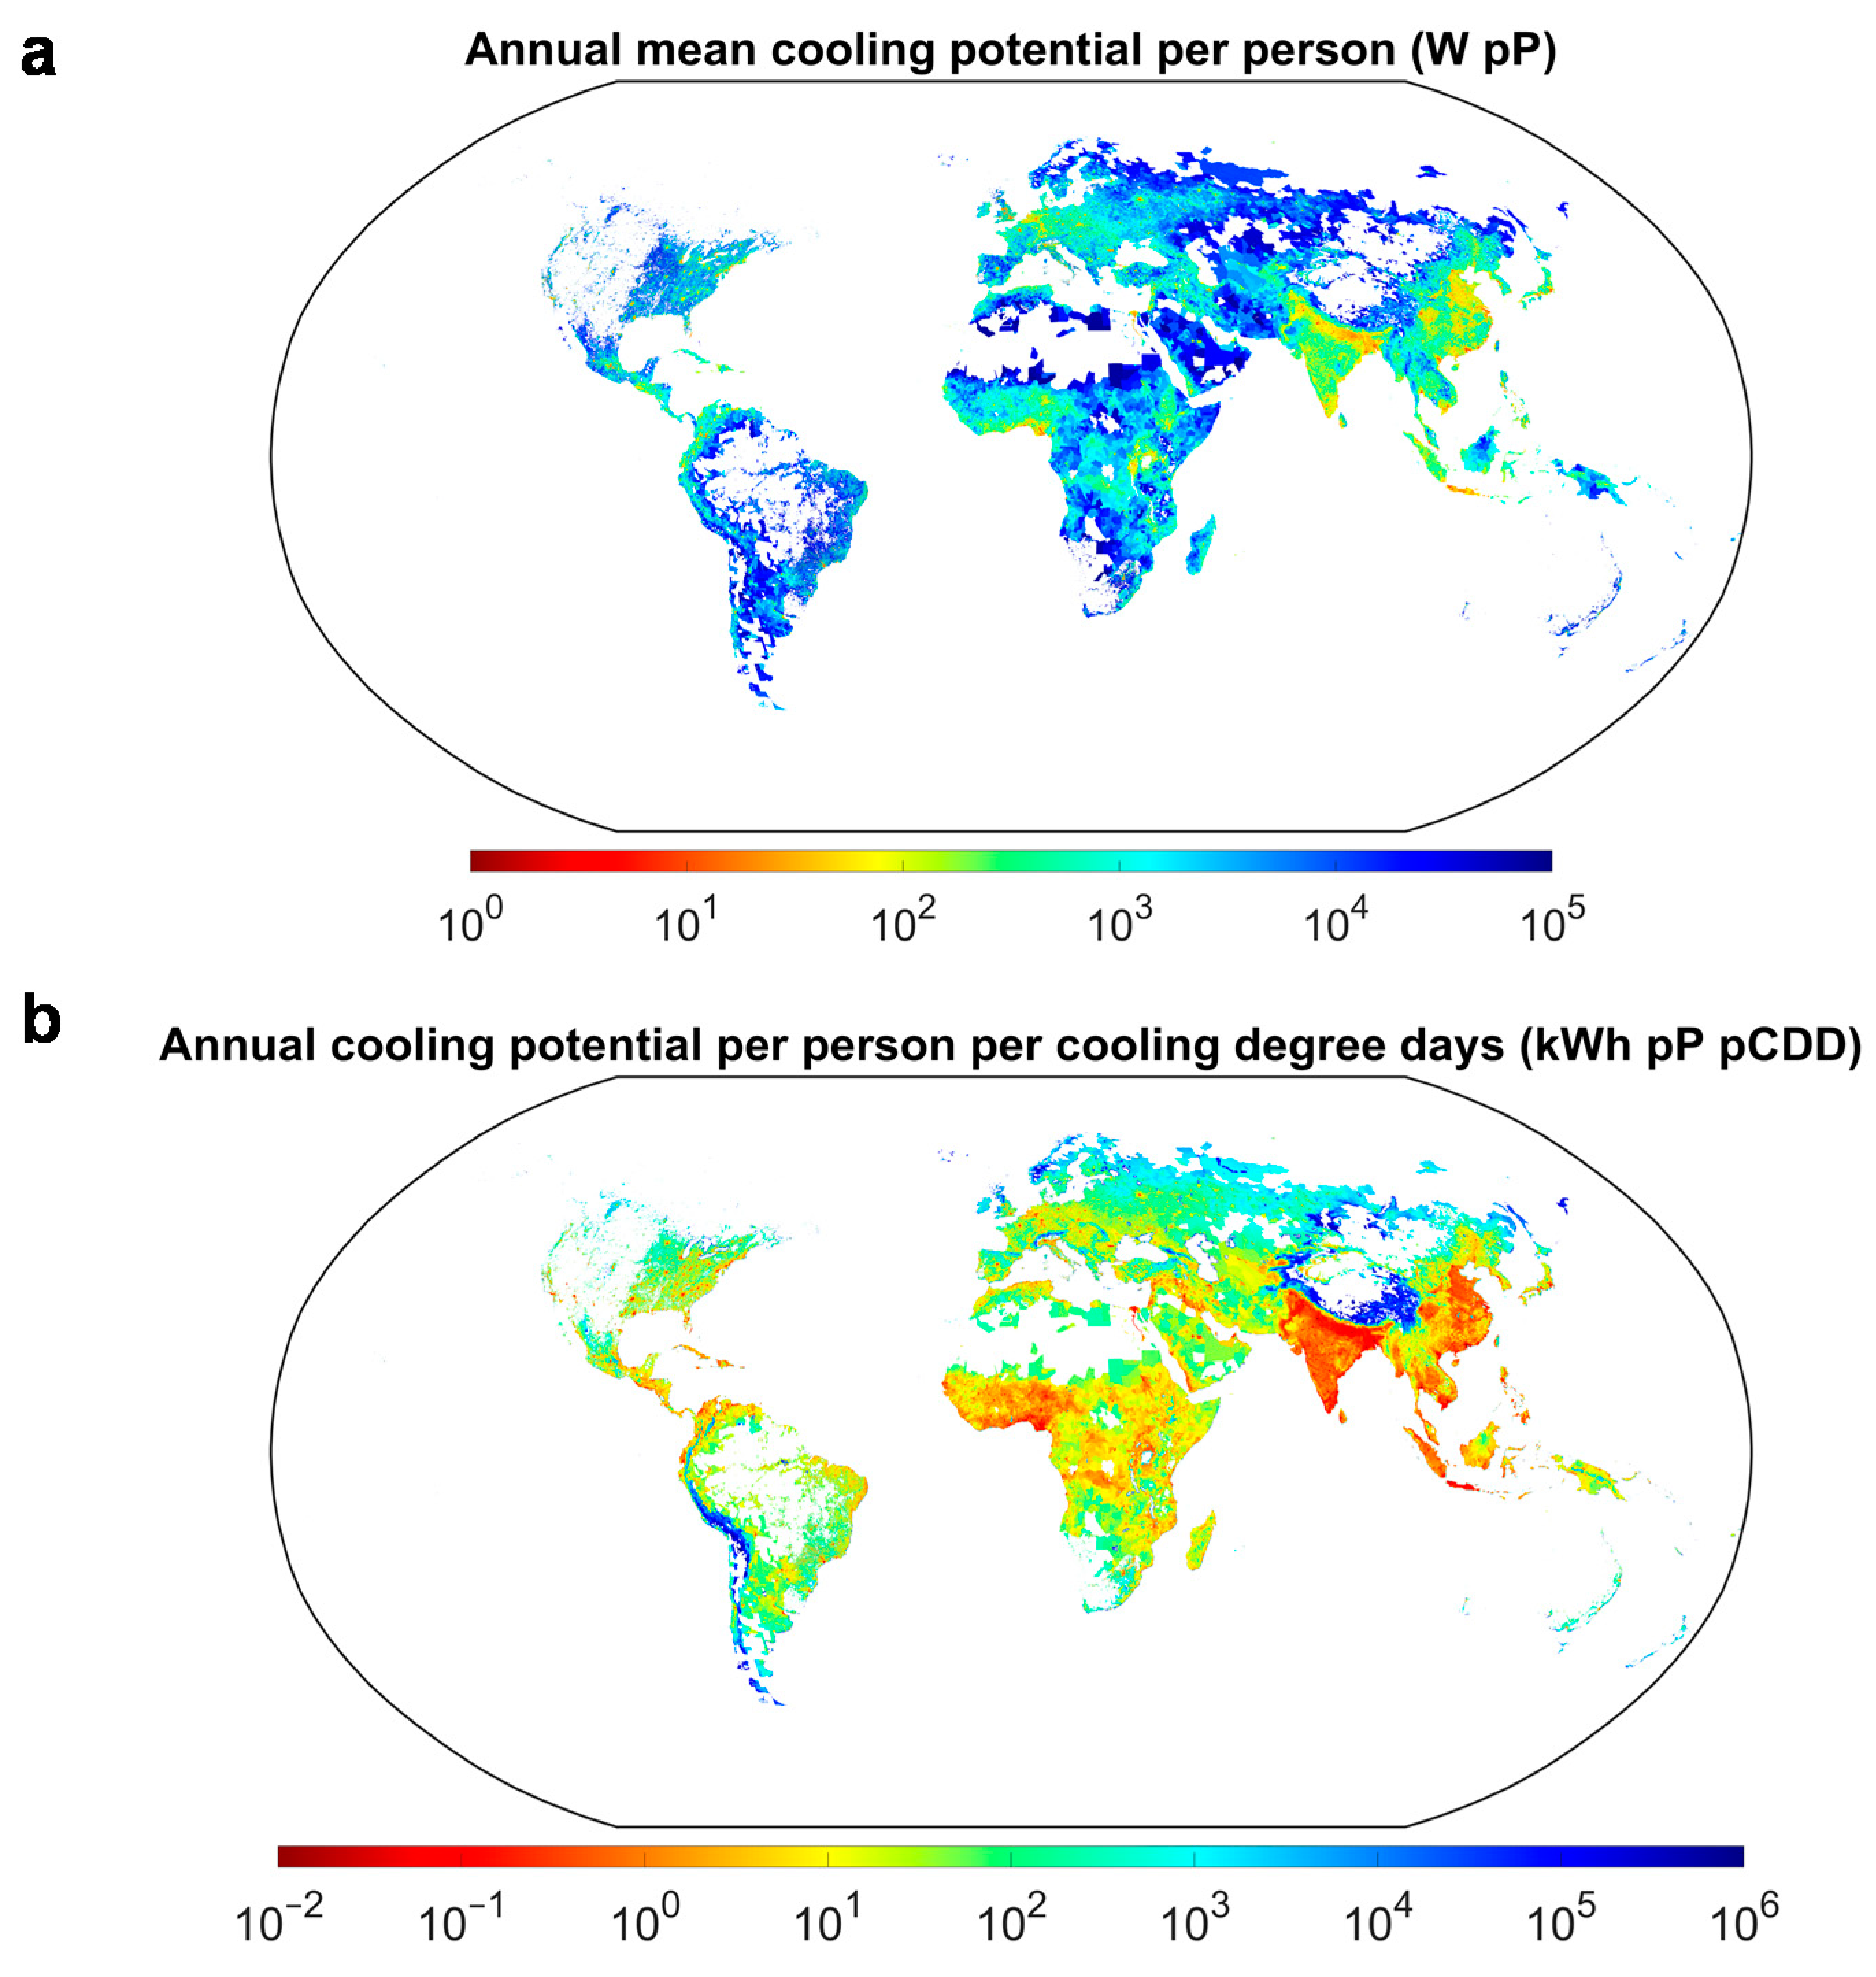
In addition to the radiative cooling potential and its anomaly, the cooling potential available per capita and a unit amount of cooling demand in a region is an even more practical factor to determine the viability of implementing radiative sky cooling for a particular region. Figure 9 shows annual mean and accumulative cooling potentials adjusted for the global population density and further for the global annual cooling demand (cooling degrees days). Since different regions may have different cooling potentials and yet require different amounts of cooling during the same month, we presented the adjusted cooling potentials based on the annual mean cooling power to ensure consistency across the globe. Assuming 0.1% of a 1 km2 unit land area is available for radiative cooling applications, cooling potential per capita (Watts per person, W pP) was obtained by dividing the total annual mean cooling power of this land area by its population density, as shown in Figure 9a. Any unpopulated unit area (less than 1 person per km2) [67] was omitted in the evaluation. As a result, most regions that are previously shown to have the highest cooling potential in Figure 6c now appear as regions with no potential because their harsh desert or semi-desert climates are not suitable for habitation, if at all. The cooling potential of regions with a high population density and a wet climate is further diminished. Still, these densely populated regions can see a cooling potential of 10~103 W pP, implying highly uneven distribution. Other hot but moderately populated regions possess even higher radiative cooling potential in the range of 103~105 W pP. We do admit that the available cooling potential can change depending on future land availability and population density. In active cold generation applications, building a large radiative cooling system for a whole district, instead of building an individual cooling system for each household, may result in higher cooling potential when the cooling system is built on the outskirts where land is more likely available at lower costs.
We further adjusted the cooling potential for both population density and cooling demand in Figure 9b. Here, the cooling demand is represented by the annual cooling degree days, which is defined as the annual sum of the positive difference between the daily mean temperature and a baseline temperature of 18 °C [75]. The annual accumulative cooling potential (in kWh) is used instead of the annual mean cooling potential in Watts. The range of available cooling potential per person and cooling degree day is much wider, 10−2~106 kWh pP pCDD, indicating extremely uneven distribution across the globe. The map further highlights the fact that densely populated and humid regions may not be suitable for radiative cooling applications solely based on the individual impacts. The cumulative impact, however, can still be immense. It is the regions with moderate population densities and temperate climates that are better suited for radiative cooling applications in terms of the adjusted benefits. These regions are generally “transitional” regions located between dry and humid climates, and sparsely and densely populated areas.

4. Discussion and Conclusions

Daytime radiative sky cooling has added excitement to the development of sustainable cooling technologies thanks to its several potential advantages. A well-designed radiative cooling surface or device can passively send more energy back to the deep space than it absorbs from the sun and the ambient. It is however of great importance to understand how much expectation it can live up to, in terms of not only its net cooling power but also its availability to the total population and cooling demand in a region. We thus mapped the global radiative cooling potential based on global historic weather datasets and evaluated it in terms of the global population density and cooling degree days.
Based on the net cooling power alone, hot and dry regions are ideal places for the adoption of radiative sky cooling technologies with their annual mean potential of 80–110 W/m2. In comparison, hot and humid regions tend to have a much lower potential of only 10–40 W/m2. Further analyses of seasonal radiative cooling potential maps show that hot and dry regions can achieve 80–110 W/m2 net cooling power during the summer months (June, July, and August), whereas hot but humid regions only see 10–30 W/m2 net cooling power because of a substantial increase in precipitable water in their atmosphere. Different regions are subject to varying degrees of cooling performance anomaly during the summer. While the cooling potential can be useful to determine the size of a radiative cooling system for a given cooling demand, the cooling potential anomaly can be useful to determine the size of cold storage for active radiative cooling systems.
Net cooling power alone does not tell the whole picture regarding the viability of radiative cooling. Human civilizations have been built centering around regions with sufficient water resources and precipitation. And many, if not most, such regions happen to be humid and hot, whereas dry regions tend to be sparsely populated. We thus mapped the global radiative cooling potential adjusted for the 2015 population density, assuming only 0.1% of a unit area (1 km2) is available for radiative cooling applications. When any unpopulated areas are omitted in the evaluation, the regions with the highest cooling power now appear as regions with no potential because their desert or semi-desert climates may not be suitable for human habitation at all. However, regions with large population densities and wet climates see further reductions in their cooling potential. These regions possess cooling potential in the order of 10~103 Watts per capita (WpP), implying a highly uneven yet valuable distribution. Hot and dry, but less populated regions have an even higher potential in the range of 103~105 WpP.
Because climate affects not only radiative cooling power and population distribution but also cooling demand, we further mapped global radiative cooling potential adjusted for both population density and annual cooling degree days. This adjusted global cooling potential demonstrates highly uneven distribution in the range of 10−2~106 kWh pP pCDD. In terms of individual benefits, this adjusted cooling potential again highlights the fact that densely populated and humid regions are not well suitable for radiative cooling applications. However, regions with moderate population densities and temperate climates are better suited for the adoption of radiative cooling technologies. These regions tend to be geographically and demographically “transitional”, being located between dry and wet climates as well as desolate and populous regions.
In addition to the individual and cooling-demand-related impacts, widespread adoption of radiative cooling technologies across the globe, even in humid regions, will have other potential benefits. If used as cool roofs on large scales in urban areas, in addition to bringing energy saving in buildings [18,76], radiative sky cooling can drastically reduce solar irradiance into the urban environment and decrease its temperature [41,77]. When radiative cooling technologies improve building energy efficiency, it can lead to other climate and health benefits such as reductions in carbon emissions and PM2.5 emissions [78,79,80]. If used in thermal power plants as primary or supplemental cooling systems, radiative sky cooling can save water and maintain plant efficiency [21,25]. A direct global-scale impact may arise from the enhancement of surface albedo with the adoption of radiative cooling technologies, even in unpopulated desert climates. Increased surface albedo has the potential to offset radiative forcing caused by carbon emissions [81,82], although the impact depends on the location. In tropical and subtropical regions, the Earth’s land surface contribution to the planetary albedo is low because of the strong attenuation of surface albedo by the atmosphere [83]. However, in dry regions, the land surface contribution to the planetary albedo seems much higher. Nevertheless, widescale adoption of radiative cooling could reduce air temperature near the surface, if not the whole atmosphere, even in humid regions.
Other unexplored considerations, such as the effects of air conditioning saturation and economic prosperity, could further complicate the prospect of widespread adoption of radiative cooling. For example, regions with more economic power could easily afford to integrate radiative cooling materials and systems into existing buildings and future developments. However, the same regions have much higher air conditioning saturation rates than less developed regions [70] and thus are possibly more resistant to the adoption of radiative cooling. Given the fact that inexpensive radiative cooling materials can now be mass-manufactured in the form of thin films, paints, and even woods [6,7,9], less developed regions with low air conditioning adoption rates may be better suited for radiative cooling applications.
The global maps of radiative cooling potential presented in this work offer both exciting and cautious outlooks. If implemented at the right locations with a moderate population density and a temperature climate, radiative cooling can potentially meet individual cooling demands. If implemented worldwide, its cumulative cooling impact can be enormous, even in humid and densely populated regions. Even though economic incentives may vary among different regions, one cannot deny the fact that the widespread implementation of radiative sky cooling could yield far-reaching benefits: reducing the reliance on electricity for cooling in buildings and thermal power plants, curtailing greenhouse gas emissions, decreasing water consumptions in wet cooling processes, containing thermal pollution of water resources, mitigating urban heat island effect, and even regulating the Earth’s energy budget.

Author Contributions

Conceptualization, A.A., X.Y. and R.Y.; Data curation, A.A.; Formal analysis, A.A.; Methodology, A.A.; Resources, X.Y.; Supervision, X.Y. and R.Y.; Visualization, A.A.; Writing—original draft, A.A.; Writing—review & editing, X.Y. and R.Y. All authors have read and agreed to the published version of the manuscript.

Funding

This research received no external funding.

Institutional Review Board Statement

Not applicable.

Informed Consent Statement

Not applicable.

Data Availability Statement

The 2 m temperature datasets and the global horizontal downward solar irradiance datasets were obtained from the European Commission’s Copernicus Climate Change Service [65]: available at cds.climate.copernicus.eu (accessed on 1 September 2021); The atmospheric precipitable water data were obtained from the Nasa Earth Observatory [66]: available at neo.sci.gsfc.nasa.gov (accessed on 1 September 2021); 2015 global population density data were obtained from the NASA Socioeconomic Data and Applications Center [67]: available at sedac.ciesin.columbia.edu (accessed on 1 September 2021); And the global monthly cooling degree days data were obtained from PANGAEA—Data Publisher for Earth & Environmental Science [68,69]: available at doi.pangaea.de (accessed on 1 September 2021). Other datasets generated in this work are available upon request.

Conflicts of Interest

The authors declare no conflict of interest.

References

  1. Kiehl, J.T.; Trenberth, K.E. Earth’s Annual Global Mean Energy Budget. Bull. Am. Meteorol. Soc. 1997, 78, 197–208. [Google Scholar] [CrossRef] [Green Version]
  2. Karttunen, H.; Kröger, P.; Oja, H.; Poutanen, M.; Donner, K.J. (Eds.) Fundamental Astronomy; Springer: Berlin/Heidelberg, Germany, 2016. [Google Scholar] [CrossRef]
  3. Zhao, D.; Aili, A.; Zhai, Y.; Xu, S.; Tan, G.; Yin, X.; Yang, R. Radiative sky cooling: Fundamental principles, materials, and applications. Appl. Phys. Rev. 2019, 6, 021306. [Google Scholar] [CrossRef]
  4. Haechler, I.; Park, H.; Schnoering, G.; Gulich, T.; Rohner, M.; Tripathy, A.; Milionis, A.; Schutzius, T.; Poulikakos, D. Exploiting radiative cooling for uninterrupted 24-hour water harvesting from the atmosphere. Sci. Adv. 2021, 7, 1–10. [Google Scholar] [CrossRef]
  5. Raman, A.; Anoma, M.A.; Zhu, L.; Rephaeli, E.; Fan, S. Passive radiative cooling below ambient air temperature under direct sunlight. Nature 2014, 515, 540–544. [Google Scholar] [CrossRef]
  6. Zhai, Y.; Ma, Y.; David, S.N.; Zhao, D.; Lou, R.; Tan, G.; Yang, R.; Yin, X. Scalable-manufactured randomized glass-polymer hybrid metamaterial for daytime radiative cooling. Science 2017, 355, 1062–1066. [Google Scholar] [CrossRef] [Green Version]
  7. Mandal, J.; Fu, Y.; Overvig, A.C.; Jia, M.; Sun, K.; Shi, N.N.; Zhou, H.; Xiao, X.; Yu, N.; Yang, Y. Hierarchically porous polymer coatings for highly efficient passive daytime radiative cooling. Science 2018, 362, 315–319. [Google Scholar] [CrossRef] [PubMed] [Green Version]
  8. Leroy, A.; Bhatia, B.; Kelsall, C.C.; Castillejo-Cuberos, A.; Di Capua H, M.; Zhao, L.; Zhang, L.; Guzman, A.M.; Wang, E.N. High-performance subambient radiative cooling enabled by optically selective and thermally insulating polyethylene aerogel. Sci. Adv. 2019, 5, eaat9480. [Google Scholar] [CrossRef] [PubMed] [Green Version]
  9. Li, T.; Zhai, Y.; He, S.; Gan, W.; Wei, Z.; Heidarinejad, M.; Dalgo, D.; Mi, R.; Zhao, X.; Song, J.; et al. A radiative cooling structural material. Science 2019, 364, 760–763. [Google Scholar] [CrossRef] [PubMed] [Green Version]
  10. Aili, A.; Wei, Z.; Chen, Y.; Zhao, D.; Yang, R.; Yin, X. Selection of polymers with functional groups for daytime radiative cooling. Mater. Today Phys. 2019, 10, 100127. [Google Scholar] [CrossRef]
  11. Zhu, L.; Raman, A.; Fan, S. Color-preserving daytime radiative cooling. Appl. Phys. Lett. 2013, 103, 223902. [Google Scholar] [CrossRef]
  12. Goldstein, E.A.; Raman, A.P.; Fan, S. Sub-ambient non-evaporative fluid cooling with the sky. Nat. Energy 2017, 2, 17143. [Google Scholar] [CrossRef]
  13. Zhao, D.; Aili, A.; Zhai, Y.; Lu, J.; Kidd, D.; Tan, G.; Yin, X.; Yang, R. Subambient Cooling of Water: Toward Real-World Applications of Daytime Radiative Cooling. Joule 2018, 3, 111–123. [Google Scholar] [CrossRef] [Green Version]
  14. Aili, A.; Zhao, D.; Lu, J.; Zhai, Y.; Yin, X.; Tan, G.; Yang, R. A kW-scale, 24-hour continuously operational, radiative sky cooling system: Experimental demonstration and predictive modeling. Energy Convers. Manag. 2019, 186, 586–596. [Google Scholar] [CrossRef]
  15. Zhao, D.; Yin, X.; Xu, J.; Tan, G.; Yang, R. Radiative sky cooling-assisted thermoelectric cooling system for building applications. Energy 2019, 190, 116322. [Google Scholar] [CrossRef]
  16. Zhao, D.; Aili, A.; Yin, X.; Tan, G.; Yang, R. Roof-integrated radiative air-cooling system to achieve cooler attic for building energy saving. Energy Build. 2019, 203, 109453. [Google Scholar] [CrossRef]
  17. Zhang, K.; Zhao, D.; Yin, X.; Yang, R.; Tan, G. Energy saving and economic analysis of a new hybrid radiative cooling system for single-family houses in the USA. Appl. Energy 2018, 224, 371–381. [Google Scholar] [CrossRef]
  18. Fang, H.; Zhao, D.; Yuan, J.; Aili, A.; Yin, X.; Yang, R.; Tan, G. Performance evaluation of a metamaterial-based new cool roof using improved Roof Thermal Transfer Value model. Appl. Energy 2019, 248, 589–599. [Google Scholar] [CrossRef]
  19. Hanif, M.; Mahlia, T.; Zare, A.; Saksahdan, T.; Metselaar, H. Potential energy savings by radiative cooling system for a building in tropical climate. Renew. Sustain. Energy Rev. 2014, 32, 642–650. [Google Scholar] [CrossRef]
  20. Lu, X.; Xu, P.; Wang, H.; Yang, T.; Hou, J. Cooling potential and applications prospects of passive radiative cooling in buildings: The current state-of-the-art. Renew. Sustain. Energy Rev. 2016, 65, 1079–1097. [Google Scholar] [CrossRef]
  21. Dyreson, A.; Miller, F. Night sky cooling for concentrating solar power plants. Appl. Energy 2016, 180, 276–286. [Google Scholar] [CrossRef]
  22. Zhang, K.; Zhao, D.; Zhai, Y.; Yin, X.; Yang, R.; Tan, G. Modelling study of the low-pump-power demand constructal T-shaped pipe network for a large scale radiative cooled-cold storage system. Appl. Therm. Eng. 2017, 127, 1564–1573. [Google Scholar] [CrossRef]
  23. Stark, A.K.; Klausner, J.F. An R&D Strategy to Decouple Energy from Water. Joule 2017, 1, 416–420. [Google Scholar] [CrossRef]
  24. Zeyghami, M.; Khalili, F. Performance improvement of dry cooled advanced concentrating solar power plants using daytime radiative cooling. Energy Convers. Manag. 2015, 106, 10–20. [Google Scholar] [CrossRef]
  25. Aili, A.; Zhao, D.; Tan, G.; Yin, X.; Yang, R. Reduction of water consumption in thermal power plants with radiative sky cooling. Appl. Energy 2021, 302, 117515. [Google Scholar] [CrossRef]
  26. Zhu, L.; Raman, A.; Wang, K.X.; Anoma, M.A.; Fan, S. Radiative cooling of solar cells. Optica 2014, 1, 32–38. [Google Scholar] [CrossRef]
  27. Zhu, L.; Raman, A.P.; Fan, S. Radiative cooling of solar absorbers using a visibly transparent photonic crystal thermal blackbody. Proc. Natl. Acad. Sci. USA 2015, 112, 12282–12287. [Google Scholar] [CrossRef] [Green Version]
  28. Li, W.; Shi, Y.; Chen, K.; Zhu, L.; Fan, S. A Comprehensive Photonic Approach for Solar Cell Cooling. ACS Photon- 2017, 4, 774–782. [Google Scholar] [CrossRef]
  29. Zhan, Z.; ElKabbash, M.; Li, Z.; Li, X.; Zhang, J.; Rutledge, J.; Singh, S.; Guo, C. Enhancing thermoelectric output power via radiative cooling with nanoporous alumina. Nano Energy 2019, 65, 104060. [Google Scholar] [CrossRef]
  30. Ishii, S.; Dao, T.D.; Nagao, T. Radiative cooling for continuous thermoelectric power generation in day and night. Appl. Phys. Lett. 2020, 117, 013901. [Google Scholar] [CrossRef]
  31. Raman, A.P.; Li, W.; Fan, S. Generating Light from Darkness. Joule 2019, 3, 2679–2686. [Google Scholar] [CrossRef]
  32. Peng, Y.; Chen, J.; Song, A.Y.; Catrysse, P.B.; Hsu, P.-C.; Cai, L.; Liu, B.; Zhu, Y.; Zhou, G.; Wu, D.S.; et al. Nanoporous polyethylene microfibres for large-scale radiative cooling fabric. Nat. Sustain. 2018, 1, 105–112. [Google Scholar] [CrossRef]
  33. Hsu, P.; Song, A.Y.; Catrysse, P.B.; Liu, C.; Peng, Y.; Xie, J.; Fan, S.; Cui, Y. Radiative human body cooling by nanoporous polyethylene textile. Science 2016, 353, 1019–1023. [Google Scholar] [CrossRef] [PubMed] [Green Version]
  34. Hsu, P.-C.; Liu, C.; Song, A.Y.; Zhang, Z.; Peng, Y.; Xie, J.; Liu, K.; Wu, C.-L.; Catrysse, P.B.; Cai, L.; et al. A dual-mode textile for human body radiative heating and cooling. Sci. Adv. 2017, 3, e1700895. [Google Scholar] [CrossRef] [Green Version]
  35. Ono, M.; Chen, K.; Li, W.; Fan, S. Self-adaptive radiative cooling based on phase change materials. Opt. Express 2018, 26, A777–A787. [Google Scholar] [CrossRef]
  36. Chen, M.; Morsy, A.M.; Povinelli, M.L. Design of VO2-coated silicon microspheres for thermally-regulating paint. Opt. Express 2019, 27, 21787–21793. [Google Scholar] [CrossRef]
  37. Long, L.; Taylor, S.; Ying, X.; Wang, L. Thermally-switchable spectrally-selective infrared metamaterial absorber/emitter by tuning magnetic polariton with a phase-change VO2 layer. Mater. Today Energy 2019, 13, 214–220. [Google Scholar] [CrossRef]
  38. Li, W.; Shi, Y.; Chen, Z.; Fan, S. Photonic thermal management of coloured objects. Nat. Commun. 2018, 9, 1–8. [Google Scholar] [CrossRef]
  39. Chen, Y.; Mandal, J.; Li, W.; Smith-Washington, A.; Tsai, C.-C.; Huang, W.; Shrestha, S.; Yu, N.; Han, R.P.S.; Cao, A.; et al. Colored and paintable bilayer coatings with high solar-infrared reflectance for efficient cooling. Sci. Adv. 2020, 6, eaaz5413. [Google Scholar] [CrossRef] [PubMed] [Green Version]
  40. Sheng, C.; An, Y.; Du, J.; Li, X. Colored Radiative Cooler under Optical Tamm Resonance. ACS Photonics 2019, 6, 2545–2552. [Google Scholar] [CrossRef]
  41. Carlosena, L.; Ruiz-Pardo, Á.; Feng, J.; Irulegi, O.; Hernández-Minguillón, R.J.; Santamouris, M. On the energy potential of daytime radiative cooling for urban heat island mitigation. Sol. Energy 2020, 208, 430–444. [Google Scholar] [CrossRef]
  42. Wang, Z.-H.; Li, Q. Thermodynamic characterisation of urban nocturnal cooling. Heliyon 2017, 3, e00290. [Google Scholar] [CrossRef]
  43. Dong, M.; Chen, N.; Zhao, X.; Fan, S.; Chen, Z. Nighttime radiative cooling in hot and humid climates. Opt. Express 2019, 27, 31587–31598. [Google Scholar] [CrossRef]
  44. Liu, C.; Wu, Y.; Wang, B.; Zhao, C.; Bao, H. Effect of atmospheric water vapor on radiative cooling performance of different surfaces. Sol. Energy 2019, 183, 218–225. [Google Scholar] [CrossRef]
  45. Li, M.; Coimbra, C.F. On the effective spectral emissivity of clear skies and the radiative cooling potential of selectively designed materials. Int. J. Heat Mass Transf. 2019, 135, 1053–1062. [Google Scholar] [CrossRef]
  46. Li, M.; Peterson, H.B.; Coimbra, C.F.M. Radiative cooling resource maps for the contiguous United States. J. Renew. Sustain. Energy 2019, 11, 036501. [Google Scholar] [CrossRef]
  47. Yin, X.; Yang, R.; Tan, G.; Fan, S. Terrestrial radiative cooling: Using the cold universe as a renewable and sustainable energy source. Science 2020, 370, 786–791. [Google Scholar] [CrossRef] [PubMed]
  48. Zhao, B.; Hu, M.; Ao, X.; Chen, N.; Pei, G. Radiative cooling: A review of fundamentals, materials, applications, and prospects. Appl. Energy 2018, 236, 489–513. [Google Scholar] [CrossRef]
  49. Sun, X.; Sun, Y.; Zhou, Z.; Alam, M.A.; Bermel, P. Radiative sky cooling: Fundamental physics, materials, structures, and applications. Nanophotonics 2017, 6, 997–1015. [Google Scholar] [CrossRef]
  50. Vall, S.; Castell, A. Radiative cooling as low-grade energy source: A literature review. Renew. Sustain. Energy Rev. 2017, 77, 803–820. [Google Scholar] [CrossRef] [Green Version]
  51. Kondratyev, K.Y. Radiation in the Atmosphere; Academic Press: Cambridge, MA, USA, 1969. [Google Scholar]
  52. Berk, A.; Hawes, F. Validation of MODTRAN®6 and its line-by-line algorithm. J. Quant. Spectrosc. Radiat. Transf. 2017, 203, 542–556. [Google Scholar] [CrossRef]
  53. MODTRAN®. Available online: http://modtran.spectral.com/modtran_order (accessed on 20 January 2021).
  54. Ruckstuhl, C.; Philipona, R.; Morland, J.; Ohmura, A. Observed relationship between surface specific humidity, integrated water vapor, and longwave downward radiation at different altitudes. J. Geophys. Res. Space Phys. 2007, 112. [Google Scholar] [CrossRef]
  55. Yang, F.; Cheng, J. A framework for estimating cloudy sky surface downward longwave radiation from the derived active and passive cloud property parameters. Remote. Sens. Environ. 2020, 248, 111972. [Google Scholar] [CrossRef]
  56. Wang, K.; Liang, S. Global atmospheric downward longwave radiation over land surface under all-sky conditions from 1973 to 2008. J. Geophys. Res. Space Phys. 2009, 114. [Google Scholar] [CrossRef]
  57. Martin, M.; Paul, B. Characteristics of infrared sky radiation in the United States. Sol. Energy 1984, 33, 321–336. [Google Scholar] [CrossRef] [Green Version]
  58. Allen, J.R.; Allen, J.R. Measurements of Cloud Emissivity in the 8–13 μ Waveband. J. Appl. Meteorol. Climatol. 1971, 10, 260–265. [Google Scholar] [CrossRef] [Green Version]
  59. World Wide Total Daily Precipitable Water Map. Available online: https://eldoradoweather.com/climate/world-maps/world-precipitable-water.html (accessed on 30 October 2020).
  60. Cloud Fraction & Water Vapor. Available online: https://neo.sci.gsfc.nasa.gov/view.php?datasetId=MODAL2_M_CLD_FR (accessed on 30 October 2020).
  61. Solomon, S.; Rosenlof, K.H.; Portmann, R.W.; Daniel, J.S.; Davis, S.M.; Sanford, T.J.; Plattner, G.-K. Contributions of Stratospheric Water Vapor to Decadal Changes in the Rate of Global Warming. Science 2010, 327, 1219–1223. [Google Scholar] [CrossRef] [Green Version]
  62. Perkins, S. Humidity holds the heat. Nat. Clim. Chang. 2010. [Google Scholar] [CrossRef]
  63. Kou, J.-L.; Jurado, Z.; Chen, Z.; Fan, S.; Minnich, A.J. Daytime Radiative Cooling Using Near-Black Infrared Emitters. ACS Photonics 2017, 4, 626–630. [Google Scholar] [CrossRef] [Green Version]
  64. Ye, C.; Li, M.; Hu, J.; Cheng, Q.; Jiang, L.; Song, Y. Highly reflective superhydrophobic white coating inspired by poplar leaf hairs toward an effective “cool roof”. Energy Environ. Sci. 2011, 4, 3364–3367. [Google Scholar] [CrossRef]
  65. ERA5-Land Monthly Averaged Data from 1981 to Present. Commission’s Copernicus Climate Change Service (2019). Available online: https://cds.climate.copernicus.eu/cdsapp#!/dataset/10.24381/cds.68d2bb30?tab=overview (accessed on 6 October 2021).
  66. Water Vapor. Available online: https://neo.sci.gsfc.nasa.gov/view.php?datasetId=MYDAL2_M_SKY_WV (accessed on 18 January 2021).
  67. UN WPP-Adjusted Population Density, v4.11: Gridded Population of the World (GPW), v4; SEDAC. Center for International Earth Science Information Network—CIESIN—Columbia University: Palisades, NY, USA, 2018. [CrossRef]
  68. Mistry, M.N. A High-Resolution (0.25 Degree) Historical Global Gridded Dataset of Monthly and Annual Cooling and Heating Degree-Days (1970–2018) Based on GLDAS Data. 2019. Available online: https://doi.pangaea.de/10.1594/PANGAEA.903123?format=html#download (accessed on 18 January 2021).
  69. Mistry, M.N. Historical global gridded degree-days: A high-spatial resolution database of CDD and HDD. Geosci. Data J. 2019, 6, 214–221. [Google Scholar] [CrossRef] [Green Version]
  70. Davis, L.W.; Gertler, P.J. Contribution of air conditioning adoption to future energy use under global warming. Proc. Natl. Acad. Sci. USA 2015, 112, 5962–5967. [Google Scholar] [CrossRef] [Green Version]
  71. Trenberth, K.E.; Fasullo, J.; Kiehl, J. Earth’s Global Energy Budget. Bull. Am. Meteorol. Soc. 2009, 90, 311–324. [Google Scholar] [CrossRef]
  72. Wang, K.; Dickinson, R.E. Global atmospheric downward longwave radiation at the surface from ground-based observations, satellite retrievals, and reanalyses. Rev. Geophys. 2013, 51, 150–185. [Google Scholar] [CrossRef]
  73. Stephens, G.L.; Wild, M.; Stackhouse, P.W.; L’Ecuyer, T.; Kato, S.; Henderson, D. The Global Character of the Flux of Downward Longwave Radiation. J. Clim. 2012, 25, 2329–2340. [Google Scholar] [CrossRef] [Green Version]
  74. Dehghan, A.; Dehghani, A. Experimental and theoretical investigation of thermal performance of underground cold-water reservoirs. Int. J. Therm. Sci. 2011, 50, 816–824. [Google Scholar] [CrossRef]
  75. Degree-Days—U.S. Energy Information Administration (EIA). Available online: https://www.eia.gov/energyexplained/units-and-calculators/degree-days.php (accessed on 2 September 2021).
  76. Mandal, J.; Yang, Y.; Yu, N.; Raman, A.P. Paints as a scalable and effective radiative cooling technology for buildings. Joule 2020, 15, 1350–1356. [Google Scholar] [CrossRef]
  77. Feng, J.; Khan, A.; Doan, Q.-V.; Gao, K.; Santamouris, M. The heat mitigation potential and climatic impact of super-cool broadband radiative coolers on a city scale. Cell Rep. Phys. Sci. 2021, 2, 100485. [Google Scholar] [CrossRef]
  78. Baniassadi, A.; Sailor, D.J.; Ban-Weiss, G.A. Potential energy and climate benefits of super-cool materials as a rooftop strategy. Urban Clim. 2019, 29, 100495. [Google Scholar] [CrossRef]
  79. Levinson, R.; Akbari, H. Potential benefits of cool roofs on commercial buildings: Conserving energy, saving money, and reducing emission of greenhouse gases and air pollutants. Energy Effic. 2009, 3, 53–109. [Google Scholar] [CrossRef] [Green Version]
  80. Gillingham, K.T.; Huang, P.; Buehler, C.; Peccia, J.; Gentner, D.R. The climate and health benefits from intensive building energy efficiency improvements. Sci. Adv. 2021, 7, eabg0947. [Google Scholar] [CrossRef]
  81. Akbari, H.; Menon, S.; Rosenfeld, A. Global cooling: Increasing world-wide urban albedos to offset CO2. Clim. Chang. 2008, 94, 275–286. [Google Scholar] [CrossRef]
  82. Suehrcke, H.; Peterson, E.L.; Selby, N. Effect of roof solar reflectance on the building heat gain in a hot climate. Energy Build. 2008, 40, 2224–2235. [Google Scholar] [CrossRef]
  83. Donohoe, A.; Battisti, D. Atmospheric and Surface Contributions to Planetary Albedo. J. Clim. 2011, 24, 4402–4418. [Google Scholar] [CrossRef]
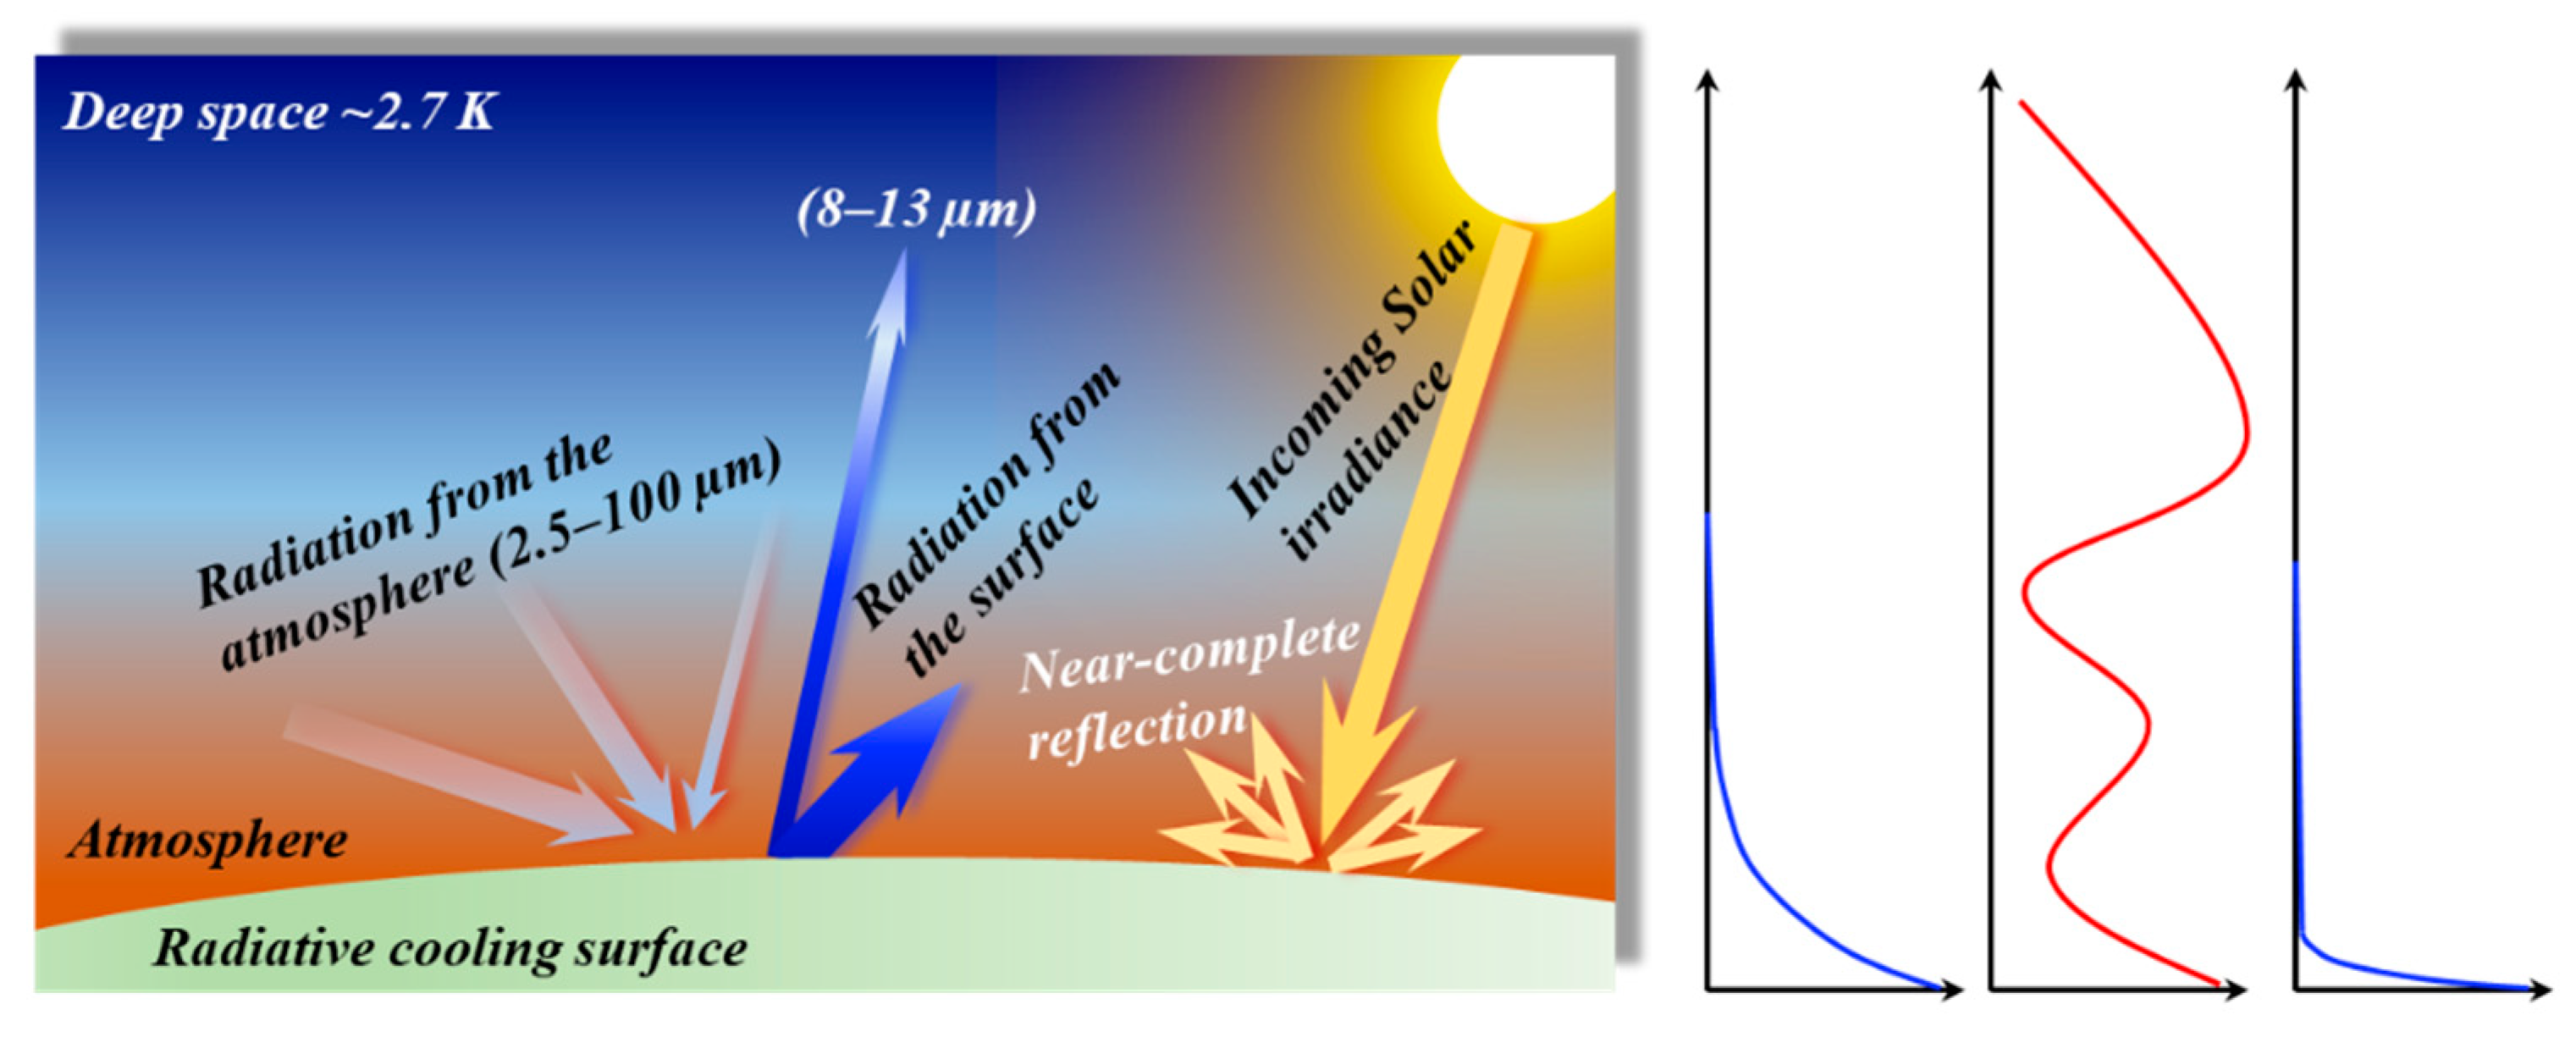
Figure 1. A schematic of radiative heat exchanges between a sky-facing radiative cooling surface and the atmosphere. On the right is the illustration of a complex set of atmospheric profiles, showing the altitude-dependence of various properties such as pressure, temperature, and water vapor. The surface absorbs longwave radiation coming from all altitudes of the atmosphere, with the lowest atmospheric layer being the dominant source. Longwave radiation emitted by the surface is mostly trapped by the atmosphere, with only a fraction reaching the deep space mainly through the atmospheric window (8–13 µm).
Atmosphere 12 01379 g001
Figure 2. Example atmospheric profiles used in the modeling of an instance of atmospheric effective emissivity. The profiles are from the default mid-latitude summer atmosphere model in MODTRAN. (a) Altitude-dependent temperature profile, where Tamb = 293 K. (b) Altitude-dependent water vapor density profile. (c) Estimated precipitable water vs relative humidity at Tamb = 10, 20, 30 °C, respectively.
Atmosphere 12 01379 g002
Figure 3. A set of effective spectral emissivity of a clear-sky mid-latitude summer atmosphere. (a) Effect of atmospheric temperature profile (represented by ambient temperature). (b) Effect of precipitable water. (c) Effect of zenith angle. The mid-latitude summer atmosphere model was used to compute the effective atmospheric spectral emissivity.
Atmosphere 12 01379 g003
Figure 4. Net cooling power an “ideal black” radiative cooler. (a) Net cooling power was obtained with the simplified approach. The contour lines show values of the net cooling power in W/m2. Here, the atmospheric downward radiation was calculated based on Tamb and the zenith-0° atmospheric emissivity in the normal direction. (b) Absolute and (c) relative errors in the net cooling power from the simplified approach. Positive and negative signs are retained to highlight underestimation and overestimation. The mid-latitude summer spectrums in Figure 3 were used to compute the cooling power.
Atmosphere 12 01379 g004
Figure 5. Global annual mean weather maps based on the monthly means of the most recent five years (2015–2019) from Refs [65,66]. (a) Ambient temperature, oC. (b) Precipitable water, mm. (c) Solar irradiance, W/m2. (d) Cloud cover fraction. Precipitable water refers to the thickness of the atmospheric water vapor when condensed into liquid water. Only data for land surfaces are presented.
Atmosphere 12 01379 g005
Figure 6. Global annual mean radiative maps from modeling. (a) The power density of upward longwave radiation from the “ideal black” radiative cooler working at the ambient temperature. (b) The power density of the downward longwave radiation from the atmosphere, including cloud cover effects. (c) The power density of net radiation including surface upward radiation, atmospheric downward radiation, and 5% solar absorption. The maps are averaged over 12 months.
Atmosphere 12 01379 g006
Figure 7. A histogram of errors in the modeled global net cooling power with and without the cloud effect. These two modeled cases are compared against the net cooling power based on the observed downward longwave radiation obtained from Ref. [65]. The counts are weighted by the cosine of the corresponding latitudes because the datasets are uniformly distributed on the geographic coordinate system.
Atmosphere 12 01379 g007
Figure 8. Global seasonal mean cooling potential maps (W/m2). (a,b): The summer mean cooling potential and its anomaly, respectively. (c,d): The winter mean cooling potential and its anomaly, respectively. The cooling potential anomaly is defined as the deviation of seasonal mean cooling potential from the annual mean. A positive anomaly means an increase in the cooling potential and a negative anomaly means a reduction.
Atmosphere 12 01379 g008
Figure 9. The adjusted annual cooling potential maps when 0.1% land area is used for radiative cooling applications. Unpopulated regions (less than 1 person per km2) are not considered. (a) Annual mean cooling potential adjusted for the global population density (Watts per person, W pP). (b) The annual total cooling potential adjusted for the global population density and annual cooling degree days (Watts per person per cooling degrees, W pP pCDD).
Atmosphere 12 01379 g009
Table 1. A lookup table of the net cooling power of an “ideal black” radiative cooler. (Unit: W/m2; Tcooler = Tamb; solar absorption excluded; atmosphere model: mid-latitude summer).
T (°C)PW (mm)2.55.07.510.012.515.017.520.022.525.027.530.032.535.037.540.042.545.047.550.052.555.057.560.0
0 1089689837874696561575349464340373432292725232220
2 11210092878277726864605652494542393634312927252322
4 11510396908580757167635955514845423936333129272524
6 11910799938883797470666258545147444138363331292725
8 122110102969186827773696561575350464341383533312927
10 126113105999489848075716763595551484542393734323028
12 1291161081029691868277736864605653494643403735323028
14 1331191111049993888479747065615753504643403835333028
16 13612211410710196918581767167625854504744413835333129
18 14012611711010499938883787369646056524945423936343129
20 144129120113107102969186817671676359555147444138363331
22 1481331241171111051009489847974706561575450474341383533
24 1531371281211141091039892878278736864605653494643403735
26 15714113212411811210610196918681767167635955524845423937
28 16114513512812111611010499948984797570666258545148454239
30 165149139132125119113108103979287827873696561575350474441
32 1701531431351291231171111061019690868176726864605653494644
34 1741571471391321261211151101049994898479757166635955524946
36 17916115114313613012411911310810297928783787469656258555148
38 183165155147140134128122117111106101969186817773686561575451
40 188170159151144138132126120115109104999489858076726864605754
Table 2. Information of input global datasets.
Data NameSourcePeriodTemporal Resolution Spatial Resolution
2-m air temperaturecds.climate.copernicus.eu2015–2019Monthly0.1°
Solar irradiancecds.climate.copernicus.eu2015–2019Monthly0.1°
Precipitable waterneo.sci.gsfc.nasa.gov2015–2019Monthly0.1°
Cloud coverneo.sci.gsfc.nasa.gov2015–2019Monthly0.1°
↓longwave radiationcds.climate.copernicus.eu2015–2019Monthly0.1°
Population densitysedac.ciesin.columbia.edu2015 2.5 min
Cooling degree daysdoi.pangaea.de1970–2018Monthly0.25°
Publisher’s Note: MDPI stays neutral with regard to jurisdictional claims in published maps and institutional affiliations.