1. Introduction
Rainfall analysis based on satellite precipitation estimation has yielded important information on tropical precipitation systems that are less observable from the ground. One of the estimation products that makes a significant contribution is the observation of the Tropical Rainfall Measuring Mission (TRMM). TRMM, launched in 1997, is the first satellite that mounts a spaceborne precipitation radar (PR) aimed at identifying raindrop-size particles [
1]. The results of the TRMM observations have resulted in a more detailed understanding of precipitation in the tropics. One example is the TRMM PR observation, which can capture data related to the three-dimensional profile of tropical cyclones and how they evolve. The three-dimensional profiling ability also has a significant contribution to the characterization of diurnal rainfall patterns over tropical regions [
2,
3,
4]. The information gathered by TRMM also provides a significant contribution to numerical weather prediction and climate models, particularly in terms of evaluating the physical parameters of clouds and precipitation [
5,
6].
In addition to precipitation radar (PR), TRMM also contains a number of comprehensive sensors, including the TRMM microwave imager (TMI) [
7]. Rain-rate estimation from TRMM PR and TMI, together with other sensors and satellites, produces a combined product called TRMM Multisatellite Precipitation Analysis (TMPA) [
8]. The two rain-rate estimation products mentioned above play an important role in producing rainfall estimates for the TMPA and other derivative products. One of the most important points to mention is that PR observations are spatially and temporally coincident with TMIs, which could produce a calibration reference between active-passive sensors [
9,
10]. The calibration reference is useful, not only for TRMM, but also for next-generation satellites.
The PR sensor on the TRMM operates at a radar frequency of 13.8 GHz, where the rainfall information (R) is derived from the radar reflectivity (Z) received by the sensor [
11]. The rainfall estimation on PR is based on the empirical relationship Z = aR
b, which shows the relationship between radar reflectivity and rain-rate by considering defined constants, a and b. This relationship is related to the drop size distribution (DSD), where in the Rayleigh limit, the radar reflectivity is the sixth moment of the DSD. The assumptions used in determining the DSD are often one of the causes of differences between the estimated results and surface observations [
12,
13]. PR can also experience significant attenuation in heavy rainfall events, and therefore attenuation needs to be corrected. Correction of attenuation in PR is carried out using a combination of two approaches. The first approach is the Hitschfeld-Bordan method, which is not reliable for heavy rainfall but produces better estimates at low rain-rates. The second approach is surface reference technique (SRT) methods, which have opposite characteristics to the Hitschfeld-Bordan method [
14]. The use of a hybrid approach covers the weaknesses of each method. However, the assumption of attenuation correction of PR is often thought to be one of the sources of differences between rainfall estimates and surface observations [
15].
Precipitation estimation in TMI is based on the relationship between the brightness temperature of several bands and precipitation. The 10, 19, 21, and 37 GHz bands capture microwave emissions from precipitating particles, while the 85 GHz band captures ice-scattering signals reflected by cloud tops [
16]. The TMI algorithm uses a Bayesian approach to determine the most likely amount of precipitation based on signatures from a set of signals captured by those bands, using the hydrometeor profile database as a reference. One of the disadvantages of TMI is the low spatial resolution of emission bands. Thus, the TMI may not be very sensitive to small-scale precipitation systems [
17,
18]. Another weakness of TMI is that the variation in emission from the land surface results in interference with the signal that is received by the emission bands [
19]. Therefore, up to the current version (version 7), the rainfall estimation algorithm on land is based on ice-scattering bands. In the ocean, emission and ice-scattering signals can be well received by sensors and can become the basis for the estimation of precipitation in the ocean [
1].
This paper focuses on the estimation products of PR and TMI in the tropical ocean region to show how the different principles of active and passive sensors can affect the estimation results. One of the important points to be noted from previous studies is that the differences in the estimation generated from these two sensors are regionally dependent [
20]. For example, PR tends to identify higher precipitation than does TMI in the northern Indian Ocean. In contrast, TMI results in a higher estimate of precipitation than PR in the eastern Pacific Ocean. Furthermore, previous research shows that the TMI tends to produce higher estimates of precipitation in organized but shallow precipitation systems [
21]. The above example indicates that precipitation-related processes that compose the climatological characteristics of each region could affect the estimation [
18].
The second important point to note in the rain-rate estimation difference of the two products is the aspect of microphysical dependence [
22,
23]. For example, a comparison of supercells over Oklahoma and shallow rain over Yemen shows that the precipitation system contains a large ice-water content that is typical during a supercell, and the TMI detects a larger rain area and estimates a higher rain-rate than PR [
10]. However, when the low ice-water content is low, particularly in a shallow precipitation system, the PR detects a larger rain area and estimates a higher rain-rate than the TMI [
21]. The TMI rain-rate estimation is also known to have a strong relationship with the ice-water content [
24]. Ice-scattering signals detected by the 85 GHz channel in the TMI peaked when the cloud height was at a maximum. The maximum rainfall is often estimated in the TMI algorithm under the above conditions [
25]. However, there are a number of events where PR detects maximum rainfall where ice particles are lower than those identified by the TMI [
13]. The above conditions could presumably occur when intense collision and coalescence processes occur [
6,
26].
The third important point is that the PR and TMI rain estimation difference is related to the spatial homogeneity of the precipitation. PR has a higher spatial resolution (approximately 4 km preboost and up to 5 km postboost) than TMI [
27]. The TMI has varied resolution depending on its bands. The highest resolution is from the 85 GHz band (5 km × 7 km in preboost/6 km × 8 km in postboost), while the lowest is from the 10 GHz band (approximately 60 km in width during preboost and up to 70 km during postboost). As mentioned earlier, one of the weaknesses of TMI is in detecting small-scale precipitation systems [
21]. For example, TMI shows the contribution of shallow organized precipitation but shows a lower contribution than the PR for deep precipitation systems [
21]. When the two products are compared statistically at the grid scale level, the PR shows higher rain-rate variation than the TMI [
13]. This means that the TMI is less sensitive to high precipitation variability at the grid scale.
The above discussion highlights how the PR and TMI estimations could be biased, because each region has different precipitation characteristics. The main objective of this research is to find whether spatial homogeneity information could be useful in explaining the precipitation estimation difference between the two products. In this research, we use the ice-scattering signatures obtained by the TMI 85 GHz channel as a proxy for the scale of homogeneity. The TMI 85 GHz channels are used as a proxy for ice particles near the upper part of clouds that can vary on different scales of precipitation. The following section explains the detailed TRMM products and the processing methods used in this research. The results section is intended to explain how understanding the homogeneity and properties of the ice-scattering signature could be related to the rain-rate estimation difference between the PR and TMI. The discussion section explains this in a more general way and the manner in which the above information could be useful in future algorithm development is summarized in the last section.
2. Materials and Methods
The focus of this section is to explain the type of TRMM data used to characterize the PR and TMI rain-rate estimation differences, particularly using ice-scattering characteristics at the grid level. The TRMM version 7 data after postboost were used for the analysis, starting from 1 January 2002 to 31 December 2006 (orbit number 23,559 to 52,014). We intended to evaluate precipitation estimation differences over the ocean, where all TMI channels were used as the basis of the estimation inside the TMI algorithm over the ocean. The focus is the tropical ocean, between 15° north and 15° south over the global tropics. The main product to be compared is the level 2 products, particularly near surface rain-rate estimation from PR2A25 and surface rain-rate estimation from TMI 2A12. The TMI 85 GHz ice-scattering signals were obtained from TMI 1B11. In addition to the above products, convective/stratiform information was obtained from PR2A23. We limit the data to grids where the average rain-rates are higher than 1 mm/h from PR2A25 and TMI2A12. This threshold was selected because it is higher than the minimum detection from PR and TMI [
1]. Therefore, we avoid false signals of rain/no-rain conditions that are often found at lower rain-rates [
28].
The comparison of the data is conducted at the grid level to populate a set of data inside the grid where PR and TMI observe the same location at almost the same time. We use a 0.25° × 0.25° grid where the precipitation estimation and other related data at the original resolution were stored. The 0.25° × 0.25° spatial resolution is selected because it contains a considerable amount of original pixel data from PR and TMI. The above spatial resolution is also the same as the TMPA product, so the adjustment presented in this paper can be useful for operational purposes. In this research, the average rain-rates from PR and TMI inside the 0.25° grid are calculated, and the difference is represented in terms of the gridded rain-rate from PR minus the gridded rain-rate from TMI. The convective/stratiform classification of each grid is determined by the most dominant type, as populated from PR2A23. The TMI ice-scattering channel (85 GHz) brightness temperature data from 1B11 are also populated at the same grid. The vertical and horizontal polarizations (
and
, respectively) from the TMI 85 GHz channel are utilized to calculate the polarization-corrected brightness temperature (PCT) [
29], where:
In short, each grid contains the average rain-rate for PR and TMI, statistical information about TMI 85 GHz PCT, and convective/stratiform precipitation.
The gridded TMI 85 GHz PCT data are the focus in explaining the difference between rain-rate estimations of the two products.
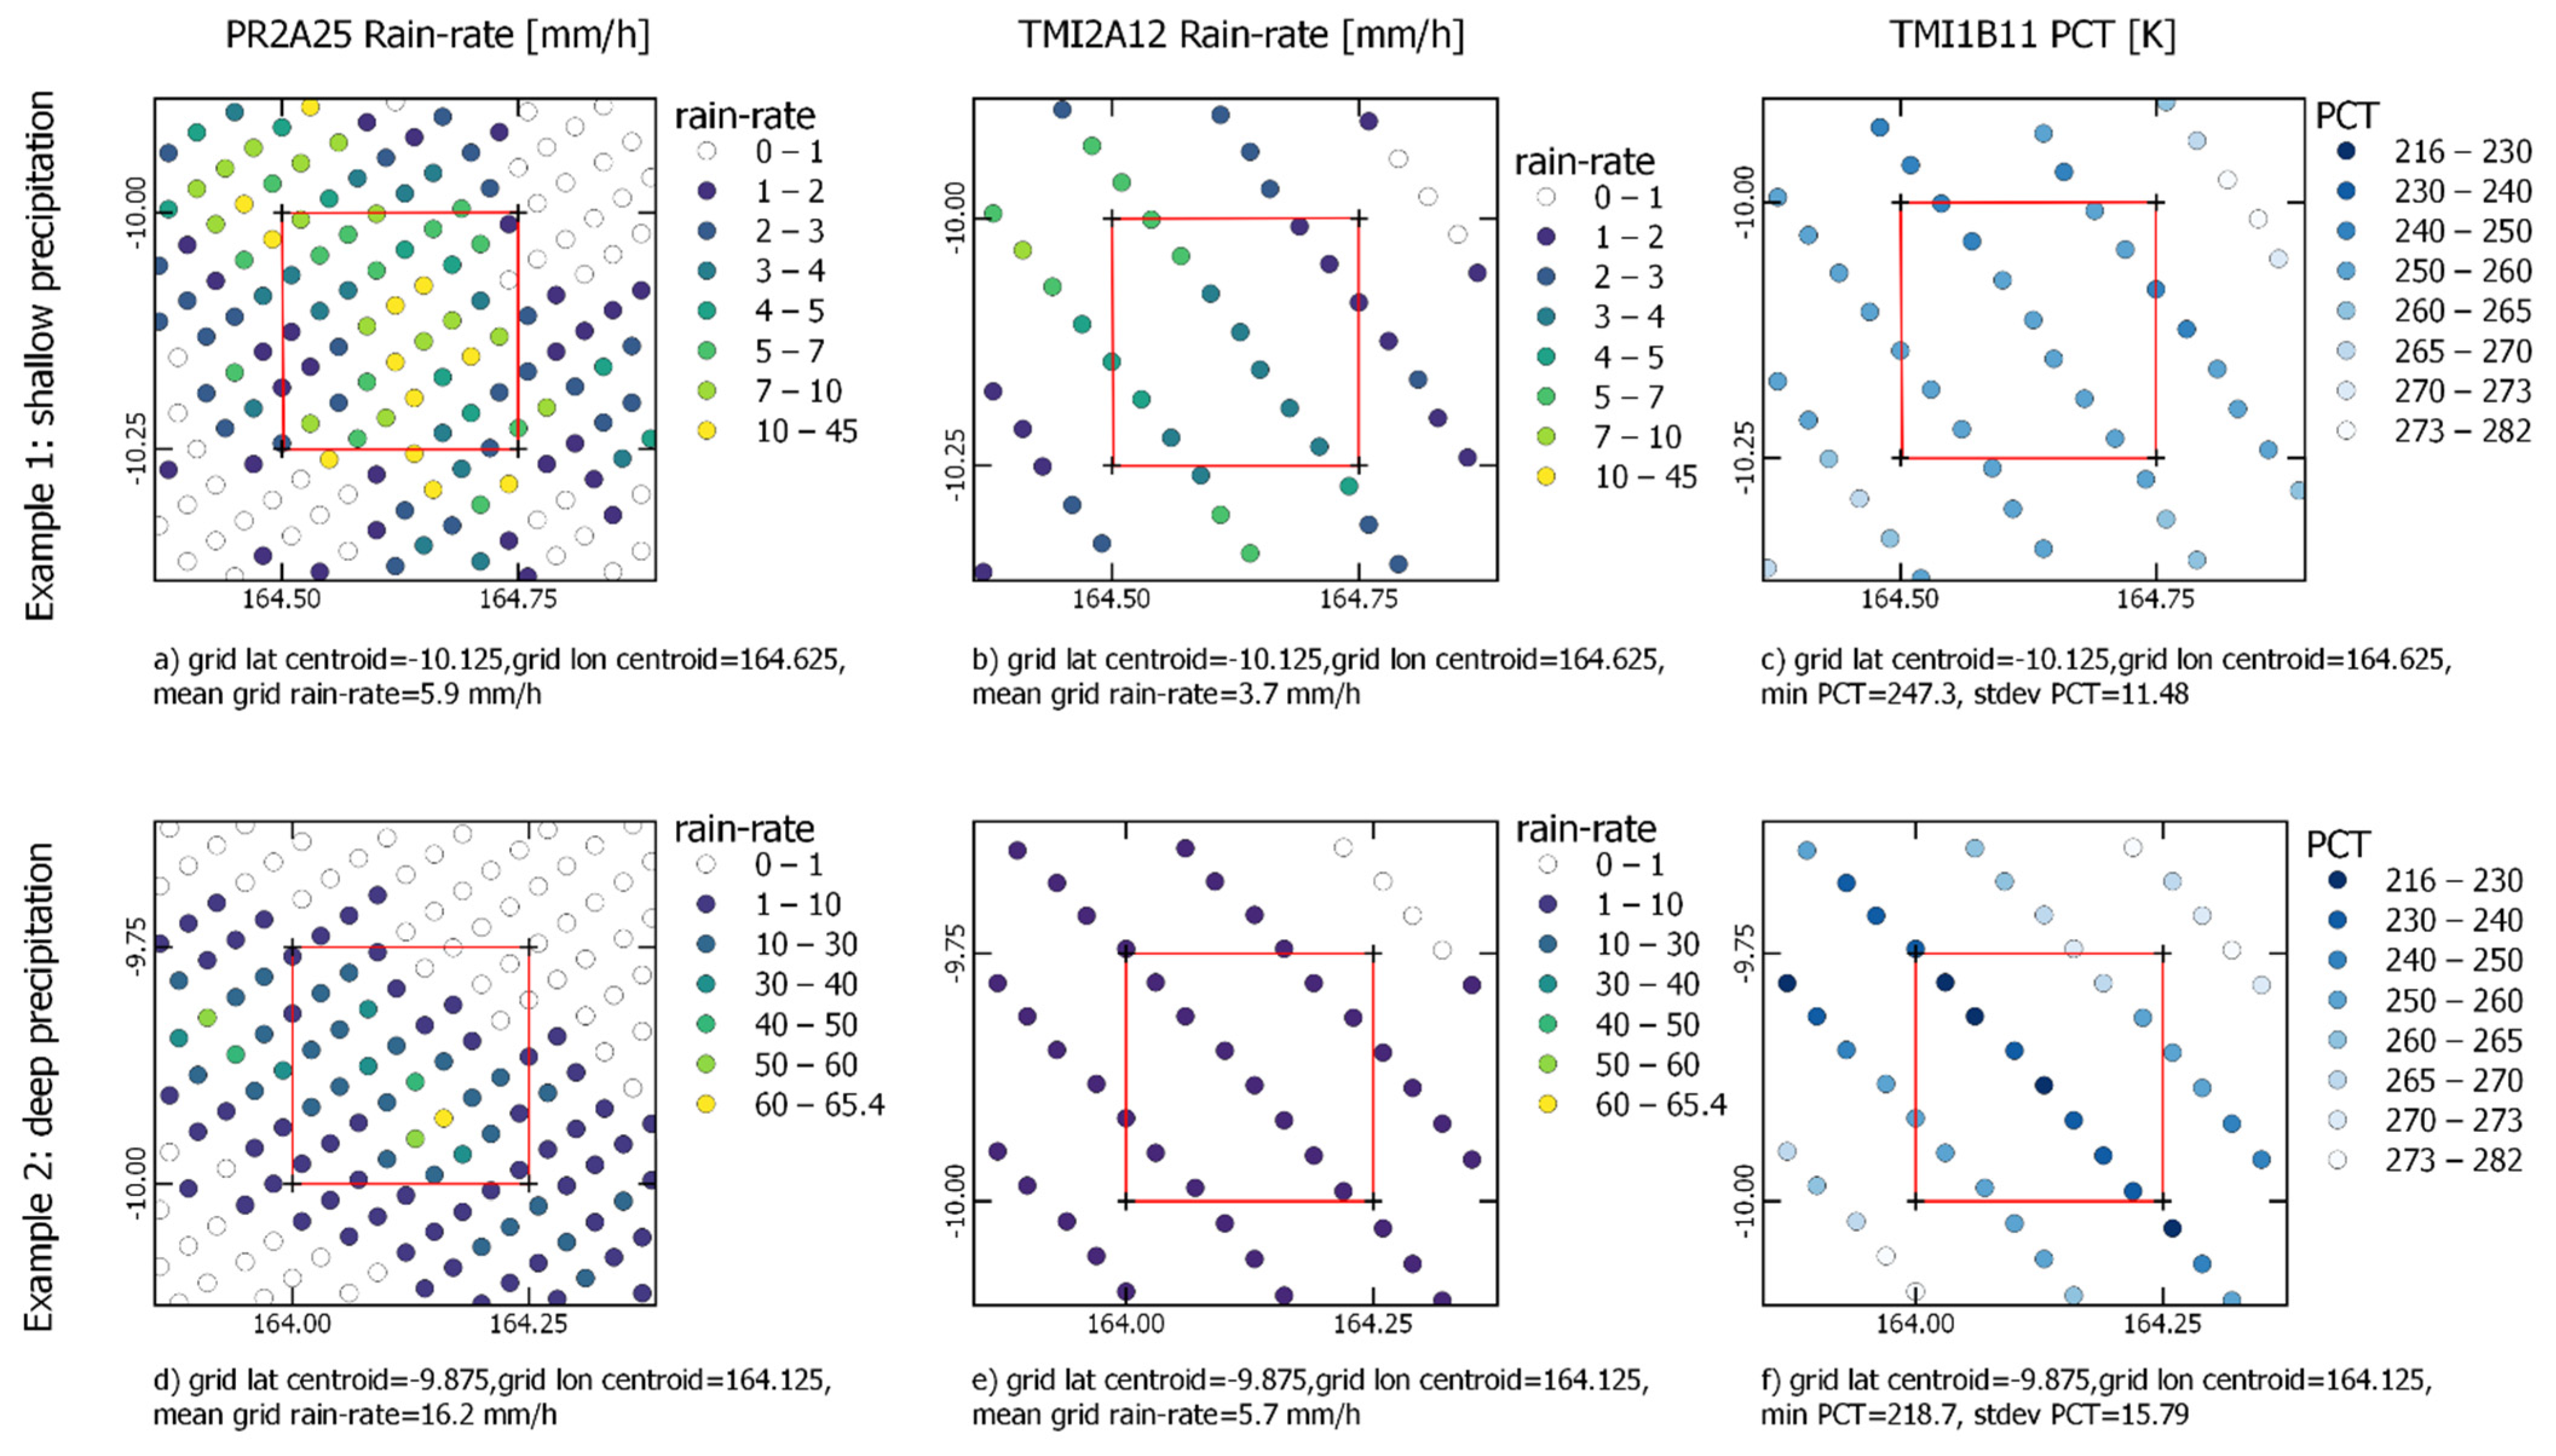
Figure 1 shows a comparison between the two precipitation systems inside the 0.25° grid (red color bounding box). The images in the top indicate a shallow precipitation system where the TMI 85 GHz PCT is warmer than the bottom images (later classified as a deep precipitation system). The first image in the top left shows the PR rain-rate estimation value in its original footprint, while the second in the middle is for TMI rain-rate estimation. Note that the average rain-rates inside the grid are 5.9 mm/h and 3.7 mm/h for PR and TMI, respectively. The difference between the gridded rain-rate from the two products is not as high as that in the bottom images. The first image in the bottom left shows the PR rain-rate estimation value, where the grid average is 16.2 mm/h. The TMI gridded rain-rate estimation value is only 5.7 mm/h. The interesting point is TMI 85 GHz data in the right part of the figure. The standard deviation for TMI 85 GHz PCT inside the grid is lower for the top images than for the bottom images. The TMI 85 GHz standard deviation may reflect the variation in precipitation in each 0.25° grid. For example, a low standard deviation might be associated with a homogeneous precipitation system, while high variation in a grid is likely to be associated with a specialization system that is less homogeneous.
In addition to the standard deviation, the difference in shallow/deep precipitation systems could be an important source to address. Therefore, we calculate the minimum TMI 85 GHz PCT (denoted as
) inside each grid. A brightness temperature threshold of 240 K is used to classify shallow or deep precipitation systems [
30]. When the minimum TMI 85 GHz PCT inside a grid is less than 240 K, it is classified as a deep precipitation system, and vice versa for a shallow precipitation system. To further analyze the homogeneity inside the 0.25° grid, we use the fraction of TMI 85 GHz PCT pixels that are lower than 240 K for deep precipitation grids. For shallow precipitation grids (characterized by warmer PCT than the deep precipitation system), we use the fraction of TMI 85 GHz PCT pixels containing brightness temperatures of less than 273 K.
Information about homogeneity is not considered by the original TMI ocean algorithm, since the estimations are estimated based on each pixel. However, it could be considered in a larger scope/area (using 0.25° × 0.25° spatial resolution in this research). The question is to what degree can it influence the rain-rate estimation bias between PR and TMI. As suggested in the above paragraph, the grid-scale homogeneity is characterized by standard deviations of ice-scattering signals inside the 0.25° grid () and fractions of ice-scattering signals () lower than the threshold (240 K and 273 K for deep and shallow precipitation, respectively). To measure the degree to which both parameters can influence the rain-rate estimation, an adjustment was conducted to derive the most likely gridded rain-rate estimated by PR () using a set of data derived from TMI as the correction factor (). consists of four parameters, namely, the estimated gridded rain-rate from TMI (), minimum gridded TMI 85 GHz PCT (), , and .
It should be noted that there was no ground validation in this research, so the gridded PR data were considered the true value only to compare the degree to which they could match the TMI. A rain information database was developed using the five years of observation previously mentioned. First, the database is separated for shallow (minimum gridded TMI85GHZ PCT > 240 K) and deep precipitation systems (minimum gridded TMI85GHZ PCT < 240 K). Each rain event in the grid level and its corresponding correction factor were then listed in the database. Therefore each set of data contains
and its corresponding
. Convective/stratiform fractions were also calculated for each set of data to further explain the result. The PR and TMI rain-rates contained in the database were then binned for each 0.5 mm. The
,
, and
were also binned for each 2 K, 1.0 mm, and 0.1 respectively. For each unique set of the binned correction factor (
), the probability
of PR gridded rain-rate was evaluated (
Figure 2). The adjusted rain-rate (
) was calculated based on the sum of each possible rain-rate in the database that weighted (multiplied) by its corresponding probability, where:
The above adjustment was calculated based on a five-year period (2002 to 2006) and needs to be validated using observation data outside that range. In this paper, the validation period is taken by contrasting El Niño and La Niña events, because the two periods are known to have different characteristics in terms of precipitation organization [
31]. It is also important to identify whether the algorithm performed well only in a specific time period (during El Niño/La Niña). The El Niño validation period was conducted from 1 December 2007, to 28 February 2008, while the La Niña validation period was from 1 December 2009, to 28 February 2010. For any rain event in both periods, the
was obtained and matched with the database. The adjusted rain rate was calculated based on a set of rain-rate probabilities that correspond to any given
as shown in Equation (2). The adjusted rain-rate was then compared with the original TMI rain-rate (before adjustment) and PR rain-rate at the same grid. The differences were explained using joint histogram, correlation (r), and Root Mean Square Error (RMSE).
4. Discussion
This section discusses the PR-TMI fundamental difference in rain-rate estimation based on information obtained from the TMI 85 GHz ice-scattering signals, as shown in the previous section. Before the results are discussed, it is important to review the concept behind the ice-scattering signals received by the TMI 85 GHZ channel. Strong ice-scattering signals indicate that there are large amounts of ice particles at the top part of precipitating clouds [
32]. This usually happens when strong convective clouds exist at a considerable height above the freezing level [
26]. Strong convective clouds are also often associated with heavy rainfall near the surface. Therefore, stronger ice scattering can be interpreted to have a larger amount of ice particles, higher cloud tops, and heavier precipitation.
When there are clouds that contain a specific amount of ice particles with no significant difference from its surroundings over a large area (e.g., at the grid scale, as shown in this research), the precipitation will appear to be homogeneous. In contrast, when there are large differences in the amount of ice particles, there might be a large variation in terms of cloud heights and precipitation. For example, in this study, one of the parameters to measure is whether the fraction of TMI 85 GHz PCT is lower than 240 K ). The larger number of PCT pixels that are lower than the above threshold, which also have no significant deviation, indicates deep convective clouds that contain a significant amount of rain over a large area. In contrast, a smaller number of PCT pixels lower than the threshold, which is also associated with high deviation, might be interpreted as deep convective clouds surrounded by much lower stratiform clouds.
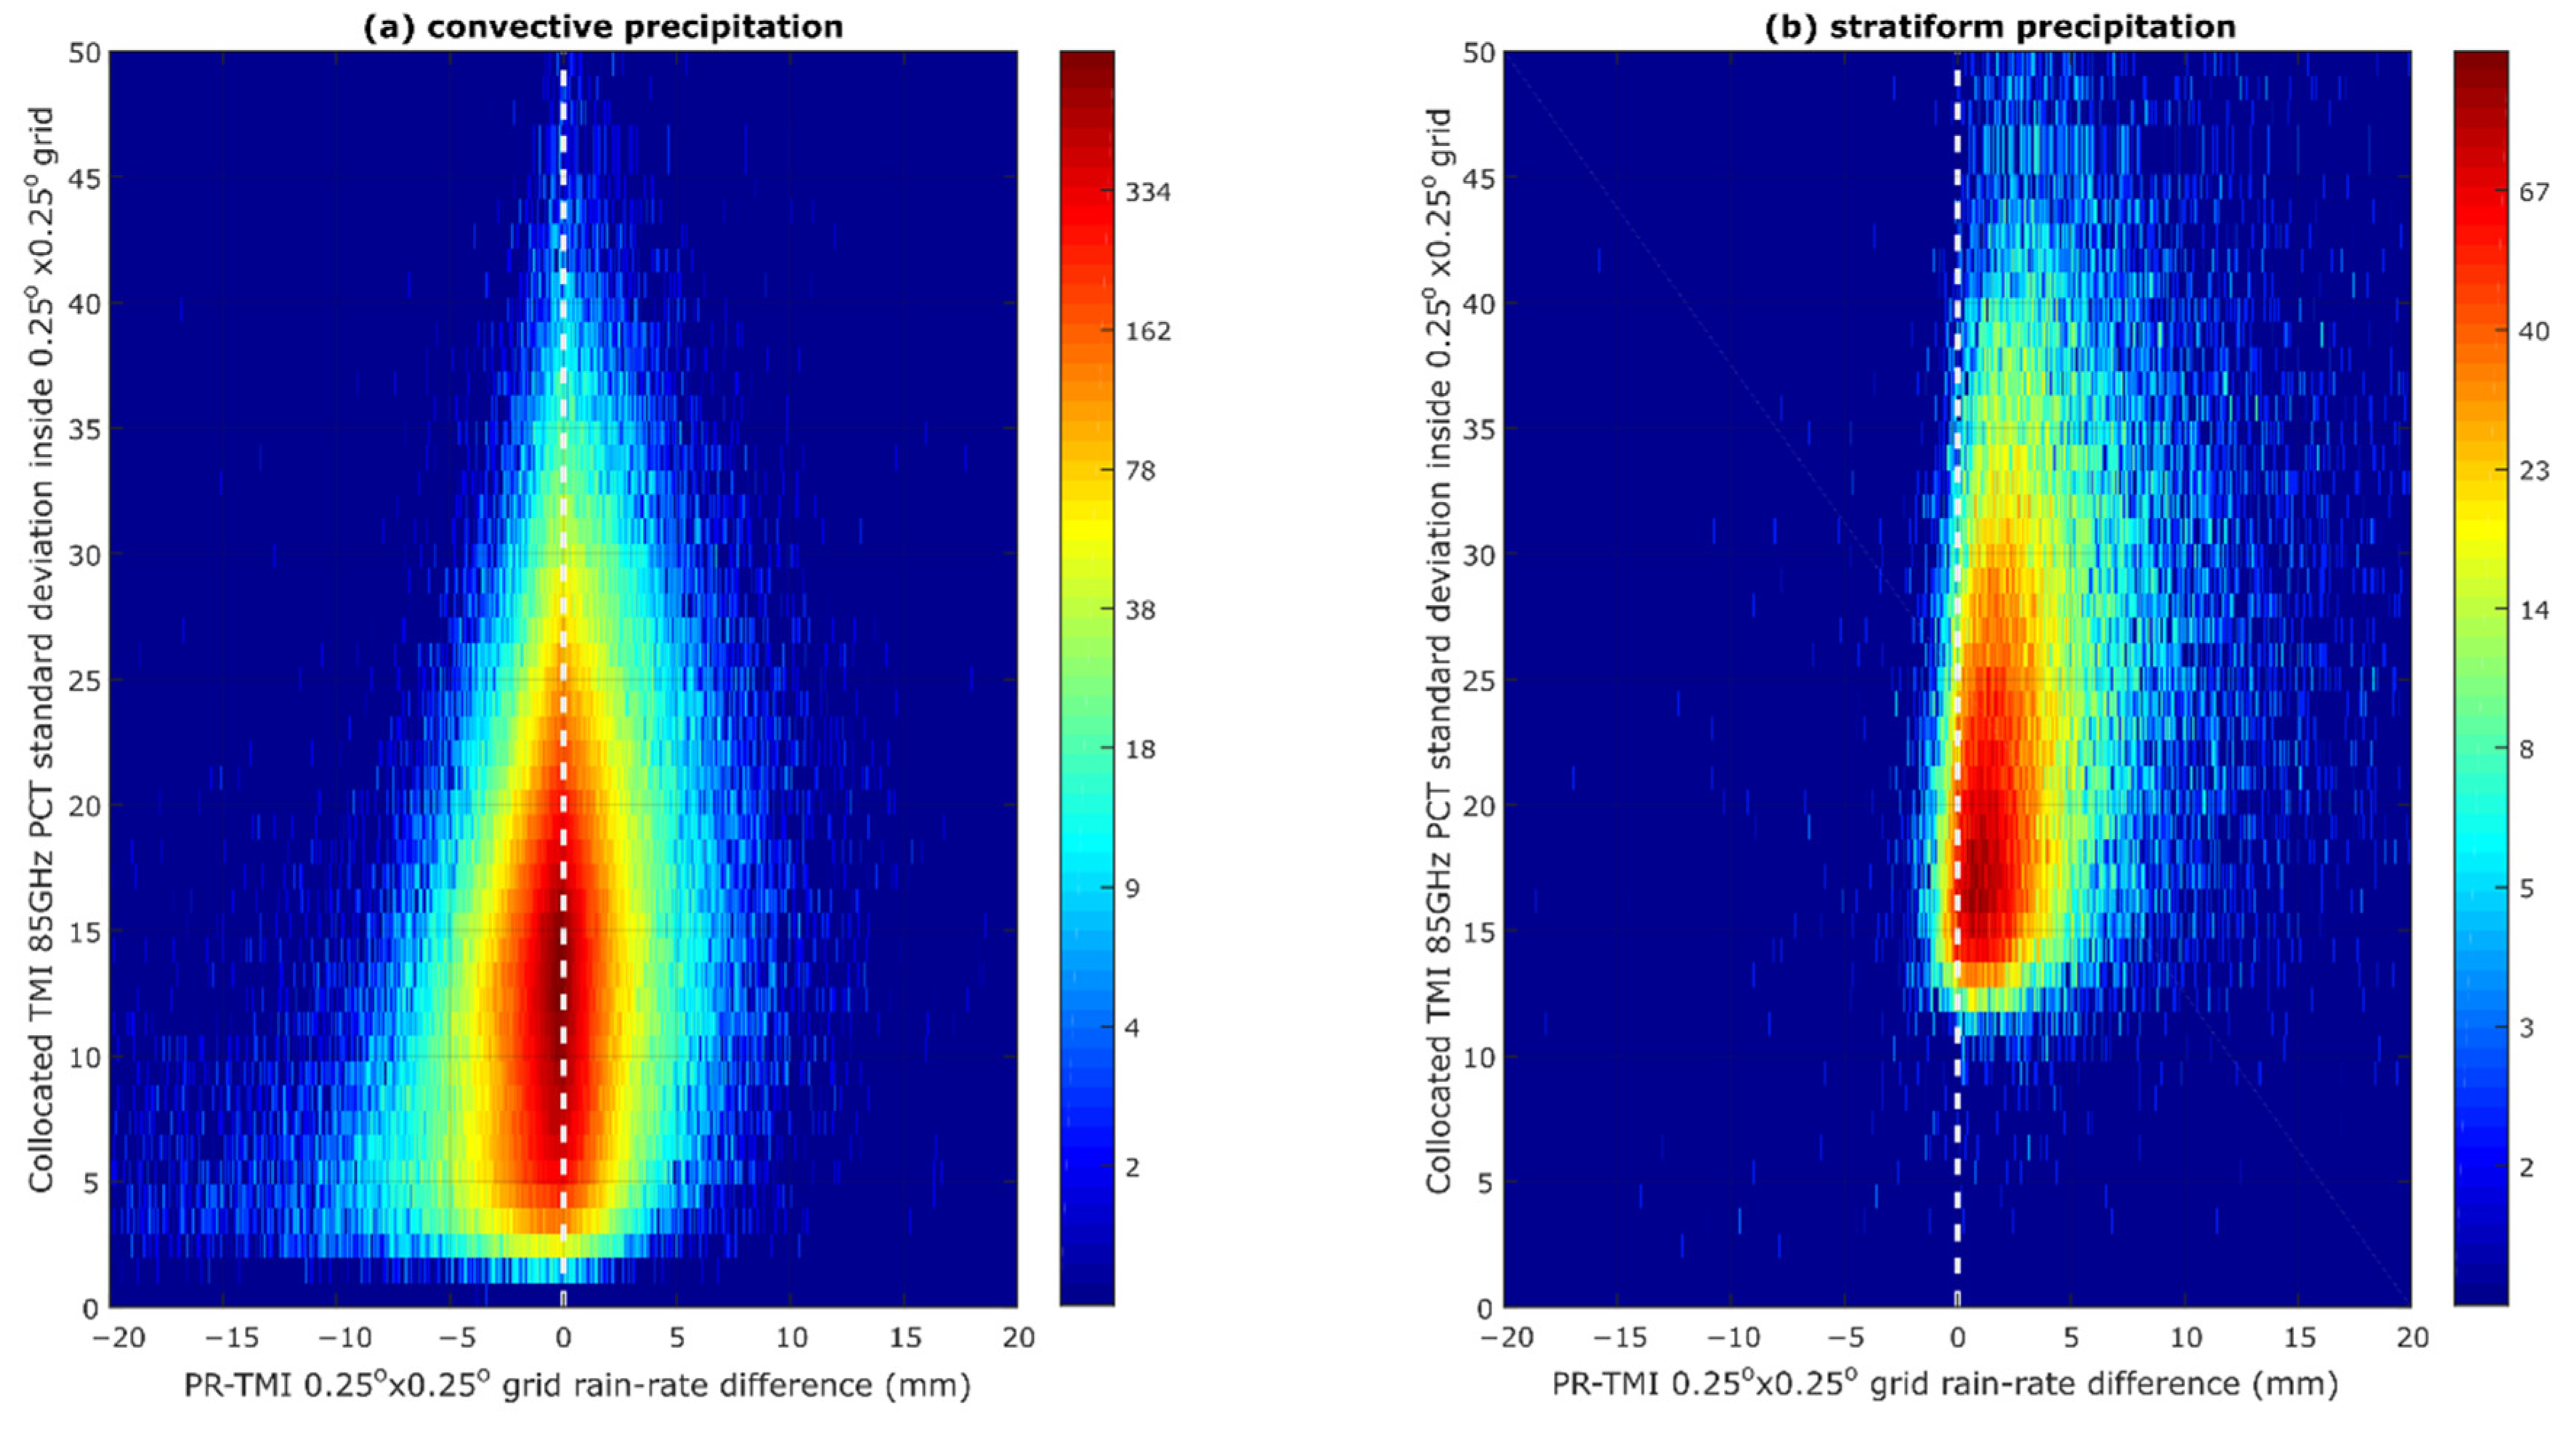
The TMI is known to underestimate the rain-rate from isolated precipitation systems, which is possibly related to the large TMI footprint for emission channels [
21]. In accordance with previous research, the TMI tends to estimate a lower rain-rate than PR for less organized systems, as shown in
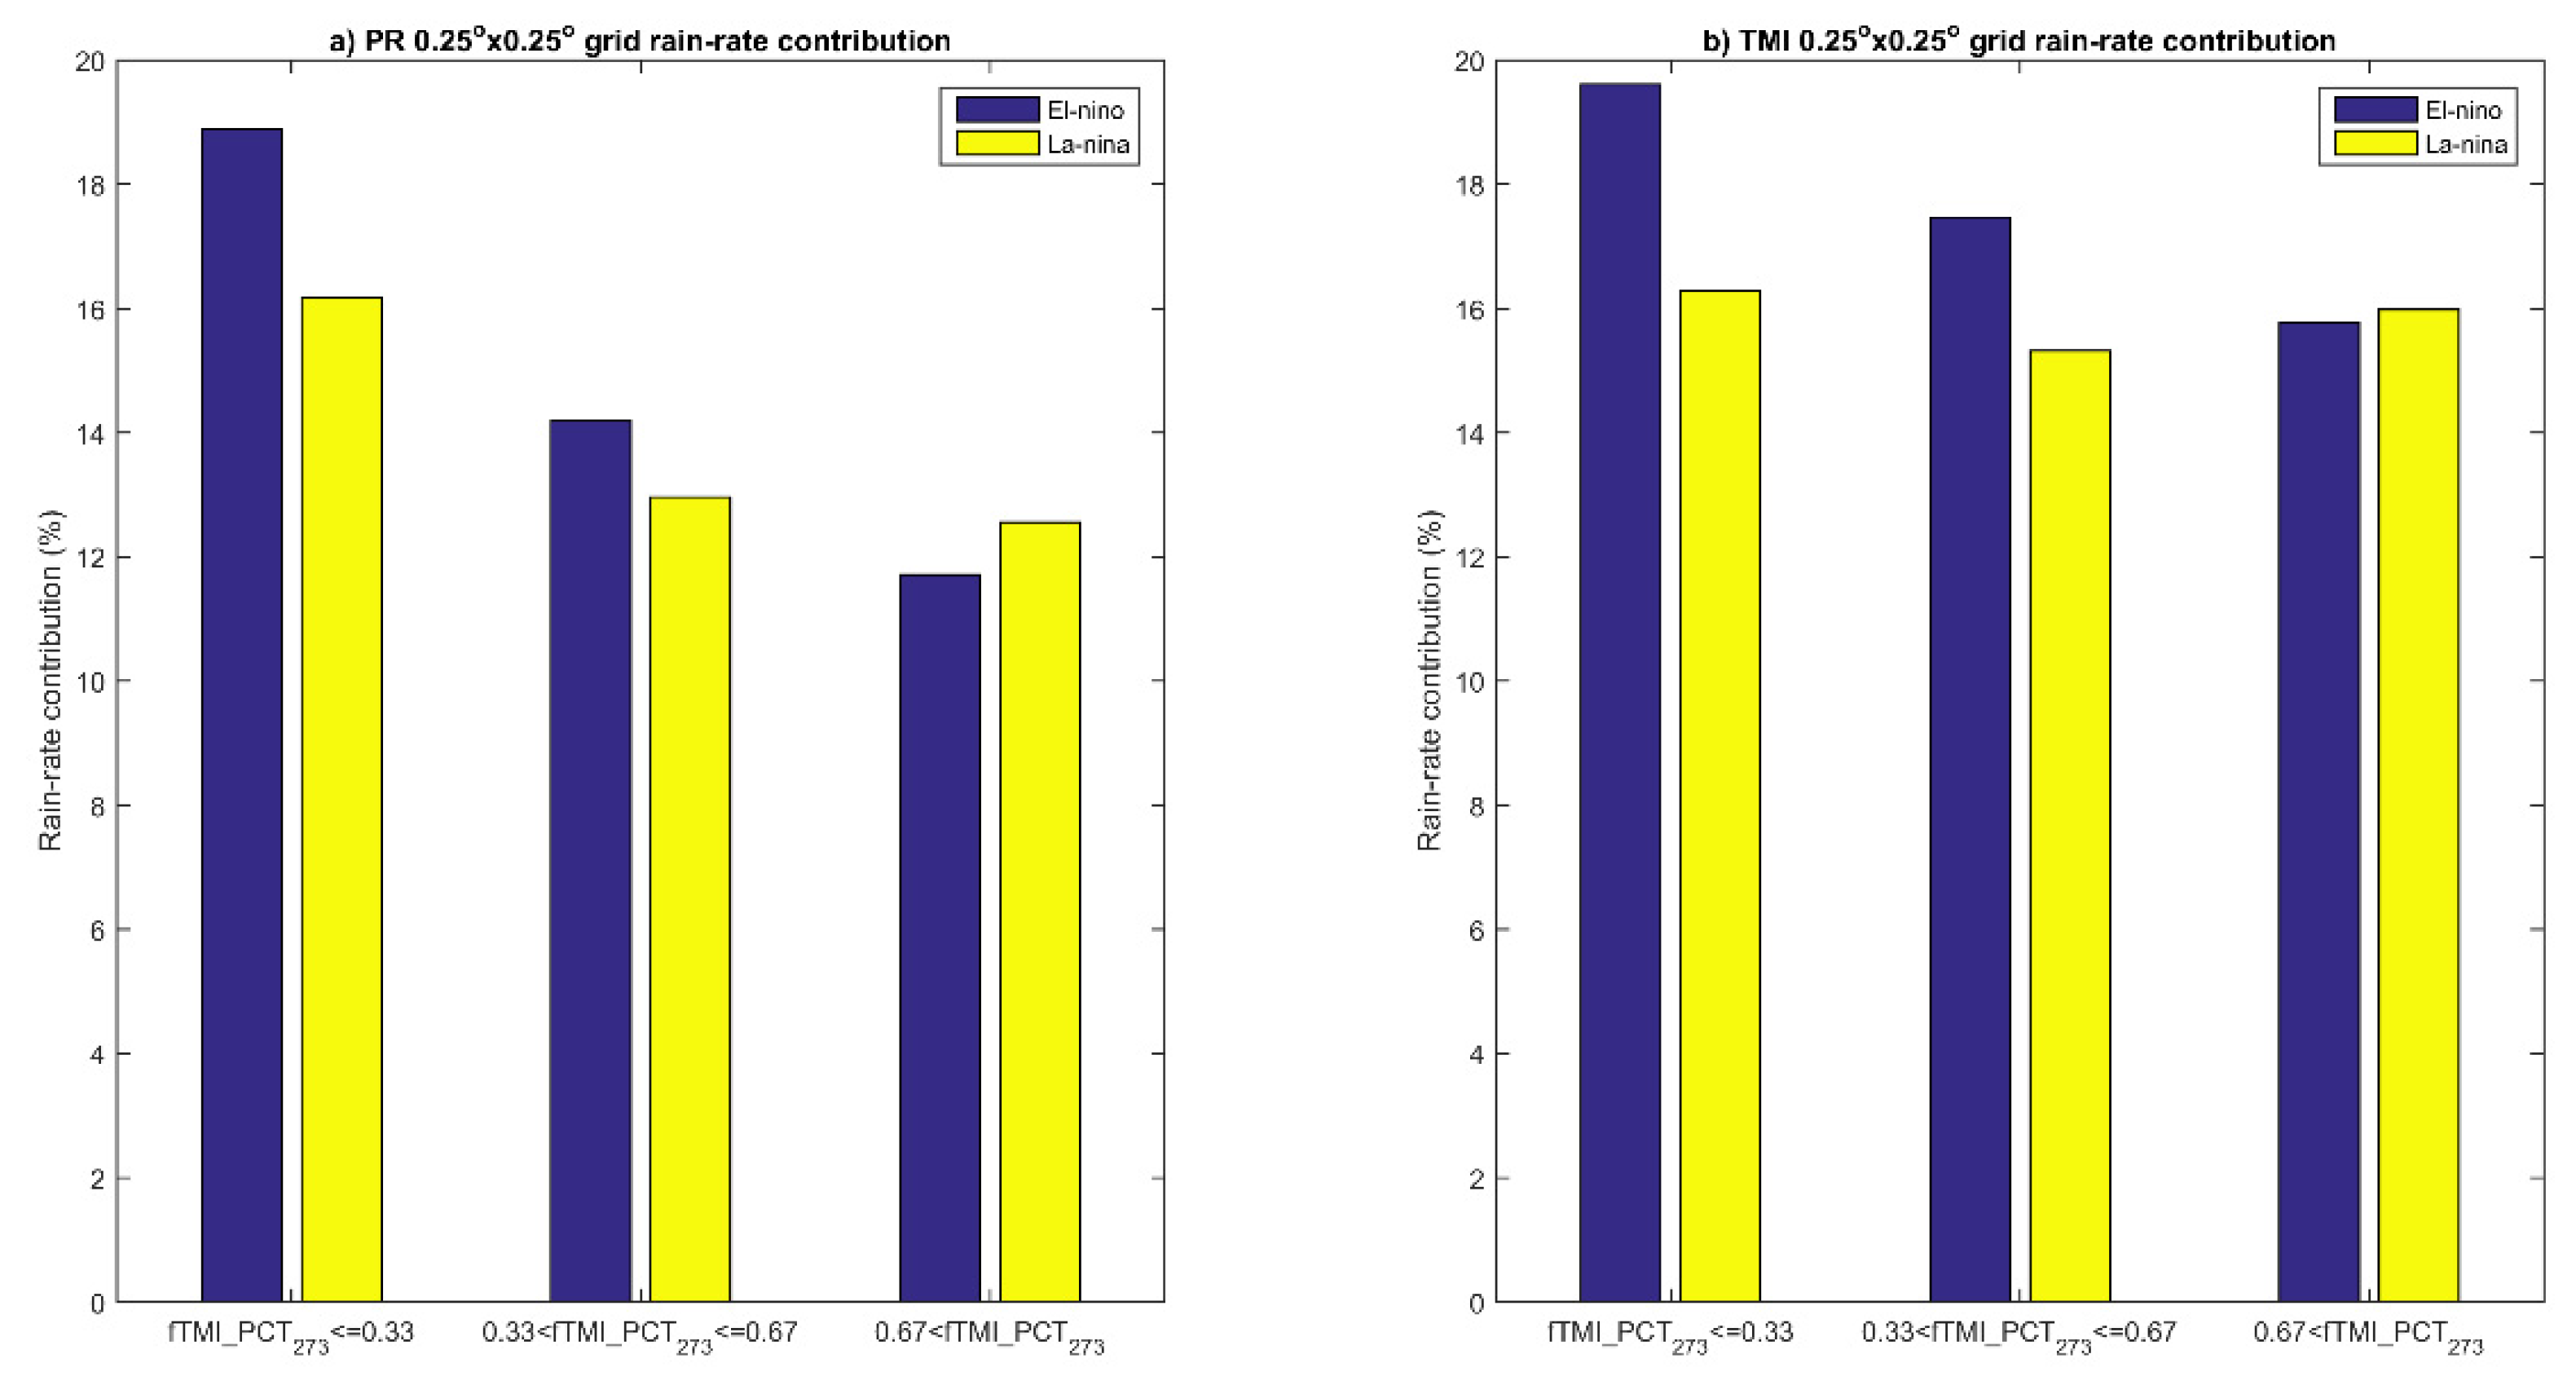
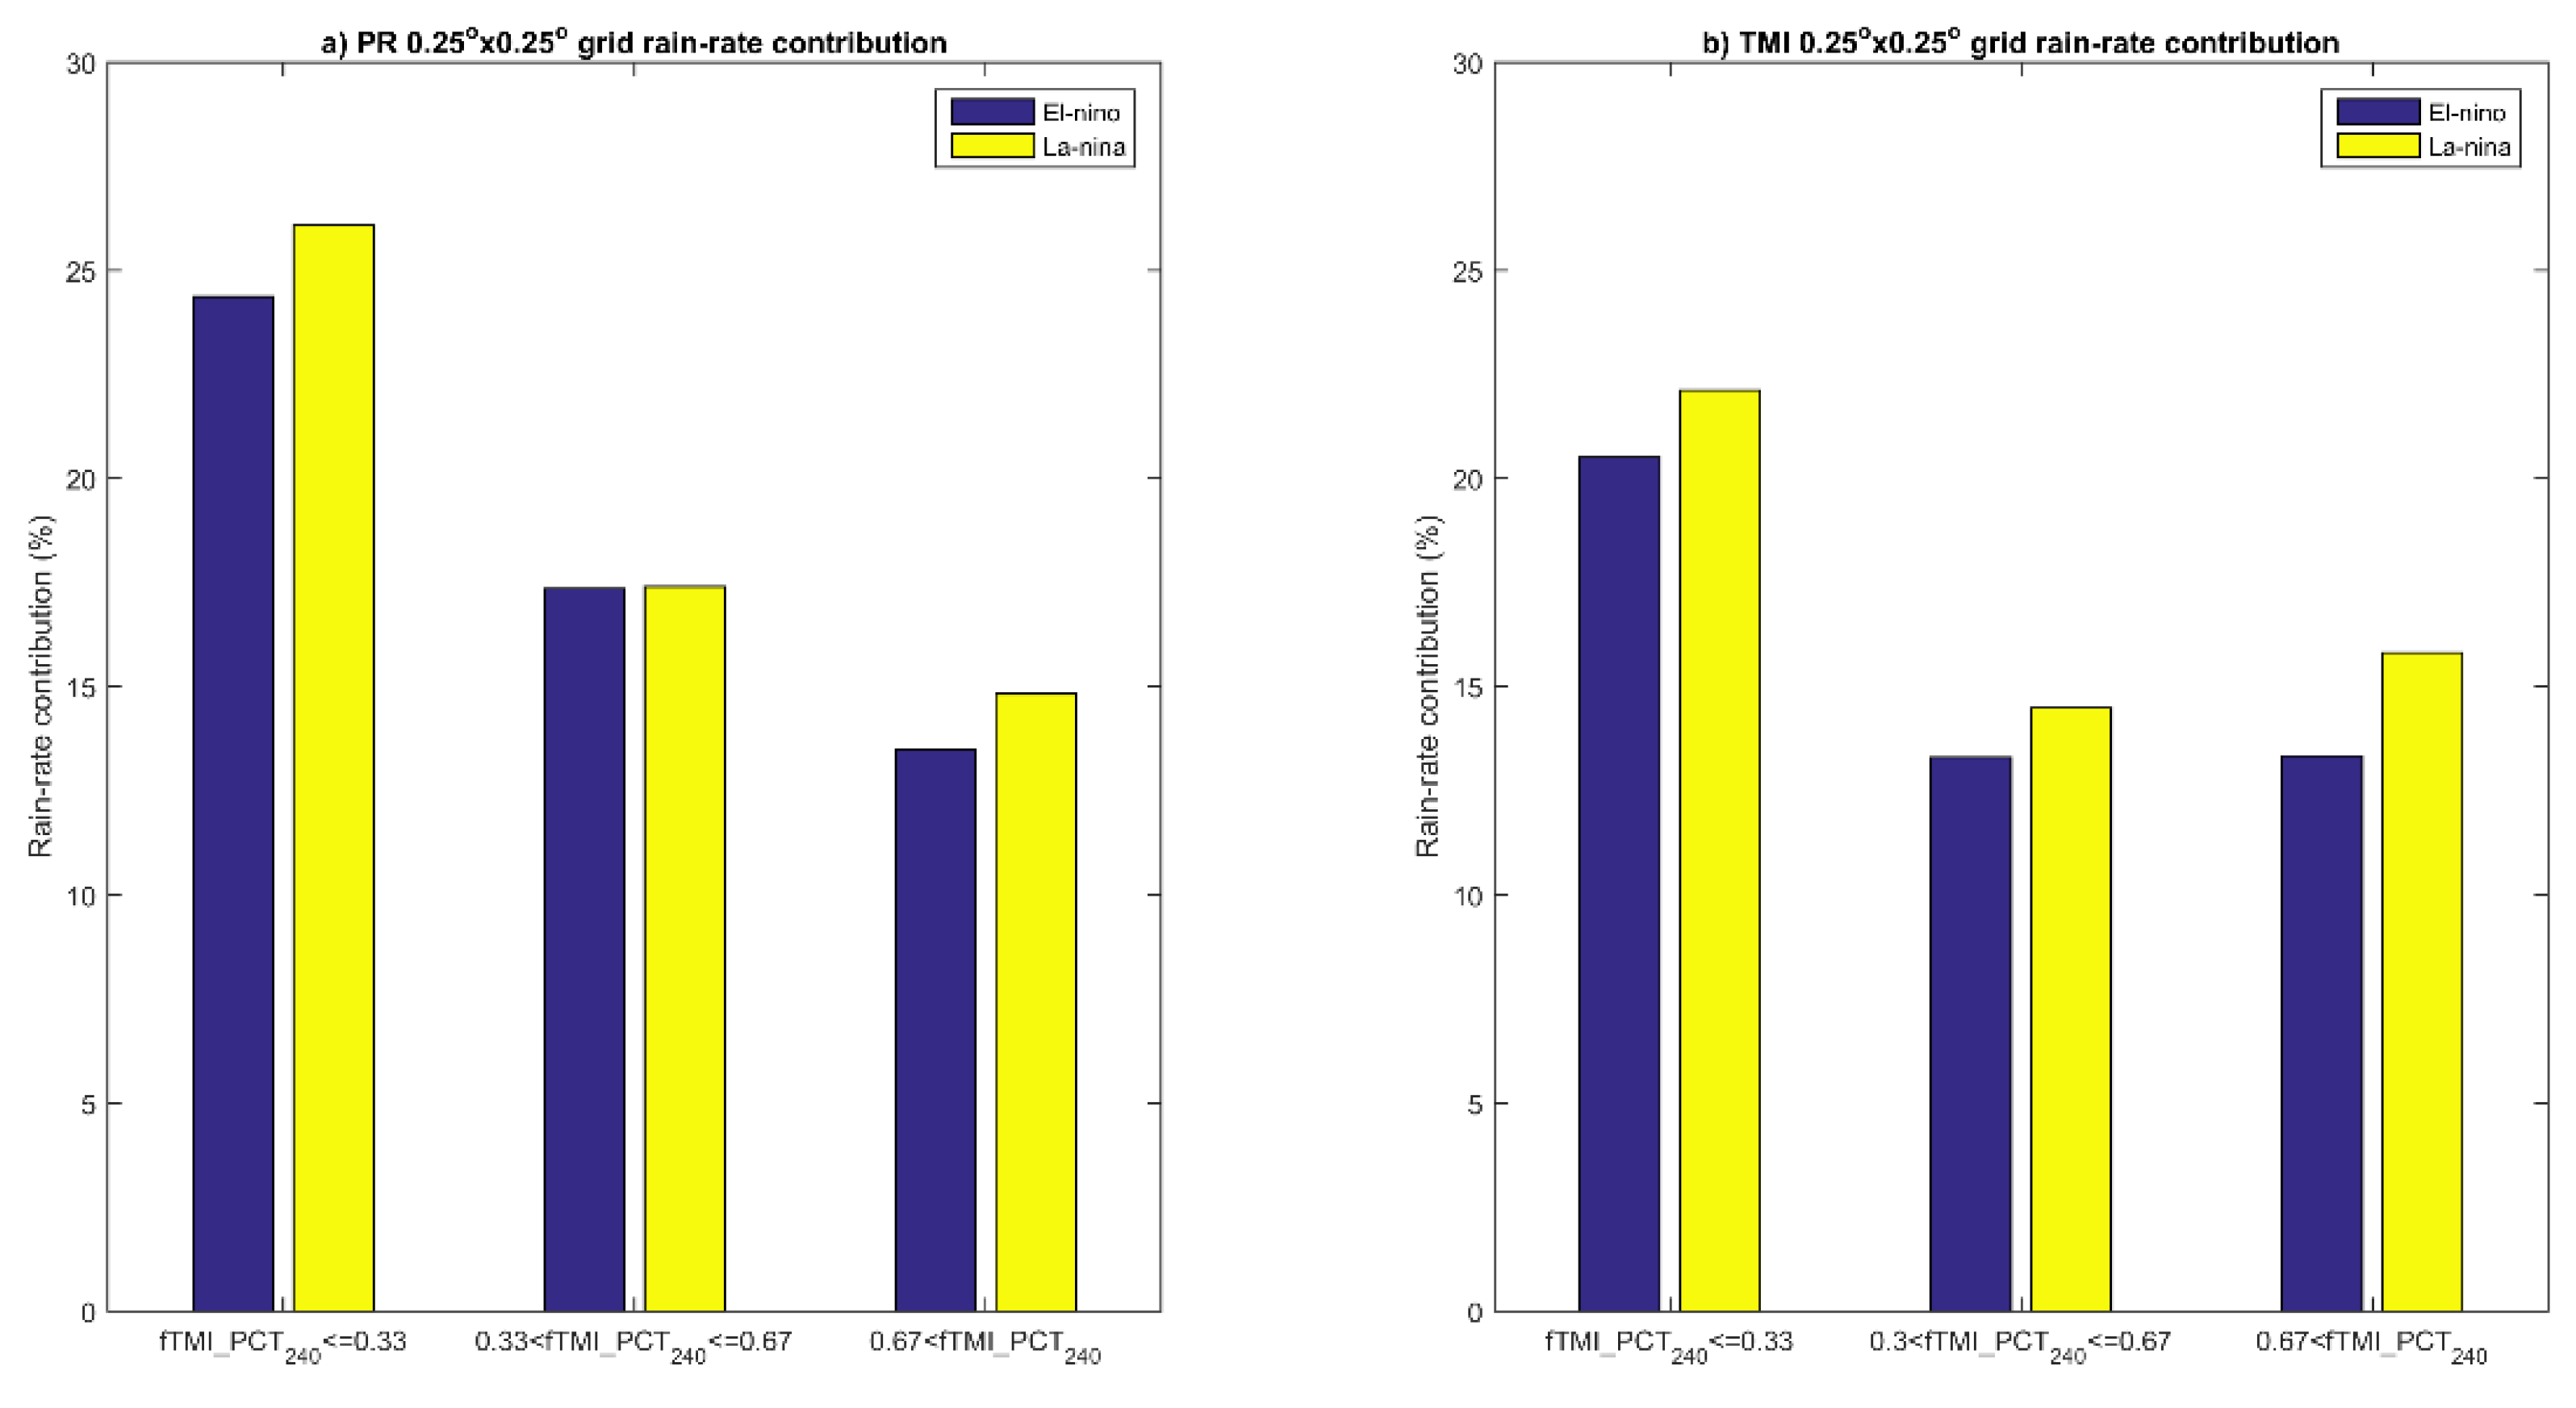
Figure 3 and
Figure 4. The characteristics of TMI estimation in
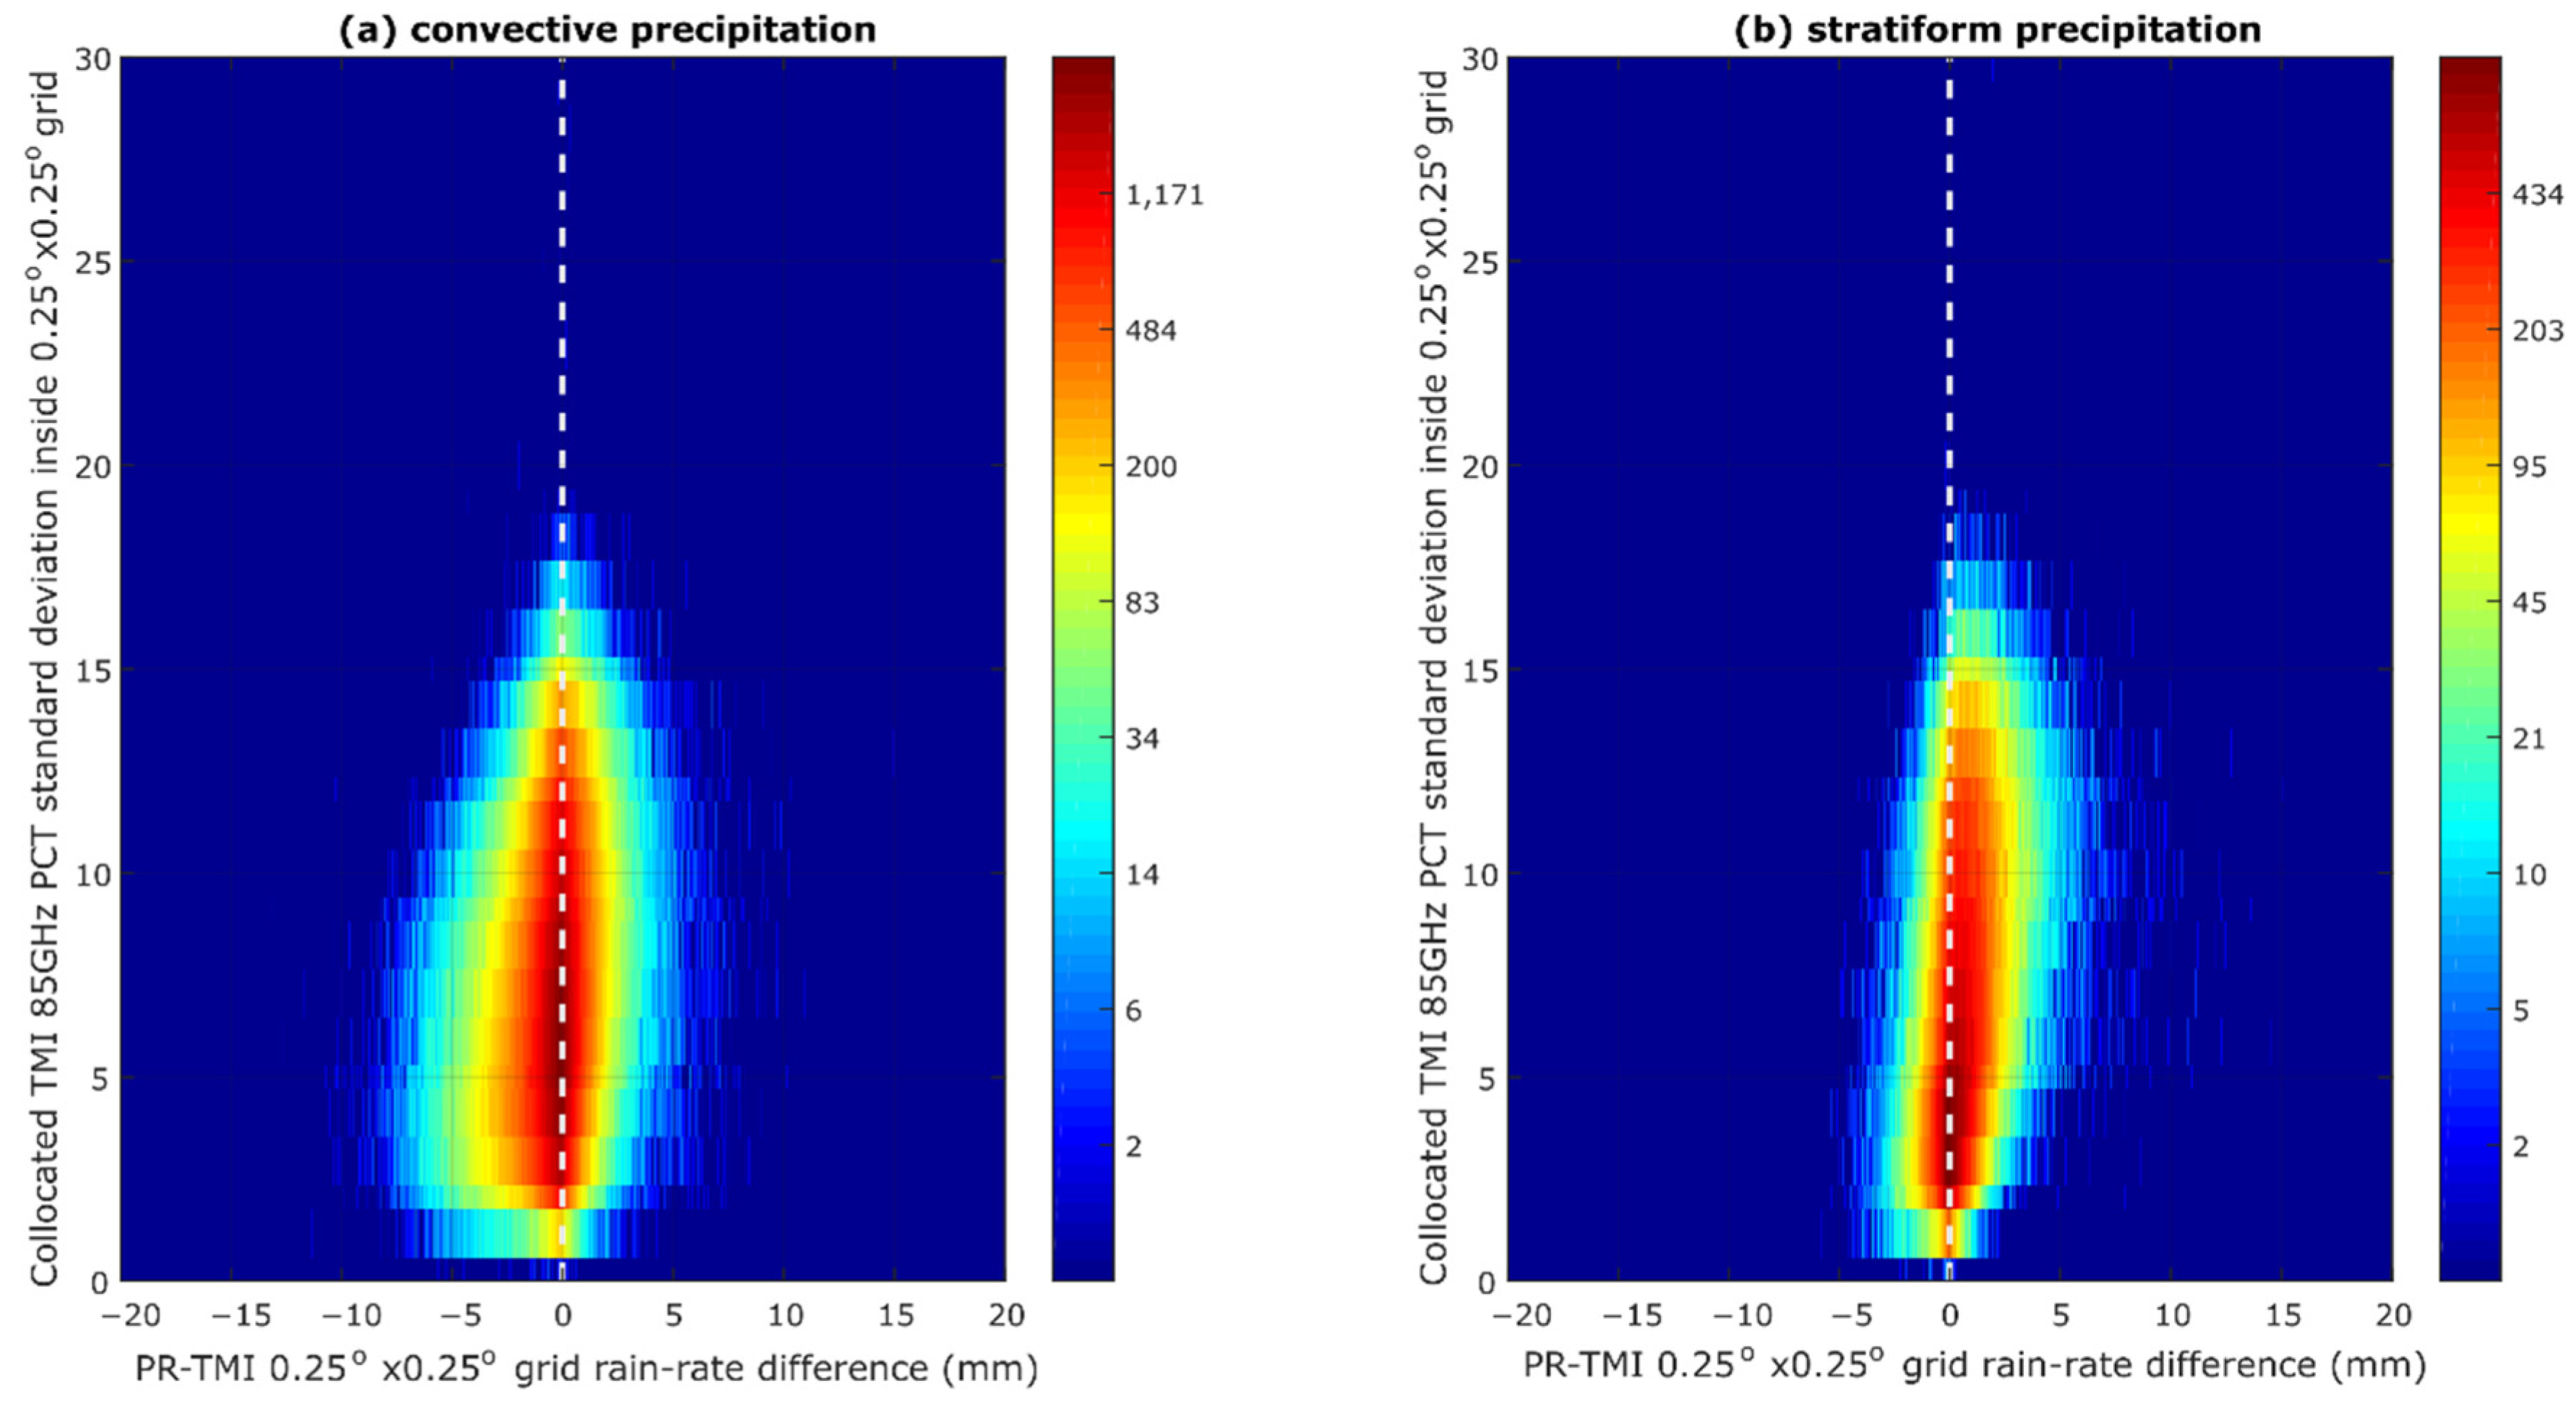
Figure 5 show that it often estimates higher rain-rates than PR for shallow convective precipitation that is heavily organized. In contrast, PR often estimates a higher rain-rate than TMI when there is large variation in the precipitating clouds. Previous research indicates that a higher PR estimation might be associated with less organized precipitation [
30]. In addition to the previous research results, this research shows that the higher PR estimation is attributed to precipitating stratiform clouds that contain large variations in ice particles (
Figure 6 and
Figure 7). The variation in ice particles also means that there are variations in terms of cloud heights and precipitation. The strong ice-scattering signals and their large variation indicate that they might be associated with a small-deep convective system surrounded by stratiform rain, as previously explained. Since the convective part is much less than the stratiform part, in this research, it is classified as stratiform precipitation. It should be noted that TMI estimation also depends on emission channels that have a large footprint. The analysis is conducted at a 0.25° × 0.25° grid resolution (approximately 27.75 km × 27.75 km near the equator), while the largest TMI emission footprint is 72 km × 43 km (at 10 GHz). This kind of characteristic is not observable from TMI emission channels. As a result, TMI estimates a lower rain-rate than PR.
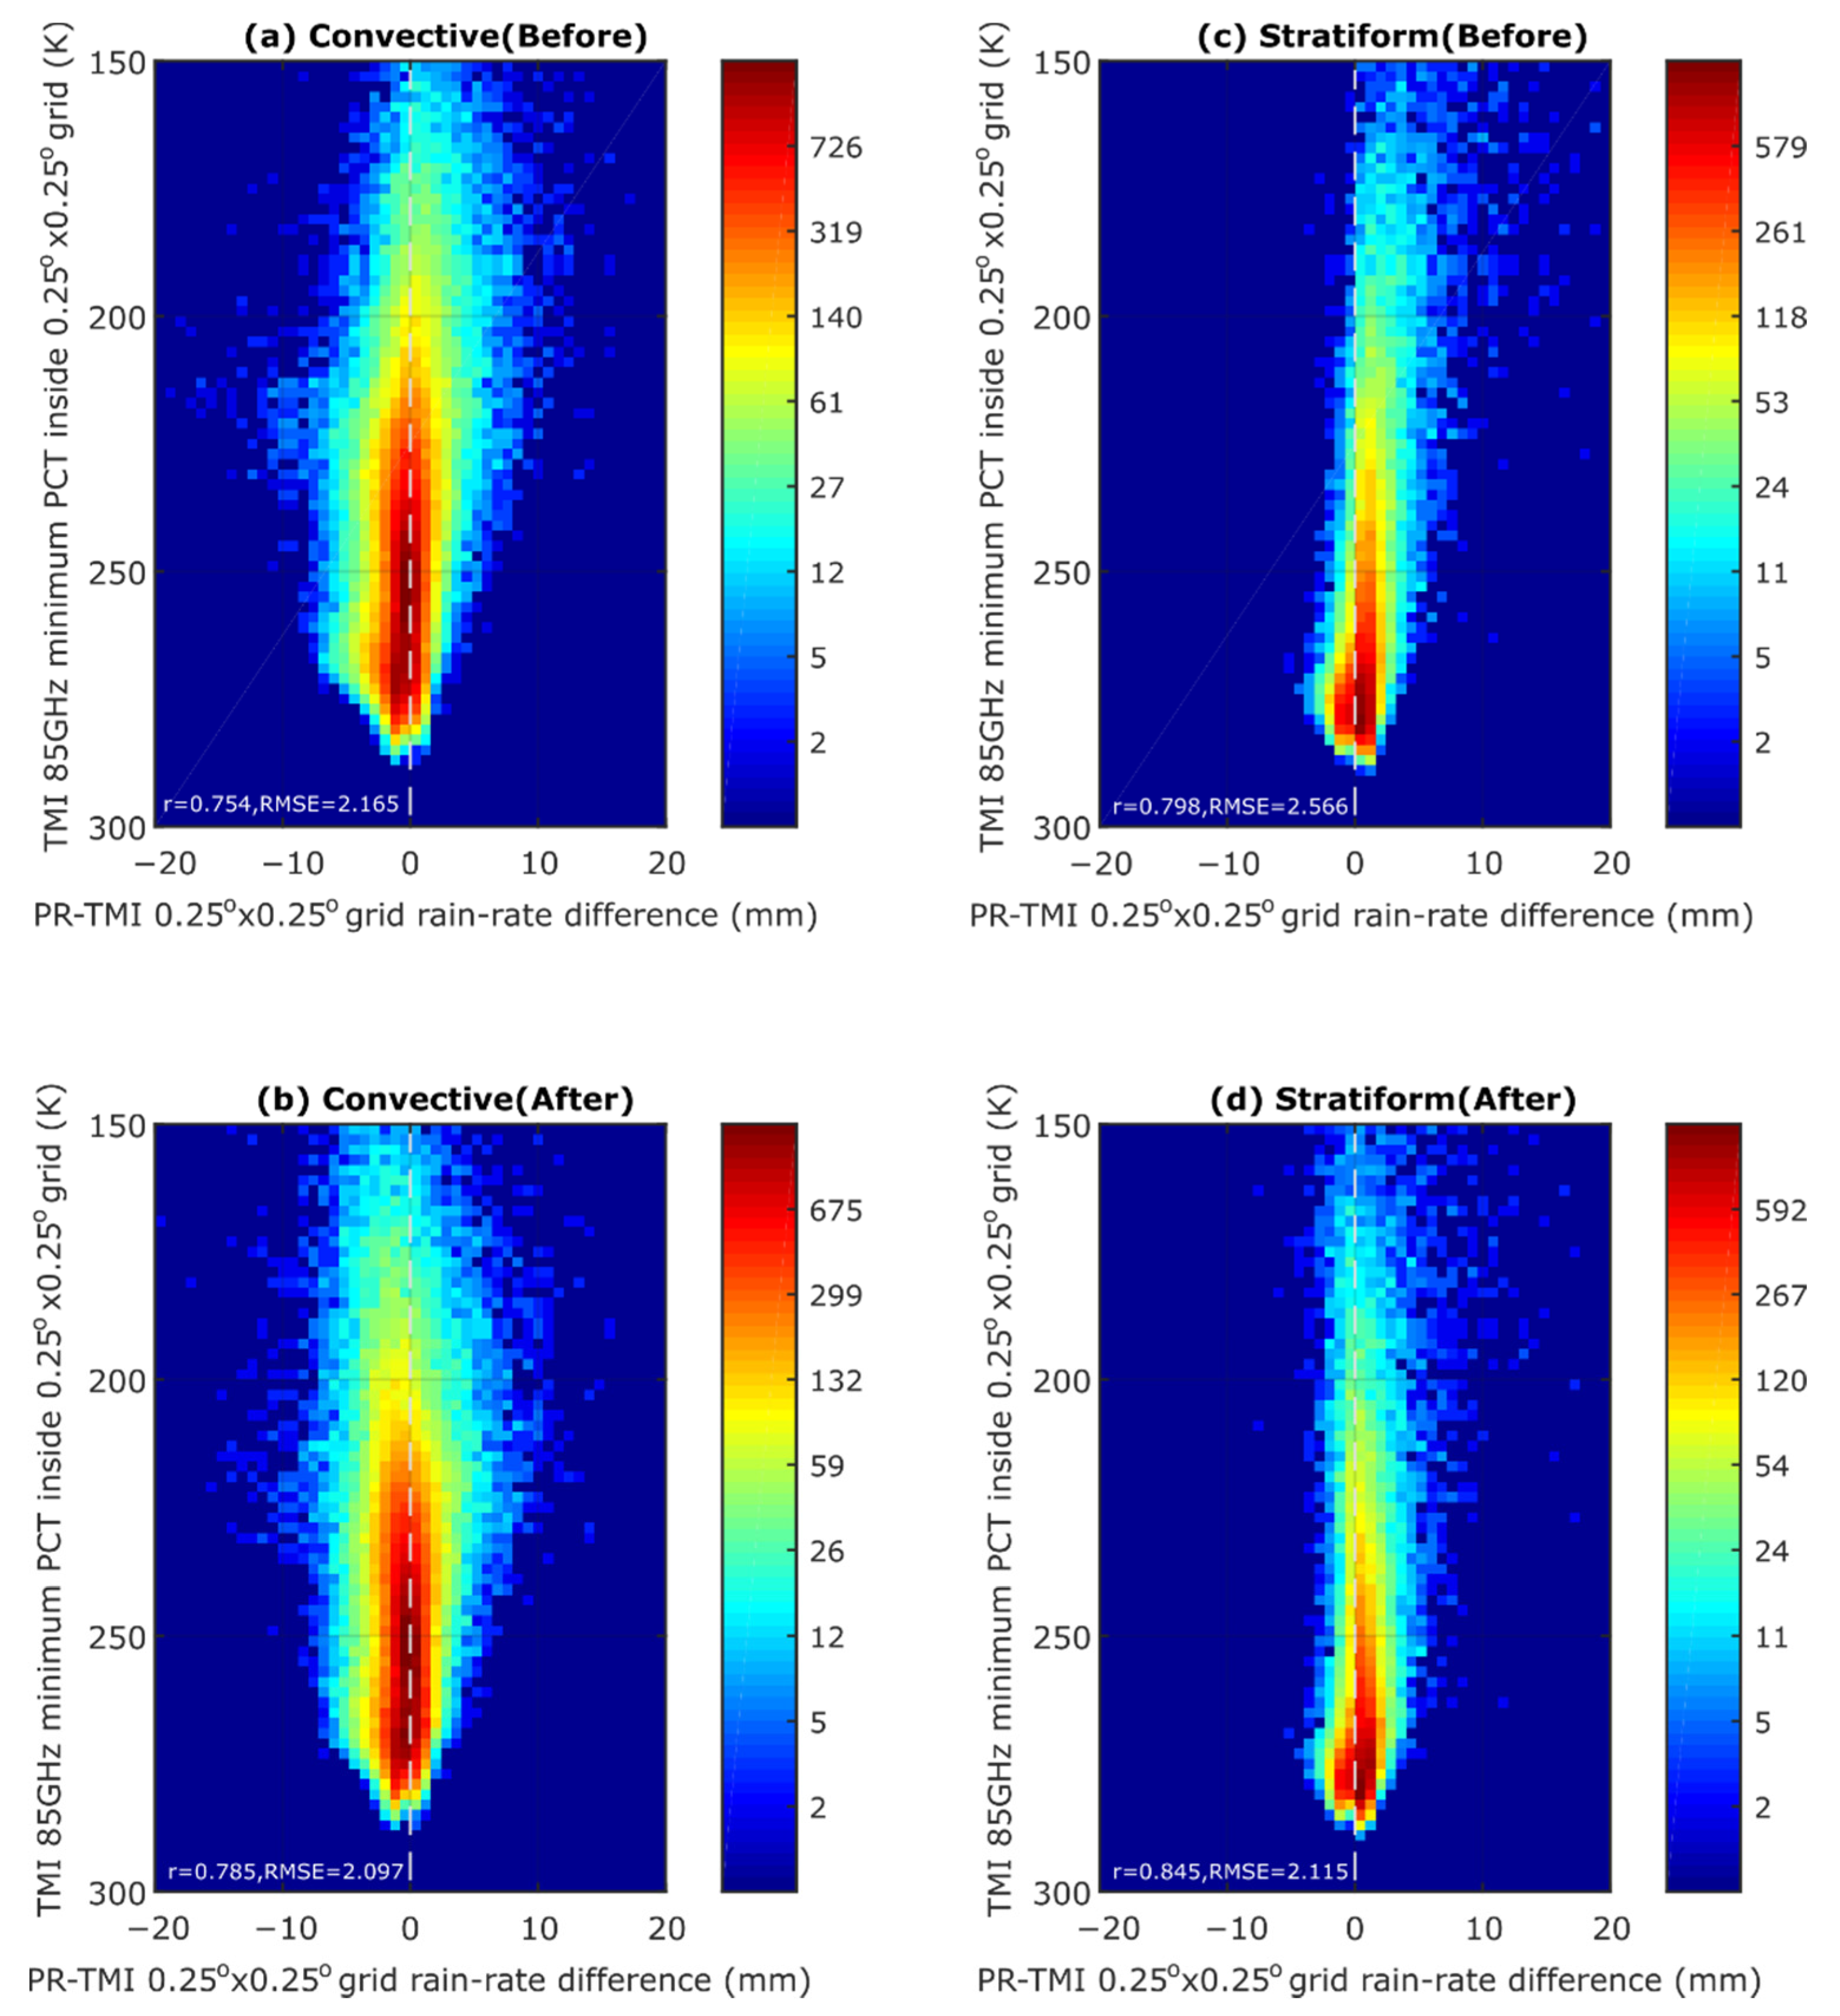
The TMI rain-rate adjustment explained above indicates that the characteristics related to precipitation homogeneity can influence the rain-rate estimation bias between PR and TMI.
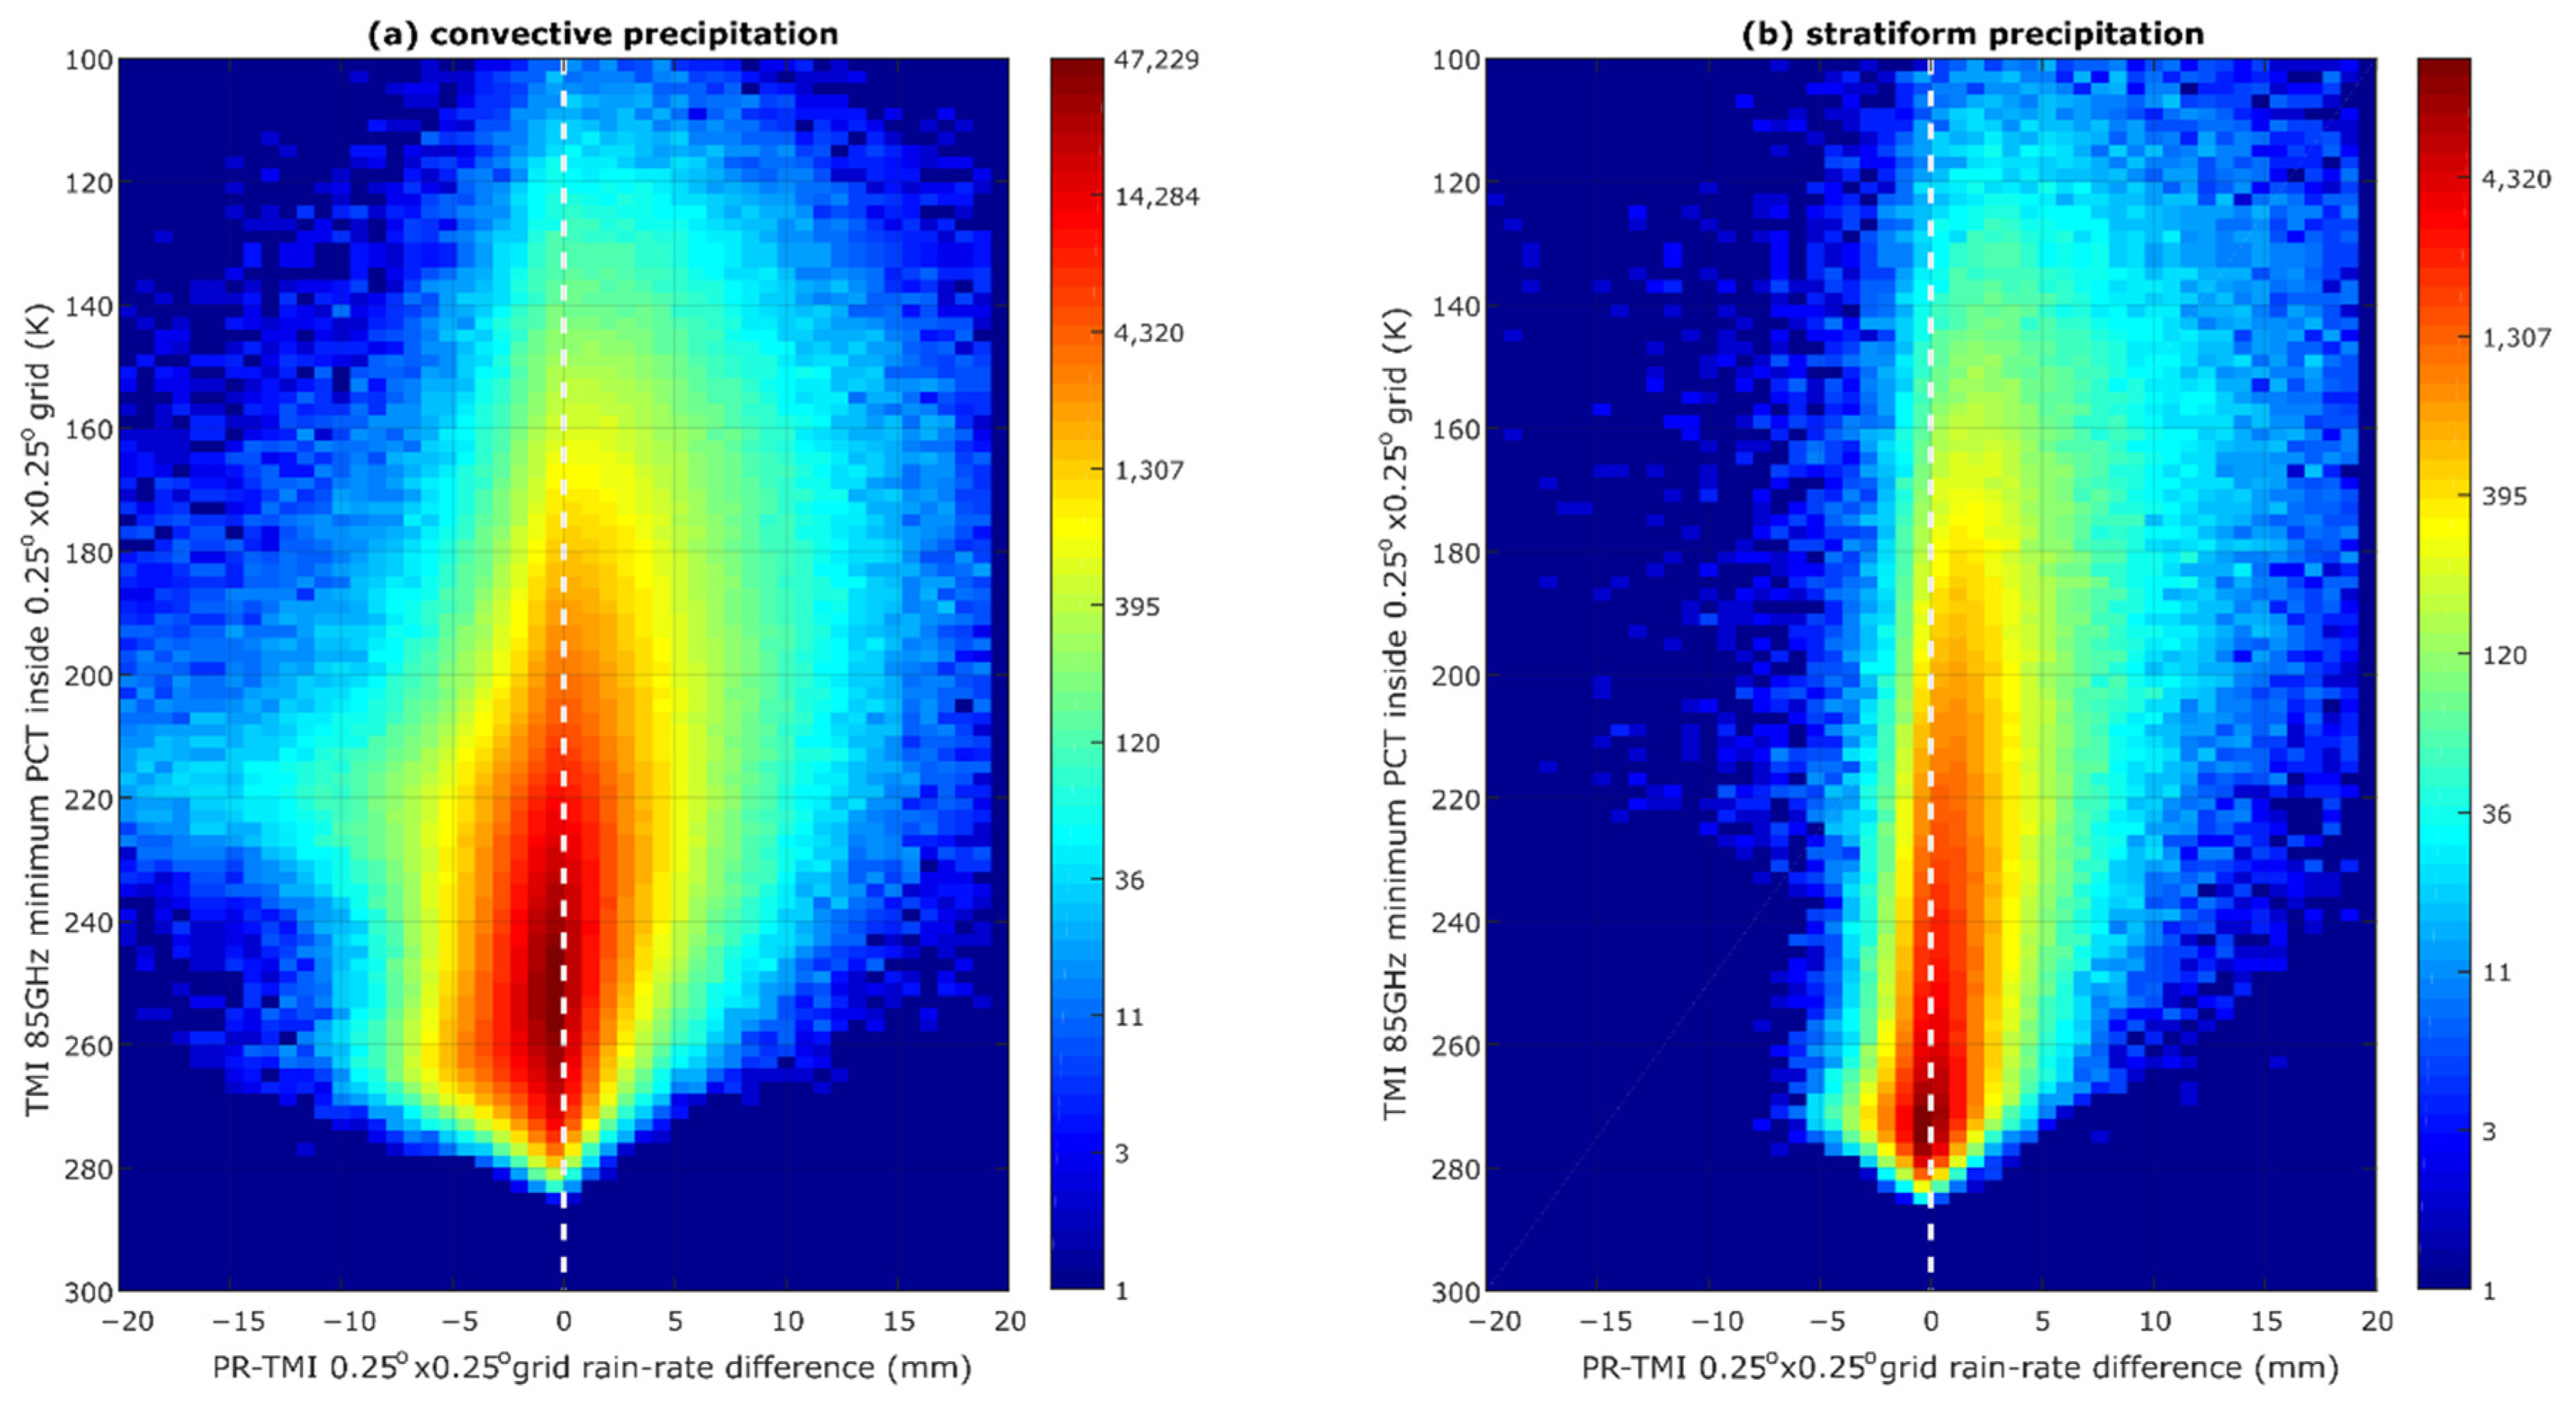
Figure 8 and
Figure 9 show that the adjustment produces rain-rate estimations from TMI that conform more to PR rain estimation than the original product. However, there are still large variations in the rain-rate estimation bias from the two products, particularly for convective precipitation. The TMI does not have information related to the type of precipitation and therefore is not included in the adjustment. As a result, the method developed in this research does not differentiate convective and stratiform precipitation. Since the estimation bias for stratiform precipitation is relatively linear compared to convective precipitation, the algorithm works well in terms of increasing correlation and lower difference. The adjustment produces a higher rain-rate estimation compared to the original estimation for stratiform precipitation. Therefore, the adjustment could produce rain-rate estimations that conform more closely with PR. However, when a similar adjustment is implemented to convective precipitation, it becomes higher than PR, and the joint histogram is slightly biased to the left.
5. Conclusions
In summary, this paper highlights the PR-TMI rain-rate estimation differences that are influenced by precipitation organization and homogeneity. The TMI estimates a higher rain-rate than PR when it detects precipitation from heavily organized precipitation that has homogeneous characteristics. However, it estimates a lower rain-rate than PR when there is deep but less organized precipitation that has inhomogeneous characteristics. The above difference might be associated with TMI emission channels that have a relatively large footprint compared to PR. At the grid level, the information about precipitation organization and homogeneity obtained from the TMI 85 GHz ice-scattering signature could produce adjustments, so TMI rain-rate estimation becomes more consistent with PR to a certain degree. This is particularly applicable for inhomogeneous rain that shows large variations in precipitating clouds and is dominated by stratiform precipitation. The TMI-based adjustment for convective precipitation, although slightly improved, is also influenced by stratiform precipitation that is not differentiated in the rain-rate database.
The differentiation of convective-stratiform precipitation in the adjustment algorithm might produce a better result than that presented in this research. Information about the convective-stratiform fraction might be obtained from PR rain-type products (in PR2A23) and included in the database. However, since the TMI swath is three times larger than the PR swath, the PR rain-type product will only be applicable when the PR and TMI data overlap. In other words, it will not be useful when the only available information is from passive microwave data and therefore is not included in the analysis. Improvement of the footprint size in the future of TRMM satellites, such as GPM, might also reduce the estimation difference. However, the largest footprint for the GPM Microwave Imager is 32 km × 19 km (at 10.65 GHz) [
33]. Compared to the GPM dual precipitation radar, which has a 5 km × 5 km footprint, the GPM footprint is still larger. Therefore, bias due to different precipitation organizations and homogeneity is predicted to exist.
This research not only contributes to the improvement of satellite rain-rate estimation products but also gives an insight into how the precipitation process at a small scale (sub-grid level) could affect the higher scale (grid level). For example, inhomogeneous rainfall generated by deep isolated precipitation systems could produce a considerable rain-rate at the local scale but is often underestimated at the grid level [
13]. In relation to precipitation downscaling, estimating rain-rates at the sub-grid level in the above case often becomes problematic [
34]. However, characterization of the ice-scattering signatures as presented in this study also could be considered in the precipitation downscaling process to obtain more reliable results.
