Article

Carbon Dioxide and Methane Emissions during the Composting and Vermicomposting of Sewage Sludge under the Effect of Different Proportions of Straw Pellets

1
Department of Agro-Environmental Chemistry and Plant Nutrition, Faculty of Agrobiology, Food, and Natural Resources, Czech University of Life Sciences, Kamycka 129, 16500 Prague, Czech Republic
2
College of Agriculture and Veterinary Medicine, Jimma University, Jimma P.O. Box 307, Ethiopia
*
Author to whom correspondence should be addressed.
Atmosphere 2021, 12(11), 1380; https://doi.org/10.3390/atmos12111380
Submission received: 16 September 2021 / Revised: 13 October 2021 / Accepted: 19 October 2021 / Published: 22 October 2021
(This article belongs to the Special Issue Advances in Atmospheric Sciences)

Abstract

:
Owing to rapid population growth, sewage sludge poses a serious environmental threat across the world. Composting and vermicomposting are biological technologies commonly used to stabilize sewage sludge. The objective of this study was to assess the carbon dioxide (CO2) and methane (CH4) emissions from sewage sludge composting and vermicomposting under the influence of different proportions of straw pellets. Four treatments were designed, by mixing the initial sewage sludge with varying ratio of pelletized wheat straw (0, 25%, 50%, and 75% (w/w)). The experiment was conducted for 60 days, and Eisenia andrei was used for vermicomposting. The results revealed that the mixing ratio influenced CO2 (F = 36.1, p = 0.000) and CH4 (F= 73.9, p = 0.000) emissions during composting and CO2 (F= 13.8, p = 0.000) and CH4 (F= 4.5, p= 0.004) vermicomposting. Vermicomposting significantly reduced CH4 emissions by 18–38%, while increasing CO2 emissions by 64–89%. The mixing agent (pelletized wheat straw) decreased CO2 emission by 60–70% and CH4 emission by 30–80% compared to control (0%). The mass balance indicated that 5.5–10.4% of carbon was loss during composting, while methane release accounted for 0.34–1.69%, and CO2 release accounted for 2.3–8.65%. However, vermicomposting lost 8.98–13.7% of its carbon, with a methane release of 0.1–0.6% and CO2 release of 5.0–11.6% of carbon. The carbon loss was 3.3–3.5% more under vermicomposting than composting. This study demonstrated that depending on the target gas to be reduced, composting and vermicomposting, as well as a mixing agent (pelletized wheat straw), could be an option for reducing greenhouse gas emissions (i.e. CH4, CO2).

1. Introduction

The world generates approximately 1.3 billion metric tons of solid waste, which is nearly double the amount generated a decade ago [1]. Solid waste generation is expected to be more than double by 2025 [2]. The annual increase in solid waste generation is inextricably linked to the global population’s rapid growth and urbanization rate. Municipal solid waste (MSW) has primarily been disposed of in urban areas around the world through landfilling, incineration, and centralized composting and anaerobic digestion facilities. These processes result in direct and indirect emissions of greenhouse gases (GHGs) such as carbon dioxide (CO2), methane (CH4), nitrous oxide (N2O), and non-methane hydrocarbons (NMHCs), accounting for approximately 3–4% of anthropogenic GHG emissions in terms of the CO2-equivalent (CO2-e) [3]. The anaerobic decomposition of these wastes in landfills produces CH4 emissions, which contribute significantly to the global greenhouse budget [4].
Sewage sludge is a residual, semi-solid material produced as a by-product of biological wastewater treatment or municipal wastewater treatment [5,6]. Due to the putrescible characteristics of sewage sludge, a large amount produced in recent decades represents a rising trend, and improper disposal or management has resulted in serious environmental pollution, posing a waste management challenge [5,7].
Inadequate sewage sludge management causes secondary pollution such as pathogenic microbes, organic micropollutants, and toxic heavy metals; thus, sustainable and eco-friendly sewage sludge management is urgently needed [8].
According to He et al. [9], the European Union currently produces more than 10.96 million tons of sewage sludge per year and China produces 40 million tons of sewage sludge with an 80% moisture content [10], both of which are increasing due to both accelerated urbanization and the increased capacity of municipal wastewater treatment facilities [11,12]. In the past, sewage sludge was disposed of through incineration, landfilling, or ocean disposal [13].
Composting and vermicomposting are effective and low-cost methods for managing and reusing sewage sludge because the products are safe and stable, and can be used as organic fertilizer or soil conditioner for farming [14,15,16]. However, harmful gases such as ammonia (NH3), nitrous oxide (N2O), and methane (CH4) emitted because of poor composting process management reduce not only the agronomic value of compost as a soil fertilizer or amendment but also the environmental benefits of composting [17,18]. Researchers have become interested in N2O and CH4 emissions during the composting process as global warming worsens and the greenhouse effect intensifies [19,20].
Two of the most significant greenhouse gases in the atmosphere are methane (CH4) and carbon dioxide (CO2). On a mass basis, methane is more radiatively powerful than CO2 and the current global warming potential of CH4 is 34 times greater than that of CO2 over a 100-year period [21].
Concerning the aforementioned issues, substantial research on sewage sludge composting has been conducted in recent decades, with a particular emphasis on the use of various additives to reduce greenhouse gas emissions [22,23]. Although earthworms do not produce these gases, they can have a significant impact on the physicochemical properties of the feeding substrate, thereby indirectly affecting gas-producing processes and thus CO2 and CH4 emissions.
The effects of earthworms on greenhouse gas emissions are complicated and no agreement has been reached. Earthworms, for example, increased N2O and CO2 emissions from soils by 42% and 33%, respectively [24]. Others found that earthworms increased CO2 emissions but had no effect on N2O fluxes from soils [25,26]. Similarly, the study in [27] demonstrated that vermicomposting of household waste produced more CO2 and CH4, but produced less N2O than traditional composting.
The majority of previous composting and vermicomposting studies focused on the feasibility of different organic wastes, the factors influencing earthworm growth and reproduction rates, and the quality of composts and vermicompost [28,29]. Furthermore, several recent studies [24,30] have focused on the effects of earthworms on GHG emissions from soils. However, there are limited studies on carbon dioxide and methane emissions during composting and vermicomposting of organic wastes, specifically sewage sludge, with varying ratio of additive materials. As a result, the goal of this study was to assess the carbon dioxide (CO2) and methane (CH4) emissions from sewage sludge composting and vermicomposting under the influence of different proportions of straw pellets.

2. Materials and Methods

2.1. Raw Materials

The study made use of unstabilized sewage sludge and straw pellets mixed with water. The freshly deposited sewage sludge (SS) used in the experiments originated from a wastewater treatment plant in the Czech Republic, where thousands of people live, and had a dry matter content of 13.3%. A dried pelletized wheat straw (PWS) with a diameter of 10 mm was provided by the Granofyt Ltd. Company (Chrášťany, Czechia). Dry straw pellets were mixed with hot water at a rate of 4 L per 1 kg of straw pellets. After mixing, the wet pellets were added to the sludge. The resulting material was put into aerobic fermenters for composting and the same mixing materials (treatments) were also transferred to worm bins for vermicomposting. The experiment was carried out at the Research Station of the Czech University of Agriculture in Červený Újezd, with samples subsequently analyzed at the Life Science laboratories of the Czech University in Prague. The selected chemical properties of the sewage sludge and pelletized wheat straw are listed in Table 1, while the treatments on the initial day (day 0) are listed in Table 2.

2.2. Experimental Setup

Composting and Vermicomposting

The experiment consisted of four treatments obtained by mixing the sewage sludge (SS) with pelletized wheat straw (PWS) at different mixing ratio including, T1 (100% SS (control)), T2 (75% SS + 25% PWS), T3 (50% SS + 50% PWS), and T4 (25% SS + 75% PWS; w/w). To avoid earthworm mortality and to allow earthworms to return to suitable conditions, the substrate (3 L of apple pomace) containing earthworms was placed into the tray from the side. After mixing the materials (SS and PWS) at different percentage proportions, the treatments were transferred to worm-bins for vermicomposting in a specially adopted laboratory with controlled conditions (temperature 22 °C, relative humidity 80%) for 60 days. Each worm-bin received 377 (57.4 g) pieces of adult Eisenia andrei earthworms per treatment, with the initial average weight and number of earthworms at 19.13 g/kg and 126 pieces/kg, respectively, of the substrate. The moisture level of the material was maintained at about 70–80% of the wet mass throughout the vermicomposting stage by spraying the surface with water at two-day intervals and the same treatments used for vermicomposting were also transferred to the fermenter barrels for 60 days of composting. Three replications were conducted for all the treatments.

2.3. Carbon Dioxide (CO2) and Methane (CH4) Measurements during Composting and Vermicomposting

The CO2 and CH4 concentrations were measured using a closed chamber technique during composting and vermicomposting. A tight-fitting lid with two ports for headspace gas-sampling and air temperature measurement was used to connect one side of a plastic tube to closed barrels for composting and to a worm bin for vermicomposting, while the other side of the plastic tube was connected to instruments during the data collection. For 60 days, measurements were taken twice per day at 12 h intervals using the Gasko Infrared Gas Analyzer [31]. To calculate the cumulative CO2 and CH4 emissions, we added daily values to obtain the total cumulative gas emissions over the course of the experiment [31].
A t a b = t b t a · F t a + F t b 2  
where At(ab) is the cumulative emission between the measurement days (between ta and tb), ta and tb are the measurement dates, and Fta and Ftb are the gas fluxes on the two measurement dates. Therefore, the total cumulative emissions were calculated as the sum of cumulative emissions on each day using Equation (2):
T o t a l   c u m u l a t i v e   e m i s s i o n = A t a b    
C losses during composting and vermicomposting were calculated as:
C   l o s s % = ( C i n i t i a l C e n d i n g ) C i n i t i a l  

2.4. Analysis of Total Carbon (TC), Total Nitrogen (TN), pH, and EC

The representative composite samples (about 150 g of wet basis per treatment) were taken, freeze-dried (−25 °C), lyophilized, and ground for the total carbon (TC) and total nitrogen (TN) analysis, whereas a 30 g sample was frozen at 4 °C for the pH and EC determination. Standard methods were used to determine TC, TN, pH, and EC from the samples. The pH and electrical conductivity (EC) were measured in distilled water at a 1:5 (w/v) ratio. The pH-H2O and the electrical conductivity (EC) were tested using a WTW pH 340i and WTW cond 730 (1:5 w/v dry basis) according to [32]. Inductively coupled plasma optical emission spectrometry (ICP-OES, VARIAN VistaPro, Varian, Australia) with axial plasma configuration was used to determine TC and TN in accordance with [33].

2.5. Statistical Analyses

The statistical analyses were carried out using the R version 4.0.2 statistical package. ANOVA was used to test whether there was a significant difference between the composting method and mixing ratio in GHGs (i.e. CO2 and CH4) emissions and properties of final product. Tukey HSD test was used to compare the treatment means if the effect of the factors was significant at p < 0.05.

3. Results and Discussions

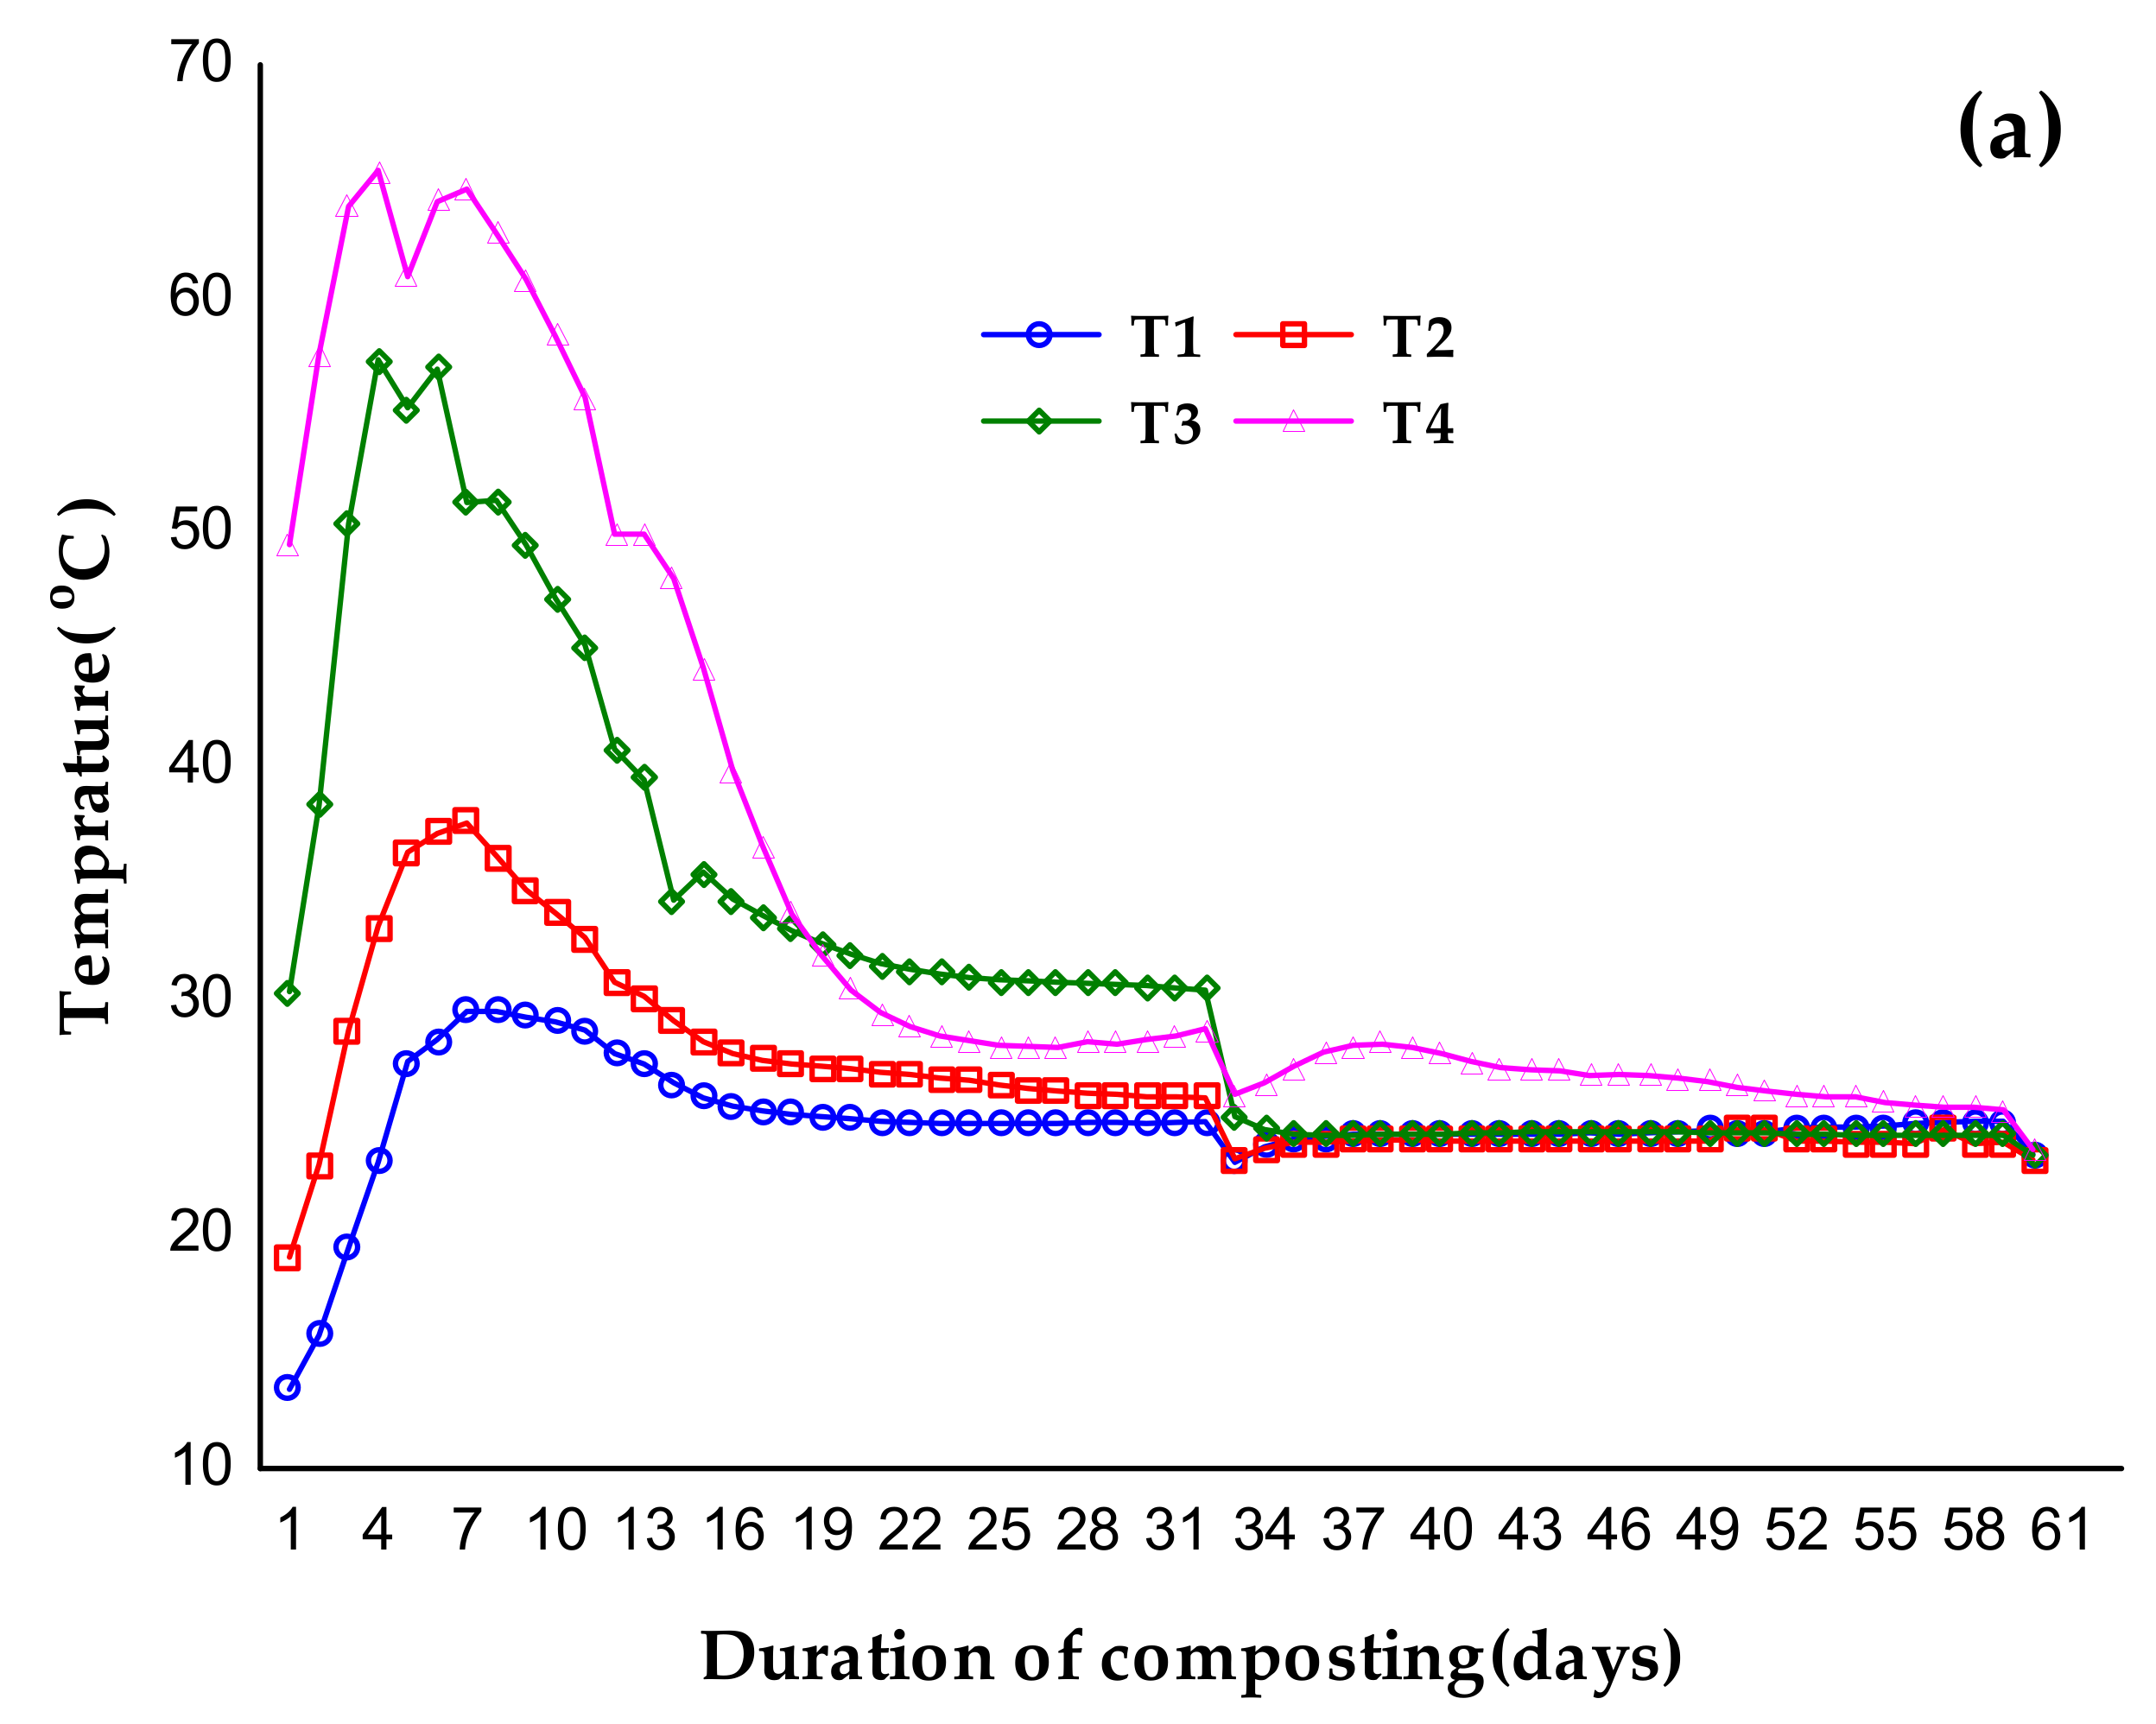
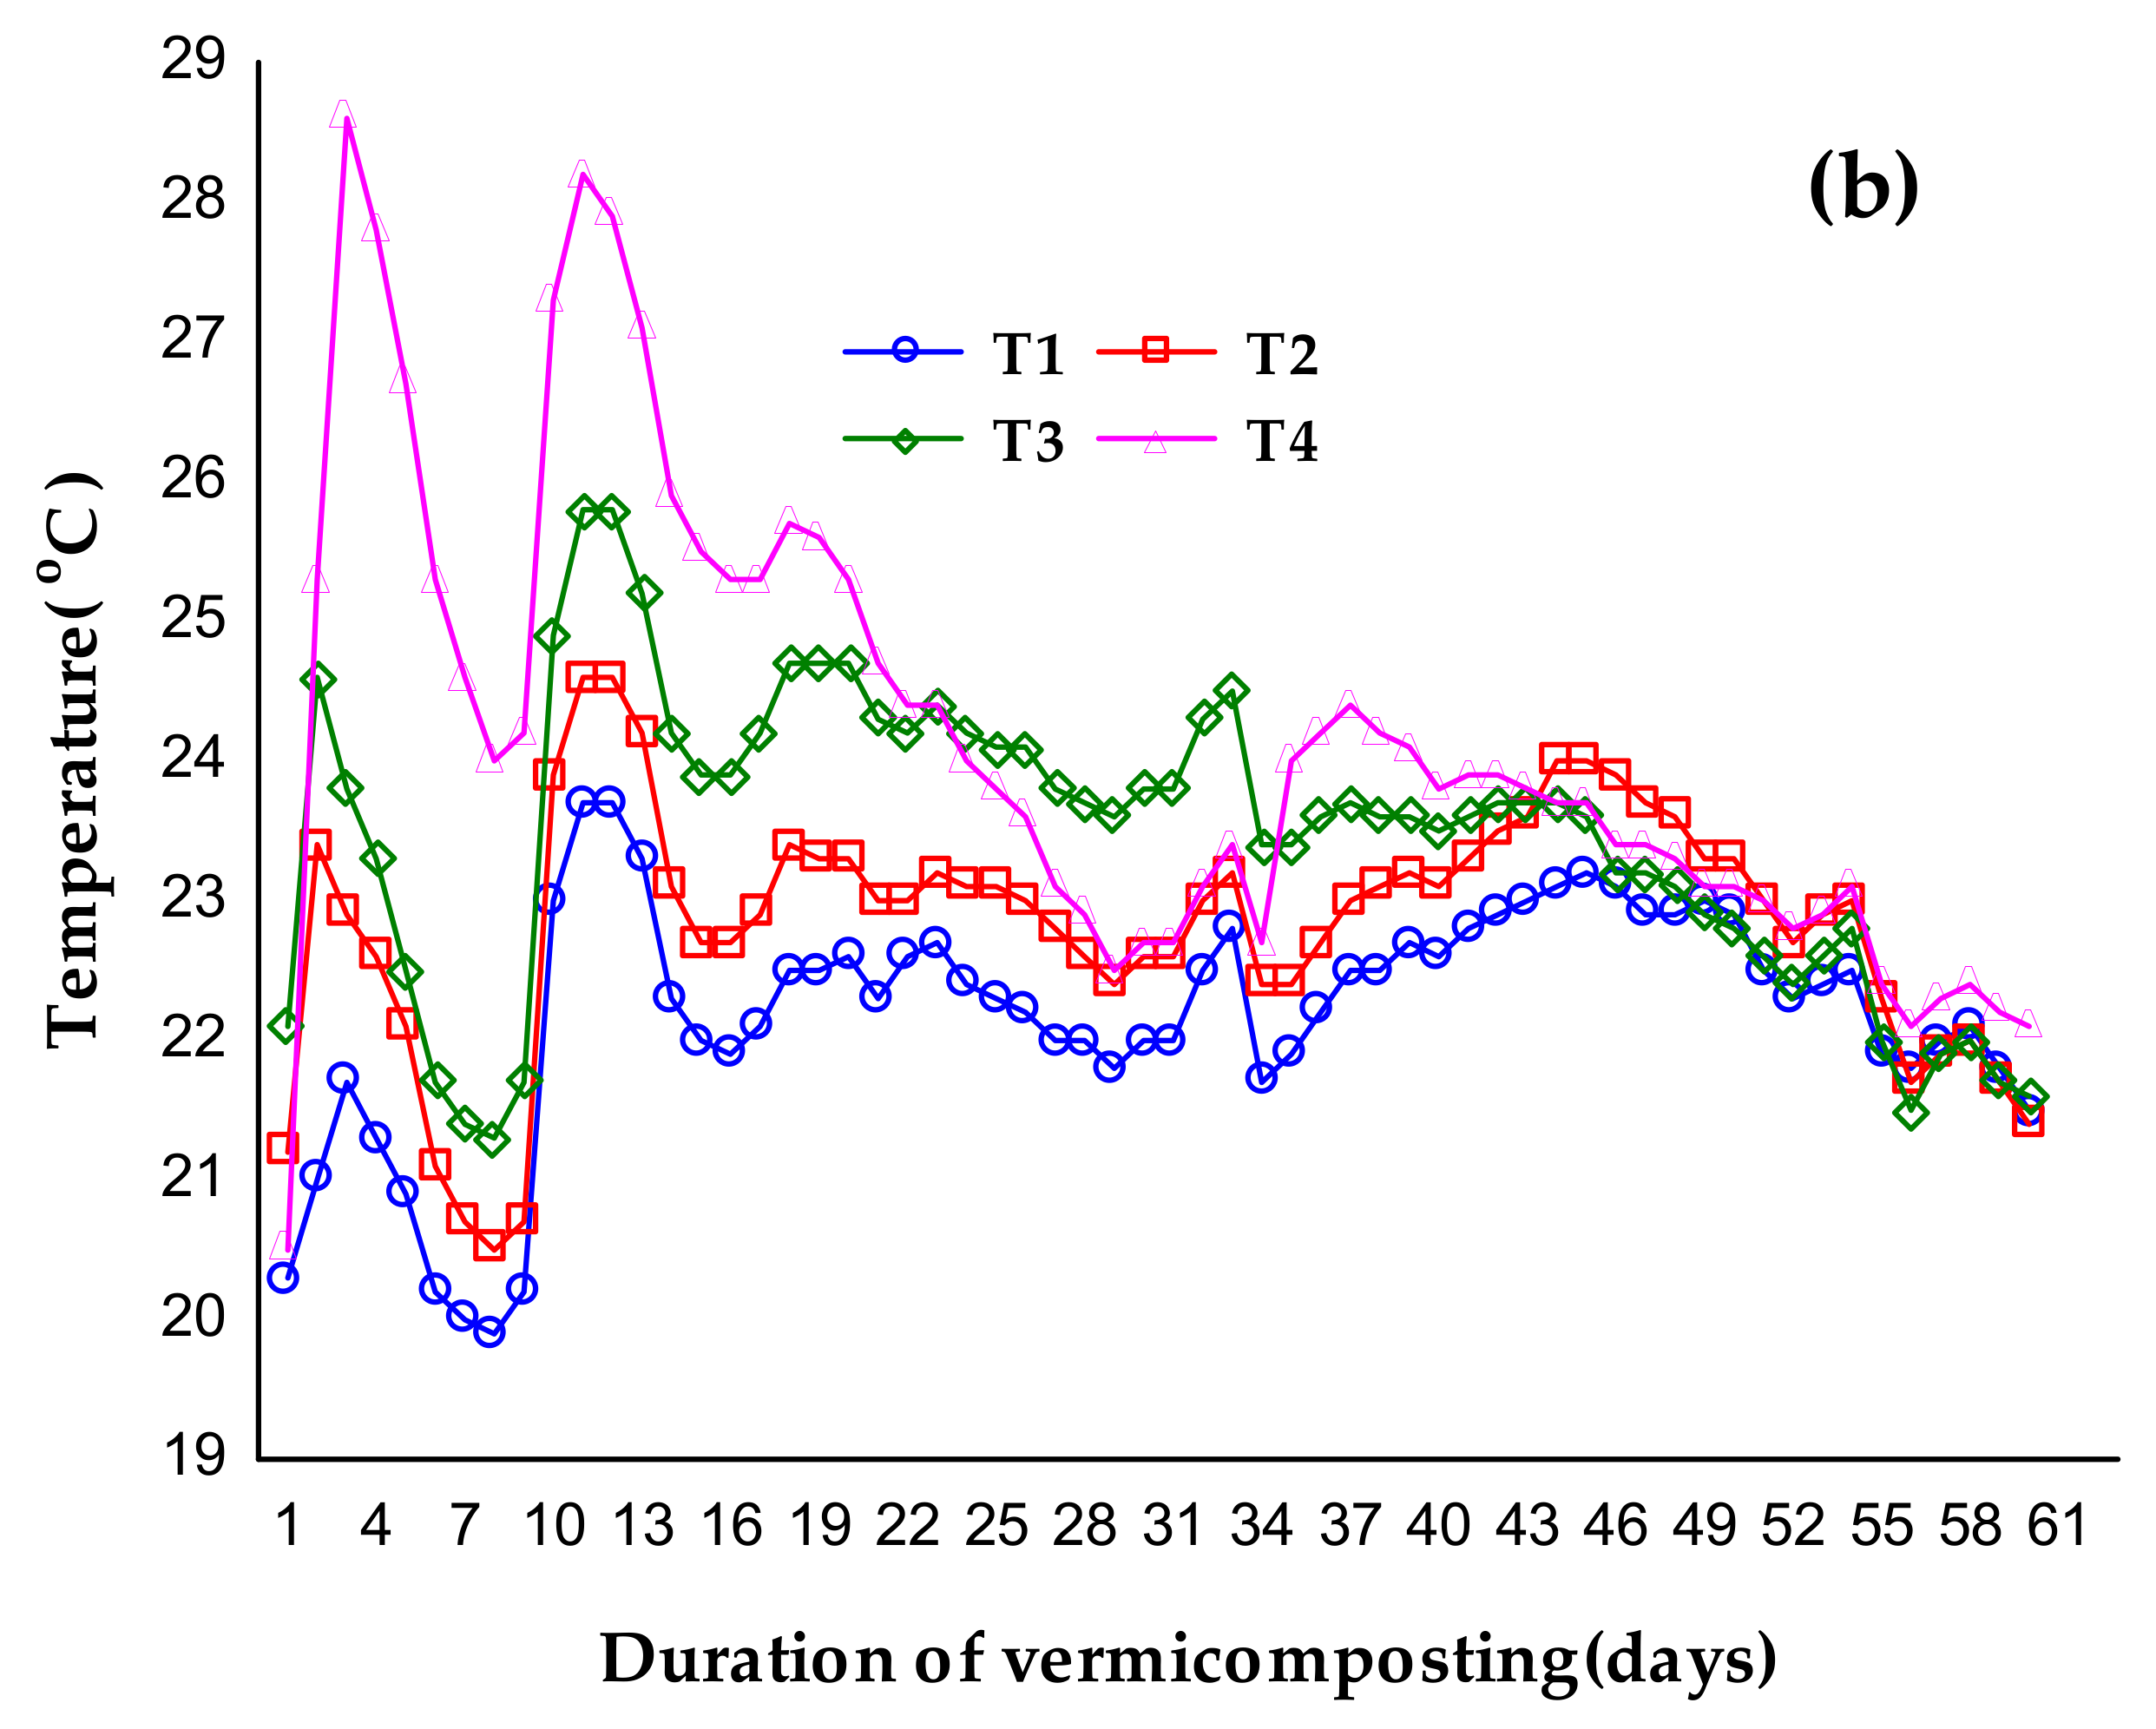
3.1. Temperature during Composting and Vermicomposting

During the composting process, the temperature in each treatment reached its maximum, with significant (F = 18.6, p = 0.000) differences among the treatments (Figure 1a). On days 3 and 2, the temperatures of two treatments (T3 and T4) rapidly reached the thermophilic stage (>50 °C). T4 reached a maximum thermophilic phase of 65.5 °C in four days, while T3 reached 57.4 °C in four days. The thermophilic phase of T4 lasted 14 days, while that of T3 lasted 10 days. The maximum temperature for the remaining treatments was 37.6 °C for T2 and 29.55 °C for T1, with temperatures gradually decreasing until the experiment ended. Thus, the addition of pelletized wheat straw resulted in a more intensive decomposition in the thermophilic phase, but the degradation process resulted in less heat in these mixtures during the cooling phase due to the depletion of easily degradable organic compounds [34]. T1 (control) and T2 (25% PWS) delayed reaching the thermophilic stage and had no thermophilic phase at all; the maximum temperature for T2 was 37.6 °C and 29.55 °C for the control, and they matured within the mesophilic temperatures. This may have been because of the high moisture content of these treatments.
In the laboratory, the vermicomposters were kept at 22 °C. The temperatures recorded during the vermicomposting are shown in Figure 1b. The temperature of the vermicomposting was in the 19 °C to 28 °C range, which was obviously less than the thermophilic compost range and was favorable for earthworms [35]. Statistical analysis revealed that there were significant temperature differences among the treatments during the vermicomposting period (F = 31, p = 0.000). At the start of the process, the temperature of the vermicomposting material rose to 28.6 °C only for T4.

3.2. pH and EC

The pH of the final compost and vermicompost for each treatment is shown in Table 3. The proportions of pelletized wheat straw in the mixtures resulted in lesser pH values during vermicomposting [36]. This was probably due to the high content of organic acids (e.g., succinic and maleic acid) and was directly proportional to the amount of straw in the treatments [36]. Other researchers [36,37,38,39] reported similar pH behaviors during the vermicomposting of sewage sludge, crop straw, municipal solid waste, and livestock manure. Gigliotti et al. [40] reported that the mineralization of organic matter generally leads to the release of ammonium and volatile ammonia, which increases pH levels. The release of low-molecular weight organic acids from organic decomposition, as well as the increase in nitrification may reduce the pH during vermicomposting [37]. The pH of the vermicompost might indicate that a more intense decomposition reaction occurs during vermicomposting than composting.
The EC value of compost was greater than that of the vermicompost made from the same raw materials and treatments (Table 3). The EC increased in all treatments, which could be explained by the release of bonded elements during earthworm digestion [41,42], as well as by the mineral release during organic matter decomposition in the form of cations in the vermicompost [43]. The final EC for all treatments was less than 2 dS/m [44], indicating that the vermicompost/compost was suitable for plant application. The increased EC during the vermicomposting processes is consistent with that of previous researchers [45,46] and is most likely due to organic matter degradation, which releases minerals such as exchangeable Ca, Mg, K, and P in the available forms, that is, in the form of cations in the vermicompost and compost [43].

3.3. Carbon Dioxide(CO2) and Methane(CH4) Emissions during Composting and Vermicomposting

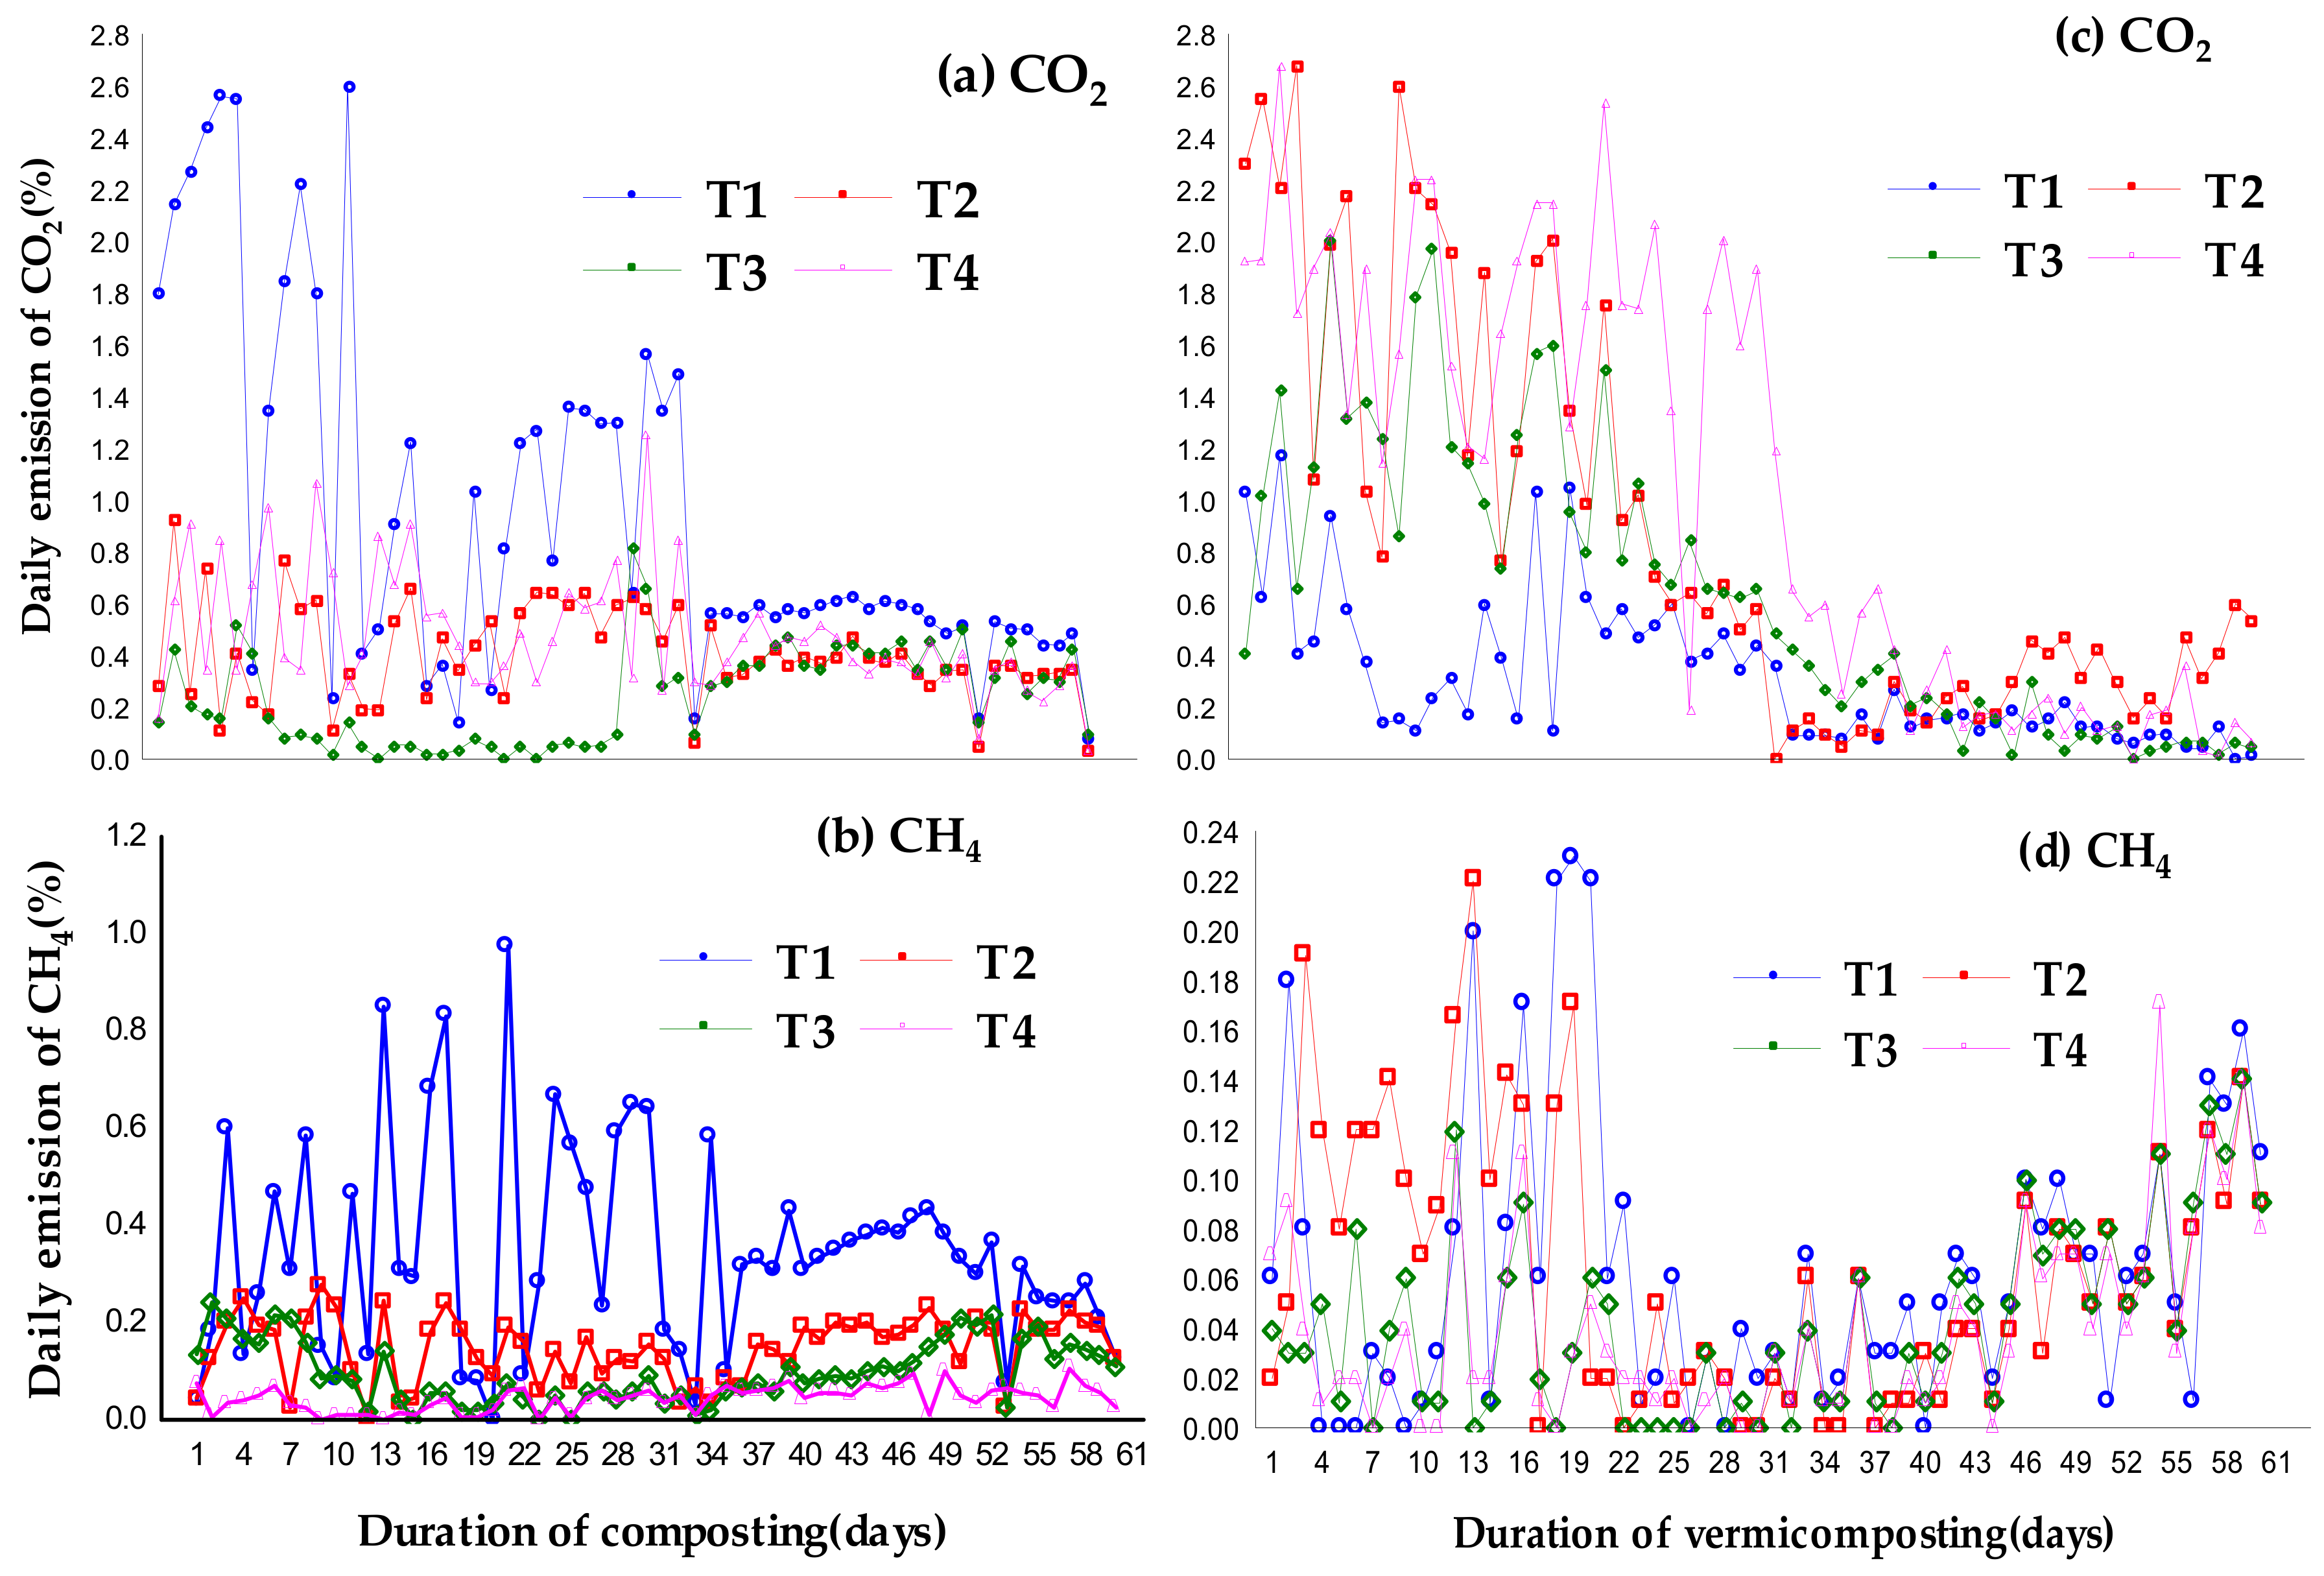
3.3.1. Carbon Dioxide (CO2)

The CO2 emissions increased at the start of the composting (Figure 2a) and vermicomposting (Figure 2c) due to the rapid decomposition of easily degradable organic matter, and then gradually decreased until the end of the composting/vermicomposting. This finding confirms those reported by Awasthi et al. [47] and Meng et al. [15] during sewage sludge composting. During the first 13 days of composting, CO2 emissions in the control (T1) were greater than in the other treatments (T2, T3, and T4). However, CO2 emissions were less in the T1 (control) during vermicomposting. As the earthworms inhibited microbial activity and reduced the readily available OM, this result was possible [48]. There were significant differences in CO2 (F = 36.1, p = 0.000) emissions among the treatments during the composting and vermicomposting CO2 (F = 13.8, p = 0.000). These findings imply that pelletized wheat straw may be lost in the inhibition after the thermophilic stage, most likely as a result of high-temperature self-degradation [49]. This conclusion is supported by the temperature and pH of T1, T2, T3, and T4. In all treatments, there was a significant decrease in CO2 emissions on day 14 and a minor peak on day 20 (Figure 2a). This finding could be attributed to the anaerobic environment created by the rapid decomposition of OM during the first 14 days. The anaerobic conditions were destroyed by the subsequent turn on day 10. Previous studies [47] on sewage sludge composting reported similar results, in which CO2 emissions were higher at the start of the composting period, with the highest levels observed on day 2, and then gradually decreased until the end of the thermophilic phase.

3.3.2. Methane (CH4)

The amount of CH4 produced by all the treatments used during the composting (Figure 2b) and vermicomposting (Figure 2d) processes are shown in Figure 2. There were significant differences in the CH4 (F = 73.9, p = 0.000) emitted during composting and the CH4 (F = 4.5, p = 0.004) emitted from all the treatments during vermicomposting. The CH4 concentrations in all the treatments peaked relatively early (within 1–3 weeks) in both the composting and vermicomposting processes, and then gradually declined until the experiment ended. As a result, it is reasonable to assume that the CH4 emissions occur at the beginning of the process. Several studies have discovered that the greatest levels of CH4 emissions occur at the beginning of the composting and vermicomposting processes [50]. CH4, a major GHG produced during composting and vermicomposting, significantly contributes to global warming. CH4 production is attributed to the methanogen deoxidization of CO2/H2 and acetic acid in the presence of low oxygen [51]. Following that, as the organic matter (OM) decomposed and oxygen was replenished through turning, the CH4 emissions of all the treatments fell sharply and remained lowered throughout the composting and vermicomposting maturation phases.
The observed pattern of CH4 emissions in this study is similar to the patterns reported by Ma et al. [52] and Wang et al. [53]. As microorganisms can rapidly degrade organics in the thermophilic phase, there is a dramatic reduction in O2 levels in the compost [54]. Composting emitted more CH4 than vermicomposting in all the treatments and the greater results were measured in the control area.
Total cumulative CO2 levels differed significantly (p < 0.001) by the composting method (Figure 3). Vermicomposting increased total cumulative CO2 emissions in comparison to thermophilic composting. Composting reduced total cumulative CH4 emissions (p < 0.001). When compared to thermophilic composting, vermicomposting reduced CH4 emissions by 74.5% from a high proportion of pelletized wheat straw T4 treatments.

3.4. Total Carbon(TC), Total Nitrogen(TN), and the C:N Ratio

The content of TC, TN, and C:N ratio for all the treatments is shown in Table 3. When compared to the initial treatments, the TC and C:N contents of both compost and vermicompost decreased. However, the TN content of both compost and vermicompost increased. The loss of ammonia volatilization at relatively high temperatures, combined with a pH unsuitable for nitrification and denitrification, resulted in an increase in TN content [55]. According to Zhang et al. [56], the increase in TN during sludge vermicomposting was due to worm activity. Composting and vermicomposting both reduced the C:N ratio for all the treatments. Considering that it reflects stabilization and mineralization rates during vermicomposting, the C:N ratio indicates the maturity of compost/vermicompost [57]. The C:N ratio is an important metric for determining whether the compost/vermicompost product has been thoroughly stabilized. Microorganisms decompose biodegradable components and convert them to CO2, H2O, and to other small molecules during the composting/vermicomposting process. However, the rate of loss for organic N is less than that for organic C, resulting in a decrease in the C:N ratio during the composting/vermicomposting process. In general, the C:N ratio of fully decomposed compost/vermicompost should be between 15 and 20 [58]. The C:N ratio of all mixtures in this study followed the same trend, with statistically significant differences between the two composting processes (Table 3). Previous research [59] found that vermicomposting cow dung with vegetable waste reduced the C:N ratio by up to 50.86% and 48.88%. The final C:N ratio recorded for all the treatments was less than 20, which is within the recommended value for soil applications [60].

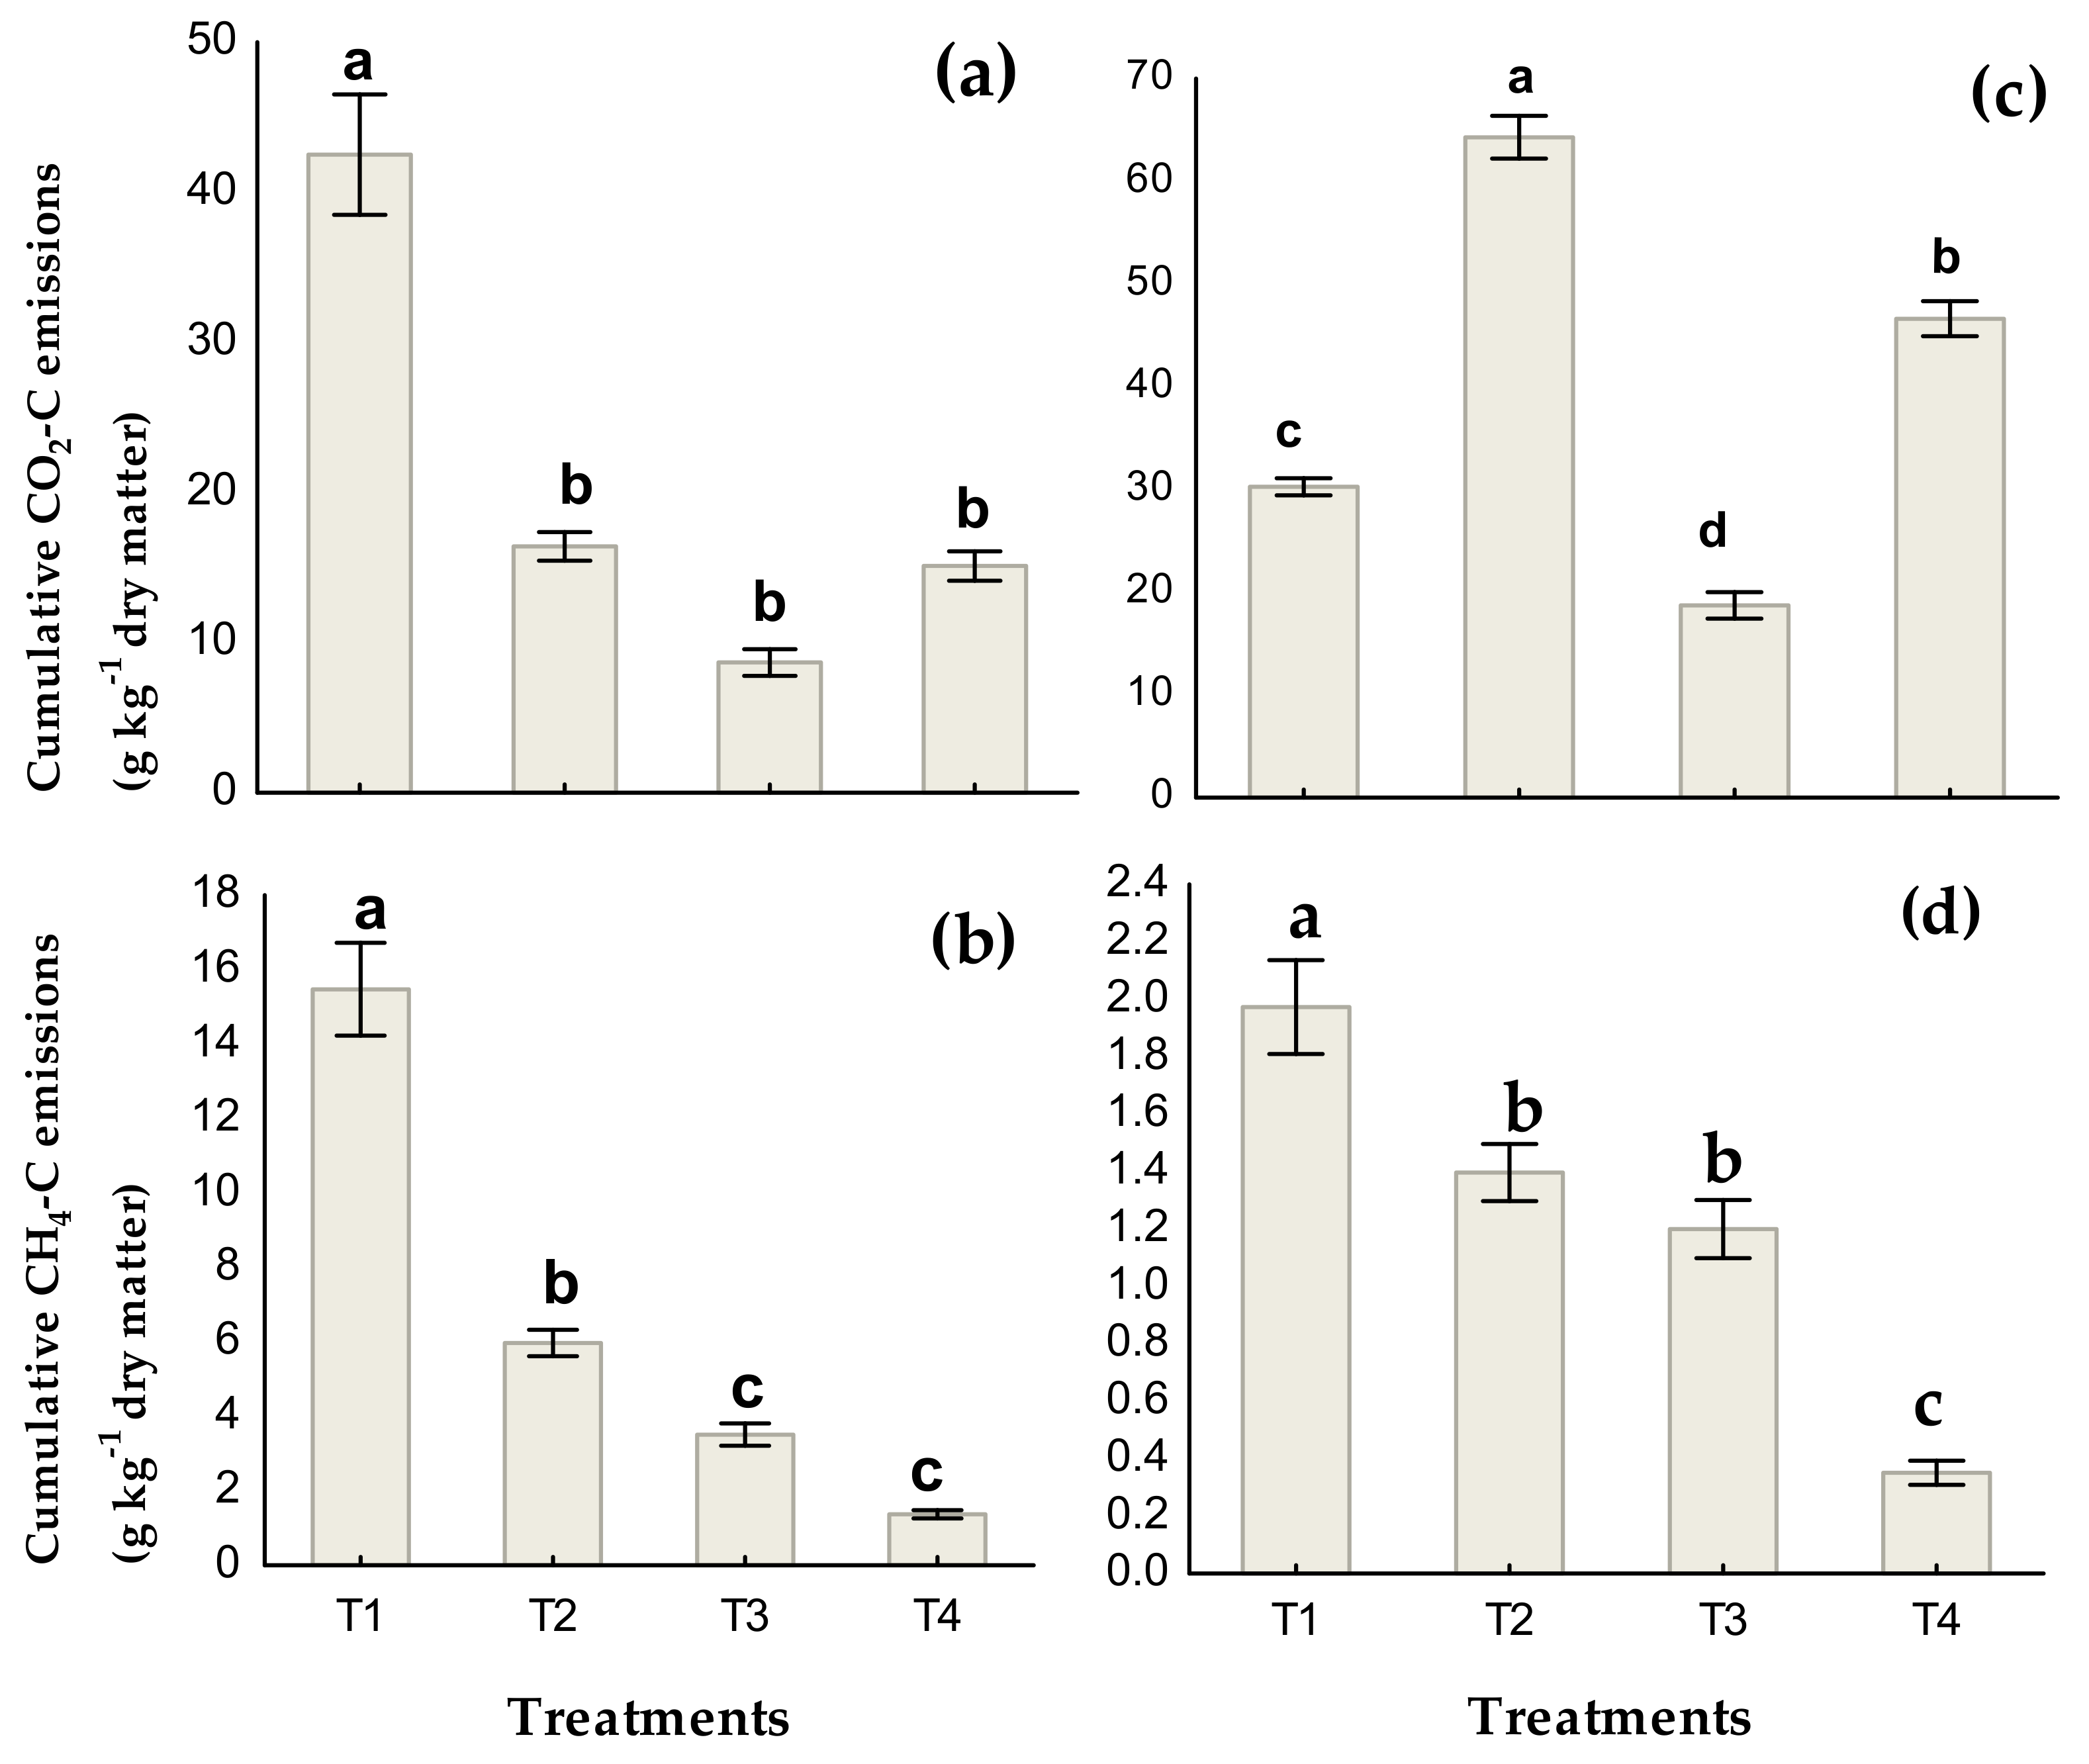
3.5. Carbon Balances

The mass balance analysis revealed that composting lost 5.54–10.42% of the total carbon across all treatments; total methane release accounted for 0.34–1.69%; and CO2 release accounted for 2.3–8.65%. However, vermicomposting lost 8.98–13.73% of the total carbon, with a total methane release of 0.1–0.6% and CO2 release of 5.03–11.61% of the initial total carbon (Table 4). These findings agree with those of Nigussie et al. [61] who demonstrated that organic carbon is lost during composting/vermicomposting. Thus, when compared to thermophilic composting, vermicomposting increased the total C loss by 3.3–3.5% (Table 4).
Earthworms decomposing organic matter [24]; earthworms mixing the substrate and increasing the accessibility of the materials for decomposers (e.g. Fungi, bacteria); and earthworm casts increasing the decomposition [62] all contributed to greater C loss after vermicomposting. Unaccounted C ranged from 0.11 to 5.69% during composting and 0.13 to 3.94% during vermicomposting, which is consistent with previous research [63,64]. Unaccounted C indicates that C was not measured between sampling dates [63] and C losses due to volatile compounds [64].

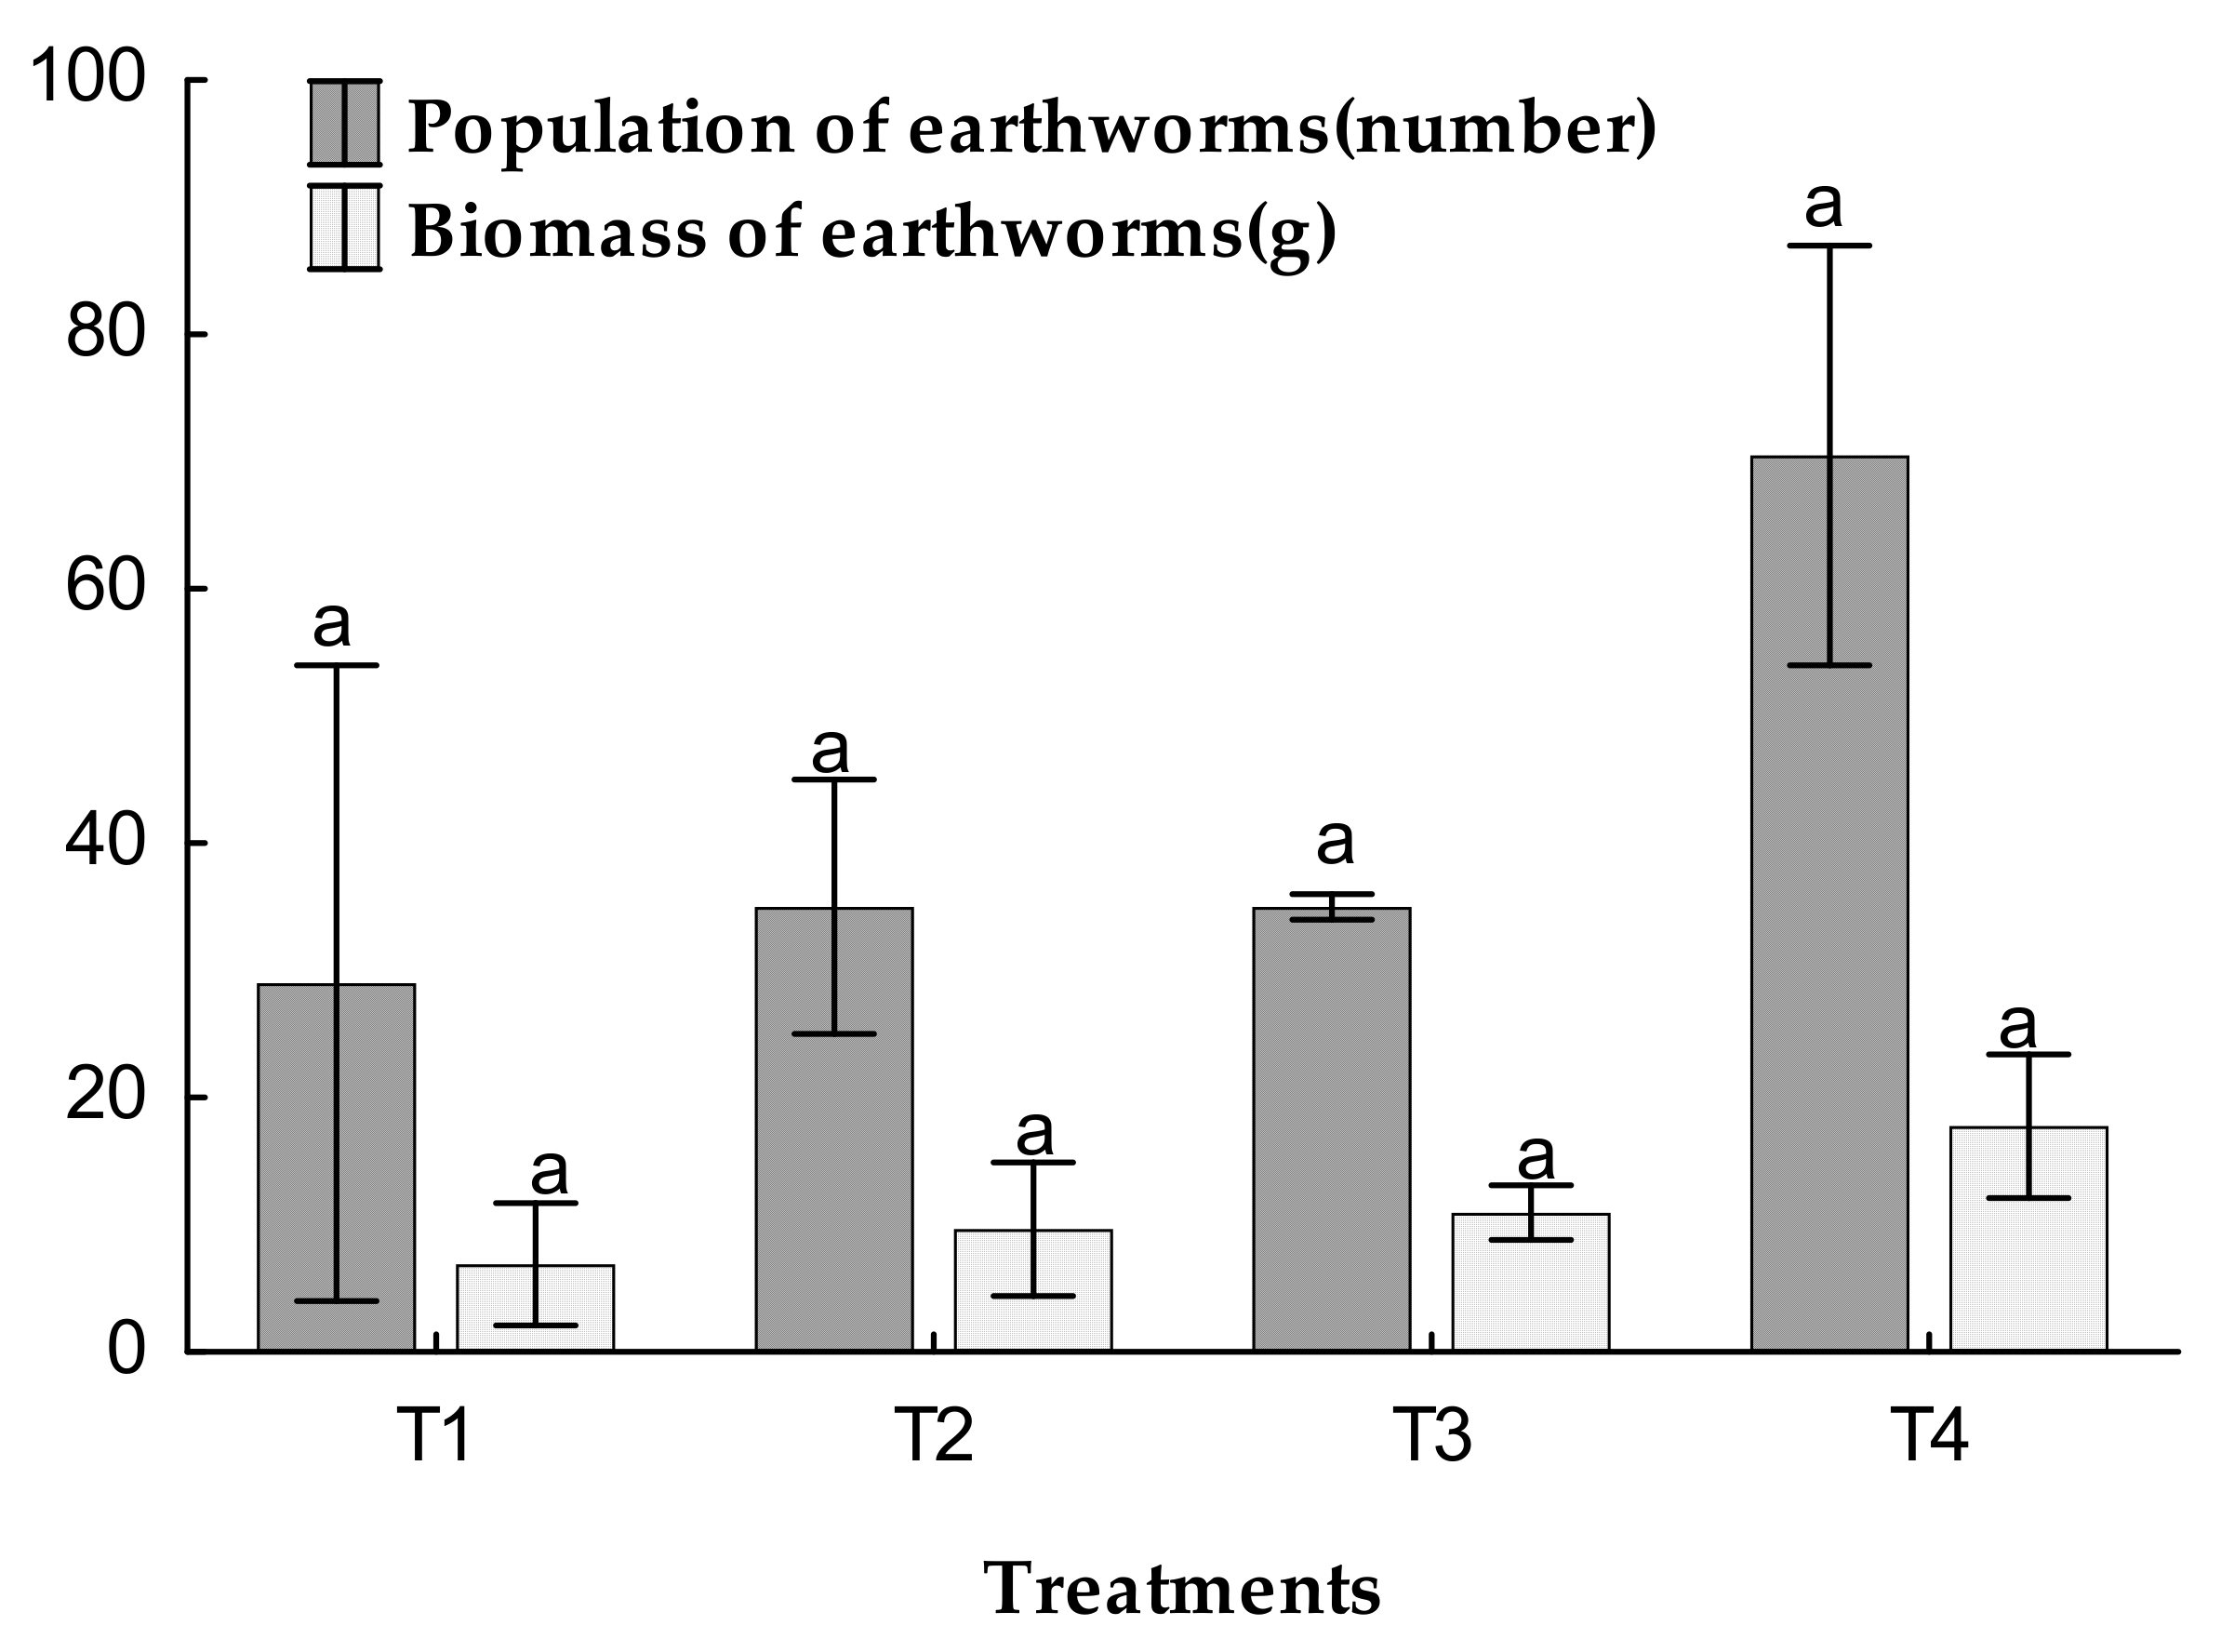
3.6. Population and Biomass of Earthworms

The population (number) and biomass of earthworms (g) in all the treatments are shown in Figure 4.
The substrate ratio (pelletized wheat straw) had no effect on the relative change of the earthworm biomass (p = 0.49) and population (p = 0.36). The earthworm biomass increased in mixtures containing a high percentage of pelletized wheat straw (T4). Increased earthworm abundance reduced CH4 emissions and accelerated the decomposition process. Vermicomposting increased CO2 emissions, implying that vermicompost is further along in its decomposition process than thermophilic compost. These findings are consistent with those of Nigussie et al. [61] who found that vermicomposting reduced CH4 while increasing CO2 emissions.

4. Conclusions

The composting and vermicomposting of sewage sludge produced significant amounts of CO2 (F = 36.1, p = 0.000) and CH4 (F = 73.9, p = 0.000), which were emitted during composting, and CO2 (F = 13.8, p = 0.000) and CH4 (F = 4.5, p = 0.004), which were emitted from all the treatments during vermicomposting. The greatest values were obtained at the start of the experiment and gradually decreased. The fate of C in the waste substrate is linked to the emission of CH4 and CO2 during composting and vermicomposting. Vermicomposting reduced CH4 emissions while also accelerating the decomposition process. CO2 and CH4 emissions were increased during composting at various proportions of added pelletized wheat straw. Vermicomposting increased CO2 emissions, implying that vermicompost is further along in its decomposition process. Vermicomposting significantly reduced CH4 emissions by 18–38%, while increasing CO2 emissions by 64–89%. The mixing agent (pelletized wheat) decreased CO2 emission by 60–70% and CH4 emission by 30–80% compared to control (0%). Increased earthworm abundance reduced CH4 emissions and increased CO2 emissions. The mass balance analysis indicated that 5.5–10.4% of carbon was lost by composting, methane release accounted for 0.34–1.69%, and CO2 release accounted for 2.3–8.65%. However, 8.98–13.7% of carbon was lost by vermicomposting with a methane release of 0.1–0.6% and CO2 release of 5.0–11.6% of C. Thus, when compared to thermophilic composting, vermicomposting increased the total C loss by 3.3–3.5%. This study demonstrated that depending on the target gas to be reduced, composting and vermicomposting, as well as a mixing agent (pelletized wheat straw), could be an option for reducing greenhouse gas emissions (i.e. CH4, CO2).

Author Contributions

Conceptualization, B.D., A.H. and P.S.; methodology, B.D., A.H. and P.S.; formal analysis, B.D., A.H. and P.S.; investigation, B.D.; resources, B.D., A.H. and P.S.; data curation, B.D., A.H. and P.S.; writing—original draft preparation, B.D., A.H. and P.S.; writing—review and editing, A.N.; visualization, B.D.; supervision, A.H. and P.S.; project administration, A.H.; funding acquisition, A.H.; sample and data collection, P.M. and A.D.C. All authors have read and agreed to the published version of the manuscript.

Funding

This research was funded by Ministry of Agriculture of the Czech Republic, grant number QK1910095.

Institutional Review Board Statement

Not applicable.

Informed Consent Statement

Not applicable.

Data Availability Statement

The corresponding author can provide the data used in this study upon request.

Acknowledgments

Financial support for this work was provided by the Ministry of Agriculture of the Czech Republic under the NAZV project number QK1910095. The authors would like to thank Christina Baker Starrman (https://cbsciedit.com/, accessed on 1 October 2021) for the revision of the English text.

Conflicts of Interest

The authors declare no conflict of interest.

References

  1. Hobson, A.M.; Frederickson, J.; Dise, N.B. CH4 and N2O from mechanically turned windrow and vermicomposting systems following in-vessel pre-treatment. Waste Manag. 2005, 25, 345–352. [Google Scholar] [CrossRef]
  2. Hoornweg, D.; Bhada-Tata, P.; Kennedy, C. Waste production must peak this century. Nature 2013, 502, 615–617. [Google Scholar] [CrossRef] [Green Version]
  3. Papageorgiou, A.; Barton, J.R.; Karagiannidis, A. Assessment of the greenhouse effect impact of technologies for energy recovery from municipal waste: A case for England. J. Environ. Manag. 2009, 90, 2999–3012. [Google Scholar] [CrossRef]
  4. Hoornweg, D.; Bhada-Tata, P. What a Waste: A Global Review of Solid Waste Management; World Bank: Washington, DC, USA, 2012. [Google Scholar]
  5. Baoyi, L.; Zhang, D.; Yuxue, C.; Fang, Y. Effects of C/N ratio and earthworms on greenhouse gas emissions during vermicomposting of sewage sludge. Bioresour. Technol. 2018, 268, 408–414. [Google Scholar]
  6. Zhang, J.Y.; Sui, Q.W.; Li, K.; Chen, M.X.; Tong, J.; Qi, L.; Wei, Y.S. Influence of natural zeolite and nitrification inhibitor on organics degradation and nitrogen transformation during sludge composting. Environ. Sci. Pollut. Res. 2016, 23, 1324–1334. [Google Scholar] [CrossRef]
  7. Li, X.W.; Dai, X.H.; Takahashi, J.; Li, N.; Jin, J.W.; Dai, L.L.; Dong, B. New insight into chemical changes of dissolved organic matter during anaerobic digestion of dewatered sewage sludge using EEM-PARAFAC and two-dimensional FTIR correlation spectroscopy. Bioresour. Technol. 2014, 159, 412–420. [Google Scholar] [CrossRef] [PubMed]
  8. Sadef, Y.; Poulsen, T.G.; Habib, K.; Iqbal, T.; Nizami, A.S. Uncertainty in degradation rates for organic micro-pollutants during full-scale sewage sludge composting. Waste Manag. 2016, 56, 396–402. [Google Scholar] [CrossRef]
  9. He, C.; Chen, C.L.; Giannis, A.; Yang, Y.; Wang, J.Y. Hydrothermal gasification of sewage sludge and model compounds for renewable hydrogen production: A review. Renew. Sust. Energ. Rev. 2014, 39, 1127–1142. [Google Scholar] [CrossRef]
  10. NBSC (National Bureau of Statistics of China). China Statistical Yearbook; China Statistics Press: Beijing, China, 2016. [Google Scholar]
  11. Jain, M.S.; Jambhulkar, R.; Kalamdhad, A.S. Biochar amendment for batch composting of nitrogen rich organic waste: Effect on degradation kinetics, composting physics and nutritional properties. Bioresour. Technol. 2018, 253, 204–213. [Google Scholar] [CrossRef]
  12. Wang, K.; Mao, H.L.; Li, X.K. Functional characteristics and influence factors of microbial community in sewage sludge composting with inorganic bulking agent. Bioresour. Technol. 2018, 249, 527–535. [Google Scholar] [CrossRef]
  13. Bridle, T.; Skrypski-Mantele, S. Assessment of sludge reuse options: A life cycle approach. Water Sci. Technol. 2000, 4, 131–135. [Google Scholar] [CrossRef]
  14. Yang, Z.; Zhou, X.; Xu, L. Eco-efficiency optimization for municipal solid waste management. J. Clean. Prod. 2015, 104, 242–249. [Google Scholar] [CrossRef]
  15. Meng, L.Q.; Zhang, S.M.; Gong, H.N.; Zhang, X.C.; Wu, C.D.; Li, W.G. Improving sewage sludge composting by addition of spent mushroom substrate and sucrose. Bioresour. Technol. 2018, 253, 197–203. [Google Scholar] [CrossRef] [PubMed]
  16. Zhang, C.S.; Xu, Y.; Zhao, M.H.; Rong, H.W.; Zhang, K.F. Influence of inoculating white-rot fungi on organic matter transformations and mobility of heavy metals in sewage sludge based composting. J. Hazard. Mater. 2018, 344, 163–168. [Google Scholar] [CrossRef]
  17. Santos, C.; Goufo, P.; Fonseca, J.; Pereira, J.L.S.; Ferreira, L.; Coutinho, J.; Trindade, H. Effect of lignocellulosic and phenolic compounds on ammonia, nitric oxide and greenhouse gas emissions during composting. J. Clean. Prod. 2018, 171, 548–556. [Google Scholar] [CrossRef]
  18. Wang, X.; Selvam, A.; Lau, S.; Wong, J. Influence of lime and struvite on microbial community succession and odour emission during food waste composting. Bioresour. Technol. 2018, 247, 652–659. [Google Scholar] [CrossRef] [PubMed]
  19. Awasthi, M.K.; Wang, Q.; Awasthi, S.K.; Wang, M.J.; Chen, H.Y.; Ren, X.N.; Zhao, J.C.; Zhang, Z.Q. Influence of medical stone amendment on gaseous emissions, microbial biomass and abundance of ammonia oxidizing bacteria genes during biosolids composting. Bioresour. Technol. 2018, 247, 970–979. [Google Scholar] [CrossRef] [PubMed]
  20. Ermolaev, E.; Sundberg, C.; Pell, M.; Jönsson, H. Greenhouse gas emissions from home composting in practice. Bioresour. Technol. 2014, 151, 174–182. [Google Scholar] [CrossRef]
  21. IPCC. Climate Change. Mitigation of Climate Change; Cambridge University Press: Cambridge, UK, 2014. [Google Scholar]
  22. Awasthi, M.K.; Wang, Q.; Chen, H.Y.; Wang, M.J.; Awasthi, S.K.; Ren, X.N.; Cai, H.Z.; Li, R.H.; Zhang, Z.Q. In-vessel co-composting of biosolid: Focusing on mitigation of greenhouse gases emissions and nutrients conservation. Renew. Energy 2018, 129, 814–823. [Google Scholar] [CrossRef]
  23. Sanchez, A.; Artola, A.; Font, X.; Gea, T.; Barrena, R.; Gabriel, D.; Sanchez-Monedero, M.A.; Roig, A.; Cayuela, M.L.; Mondini, C. Greenhouse gas emissions from organic waste composting. Environ. Chem. Lett. 2015, 13, 223–238. [Google Scholar] [CrossRef] [Green Version]
  24. Lubbers, I.M.; van Groenigen, K.J.; Fonte, S.J.; Six, J.; Brussaard, L.; van Groenigen, J.W. Greenhouse gas emissions from soils increased by earthworms. Nat. Clim. Chang. 2013, 3, 187–194. [Google Scholar] [CrossRef]
  25. Chapuis-Lardy, L.; Brauman, A.; Bernard, L.; Pablo, A.L.; Toucet, J.; Mano, M.J.; Weber, L.; Brunet, D.; Razafimbelo, T.; Chotte, J.L.; et al. Effect of the endogeic earthworm Pontoscolex corethrurus on the microbial structure and activity related to CO2 and N2O fluxes from a tropical soil (Madagascar). Appl. Soil Ecol. 2010, 45, 201–208. [Google Scholar] [CrossRef]
  26. Speratti, A.B.; Whalen, J.K. Carbon dioxide and nitrous oxide fluxes from soil as influenced by anecic and endogeic earthworms. Appl. Soil Ecol. 2008, 38, 27–33. [Google Scholar] [CrossRef]
  27. Chan, Y.C.; Sinha, R.K.; Wang, W. Emission of greenhouse gases from home aerobic composting, anaerobic digestion and vermicomposting of household wastes in Brisbane, Australia. Waste Manag. Res. 2011, 29, 540–548. [Google Scholar] [CrossRef] [PubMed] [Green Version]
  28. Sun, W.; Deng, L.; Wu, G.; Wu, L.; Han, P.; Miao, Y.; Yao, B. Atmospheric monitoring of methane in Beijing using a mobile observatory. Atmosphere 2019, 10, 554. [Google Scholar] [CrossRef] [Green Version]
  29. Belikov, D.; Arshinov, M.; Belan, B.; Davydov, D.; Fofonov, A.; Sasakawa, M.; Machida, T. Analysis of the diurnal, weekly, and seasonal cycles and annual trends in atmospheric CO2 and CH4 at Tower Network in Siberia from 2005 to 2016. Atmosphere 2019, 10, 689. [Google Scholar] [CrossRef] [Green Version]
  30. Bradley, R.L.; Chroňáková, A.; Elhottová, D.; Šimek, M. Interactions between land-use history and earthworms control gross rates of soil methane production in an overwintering pasture. Soil Biol Biochem. 2012, 53, 64–71. [Google Scholar] [CrossRef]
  31. Wang, J.; Zhang, X.; Xiong, Z. Methane emissions from a rice agroecosystem in South China: Effects of water regime, straw incorporation and nitrogen fertilizer. Nutr. Cycl. Agroecosyst. 2012, 93, 103–112. [Google Scholar] [CrossRef]
  32. BSI EN 15933. Sludge, Treated Biowaste and Soil Determination of pH; The British Standards Institution: London, UK, 2012.
  33. Hanc, A.; Castkova, T.; Kuzel, S.; Cajthaml, T. Dynamics of a vertical-flow windrow vermicomposting system. Waste Manag. Res. 2017, 35, 1121–1128. [Google Scholar] [CrossRef]
  34. Wu, H.P.; Lai, C.; Zeng, G.M.; Liang, J.; Chen, J.; Xu, J.J.; Dai, J.; Li, X.D.; Liu, J.F.; Chen, M.; et al. The interactions of composting and biochar and their implications for soil amendment and pollution remediation: A review. Crit. Rev. Biotechnol. 2017, 37, 754–764. [Google Scholar] [CrossRef]
  35. Sinha, R.K.; Herat, S.; Agarwal, S.; Asadi, R.; Carretero, E. Vermiculture technology for environmental management: Study of action of earthworms Elsinia foetida, Eudrilus euginae and Perionyx excavatus on biodegradation of some community wastes in India and Australia. Environmentalist 2002, 22, 261–268. [Google Scholar] [CrossRef] [Green Version]
  36. Wang, J.; Hu, Z.; Xu, X.; Jiang, X.; Zheng, B.; Liu, X.; Pan, X.; Kardol, P. Emissions of ammonia and greenhouse gases during combined pre-composting and vermicomposting of duck manure. Waste Manag. 2014, 34, 1546–1552. [Google Scholar] [CrossRef]
  37. Sharma, K.; Garg, V. Comparative analysis of vermicompost quality produced from rice straw and paper waste employing earthworm Eisenia fetida (Sav.). Bioresour. Technol. 2018, 250, 708–715. [Google Scholar] [CrossRef]
  38. Balachandar, R.; Baskaran, L.; Yuvaraj, A.; Thangaraj, R.; Subbaiya, R.; Ravindran, B.; Chang, S.W.; Karmegam, N. Enriched pressmud vermicompost production with green manure plants using Eudrilus eugeniae. Bioresour. Technol. 2020, 299, 122578. [Google Scholar] [CrossRef] [PubMed]
  39. Suthar, S. Pilot-scale vermireactors for sewage sludge stabilization and metal remediation process: Comparison with small-scale vermireactors. Ecol. Eng. 2010, 36, 703–712. [Google Scholar] [CrossRef]
  40. Gigliotti, G.; Proietti, P.; Said-Pullicino, D.; Nasini, L.; Pezzolla, D.; Rosati, L.; Porceddu, P.R. Co-composting of olive husks with high moisture contents: Organic matter dynamics and compost quality. Int. Biodeterior. 2012, 67, 8–14. [Google Scholar] [CrossRef]
  41. He, X.; Zhang, Y.; Shen, M.; Zeng, G.; Zhou, M.; Li, M. Effect of vermicomposting on concentration and speciation of heavy metals in sewage sludge with additive materials. Bioresour. Technol. 2016, 218, 867–873. [Google Scholar] [CrossRef] [PubMed]
  42. Garg, P.; Gupta, A.; Satya, S. Vermicomposting of different types of waste using Eisenia foetida: A comparative study. Bioresour. Technol. 2006, 97, 391–395. [Google Scholar] [CrossRef]
  43. Tognetti, C.; Laos, F.; Mazzarino, M.J.; Hernandez, M.T. Composting vs. vermicomposting: A comparison of end product quality. Comp. Sci. Util. 2005, 13, 6–13. [Google Scholar] [CrossRef]
  44. El-Haddad, M.E.; Zayed, M.S.; El-Sayed, G.A.M.; Hassanein, M.K.; El-Satar, A.M.A. Evaluation of compost, vermicompost and their teas produced from rice straw as affected by addition of different supplements. Ann. Agric. Sci. 2014, 59, 243–251. [Google Scholar] [CrossRef] [Green Version]
  45. Ramnarain, Y.I.; Ansari, A.A.; Ori, L. Vermicomposting of different organic materials using the epigeic earthworm Eisenia foetida. Int. J. Recycl. Org. Waste Agric. 2019, 8, 23–36. [Google Scholar] [CrossRef] [Green Version]
  46. Jadia, C.D.; Fulekar, M.H. Vermicomposting of vegetable wastes: A biophysicochemical process based on hydro-operating bioreactor. Afr. J. Biotechnol. 2008, 7, 3723–3730. [Google Scholar]
  47. Awasthi, M.K.; Wang, Q.; Huang, H.; Li, R.; Shen, F.; Lahori, A.H.; Wang, P.; Guo, D.; Guo, Z.; Jiang, S.; et al. Effect of biochar amendment on greenhouse gas emission and bio-availability of heavy metals during sewage sludge cocomposting. J. Clean Prod. 2016, 135, 829–835. [Google Scholar] [CrossRef]
  48. Lleó, T.; Albacete, E.; Barrena, R.; Font, X.; Artola, A.; Sánchez, A. Home and vermicomposting as sustainable options for biowaste management. J. Clean. Prod. 2013, 47, 70–76. [Google Scholar] [CrossRef] [Green Version]
  49. Jiang, T.; Ma, X.G.; Tang, Q.; Yang, J.; Li, G.X.; Schuchardt, F. Combined use of nitrification inhibitor and struvite crystallization to reduce the NH3 and N2O emissions during composting. Bioresour. Technol. 2016, 217, 210–218. [Google Scholar] [CrossRef]
  50. Santos, C.; Fonseca, J.; Aires, A.; Coutinho, J.; Trindade, H. Effect of different rates of spent coffee grounds (SCG) on composting process, gaseous emissions and quality of end-product. Waste Manag. 2017, 59, 37–47. [Google Scholar] [CrossRef]
  51. Bustamante, M.A.; Restrepo, A.P.; Alburquerque, J.A.; Pérez-Murcia, M.D.; Paredes, C.; Moral, R.; Bernal, M.P. Recycling of anaerobic digestates by composting: Effect of the bulking agent used. J. Clean. Prod. 2013, 47, 61–69. [Google Scholar] [CrossRef]
  52. Ma, S.; Fang, C.; Sun, X.; Han, L.; He, X.; Huang, G. Bacterial community succession during pig manure and wheat straw aerobic composting covered with a semi-permeable membrane under slight positive pressure. Bioresour. Technol. 2018, 259, 221–227. [Google Scholar] [CrossRef] [PubMed]
  53. Wang, Q.; Awasthi, M.K.; Ren, X.N.; Zhao, J.C.; Li, R.H.; Wang, Z.; Wang, M.J.; Chen, H.Y.; Zhang, Z.Q. Combining biochar, zeolite and wood vinegar for composting of pig manure: The effect on greenhouse gas emission and N conservation. Waste Manag. 2018, 74, 221–223. [Google Scholar] [CrossRef] [PubMed]
  54. Manios, T.; Maniadakis, K.; Boutzakis, P.; Naziridis, Y.; Lasaridi, K.; Markakis, G.; Stentiford, E.I. Methane and carbon dioxide emission in a two-phase olive oil mill sludge windrow pile during composting. Waste Manag. 2007, 27, 1092–1098. [Google Scholar] [CrossRef] [PubMed]
  55. Awasthi, M.K.; Wang, M.J.; Chen, H.Y.; Wang, Q.; Zhao, J.C.; Ren, X.N.; Li, D.S.; Awasthi, S.K.; Shen, F.; Li, R.H.; et al. Heterogeneity of biochar amendment to improve the carbon and nitrogen sequestration through reduce the greenhouse gases emissions during sewage sludge composting. Bioresour. Technol. 2017, 224, 428–438. [Google Scholar] [CrossRef]
  56. Zhang, J.; Sugir, M.E.; Li, Y.; Yuan, L.; Zhou, M.; Lv, P.; Yu, Z.; Wang, L.; Zhou, D. Effects of vermicomposting on the main chemical properties and bioavailability of Cd/Zn in pure sludge. Environ. Sci. Pollut. Res. 2019, 26, 20949–20960. [Google Scholar] [CrossRef] [PubMed]
  57. Srivastava, V.; Goel, G.; Thakur, V.K.; Singh, R.P.; Ferreira de Araujo, A.S.; Singh, P. Analysis and advanced characterization of municipal solid waste vermicompost maturity for a green environment. J. Environ. Manag. 2020, 255, 109914. [Google Scholar] [CrossRef]
  58. Moharana, P.C.; Biswas, D.R. Assessment of maturity indices of rock phosphate enriched composts using variable crop residues. Bioresour. Technol. 2016, 222, 1–13. [Google Scholar] [CrossRef]
  59. Biruntha, M.; Karmegam, N.; Archana, J.; Karunai Selvi, B.; John Paul, J.A.; Balamuralikrishnan, B.; Chang, S.W.; Ravindran, B. Vermiconversion of biowastes with low-to-high C/N ratio into value added vermicompost. Bioresour. Technol. 2020, 297, 122398. [Google Scholar] [CrossRef]
  60. Esmaeili, A.; Khoram, M.R.; Gholami, M.; Eslami, H. Pistachio waste management using combined composting-vermicomposting technique: Physico-chemical changes and worm growth analysis. J. Clean. Prod. 2020, 242, 118523. [Google Scholar] [CrossRef]
  61. Nigussie, A.; Kuyper, T.W.; Bruun, S.; De, N.A. Vermicomposting as a technology for reducing nitrogen losses and greenhouse gas emissions from small-scale composting. J. Clean. Prod. 2016, 139, 429–439. [Google Scholar] [CrossRef]
  62. Sierra, J.; Desfontaines, L.; Faverial, J.; Loranger-Merciris, G.; Boval, M. Composting and vermicomposting of cattle manure and green wastes under tropical conditions: Carbon and nutrient balances and end-product quality. Soil Res. 2013, 51, 142–151. [Google Scholar] [CrossRef]
  63. Chowdhury, M.A.; de Neergaard, A.; Jensen, L.S. Potential of aeration flow rate and bio-char addition to reduce greenhouse gas and ammonia emissions during manure composting. Chemosphere 2014, 97, 16–25. [Google Scholar] [CrossRef] [PubMed]
  64. Vu, Q.D.; de Neergaard, A.; Tran, T.D.; Hoang, H.T.T.; Vu, V.H.K.; Jensen, L.S. Greenhouse gas emissions from passive composting of manure and digestate with crop residues and biochar on small-scale livestock farms in Vietnam. Environ. Technol. 2015, 36, 2925–2934. [Google Scholar] [CrossRef]
Figure 1. Evolution of temperatures during the composting (a) and vermicomposting (b) processes.
Atmosphere 12 01380 g001aAtmosphere 12 01380 g001b
Figure 2. Daily emissions of CO2 and CH4 during composting (a,b) and vermicomposting (c,d).
Atmosphere 12 01380 g002
Figure 3. Total cumulative emissions of CO2-C (a) and CH4-C (b) after 60 days of composting, and CO2-C (c) and CH4-C (d) during vermicomposting. The bars indicate the standard error of the mean (n = 3). Different letters indicate significant differences among the treatments (p < 0.05).
Atmosphere 12 01380 g003
Figure 4. Population (number) and biomass of earthworms (g) after 60 days of vermicomposting. Bars indicate the standard error of the mean (n = 3).
Atmosphere 12 01380 g004
Table 1. Selected chemical properties of the sewage sludge and pelletized wheat straw.
ParametersSewage Sludge (SS)Pelletized Wheat Straw (PWS)
pH6.99 ± 0.0178.30 ± 0.300
EC (mS/cm)0.617 ± 0.0640.680 ± 0.040
TC (%)32.95 ± 0.15042.6 ± 0.207
TN (%)5.36 ± 0.0170.8 ± 0.069
C:N6.15 ± 0.01153.2 ± 4.388
Values indicate mean ± standard error (n = 3).
Table 2. Selected chemical properties of the treatments on the initial day (day 0).
TreatmentspHEC(mS/cm)TC (%)TN (%)C:N
T16.99 ± 0.0170.617 ± 0.06432.9 ± 0.1505.36 ± 0.0176.15 ± 0.023
T27.32 ± 0.0640.633 ± 0.04635.36 ± 0.1331.98 ± 0.12118.03 ± 1.11
T37.64 ± 0.1440.649 ± 0.03537.77 ± 0.1391.34 ± 0.04028.17 ± 0.826
T47.97 ± 0.2190.664 ± 0.02940.18 ± 0.1671.05 ± 0.02938.36 ± 1.172
T1= 100% SS; T2= 75% SS + 25 % PWS; T3= 50 % SS + 50 % PWS; and T4 =25 % SS + 75 % PWS (w/w). Values indicate mean ± standard error (n = 3).
Table 3. Selected chemical properties of the end-product compost and vermicompost.
Composting MethodTreatmentspHEC (mS/cm)TC (%)TN (%)C:N
CompostingT18.4 ± 0.0691.90 ± 0.09829.52 ± 0.4214.55 ± 0.0816.50 ± 0.012
T28.3 ± 0.0521.43 ± 0.05232.43 ± 0.4563.69 ± 0.0178.84 ± 0.185
T38.4 ± 0.0461.94 ± 0.08134.45 ± 0.8833.27 ± 0.02910.57 ± 0.375
T48.0 ± 0.0350.80 ± 0.03537.95 ± 0.0122.76 ± 0.08713.88 ± 0.462
VermicompostingT16.7 ± 0.6700.644 ± 0.02328.43 ± 0.1854.22 ± 0.1276.77 ± 0.150
T26.5 ± 0.8661.186 ± 0.12731.96 ± 0.5143.58 ± 0.0238.94 ± 0.202
T36.5 ± 0.0810.802 ± 0.22534.38 ± 0.6522.95 ± 0.08711.72 ± 0.537
T46.6 ± 0.1791.21 ± 0.06935.32 ± 0.2143.08 ± 0.03512.15 ± 0.185
T1= 100% SS; T2= 75% SS + 25 % PWS; T3= 50 % SS + 50% PWS; and T4 =25 % SS + 75 % PWS (w/w). The values indicate mean ± standard error (n = 3).
Table 4. Carbon loss (CH4-C and CO2-C) during composting and vermicomposting.
Total C Emission during Composting
TrtsInitial C
(g kg−1)
Ending C
(g kg−1)
CH4-C
(g kg−1)
CO2-C
(g kg−1)
C Loss
(%)
CH4-C Loss
(%)
CO2-C
Loss (%)
Unaccounted
C (%)
T1329.53295.25.4828.5110.421.668.650.11
T2353.62324.385.9716.428.291.694.641.96
T3377.703443.518.688.920.932.305.69
T4401.78379.51.3715.115.540.343.761.44
Total C Emission during Vermicomposting
TrtsInitial C
(g kg−1)
Ending C
(g kg−1)
CH4-C
(g kg−1)
CO2-C
(g kg−1)
C Loss
(%)
CH4 -C Loss (%)
CO2-C
Loss (%)
Unaccounted
C (%)
T1329.53284.31.9730.2813.730.609.193.94
T2353.62305.60.3544.3113.580.112.530.95
T3377.70343.81.2018.738.980.325.033.63
T4401.78353.21.4046.6412.090.3511.610.13
T1= 100% SS; T2= 75% SS + 25 % PWS); T3= 50% SS + 50 % PWS; and T4 =25 % SS + 75 % PWS (w/w).
Publisher’s Note: MDPI stays neutral with regard to jurisdictional claims in published maps and institutional affiliations.

