Article

Comparison of PM10 Sources at Traffic and Urban Background Sites Based on Elemental, Chemical and Isotopic Composition: Case Study from Krakow, Southern Poland

1
Faculty of Physics and Applied Computer Science, AGH University of Science and Technology, Al. Mickiewicza 30, 30-059 Krakow, Poland
2
Faculty of Energy and Fuels, AGH University of Science and Technology, Al. Mickiewicza 30, 30-059 Krakow, Poland
3
TU Wien, Institute of Chemical Technologies and Analytics, Getreidemarkt 9, 1060 Vienna, Austria
*
Author to whom correspondence should be addressed.
Atmosphere 2021, 12(10), 1364; https://doi.org/10.3390/atmos12101364
Submission received: 13 September 2021 / Revised: 11 October 2021 / Accepted: 15 October 2021 / Published: 19 October 2021
(This article belongs to the Special Issue Air Quality in Poland)

Abstract

:
In large urban agglomerations, car traffic is one of the main sources of particulate matter. It consists of particulate matter directly generated in the process of incomplete liquid fuel burning in vehicle engine, secondary aerosols formed from exhaust gaseous pollutants (NOx, SO2) as well as products of tires, brake pads and pavement abrasion. Krakow is one of the cities in Europe with the highest concentrations of particulate matter. The article presents the results of combined elemental, chemical and isotopic analyses of particulate matter PM10 at two contrasting urban environments during winter and summer seasons. Daily PM10 samples were collected during the summer and winter seasons of 2018/2019 at two stations belonging to the network monitoring air quality in the city. Mean PM10 concentrations at traffic-dominated stations were equal to 35 ± 7 µg/m3 and 76 ± 28 µg/m3 in summer and winter, respectively, to be compared with 25.6 ± 5.7 µg/m3 and 51 ± 25 µg/m3 in summer and winter, respectively, recorded at the urban background station. The source attribution of analyzed PM10 samples was carried out using two modeling approaches: (i) The Positive Matrix Factorization (PMF) method for elemental and chemical composition (concentrations of elements, ions, as well as organic and elemental carbon in daily PM10 samples), and (ii) Isotope Mass Balance (IMB) for 13C and 14C carbon isotope composition of carbonaceous fraction of PM10. For PMF application, five sources of particulate matter were identified for each station: fossil fuel combustion, secondary inorganic aerosols, traffic exhaust, soil, and the fifth source which included road dust, industry, construction work. The IMB method allowed the partitioning of the total carbon reservoir of PM10 into carbon originating from coal combustion, from biogenic sources (natural emissions and biomass burning) and from traffic. Both apportionment methods were applied together for the first time in the Krakow agglomeration and they gave consistent results.

1. Introduction

Air pollution affects the quality of life of more than a half of the global population living in cities and urban agglomerations. Particulate Matter (PM) has adverse effects on human health and climate [1,2,3]. Studies identifying sources of air pollution in the cities can help local governments and decision-makers in designing and implementing strategies to combat atmospheric pollution and improve air quality. In many cities in Poland, the level of PM10 (particles of an aerodynamic diameter lower than 10 µm) concentrations exceed limit values imposed by the European Union and National regulations [4,5]. The European Environment Agency recently published a ranking list of air quality in 323 European cities during the period 2019–2020 (https://www.eea.europa.eu/themes/air/urban-air-quality/european-city-air-quality-viewer accessed on 7 September 2021) where, among ten cities with the poorest air quality, five Polish cities are listed.
Krakow is located in southern Poland in the Vistula river valley and is surrounded by hilly terrain. Frequent temperature inversions and low wind speed within the city favor accumulation of pollutants in the local atmosphere. The main recognized pollution sources in the city are the combustion of fossil fuels for heating purposes and transport, as well as secondary inorganic aerosols. Under the transport category, the emissions from vehicles and the resuspension of dust are considered. A dedicated air quality monitoring network operates within the city limits [6,7]. Figure 1A shows the evolution of PM10 concentrations at three network stations over the past decade (2010–2019). The stations represent traffic-dominated and urban-background environments. A clear decreasing trend of the PM10 load of the local atmosphere over the past decade can be observed: annual averages of PM10 levels dropped by ca. 50% over this period. The number of days per year with an exceedance of the limit concentration of PM10 also decreased by a similar percentage. According to the GIOS report from 2014 [6], the level of metals (As, Cd, Ni, Pb) in the air was below the limit values and the Krakow agglomeration was classified as class 1 (the highest pollution concentrations in zone are below the bottom of the assessment threshold). Indicator measurements and mathematical modeling may be sufficient for zone classification. Intensive measurements (1 h measurements for every day) at the monitoring stations in the city are required for NO2 (Class 3b—the highest pollution concentrations in the zone are above the top assessment threshold and simultaneously above the limit value). At the Aleje Krasinskiego monitoring station, the measurement of NO2 was performed and the results are included in Figure 1C. NO2 is an indicator of traffic. As can be seen from Figure 1C, a 30% reduction of NO2 concentration was observed during the years 2010 and 2019. Intensive measurements at the monitoring stations are also required for SO2, connected with information from other sources such as mathematical modeling and indicative measurements (Class 2—Highest pollution concentrations in the zone are between the top and the lower assessment threshold). For the AK station, there are no such measurements during the decade 2010–2019. Benzo(a)piren is an indicator of coal combustion and in Figure 1B, the concentration of Benzo(a)piren during the decade 2010–2019 is presented at the Kurdwanow monitoring station. As can be seen, a 49% reduction of the Benzo(a)piren concentration at Kurdwanow monitoring station was recorded in the years 2010–2019.
The improvement of air quality in the city can be attributed to a number of factors such as the gradual replacement of old, diesel-powered buses by electric, hybrid, or Euro-6 compliant vehicles and numerous initiatives of the city council aimed at reducing the consumption of coal for heating purposes and expanding the network of the central heating system. The last radical decision of the local authorities was the total ban on the combustion of solid fuels in the city, which entered into force in September 2019. However, still, the concentrations of PM10 in the Krakow atmosphere often exceed 50 µg/m3, particularly in the cold season.
The main aim of the presented study was the assessment of the spatial heterogeneity of PM10 levels within the city limits and the identification of sources of PM10 for two contrasting regions in the city (the traffic-dominated area and the residential district) using the PMF method. As well as the elemental and chemical composition of the collected PM10 samples, typically used in PMF modelling, the carbonaceous fraction of PM10 samples has also been analyzed: organic (OC) and elemental carbon (EC) concentrations were determined. In addition, the carbon isotopic composition (13C and 14C content) of the total carbon reservoir in the PM10 samples has been analyzed.

2. Materials and Methods

2.1. Sampling

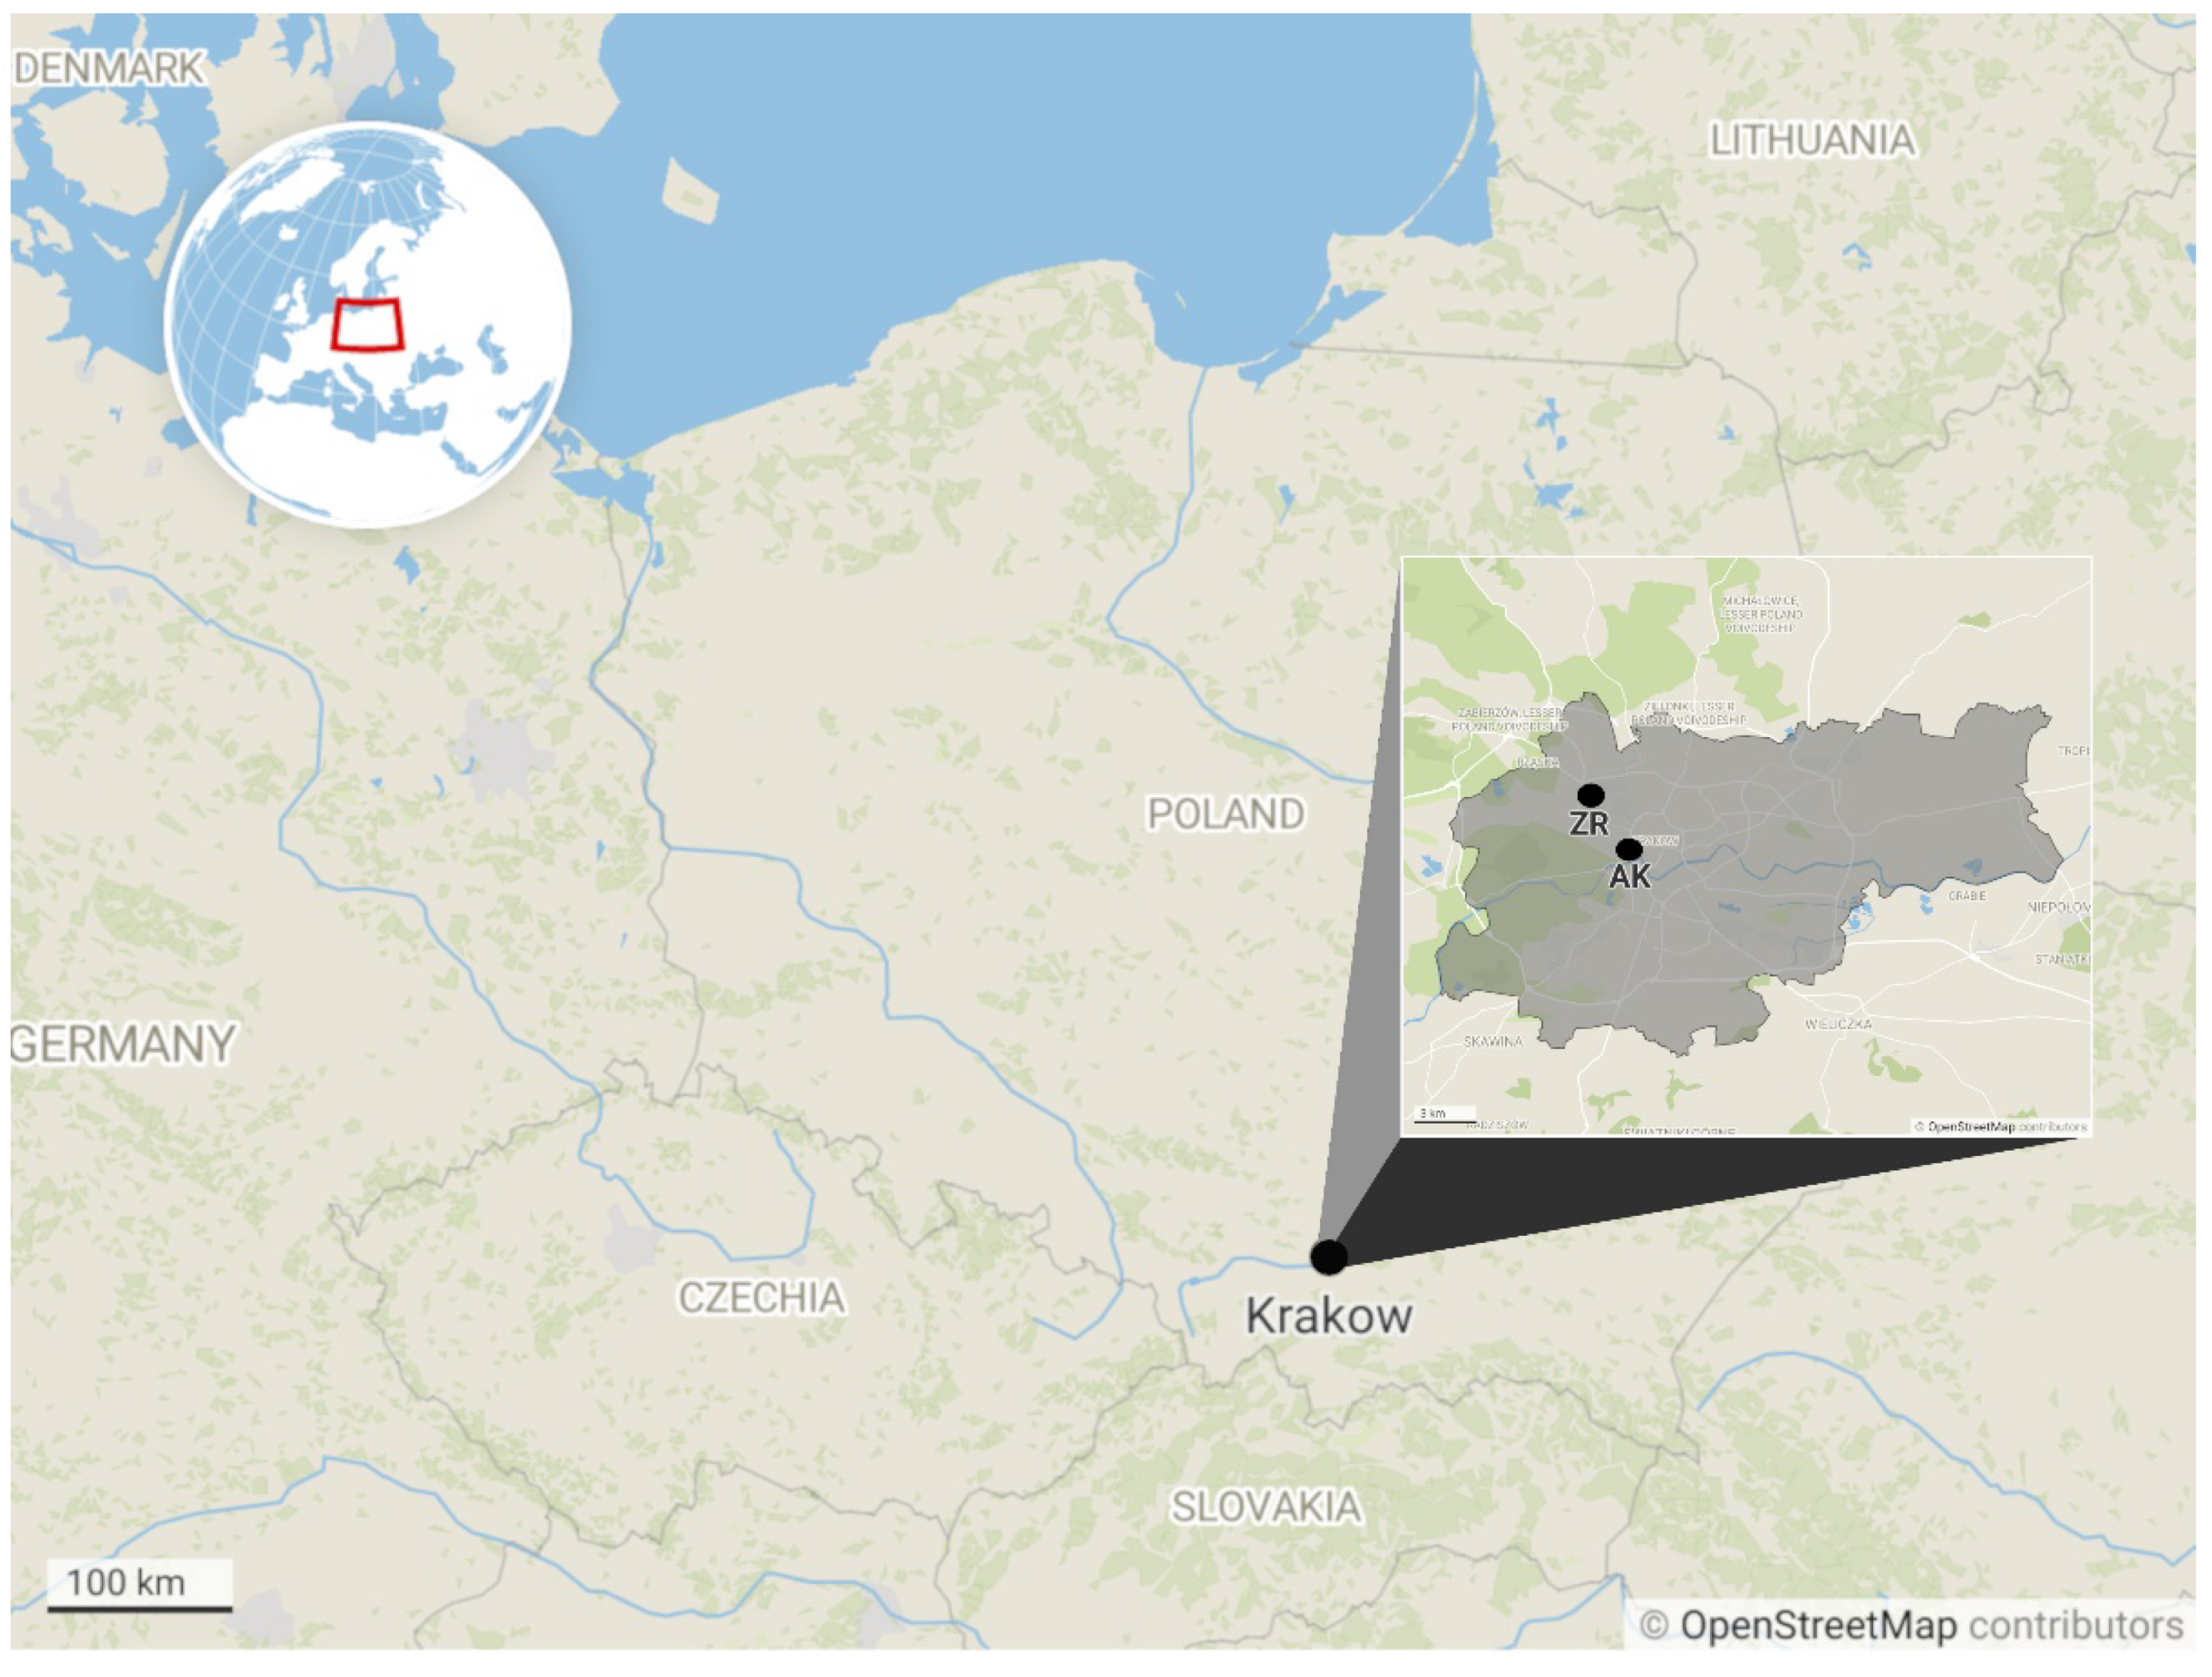
The PM10 samples were collected in summer 2018 and winter 2018/2019 at two monitoring stations representing a traffic-dominated area (latitude: 50°05′51′′ N; longitude: 19°55′34′′ E) and a residential district (latitude: 50°04′52′′ N; longitude: 19°53′43′′ E) within the city (Figure 2). The total ban on the combustion of solid fuels (coal, wood) entered into force in Krakow in September 2019 and this study covers the period just before the ban. The samples were collected by the Voivodeship Inspectorate for Environmental Protection and Chief Inspectorate of Environmental Protection at two stations belonging to the air-quality monitoring network operating in Krakow: (i) the station Aleja Krasinskiego (AK), representing the region of the city dominated by traffic emissions, and (ii) the station Zloty Rog (ZR), representing urban background conditions. Daily samples of PM10 were collected on 47 mm Whatman QMA quartz filters (Lab-System-Servis, Szczecin, Poland). The filters were stored in the fridge at +4 °C. The collected and analyzed PM10 samples cover the summer season (from 1 June to 29 July 2018) and winter season (from 22 November 2018 to 26 February 2019). The analyses comprised every third collected daily filter. In total, 53 samples were collected at each monitoring station.

2.2. Chemical Analyses

The filters were weighed before and after exposition, following the PN-EN 12,341 standard procedure [9]. The filters were conditioned before the weighing at the temperature of 20 ± 1 °C and constant relative humidity (50 ± 5%) for 48 h.
The elemental analysis of the filter material comprised 20 elements: P, S, Cl, K, Ca, Ti, V, Cr, Mn, Fe, Co, Ni, Zn, Cu, Br, Rb, Sr, La, As and Pb. The concentrations of the measured elements were quantified by energy dispersive X-ray fluorescence (EDXRF) method. Elemental analysis was performed in the laboratory of X-ray fluorescence at the Faculty of Physics and Applied Computer Science, AGH University of Science and Technology. The measurements were carried out under the following conditions: voltage of 55 kV, current of 30 mA, measuring time of 2400 s. The EDXRF spectrometer was calibrated using thin film standards (Micromatter, Washington, USA). The calibration was verified by the analysis of U.S. NIST standard SRM 2783 (Air Particulate Matter on Filter Media) [10].
The concentrations of ions (Na+, K+, Mg2+, Ca2+, NH4+, NO3, Cl, PO43−, SO42−) were determined with isocratic ion chromatography on an ICS-1100 instrument (Thermo Scientific, Sunnyvale, USA) equipped with an auto-sampler AS-DV Thermo Scientific, Sunnyvale, USA). Separations were accomplished using an Ion Pac AS22 (4 × 250 mm) analytical column, (mobile phase: 4.5 mM Na2CO3 + 1.4 mM NaHCO3) and CS16 (5 × 250 mm) analytical column, (mobile phase: 12 mM MSA) for anions and cations, respectively. Samples (25 µL injection volume) were separated with a flow rate of 1.2 mL min−1 of the mobile phase. The separated ions were determined after electrochemical suppression using AERS 500 (4 mm) and CERS 500 (4 mm) suppressors, for anions and cations, respectively. Calibration was performed against external standards diluted from stock solutions supplied by Thermo Scientific. The details of the adopted analytical procedure are presented elsewhere [11].
Analyses of organic (OC) and elemental (EC) carbon were conducted at the Institute of Chemical Technologies and Analytics, Technical University of Vienna, Vienna, Austria. Circular sections of filters with a diameter of 1 cm were used (without pre-treatment) to analyze the concentration of organic carbon (OC) and elemental carbon (EC) by the thermo-optical method using the OC/EC analyzer (Sunset Laboratory Inc., Tigard, OR, USA), using the standardized EUSAAR2 temperature program for the measurements of organic and elemental atmospheric carbon [11,12]. The EUSAAR2 temperature program consists of two phases. The first phase is composed of four temperature sub-steps: (i) 200 °C for 120 s, (ii) 300 °C for 150 s, (iii) 450 °C for 180 s, and (iv) 650 °C for 180 s acting on the sample in a pure helium atmosphere. In contrast, the consecutive sub-stages of the second phase (500 °C for 120 s; 550 °C for 120 s; 700 °C for 70 s; 850 °C for 80 s) take place in an oxidizing atmosphere (final oxygen/helium concentrations are 2% vs. 98%). In the first phase of sample heating, organic compounds are evaporated and oxidized to CO2, whereby a certain percentage of organic compounds can be pyrolytically converted to elemental carbon. During the second phase, both primary elemental carbon and the carbon produced by pyrolysis during the first phase are oxidized to CO2. The CO2 produced during both phases is detected by a non-dispersive infrared detector. At the end of each analysis period, the instrument is automatically calibrated by injecting calibration gas (5% methane in He). The accuracy and reproducibility of the results were regularly checked by analyzing sucrose containing 50 µg of carbon in 10 µL of solution or by using reference filters. The determination limits for organic (OC) and elemental (EC) carbon are 0.30 µg/m3 and 0.015 µg/m3, respectively [11,12].

2.3. Carbon Isotope Analyses

2.3.1. Sample Preparation

Due to the amount of carbon necessary to carry out the analyses, the determination of 13C and 14C content of the carbonaceous fraction of PM10 samples was conducted on monthly aggregated samples. The aggregation was based on daily filter samples, after gravimetric determination of PM10 concentration.
The total carbon in the monthly aggregated PM10 samples was quantitatively converted to carbon dioxide via controlled combustion in quartz-sealed tubes at the temperature of 950 °C [13]. The CO2 samples were then purified and analyzed to determine their carbon isotope composition. The 13C/12C ratio was measured using the Finnigan Delta S IRMS (Finnigan, Brema, Germany) spectrometer at the Mass Spectrometry Laboratory of the Faculty of Physics and Applied Computer Science, AGH University of Science and Technology, while radiocarbon content (14C/12C ratio) was determined in the Poznan Radiocarbon Laboratory using Accelerator Mass Spectrometry (AMS- 1.5 SDH-Pelletron Model “Compact Carbon AMS, National Electrostatics Corporation, Middleton, WI, USA) technique [14]. The measured 13C/12C ratios are expressed in δ values, defined as permill deviations from the internationally accepted standard. The analytical uncertainty of the reported δ values is in the order of 0.1‰. The 14C/12C ratios are reported as Percent of Modern Carbon (pMC—defined below), with the typical measurement uncertainty in the order of 0.2%.

2.3.2. Isotope Mass Balance

Source apportionment of the carbonaceous fraction of the PM10 samples in this study was done using an isotope mass balance approach based on the measured carbon isotope compositions and the assumed isotopic signatures of the sources of carbon. A detailed description of the isotope mass balance approach can be found [15,16]. Below, only a brief account of this method is given. Assuming that there are three main isotopically distinguishable source categories of carbon in the carbonaceous fraction of the analyzed PM10 samples, the following mass and isotope balance equations can be formulated:
1 = cbio + ccoal + ctraff,
1⋅δ13CPM = cbio⋅δ13Cbio + ccoal⋅δ13Ccoal + ctraff⋅δ13Ctraf
1⋅FFPM = cbio⋅FFbio + ccoal⋅FFcoal + ctraff⋅ FFtraff,
where:
cbio—biogenic contribution to the total carbon pool of PM10;
ccoal—fraction of the total carbon pool of PM10 originating from coal combustion;
ctraff—fraction of the total carbon pool of PM10 originating from traffic emissions;
δ13CPM—13C isotope composition of the analyzed PM10 sample;
FFPM—fossil fuel fraction of the total carbon pool present in the analyzed PM10 sample;
δ13C(bio, coal, traff)—13C isotope signatures of biogenic, coal burning-related and traffic-related fractions of the total carbon pool in the analyzed PM sample;
FF(bio, coal, traff)—fossil fuel fraction in biogenic, coal burning-related and traffic-related fractions of the total carbon pool in the analyzed PM sample.
The quantities derived from isotope analyses of PM10 samples are FFPM and δ13CPM. To solve the set of Equations (1)–(3) for cbio, ccoal and ctraff, all other quantities present in the equations have to be known or properly assessed. The fossil fuel fraction FF is defined as in [15]:
F F i ( % ) = ( 1 R i R r e f ) × 100 ,
where index i stands for bio, coal and traff whereas Ri and RREF are 14C/12C isotope ratios in biogenic, coal burning-related and traffic-related fractions of the total carbon pool in the analyzed PM10 sample. As coal does not contain any radiocarbon, FFcoal is equal 100%.
The 14C/12C isotope ratios are usually expressed as a percentage of modern carbon, which is defined as 95% of the specific activity of the internationally accepted standard NBS Oxalic Acid (Ox1) in the year 1950 [17]. It closely resembles the 14C content of carbon in plants growing around 1890 in a fossil CO2--free environment. As the biomass, which is being burned nowadays, still contains a measurable fraction of bomb-derived 14C, it was assumed in Equation (4) that RREF is equal to 110 ± 5% of modern carbon.
The reservoir of carbon in the analyzed PM10 samples may also contain carbon associated with the presence of mineral fraction. This carbon, which is devoid of 14C, is mostly in the form of carbonates (Ca or Mg). Such carbonates, if present in the analyzed PM10 samples, will be decomposed during the sealed-tube combustion process and will influence the carbon isotope analyses of the total carbon pool. Therefore, appropriate corrections of the measured 14C/12C isotope ratios have to be made, if necessary.

2.4. Source Apportionment

2.4.1. Elemental Enrichment Factors

Elemental Enrichment Factors (EF) analysis was performed, and the natural and anthropogenic origins of the elements were assessed. EFs were calculated using the formula presented by Belis et al. [18]:
EF = XPM RPM XCrust RCrust   ,
where X and R are the concentrations of the element under consideration and the reference element, respectively. They were taken from EDXRF measurements. PM and crust mean the concentrations in PM and in the Earth’s crust. Three groups of element sources are presented: (i) EF < 10 indicates the crustal origin of the element, (ii) 10 < EF < 100 indicates a mixed origin of the elements (natural and anthropogenic), and (iii) EF > 100 indicates an anthropogenic origin of a given element. The calculations of EF were performed for Ti as a reference element (if Ti is taken as the reference element EFTi = 1). Abundances of elements in the Earth’s crust were taken from the publication by Rudnick et al. [19].

2.4.2. Positive Matrix Factorization (PMF)

One of the methods allowing the identification othe sources of particulate matter and the quantification of their contribution is the Positive Matrix Factorization method (PMF) introduced by Paatero et al. [20]. Due to the necessity of having a large number of samples (at least several dozen), it is often classified as a statistical method. The basic assumption of the method is a constant relative share of components characterizing a given source. This share is called the profile of a given source. The PMF method, on the basis of the matrix of chemical species of particulate matter samples, calculates the matrix of participation of a given number of factors and profiles of these factors [21].
PMF receptor model solves the set of equations:
x i j = k = 1 p g i k f k j + e i j
where xij is an element of concentration matrix X (i—sample index and j—species index), gkj is an element of source contribution matrix G with p sources (k is sources index), fkj is an element of F source profile matrix and, finally, eij is an element of residual matrix E [22]. The PMF multivariate statistical method decomposes the concentration matrix (X) to source contribution (G) and source profile (F) matrixes in such a way that G and F obtain non-negative values only, ensuring the physical meaning of the model. The profile determines the share of individual components in a given factor and is the basis for the physical assignment of a given factor to identify the sources of particulate matter. In this method, the number of factors is set arbitrarily. In practice, the modeling is carried out for a different number of factors and the number for which the determination of the sources is unambiguous, is finally selected [11,23]. The EPA PMF 5.0 software, developed by the United States Environmental Protection Agency (US EPA), was used in this work. As an input, not only concentration matrix (X) but also appropriate uncertainty matrix (U) are required. For a given number of factors (p), the matrixes G and F are adjusted by minimizing the objective function Q which is defined as:
Q = j = 1 m i = 1 n e i j 2 u i j 2 ,
where uij is an element of uncertainty matrix (U), m is the number of species and n is the number of samples. A general optimization method where the measured value is “weighted” by its uncertainty requires the accurate uncertainty estimation. The following chemical species identified in elemental and chemical analyses of the PM10 samples were used: Cl, K, Ca, Ti, Cr, Mn, Fe, Co, Ni, Cu, Zn, Br, Rb, Pb, NO3, SO42−, NH4+, Na+, OC and EC. All these data were classified as “strong”, which resulted in a high signal-to-noise ratio. In the present work, if the concentration is less than or equal to the detection limit (DL) for a given element, the uncertainty is set at 5/6 DL and the concentration replaced by ½ DL [24]. Missing data were substituted by median values and the corresponding uncertainties were set at four times the median value. After the factorization run, the PMF software provides the possibility of analyzing the factorization stability by the “Fpeak Bootstrap Method” [25]. Modeling was carried out separately for the data from ZR and AK stations. This was based on the assumption that the source profiles for these two stations can be different. Q robust 14,68, Q true 68,174 for ZR and Q robust 14,973, Q true 82,038 for AK.

3. Results and Discussion

3.1. PM Concentrations and Main Constituents

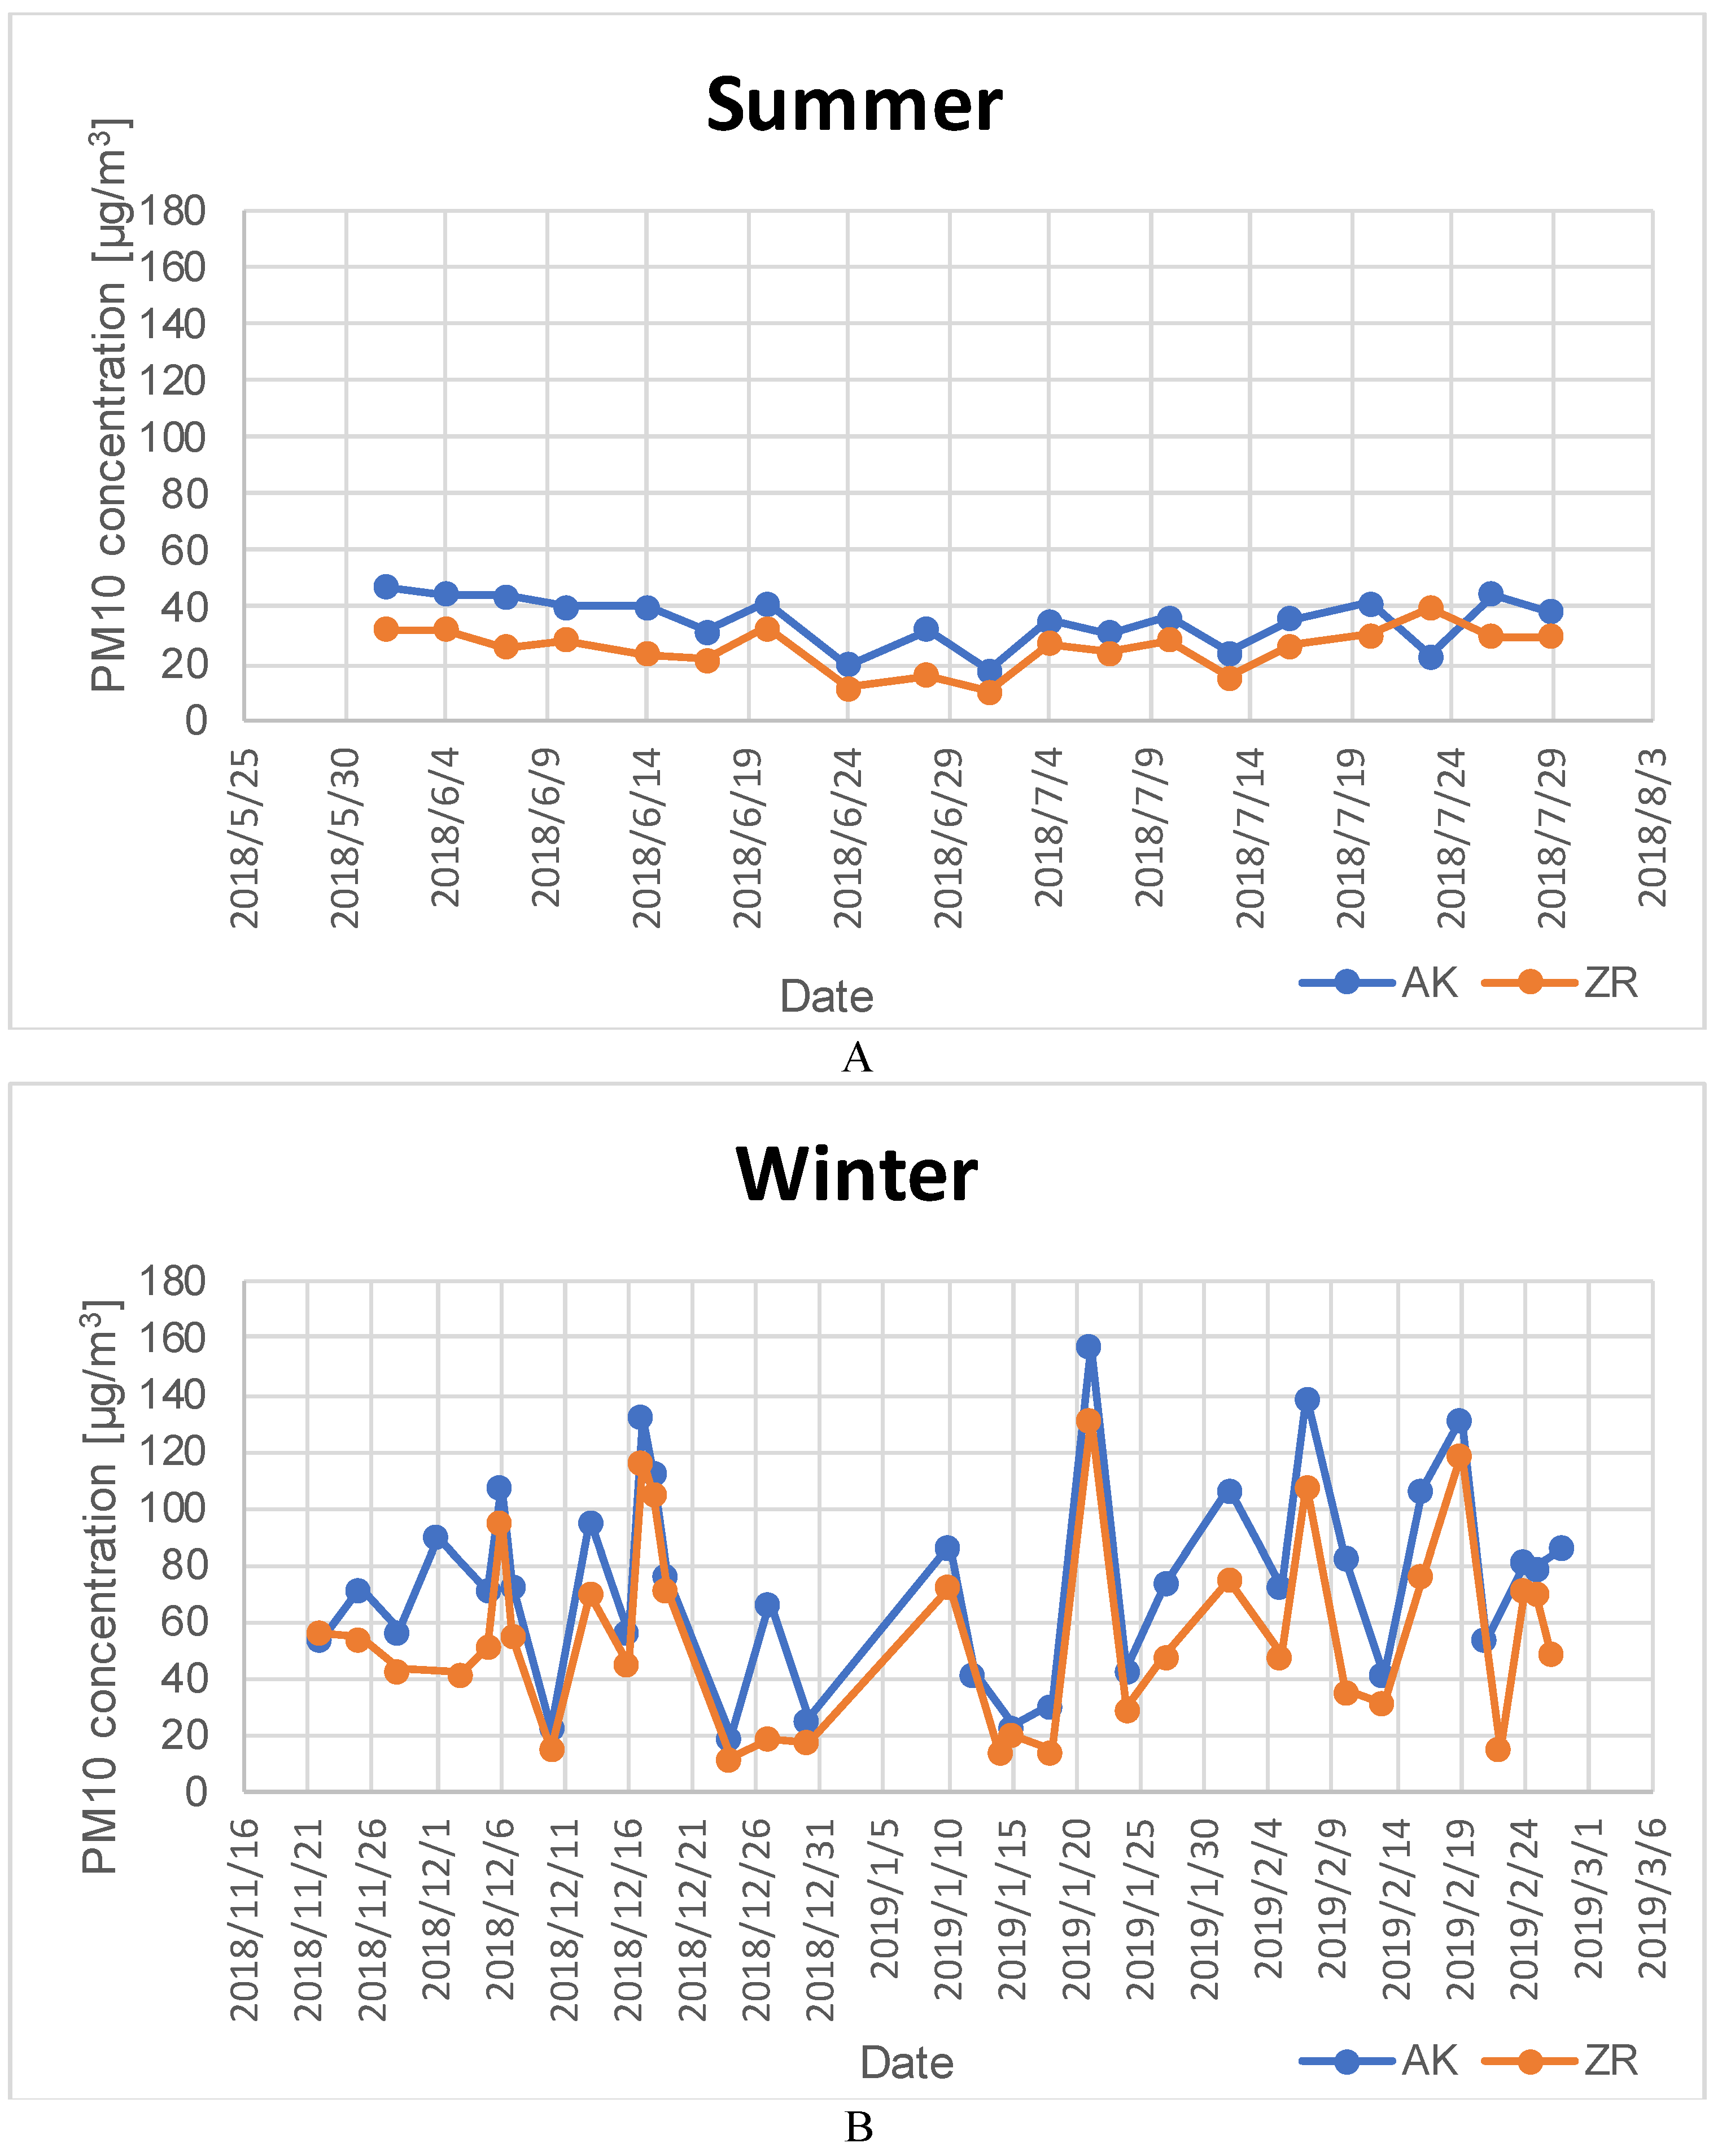
Figure 3 presents daily PM10 concentrations during summer 2018 and winter 2018/19 at AK and ZR monitoring stations. During summer, PM10 concentrations did not exceed 50 µg/m3 but in winter season they raised up to 157 µg/m3 and 132 µg/m3 (21 January 2019) at AK and ZR monitoring stations, respectively. The concentrations of PM10 were generally more stable in summer when compared to winter data. Minimum, maximum and mean concentrations of PM10 and the analyzed elements during summer 2018 and winter 2018/19 for AK and ZR stations are presented in Table S1 (Supplementary Material). The mean PM10 concentrations were two times higher for the winter season when compared to the summer season. Mean PM10 concentration at the traffic-dominated site (AK station) was 35 ± 7 µg/m3 and 76 ± 28 µg/m3 for summer and winter, respectively, to be compared with 25.6 ± 5.7 µg/m3 and 51 ± 25 µg/m3 for the urban background site (ZR station) for summer and winter seasons, respectively. A higher variability of PM10 at both monitoring stations during the winter season can be connected to increased activity of the local emission sources for this time of the year, as well as meteorological conditions during this period (shallow mixing layer, frequent temperature inversions in the local atmosphere), which hinder pollutant dispersion and removal [26]. The decreasing level of PM10 during summer months stems from generally lower emissions and higher rainfall, and enhanced vertical mixing of the lower atmosphere causing more efficient wash-out of PM10.
The carbonaceous matter and secondary inorganic aerosols (SIA) are main components of PM10 at both monitoring stations. At the AK station, the carbonaceous fraction was equal to 44% (27% OC and 17% EC) and 41% (31% OC and 10% EC) of PM10 in summer and winter, respectively. For the ZR station, this difference was higher: 38.3% (32% OC and 6% EC) and 49% (41% OC and 7% EC) of PM10 in summer and winter, respectively. Szidat et al. [27] obtained in Zurich, Switzerland the value of 19.4% TC of PM10. SIA were higher at the ZR station and they were equal to 23.4% and 33.5% of PM10 in summer and winter, respectively. These values for the AK station were as follows: 16% and 21% of PM10 in summer and winter, respectively. The contributions of measured elements were higher in winter (7% of PM10) than in summer (6.2% of PM10) at AK station; while they were lower in winter (4.8% of PM10) than in summer (5.8% of PM10) at the ZR station. Inorganic ions other than SIA (Na+, K+, Ca2+, Mg2+, Cl, PO43−) contribute to PM10 in 15% and 17% of PM10 in summer at AK and ZR stations, respectively. There was also 30% and 18% of PM10 at AK and ZR stations in winter, respectively. Some component contributions to PM10 mass or concentrations changed seasonally but some of them remain similar in both seasons.
Very high concentrations of Cl were observed during the winter season at both stations. In winter, Br concentrations were six and five times higher than for summer at AK and ZR stations, respectively. Concentrations of S, K, Pb and Cr were more than two times and 1.6 times higher during winter, when compared to summer at AK and ZR stations, respectively. These elements come from sources, which are more active in the wintertime, for example, sources connected to residential heating. The following elements had, during the summer, similar concentrations at both stations: S, Cl, K, Cr, Ni, Br, Rb, and Pb. Concentrations of Ca, Ti and Zn and Sr were 24% and 31% and 23% higher at traffic station than urban background station in the summer. Concentrations of Mn, Fe, Co, Cu were 72%, 185%, 131%, 300% higher for the traffic-related station when compared to the urban background station in the summer. A significantly higher concentration of Fe at the AK station can be connected to the abrasion of tires and asphalt layers, and an excess of Cu can come from tire wear and brake pad wear. Mn, Fe, Co, Cu can also come from steel production as well as from soil [10,15,26] Amato et al. [28] has shown that Fe, Cu, Zn, Cr, Sn and Sb come from brake wear, while S, Zn OC come from tire wear. Fe comes from the re-suspension of street dust [10,15,26]. According to Harrisson et al. [29], Ba, Cu, Fe, Sb originate from brake wear, Zn from tire wear and Si and Al from re-suspension. During winter, similar concentrations for Ni, As, Br, Rb, Pb at both stations were observed. At the AK site, winter concentrations of S, K, Ca, Cr and Zn were 1.4–1.8 higher than at the ZR site. At the AK station concentrations of Cl, Ti, Mn, Co and Sr were 1.9–3 times higher than at the ZR station in winter. More than three times higher concentrations of Fe and Cu were observed during winter at the AK station compared to the ZR station. On 17 June 2018, higher concentrations of Na+ and Ti, Ca, V, Cr, Mn, Fe, Ni, Cu, Zn and Pb were observed at the ZR station. Back trajectory modelling showed that, during this day, air was coming from the east (Figure S1, Supplementary Material).

3.2. Ions, Organic (OC) and Elemental (EC) Carbon Concentrations

Table S2 presents the results of ions and OC/EC analyses in PM10 samples collected at AK and ZR monitoring stations. The concentrations of Cl, NO3 and NH4+ were considerably higher in the winter when compared to the summer at both stations (the winter to summer ratio was above three). Slightly higher concentrations of PO43−, SO42−, Na+ in the winter at both stations were observed. No seasonal variations of K+ and Mg2+ were detected. In summer, higher concentrations of Ca2+, Cl, Na+ and NO3 were observed at the AK station. These observations confirm that AK is a traffic-dominated station. The charge balance is presented in Figure S2. It provides information about the quality of chemical analyses. The sum of the equivalent concentration of cations and anions was comparable for both monitoring stations. In Figure S3, a comparison of cation concentration soluble in water versus element concentration is presented for both monitoring stations. About 30% of potassium and calcium appeared in water soluble cations at the AK station. About 52% of potassium and calcium appeared in water soluble cations at the ZR station. The concentrations of OC were 2.5 times higher in the winter when compared to the summer at both localizations. They are similar at both stations. EC concentrations were higher in winter than in summer at the ZR station (winter/summer ratio equal 2.42), whereas at AK station EC was slightly higher in the winter than in the summer (winter/summer ratio equal 1.21). This is the confirmation of AK as a traffic-dominated station. The OC/TC ratios for the ZR station were 0.84 and 0.85, for winter and summer, respectively. These values are comparable to the results of Klejnowski et al. [30] obtained for Krynica Zdroj (0.87 and 0.86 for summer and winter). These ratios indicate mixed emissions from various sources. The OC/TC ratios for the AK station were 0.77 and 0.61, for winter and summer season, respectively. Roadside emissions have an OC/TC ratio equal to 0.48–0.67 [30]. This suggests that, during the summer roadside emissions of carbon dominated at this station. However, during winter, additional sources of PM10 were present there.

3.3. Carbon Isotope Analyses

The periods of sample aggregation, the number of aggregated samples for the given month, the OC/EC concentration and the relevant carbon isotope data are presented in Table 1 for traffic-dominated (AK) and urban background (ZR) stations.
The pMC and δ13CVPDB values reported in Table 1 are corrected for the presence of calcium carbonate in the analyzed PM10 samples (details of the correction procedure are presented in Zimnoch et al. [15]. The mean concentration of Ca in PM10 samples representing the summer period was similar to those representing winter periods and it was in the range 0.3–1.4 µg/m3 and 0.3–0.6 µg/m3 for AK and ZR stations, respectively. The resulting corrections were statistically significant for both periods (summer and winter). The resulting corrections for the fossil fraction of carbon (FF) were in the order of 1.34% and 0.92% for summer and winter seasons. The corresponding corrections for δ13CVPDB were −0.90 and −0.65‰ respectively. For both cases, the corrections are significantly higher than the quoted analytical uncertainties (ca. 0.2% and 0.1‰ for FF and δ13CVPDB).
We observed higher monthly averages of OC/EC ratios in winter when compared to the summer period (Table 1). They are equal to 1.59 and 4.02 for June and January at the AK station, respectively. Ratios for the ZR station are equal to 6.14 and 8.41 (Table 1). The OC/EC values for the ZR station were a little higher than those obtained by Major et al. [31] for Debrecen (5.6–7.3 for winter and 4.2–5.1 in summer). According to Pio et al. [32], a low level of the OC/EC ratio can be connected to a fresh traffic aerosol (1.7–2.3). Higher OC/EC ratios were observed for coal combustion (1.3–6.3), wood burning (2.8–7.5) and natural gas burning (12.7). OC concentrations were higher in winter when compared to summer by a factor of more than two at both monitoring stations. The FF(%) in Table 1 was 58.5 and 63.3 for June and December at the AK station. They were equal to 44.6 and 59.7 at the ZR station for June and February, respectively. Major et al. [31] observed a fossil carbon value of TC in PM2.5 equal to 30% and 20% for Debrecen for summer and winter, respectively. In our study, a higher contribution of fossil carbon was observed at both monitoring stations, when compared to Debrecen. Szidat et al. [27] received 63% of TC for the PM10 fraction in Zurich, Switzerland. Zimnoch et al. [16] in our previous paper presented the fossil component in winter as high as 55–62% at AGH, Krakow station for PM2.5 fraction. These values for summer were in the range 36–41% at the same station. The 13C shows seasonal variations, with generally less negative δ values in winter when compared to summer (Table 1). The mean δ13C was equal to −28.0‰ and −25.4‰, for the AK station, to be compared with −27.9‰ and −25.1 for the ZR station during summer and winter seasons, respectively. It is similar to −26.6‰ for PM10 in Wroclaw [16,33] obtained values around −27.5‰ and −25‰ for PM2.5 fraction in Krakow for summer and winter, respectively. Szidat et al. [27] published the value of −26.3‰ for PM10 in Zurich, Switzerland. The δ13C value for traffic related sources has the range between −28.3 and −24.5‰. 13C isotope signatures of non-vehicle anthropogenic emissions range from −27.4 to −23.3‰, while δ13C values of PM originating from biomass burning range from −34.7 to −25.4‰ [34].
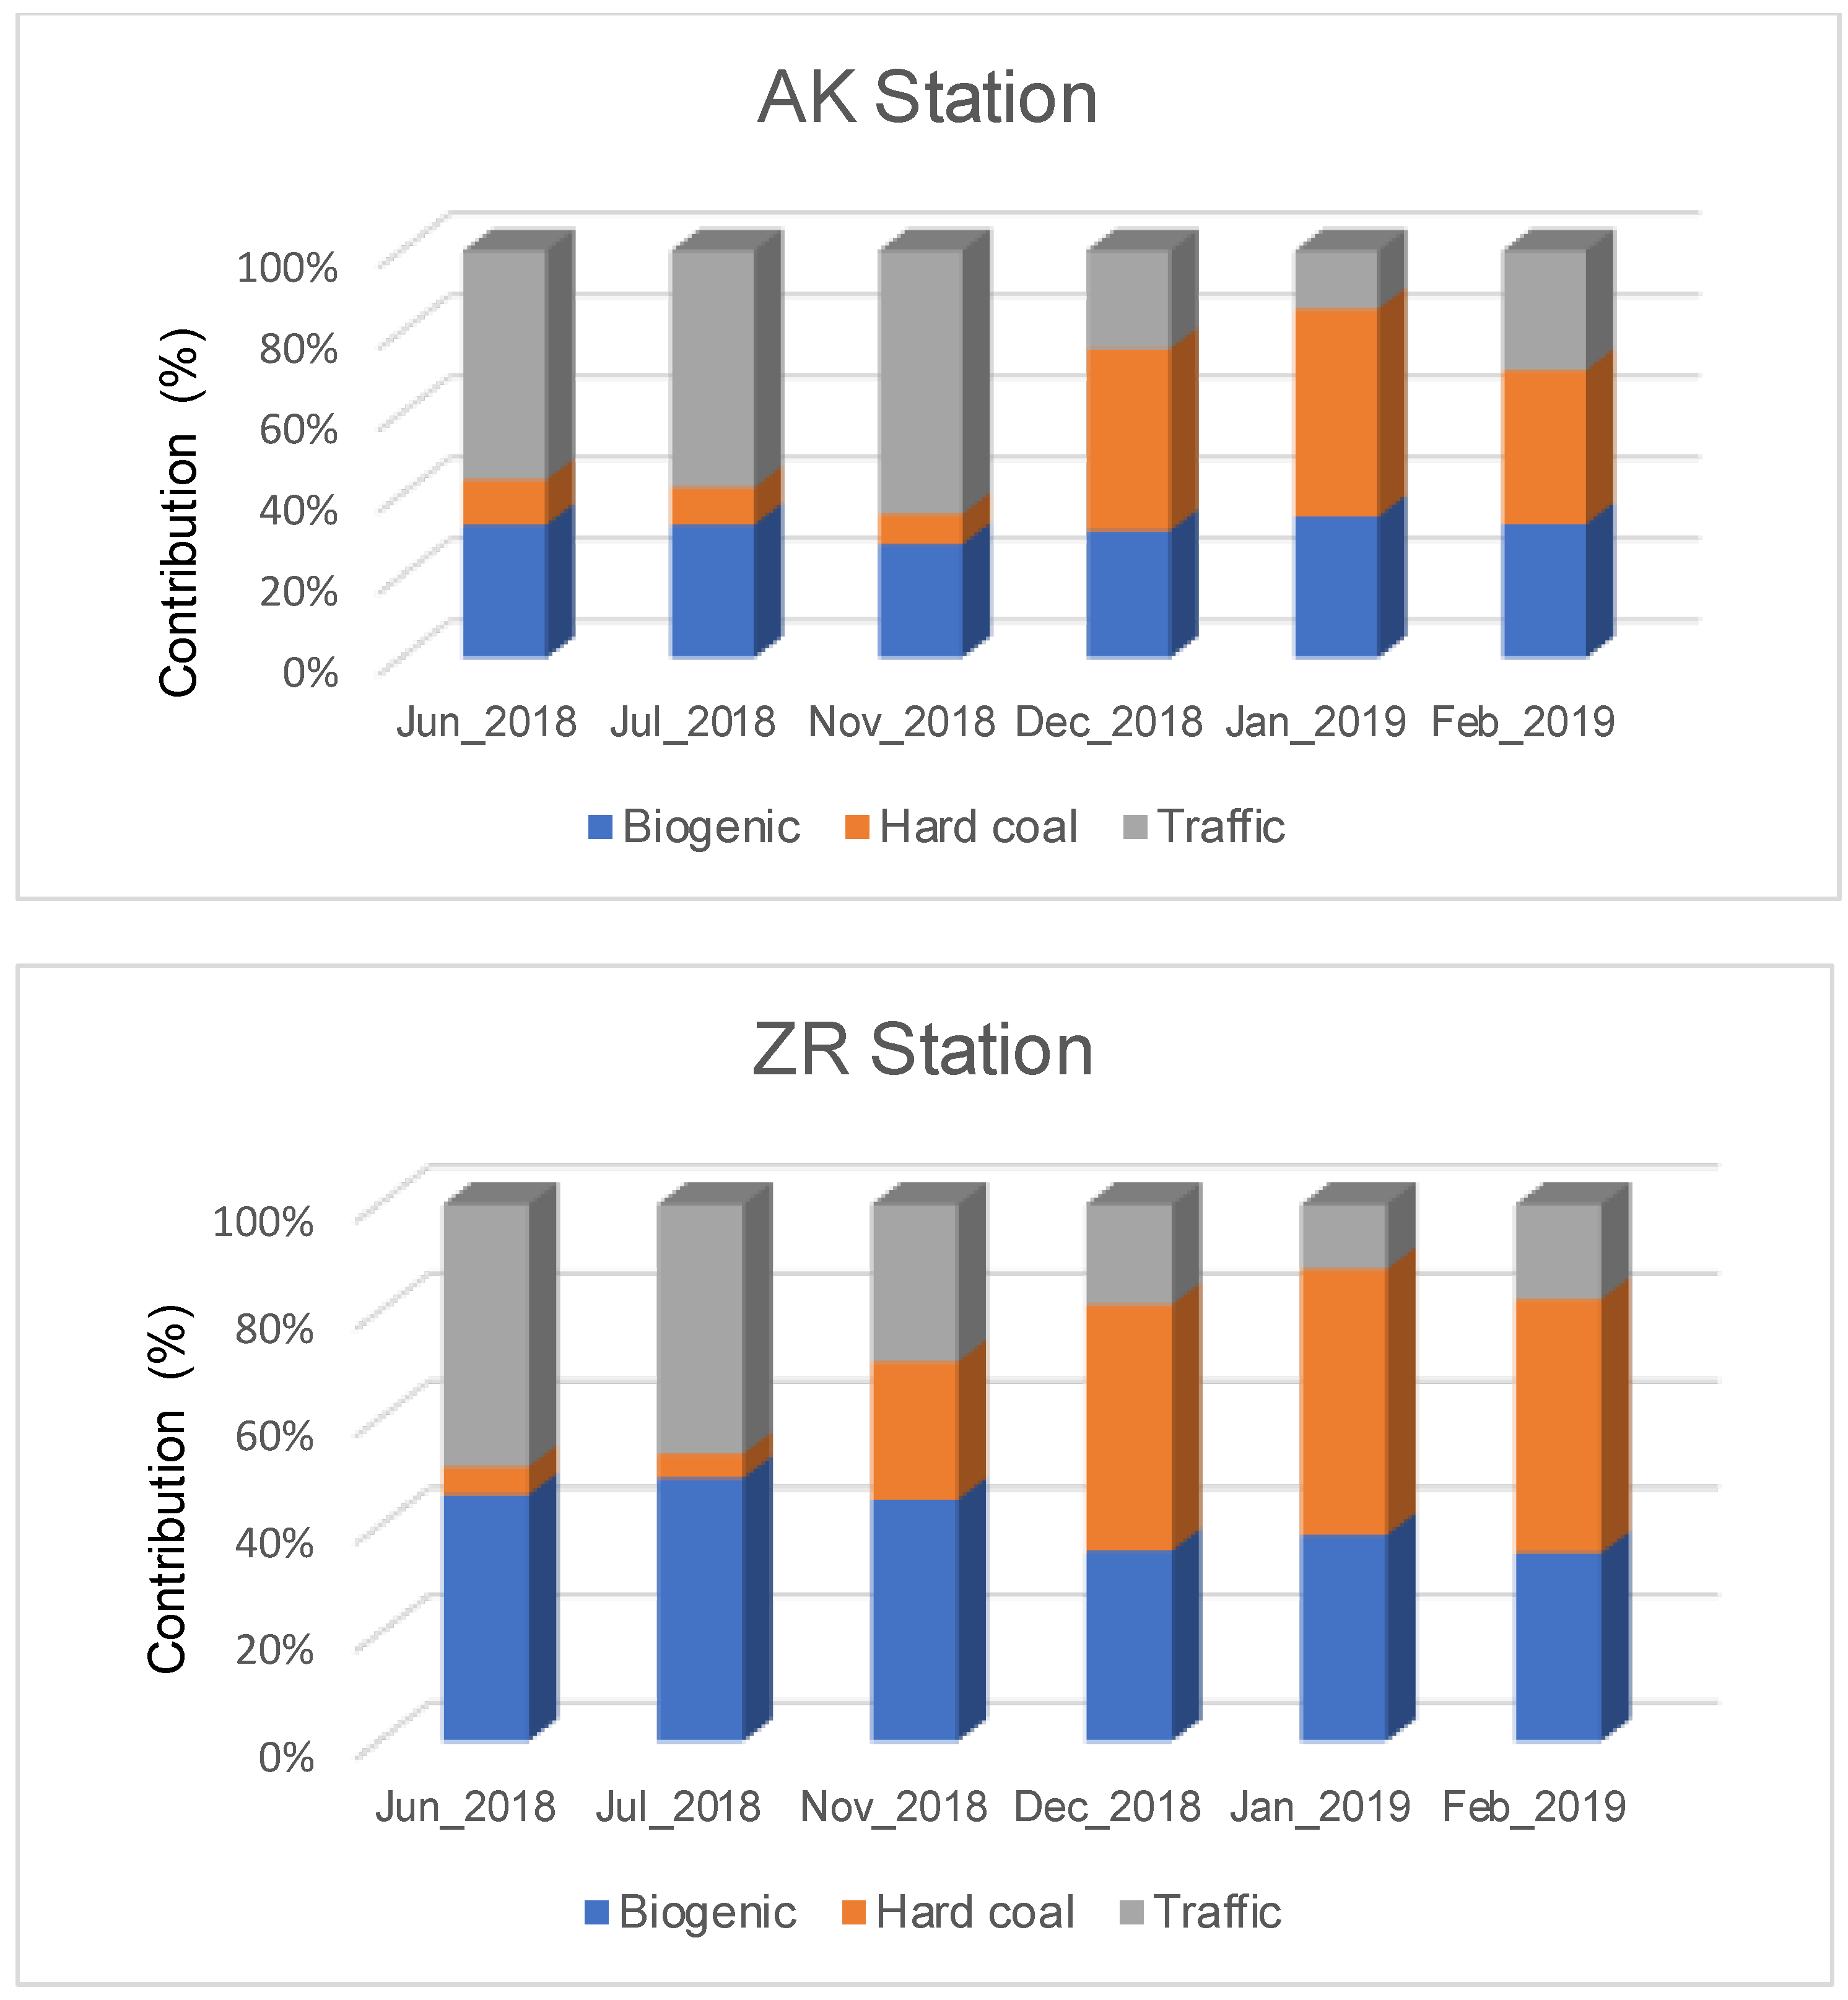
Figure 4 and Table 2 show the contribution of three source categories of the carbonaceous fraction of PM10 at both stations (in%) calculated using isotope-mass balance equations (cf. Section 2.3.2.). Isotopic analysis assumes three main sources of carbon present in the city atmosphere: (i) coal burning originating both from local low emission sources and industrial energy production high emission sources; (ii) traffic-related sources consisting of carbon emissions from liquid fuel combustion as well as carbonaceous particles emitted from pavement and tire abrasion and (iii) biogenic sources including biomass burning and secondary aerosols (SA) formed from volatile organic compounds (VOC) being SA precursors emitted naturally by the biosphere (mainly in summer season). The results presented below show a common trend pointing to hard coal combustion as the dominant source in winter season (35–42% or 11 ± 5.6 μg/m3–10 ± 6.2 μg/m3), while in the summer period, the contribution of individual sources differs significantly between stations. Based on sensitivity analysis related to isotopic signatures of the sources, maximum uncertainty of isotope mass balance calculations has been estimated as +/−5%. From PMF analysis winter contribution of fossil fuel was 7 ± 4 μg/m3 and 20 ± 8 μg/m3 for AK and ZR stations, respectively.
At the AK station, traffic dominates in the summer, accounting for 57% of the contribution, while at the ZR station, the biogenic and traffic sources of carbon in summer are at the similar level, (47% for biogenic and 48% for traffic). The biogenic source includes emissions from biomass combustion and natural biosphere emissions (emission of volatile organic compounds). These findings confirm that the vehicle traffic is the main source of carbonaceous PM10 at the AK station, which is consistent with its location next to a major main road. In the case of the ZR urban background station the traffic component in summer is still high, demonstrating a high contribution of the traffic component in the summer city background, but is comparable with the biogenic source dominated by natural biospheric emissions of VOC (SOA precursors) during summertime. The contribution of emissions from hard coal combustion drops to 5–10% during summer season. This emission may come from industrial sources.

3.4. Source Apportionment

3.4.1. Preliminary Identification of PM10 Sources: Elemental Enrichment Factors

Figure 5 shows enrichment factors in a decreasing order for analyzed elements at AK and ZR stations. EFs were about 1130 for Cl and around 100 for Pb. Cl, Br, S, Zn, Pb, As, and La. For example, Cl, Br, Zn, Pb and As come from coal combustion, Pb, Zn can come from industrial processes and/or vehicle exhaust emissions and Zn can come from non-exhaust emission (wear of tires) [10,26]. Cu, Co and Cr belong to group of elements with EF between 10 and 100. Cu originating mostly from non-exhaust emission (wear of brake). While Cr can come from burning of coal, industry or traffic [10]. Enrichment factors lower than 10 had Ni, V, Fe, Mn, Ca, K, Rb and Sr. They indicated predominantly natural origin. These elements are associated not only with natural sources, they have also come from anthropogenic emissions and contribute to PM10. Ca can be associated with construction works. Mn can be linked to fuel additives emissions or industrial processes. K is a marker of biomass burning [26].

3.4.2. Identification of PM10 Sources by PMF Analysis

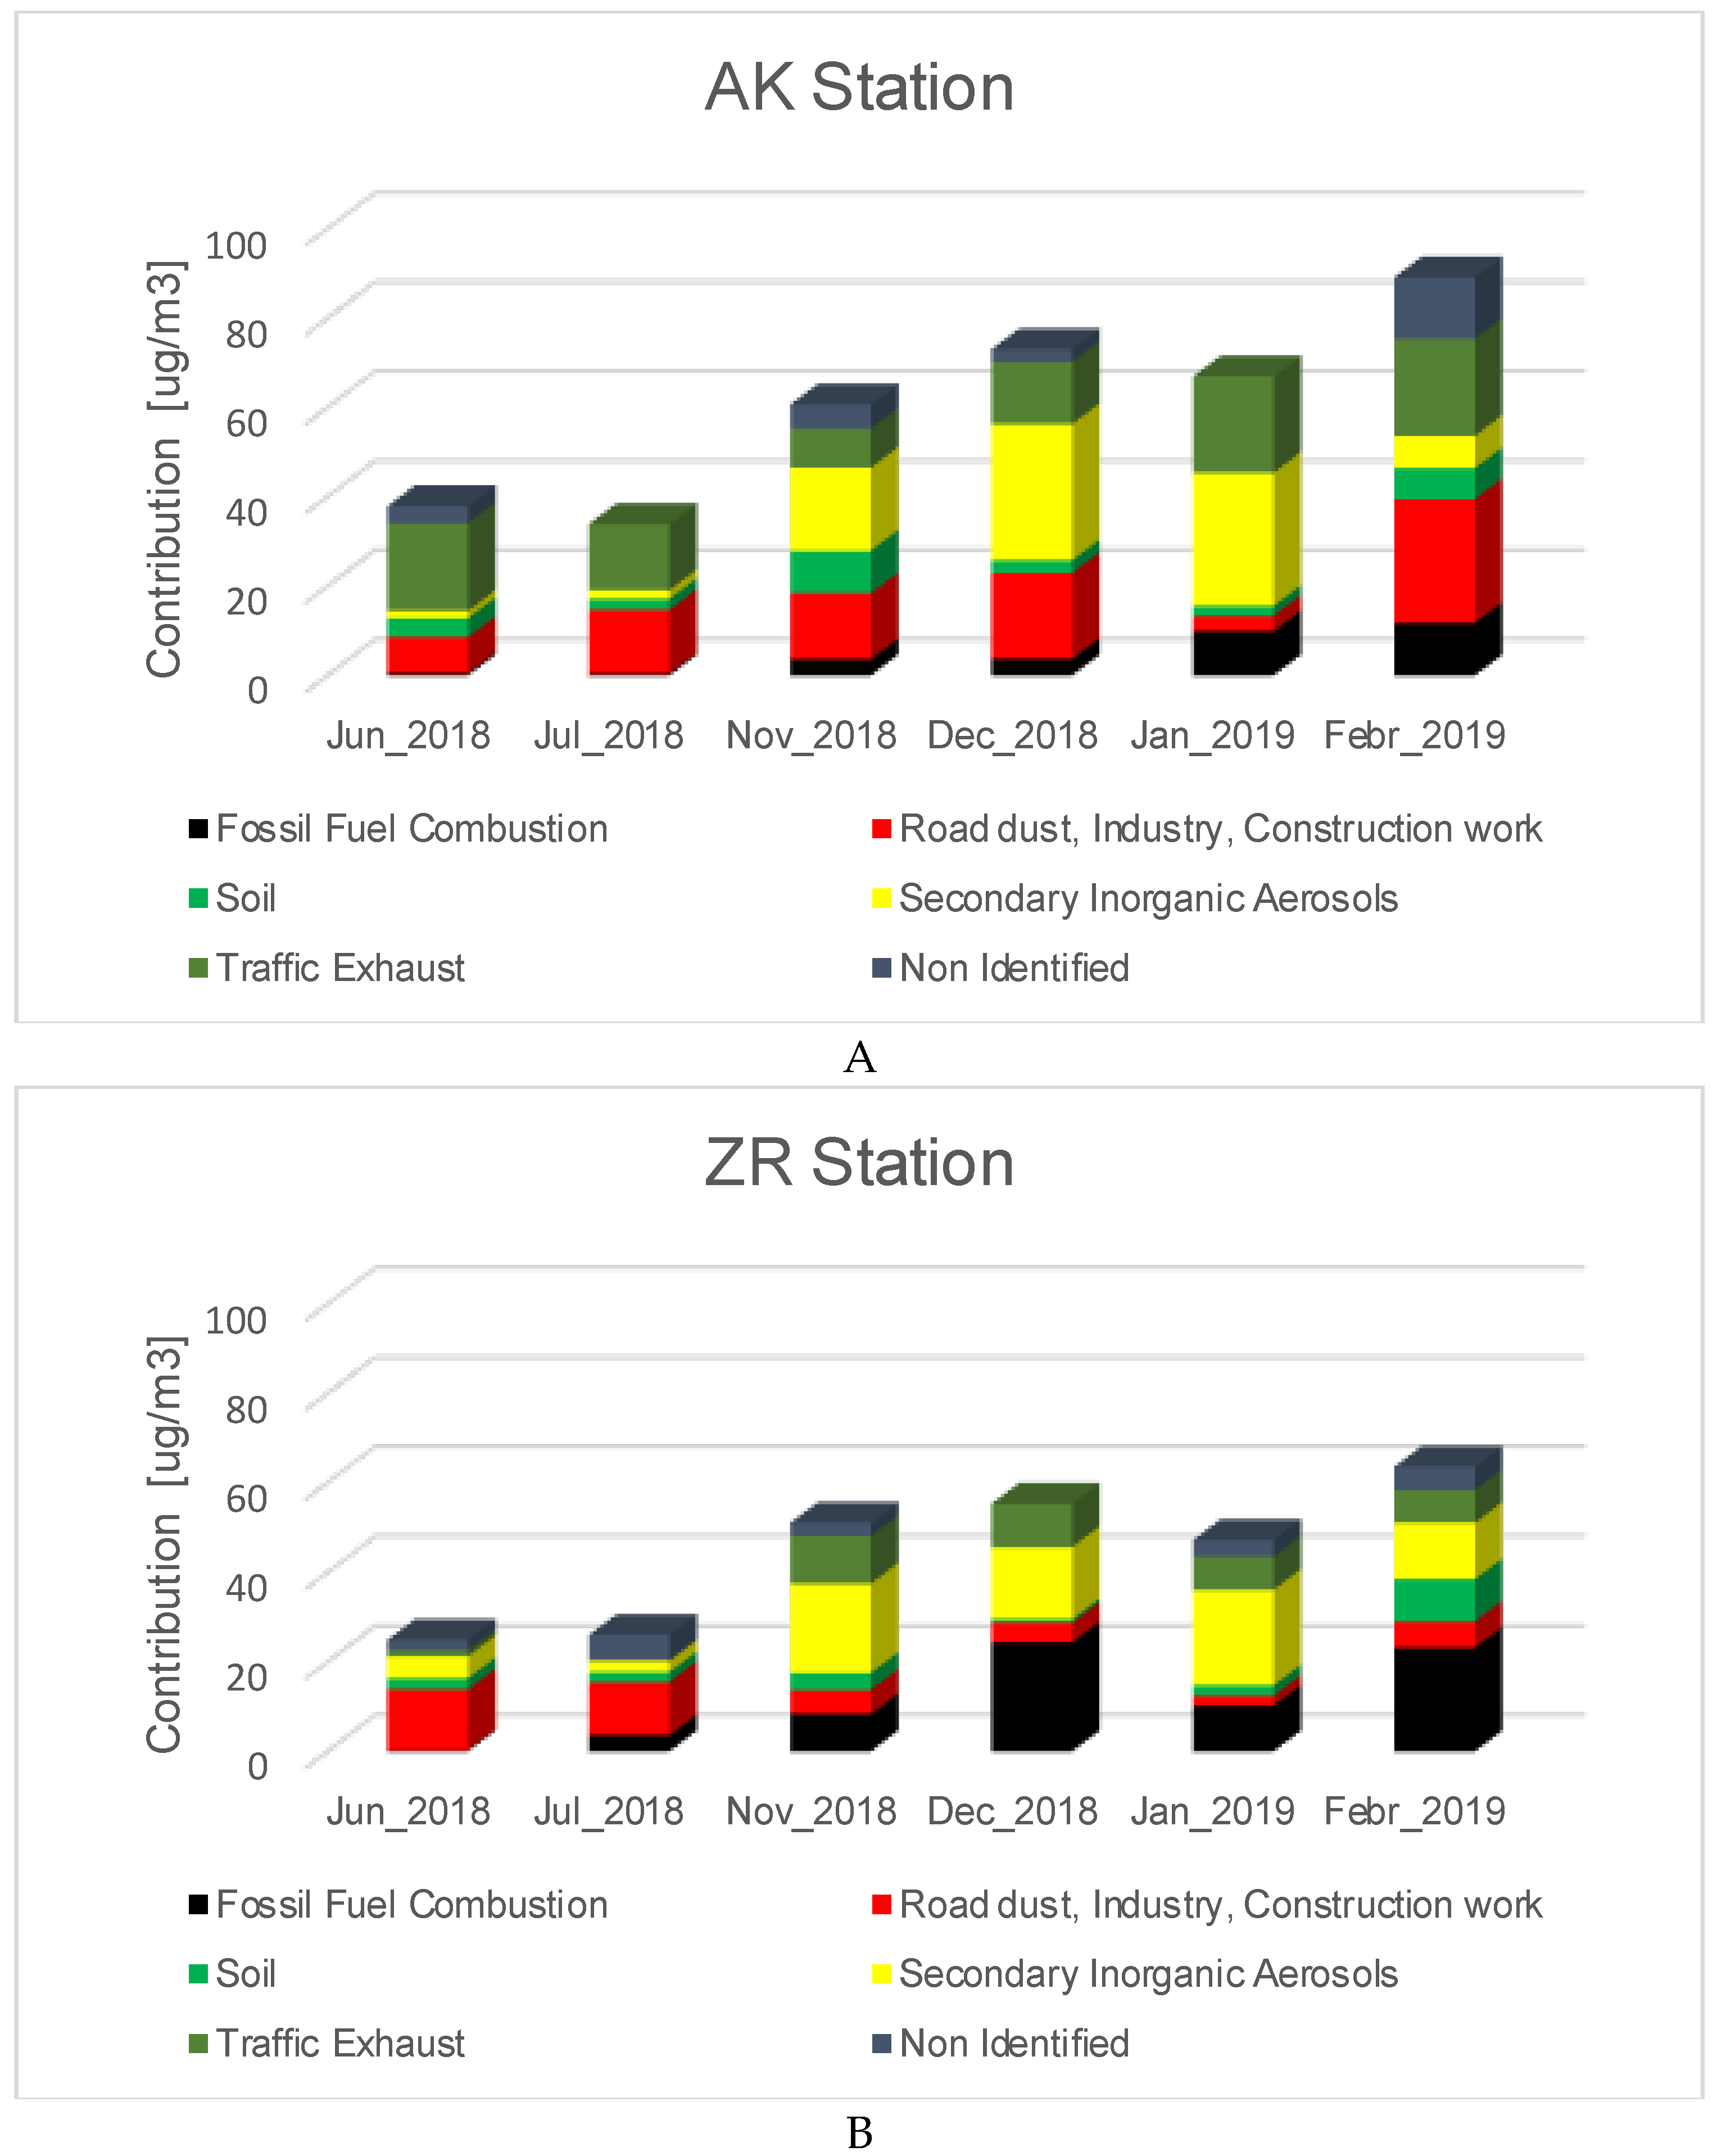
Figure 6 shows the results of PMF analysis of PM10 fraction for AK and ZR stations for particular months. Five factors were obtained from PMF analysis for each station. The identified sources, together with the main tracers, are presented in Table 3. The main contributions to the sources of the PM10 mass are presented in Figure 6 and Table 4. The first factor was identified by the presence of Cl, NO3, Na+, OC and EC and was attributed to fossil fuel combustion. Cl has a high enrichment factor (1130) suggesting its anthropogenic origin. Most probably, chlorine comes from the combustion of coal and to a lesser extent from pavements and road de-icing during wintertime. The contribution of EC in this source can explain primary PM in Krakow coming from the combustion of different solid fuels. Secondary inorganic and organic aerosols are also present. The second factor was identified by the presence of NO3, SO42−, NH4+ and was attributed to secondary inorganic aerosols. The third factor characterized by the presence of EC, OC, SO42−, NO3, Ti, Cu, Fe, Co, NH4+ can be assigned to exhaust emission traffic. Cu has been found to be associated with gasoline. Fe is fuel additive and can be emitted from diesel engines. Vehicles also emit carbonaceous compounds such as OC and EC. Gasoline emits more OC and diesel more EC. Motor vehicles are significant contributors to elevated post catalyst emission of NH3, which transforms in the atmosphere into secondary inorganic aerosols. Small amounts of Sulphur components exist in gasoline. Different forms of Sulphur can be formed in three-way catalytic converters [26]. Cu and Co have mixed origin; enrichment factors are around 100. So, the presence of these elements in the exhaust emission factor suggests their anthropogenic origin. Fe and Ti have enrichment factors below 10, meaning they originate naturally. The source of these elements can be also anthropogenic. The next factor identified by the presence of Ni, PO43−, Na+ was assigned to soil. Ni has EFs equal to ten, suggesting a natural origin. The last factor was identified through the presence of Ca, Ti, Co, Cr, Fe, Mn, Zn, Cu and was assigned to road dust (non-exhaust traffic emission), industry and construction work. The industrial source is identified by the following elements: Fe, Mn, Zn, Cr and Cu. The enrichment factor for Zn and Cu was around 100, demonstrating anthropogenic origin. Co, Fe, Zn and Cu are traffic related elements. Ca can be attributed to construction works [10]. The dominant contribution in winter had two main sources: fossil fuel combustion and secondary inorganic aerosols. They were 65% (fossil fuel 36% (20 µg/m3) and secondary inorganic aerosols 29% (16 µg/m3)) and 38% (fossil fuel 10% (7 µg/m3) and secondary inorganic aerosols 28% (21 µg/m3)) at ZR and AK stations, respectively. In winter, 24% (18 µg/m3) and 16% (9 µg/m3) of PM10 came from exhaust traffic emissions at AK and ZR stations, respectively. In winter, the contributions of non-emission traffic, industry and construction work were 24% (18 µg/m3) and 8% (5 µg/m3) at AK and ZR stations, respectively. In summer, the contribution of non-emission traffic, industry and construction work was 48% (13 µg/m3) and inorganic secondary aerosols 16% (4 µg/m3) at the ZR station. As well as these sources, contributions at the AK station were 32% (11 µg/m3) and 5% (2 µg/m3) in the summer. In summer, the contribution of exhaust traffic emissions was 48% (17 µg/m3) and 4% (1 µg/m3) at AK and ZR stations, respectively. Weber et al. [35] performed PMF analysis for 15 sites in France in the years 2012–2016. Wood burning for heating and traffic had main contributions to PM10 sources. The average contribution of wood burning to PM10 mass was 17%. SIA aerosols contributed, on average, 32% to PM10 mass. The values are very close to our results. Primary traffic contributed 15% to PM10 mass in France, while our study shows road dust, industry and construction works in one factor. This factor had a higher contribution to PM10 mass in summer than in winter.

4. Conclusions

The presented study focused on a comprehensive analysis of PM10 daily samples collected at two air quality monitoring stations in Krakow in summer 2018 and in winter 2018/2019. The stations have contrasting characteristics. They represent traffic-dominated (AK) and urban-background (ZR) environments. The mean PM10 concentrations at the traffic related station were 30% higher than that of the urban background station for both seasons. Winter PM10 concentrations were more than two times higher than summer for both monitoring stations. Higher concentrations of elements typical for traffic sources (Zn, Cu, Cr, Fe, Ca) were observed at the traffic-dominated station. Organic and elemental carbon analysis yields higher concentration of elemental carbon (EC) at the traffic-dominated station when compared to the urban-background site. From isotopic analyses of carbonaceous fraction of PM10, one can conclude that during wintertime, high contributions of coal combustion to the total carbon content were observed at both stations. During summer, traffic contributed more to the total carbon reservoir of PM10 samples collected at the AK station, while biogenic sources were dominant at the ZR station. Similar enrichment factors (EF) were calculated for elements from both monitoring stations for both seasons. The PMF analysis identified five factors and attributed sources of PM10 to both stations. At the AK station, the exhaust traffic source was observed and it was equal to about 18 µg/m3. At the ZR station, the ammonium rich factor appeared, which was attributed to exhaust traffic sources. The research was performed for the period before the total ban of fossil fuel combustion in Krakow was introduced. The contribution of fossil fuel combustion during winter was not very high (7 µg/m3) at the AK station and was equal to 20 µg/m3 at the ZR station. A higher contribution had secondary inorganic aerosols, especially during winter at both sites (about 20 µg/m3). Road dust, industry and construction work also make important contributions to PM10 mass. In winter, a higher contribution of these sources was observed for the traffic dominated station. Our study confirmed that the AK station was described by parameters characteristic of a traffic dominated station and ZR for an urban-background station.

Supplementary Materials

The following are available online at https://www.mdpi.com/article/10.3390/atmos12101364/s1, Figure S1. Back trajectories for 17 June 2018 for ZR station; Figure S2. Balance ∑ Cations versus ∑ Anions for AK and ZR stations; Figure S3. Cations K+ and Ca2+ concentration versus elements K and Ca concentrations at AK and ZR stations; Table S1. PM10 and element concentrations during summer 2018 and inter 2018/2019 season (PM10 concentrations in µg/m3) recorded at the traffic-dominated monitoring station (AK) and urban background station (ZR). Element concentrations in ng/m3. The last column presents winter to summer concentrations ratios; Table S2. Ions and OC/EC concentrations in PM10 samples collected during summer 2018 and winter 2018/2019 at AK monitoring station and urban background station (ZR) (in µg/m3). The last column presents the ratios of winter to summer concentrations.

Author Contributions

Conception and design of study: L.S., K.S., M.Z., K.R.; Funding acquisition: L.S. Analysis and/or interpretation of data: L.S., Z.S., K.S., A.S., A.T.-F., M.Z., Z.G., P.F. Drafting the manuscript: L.S., K.R., Z.S., M.Z. Revising the manuscript critically for important intellectual content: K.R., L.S., K.S., Z.S., A.S., A.T.-F., M.Z., Z.G., P.F., A.K.-G. All authors have read and agreed to the published version of the manuscript.

Funding

This research received no external funding.

Institutional Review Board Statement

Not applicable.

Informed Consent Statement

Not applicable.

Data Availability Statement

Data supporting reported results are collected on the disc. On the request they can be shared.

Acknowledgments

The work was conducted under the project financed by Krakowski Holding Komunalny SA w Krakowie, Voivodeship Inspectorate for Environmental Protection in Krakow. Partial support from the AGH University of Science and Technology statutory tasks subsidy of the Ministry of Science and Higher Education 16.16.220.842 is kindly acknowledged. The authors thank the Voivodeship Inspectorate for Environmental Protection in Krakow and the Chief Inspectorate of Environmental Protection for the collection of PM10 samples.

Conflicts of Interest

The authors declare that they have no know conflict of interest or personal relationships that could have appeared to influence the work reported in this paper.

References

  1. Du, Y.; Xu, X.; Chu, M.; Guo, Y.; Wang, J. Air particulate matter and cardiovascular disease: The epidemiological, biomedical and clinical evidence. J. Thorac. Dis. 2016, 8, E8–E19. [Google Scholar] [CrossRef] [PubMed]
  2. Lelieveld, J.; Klingmüller, K.; Pozzer, A.; Pöschl, U.; Fnais, M.; Daiber, A.; Münzel, T. Cardiovascular disease burden from ambient air pollution in Europe reassessed using novel hazard ratio functions. Eur. Heart J. 2019, 40, 1590–1596. [Google Scholar] [CrossRef] [PubMed] [Green Version]
  3. Münzel, T.; Gori, T.; Al-Kindi, S.; Deanfield, J.; Lelieveld, J.; Daiber, A.; Rajagopalan, S. Effects of gaseous and solid constituents of air pollution on endothelial function. Eur. Heart J. 2018, 39, 3543–3550. [Google Scholar] [CrossRef] [PubMed] [Green Version]
  4. UNION; PEAN. Directive 2008/50/EC of the European Parliament and the Council of 21 May 2008 on ambient air quality and cleaner air for Europe. Off. J. Eur. Union 2008, 51, 1–361. [Google Scholar]
  5. Regulation of the Minister of the Environment of 24 August 2012 on the levels of certain substances in the air. J. Laws 2012, 1031. (In Polish)
  6. GIOS. The Annual Reports of Air Quality Measurements of Chief Inspectorate of Environmental Protection, 2010–2019. Available online: pios.gov.pl (accessed on 1 June 2021). (In Polish)
  7. WIOS. The Annual Reports of Air Quality Measurements of Voivodeship Inspectorate for Environmental Protection in Krakow, 2010–2020. Available online: pios.gov.pl (accessed on 1 June 2021). (In Polish)
  8. Maps. Openstreetmap.org. Available online: https://app.datawrapper.de/map/04BMK/basemap (accessed on 30 June 2021).
  9. Polish Committee for Standardization. Atmospheric air—Standard gravimetric measurement method for determining the mass concentrations of PM10 or PM2.5 fractions of particulate matter. PN EN 2014, 12, 341. [Google Scholar]
  10. Samek, L.; Turek-Fijak, A.; Skiba, A.; Furman, P.; Styszko, K.; Furman, L.; Stegowski, Z. Complex Characterization of Fine Fraction and Source Contribution to PM2.5 Mass at an Urban Area in Central Europe. Atmosphere 2020, 11, 1085. [Google Scholar] [CrossRef]
  11. Samek, L.; Stegowski, Z.; Styszko, K.; Furman, L.; Fiedor, J. Seasonal contribution of assessed sources to submicron and fine particulate matter in a Central European urban area. Environ. Pollut. 2018, 241, 406–411. [Google Scholar] [CrossRef]
  12. Stein, A.F.; Draxler, R.R.; Rolph, G.D.; Stunder, B.J.B.; Cohen, M.D.; Ngan, F. NOAA’s HYSPLIT atmospheric transport and dispersion modeling system. Bull. Am. Meteorol. Soc. 2015, 96, 2059–2077. [Google Scholar] [CrossRef]
  13. Major, I.; Furu, E.; Janovics, R.; Hajdas, I.; Kertész, Z.; Molnár, M. Method development for the 14C measurement of atmospheric aerosols. Acta Phys. Debrecina XLVI 2012, 46, 83–95. [Google Scholar]
  14. Goslar, T.; Czernik, J.; Goslar, E. Low-energy 14C AMS in Poznań Radiocarbon Laboratory, Poland. Nucl. Instrum. Methods Phys. Res. Sect. B Beam Interact. Mater. At. 2004, 223, 5–11. [Google Scholar] [CrossRef]
  15. Zimnoch, M.; Morawski, F.; Kuc, T.; Samek, L.; Bartyzel, J.; Gorczyca, Z.; Skiba, A.; Rozanski, K. Summer–winter contrast in carbon isotope and elemental composition of total suspended particulate matter in the urban atmosphere of Krakow, Southern Poland. Nukleonika 2020, 65, 181–191. [Google Scholar] [CrossRef]
  16. Zimnoch, M.; Samek, L.; Furman, L.; Styszko, K.; Skiba, A.; Gorczyca, Z.; Galkowski, M.; Rozanski, K.; Konduracka, E. Application of Natural Carbon Isotopes for Emission Source Apportionment of Carbonaceous Particulate Matter in Urban Atmosphere: A Case Study from Krakow, Southern Poland. Sustainability 2020, 12, 5777. [Google Scholar] [CrossRef]
  17. Mook, W.G.; van der Plicht, J. Reporting 14C activities and concentrations. Radiocarbon 1999, 41, 227–239. [Google Scholar] [CrossRef] [Green Version]
  18. Belis, C.A.; Karagulian, F.; Larsen, B.R.; Hopke, P.K. Critical review and meta-analysis of ambient particulate matter source apportionment using receptor models in Europe. Atmos. Environ. 2013, 69, 94–108. [Google Scholar] [CrossRef]
  19. Rudnick, R.L.; Gao, S. The composition of the continental crust. In Treatise on Geochemistry—The Crust; Rudnick, R.L., Holland, H.D., Turekian, K.K., Eds.; Elsevier: Oxford, UK, 2003; pp. 1–64. [Google Scholar]
  20. Paatero, P.; Tapper, U. Positive matrix factorization: A non-negative factor model with optimal utilization of error estimates of data values. Environmetrics 1994, 5, 111–126. [Google Scholar] [CrossRef]
  21. Karagulian, F.; Belis, C.A. Enhancing source apportionment with receptor models to foster the air quality directive implementation. Int. J. Environ. Pollut. 2012, 50, 190–199. [Google Scholar] [CrossRef]
  22. Manousakas, M.; Diapouli, E.; Papaefthymiou, H.; Migliori, A.; Karydas, A.G.; Padill-Alvarez, R.; Bogovac, M.; Kaiser, R.B.; Jaksic, M.; Bogdanovic-Radivic, I.; et al. Source apportionment by PMF on elemental concentrations obtained by PIXE analysis of PM10 samples collected at the vicinity of lignite power plants and mines in Megalopolis, Greece. Nucl. Instrum. Methods Phys. Res. B 2015, 349, 114–124. [Google Scholar] [CrossRef]
  23. Samek, L.; Stegowski, Z.; Furman, L.; Styszko, K.; Szramowiat, K.; Fiedor, J. Quantitative Assessment of PM2.5 Sources and Their Seasonal Variation in Krakow. Water Air Soil Pollut. 2017, 228, 290. [Google Scholar] [CrossRef] [PubMed] [Green Version]
  24. Polissar, A.V.; Hopke, P.K.; Paatero, P. Atmospheric Aerosol over Alaska—2. Elemental Composition and Sources. J. Geophys. Res. Atmos. 1998, 103, 19045–19057. [Google Scholar] [CrossRef]
  25. Manousakas, M.; Papaefthymiou, H.; Diapouli, E.; Migliori, A.; Karydas, A.G.; Bogdanovic-Radivic, I.; Eleftheriadis, K. Assessment of PM2.5 sources and their corresponding level of uncertainty in a coastal urban area using EPA PMF 5.0 enhanced diagnostics. Sci. Total Environ. 2017, 574, 155–164. [Google Scholar] [CrossRef] [PubMed] [Green Version]
  26. Juda-Rezler, K.; Reizer, M.; Maciejewska, K.; Blaszczak, B.; Klejnowski, K. Characterization of atmospheric sources at a Central European urban background site. Sci. Total Environ. 2020, 713, 136729. [Google Scholar] [CrossRef] [PubMed]
  27. Szidat, S.; Jenk, T.M.; Gäggeler, H.W.; Synal, H.A.; Fisseha, R.; Baltensperger, U.; Kalberer, M.; Samburova, V.; Reimann, S.; Kasper-Giebl, A.; et al. Radiocarbon (14C)- deduced biogenic and anthropogenic contributions to organic carbon (OC) of urban aerosols from Zürich. Switzerland. Atmos. Environ. 2004, 38, 4035–4044. [Google Scholar] [CrossRef]
  28. Amato, F.; Pandolfi, M.; Moreno, T.; Furger, M.; Pey, J.; Alastuey, A.; Bukowiecki, N.; Prevot, A.S.H.; Baltensperger, U.; Querol, X. Sources and variability of inhalable road dust particles in three European cities. Atmos. Environ. 2011, 45, 6777–6787. [Google Scholar] [CrossRef]
  29. Harrison, R.M.; Jones, A.M.; Gietl, J.; Yin, J.; Green, D.C. Estimation of the contributions of brake dust, tire wear, and resuspension to non-exhaust traffic particles derived from atmospheric measurements. Environ. Sci. Technol. 2012, 46, 6523–6529. [Google Scholar] [CrossRef] [PubMed]
  30. Klejnowski, K.; Janoszka, K.; Czaplicka, M. Characterization and Seasonal Variations of Organic and Elemental Carbon and Levoglucosan in PM10 in Krynica Zdroj, Poland. Atmosphere 2017, 8, 190. [Google Scholar] [CrossRef] [Green Version]
  31. Major, I.; Furu, E.; Varga, T.; Horvath, A.; Futo, I.; Gyokos, B.; Somodi, G.; Lisztes-Szabo, Z.; Jull, A.J.T.; Kertesz, Z.; et al. Source identification of PM2.5 carbonaceous aerosol using combined carbon fraction, radiocarbon and stable carbon isotope analyses in Debrecen, Hungary. Sci. Total Environ. 2021, 782, 146520. [Google Scholar] [CrossRef]
  32. Pio, C.; Cerqueira, M.; Harrison, R.M.; Nunes, T.; Mirante, F.; Alves, C.; Oliveira, C.; Sanchez de la Campa, A.; Artinano, B.; Matos, M. OC/EC ratio observations in Europe: Re-thinking the approach for apportionment between primary and secondary organic carbon. Atmos Environ. 2011, 45, 6121–6132. [Google Scholar] [CrossRef]
  33. Gorka, M.; Rybicki, M.; Simoneit, B.R.T.; Marynowski, L. Determination of multiple organic matter sources in aerosol PM10 from Wroclaw, Poland using molecular and stable carbon isotope compositions. Atmos. Environ. 2014, 89, 739–748. [Google Scholar] [CrossRef]
  34. Aguilera, J.; Whigham, L.D. Using the C-13/C-12 carbon isotope ratio to characterise the emission sources of airborne particulate matter: A review of literature. Isot. Environ. Health Stud. 2018, 54, 573–587. [Google Scholar] [CrossRef]
  35. Weber, S.; Salameh, D.; Albinet, A.; Alleman, L.Y.; Waked, A.; Besombes, J.L.; Jacob, V.; Guillaud, G.; Meshbah, B.; Rocq, B.; et al. Comparison of PM10 Sources Profiles at 15 French Sites Using a Harmonized Constrained Positive Matrix Factorization Approach. Atmosphere 2019, 10, 310. [Google Scholar] [CrossRef] [Green Version]
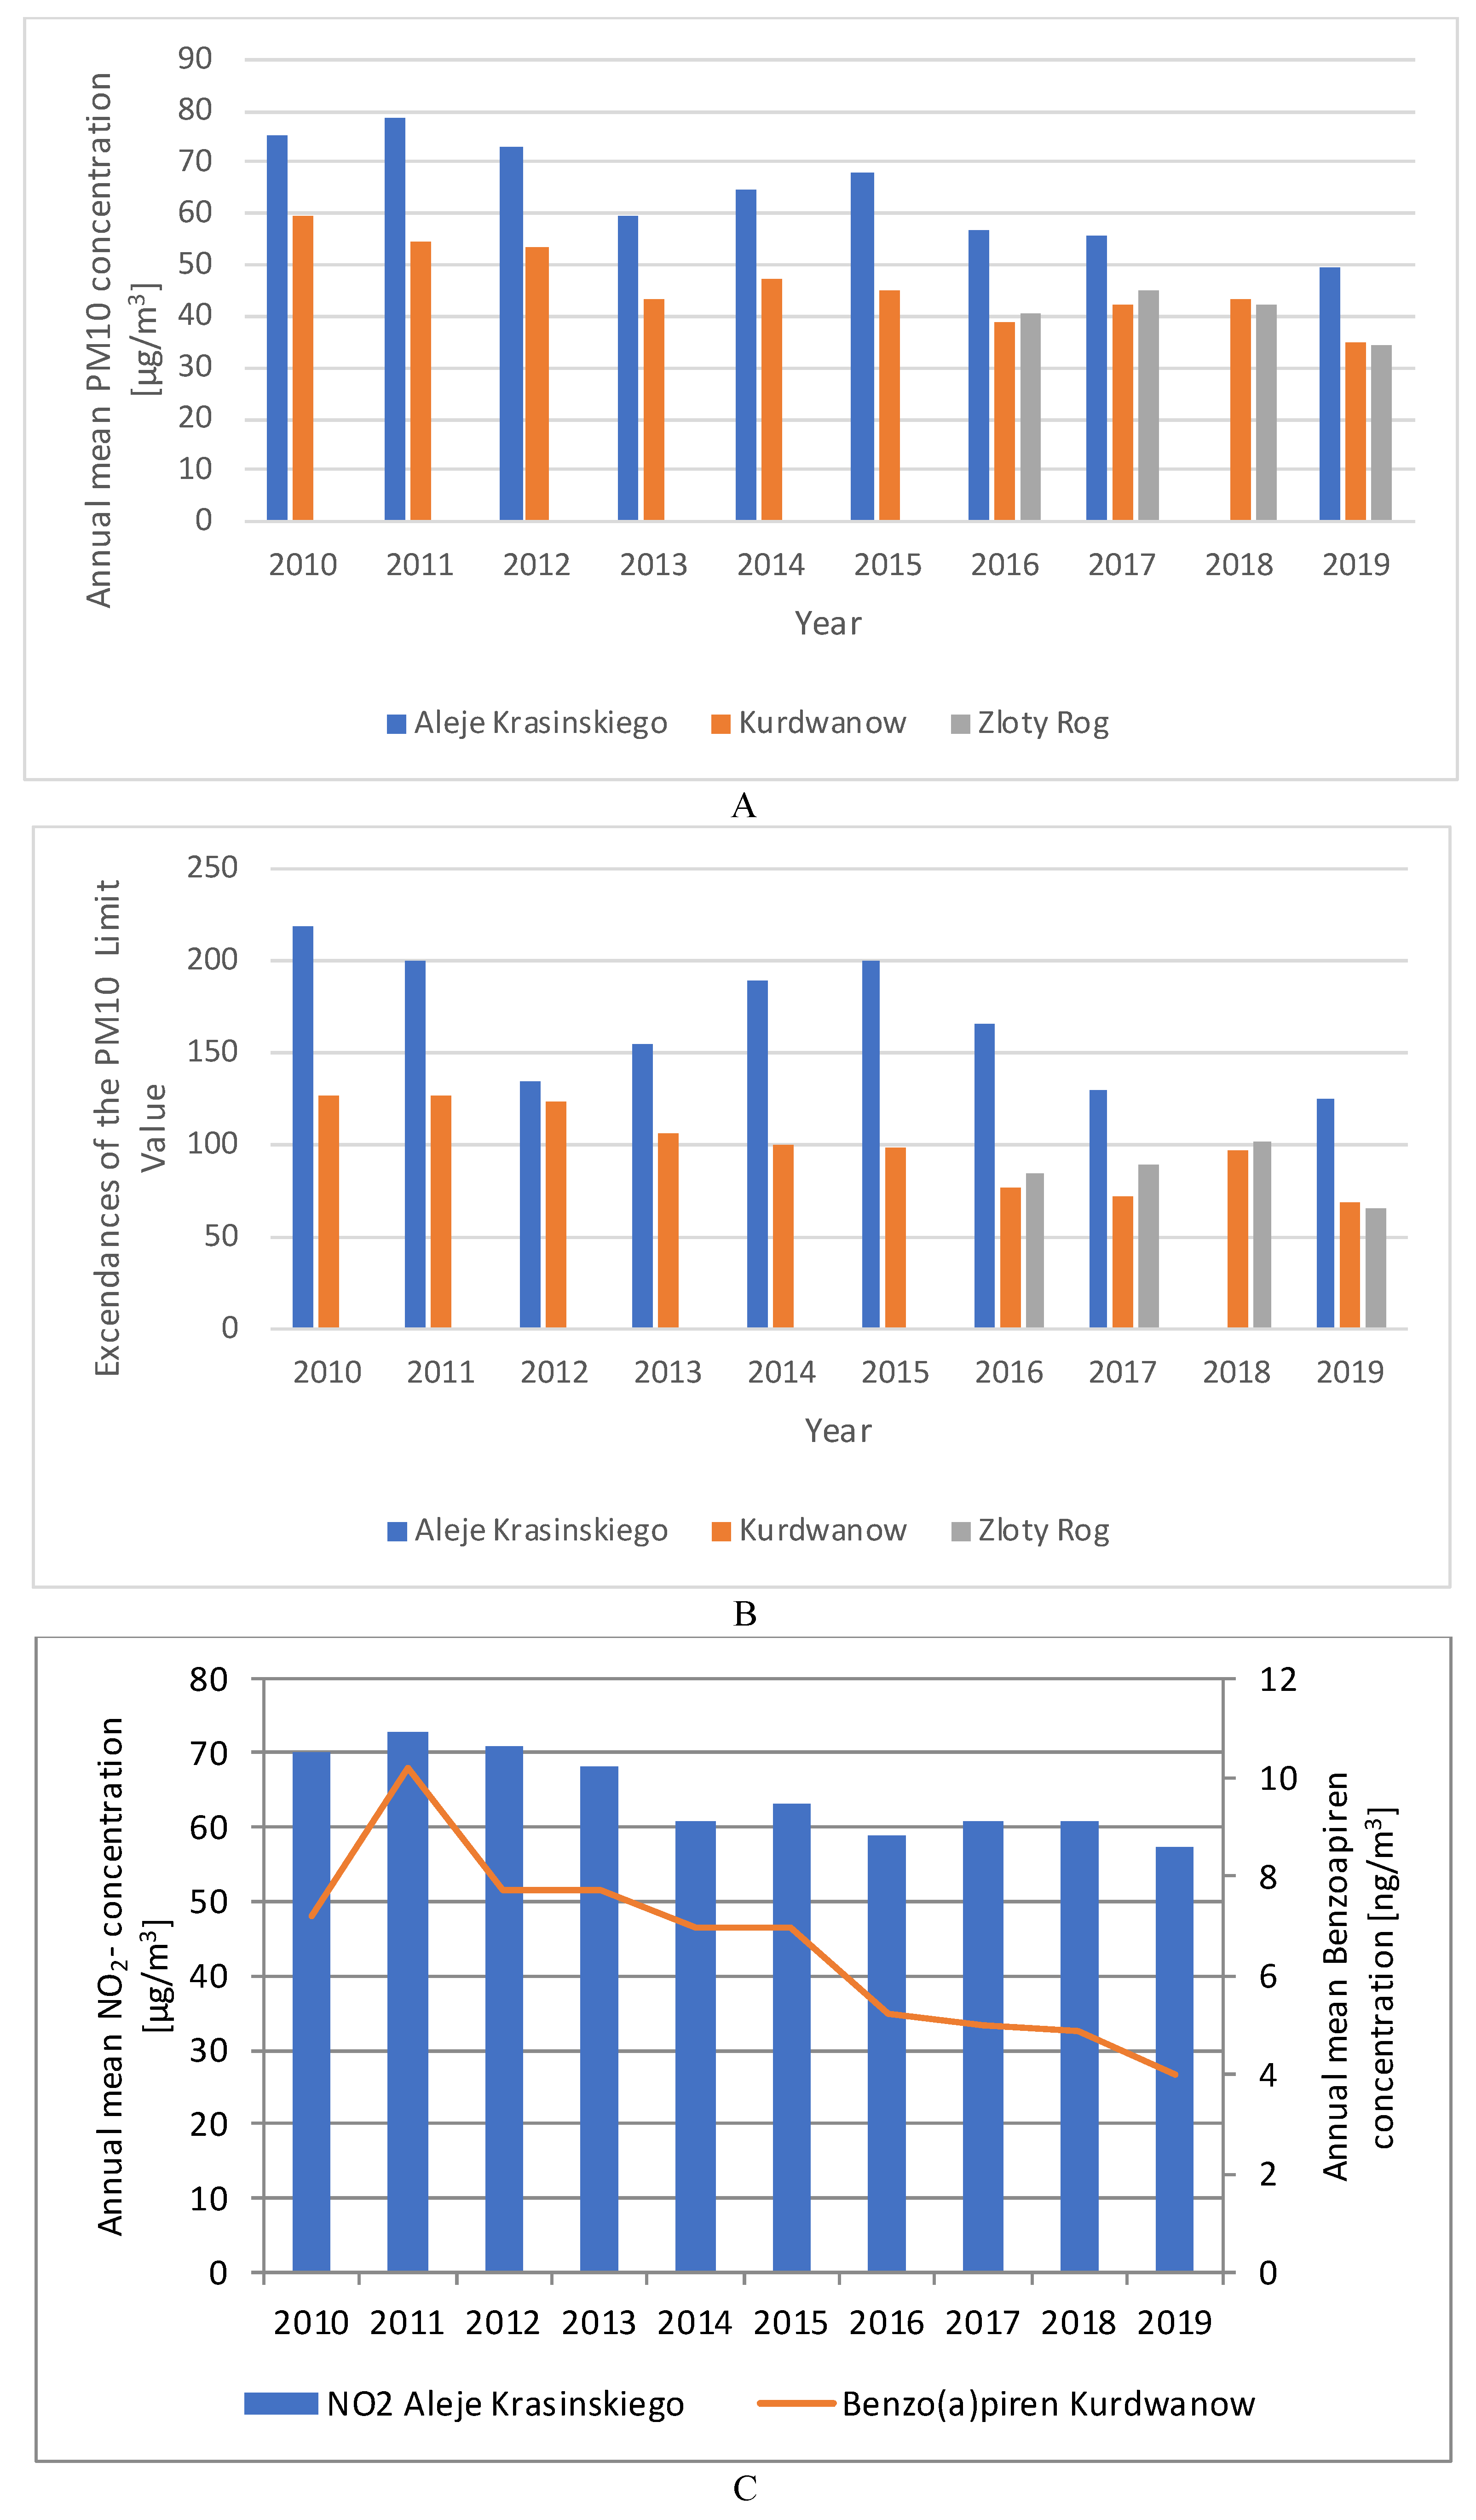
Figure 1. (A) Annual mean PM10 concentration recorded at traffic-dominated station (Aleje Krasinskiego) and urban-background stations (Kurdwanow and Zloty Rog) during last decade. (B) Exceedances of the PM10 limit value (50 µg/m3) at the same stations. (C) Annual mean concentration of NO2 (in µg/m3) at traffic-dominated station (Aleje Krasinskiego) and Benzo(a)piren (in ng/m3) at urban-background (Kurdwanow) stations. Data source: [6,7].
Atmosphere 12 01364 g001
Figure 2. The location of PM10 sampling sites in Krakow. AK—traffic-dominated site, ZR—urban-background site (Maps OpenStreetMap) [8].
Atmosphere 12 01364 g002
Figure 3. Variations of PM10 concentrations recorded at traffic-dominated (AK) and urban-background (ZR) sites during (A) summer and (B) winter season.
Atmosphere 12 01364 g003
Figure 4. Monthly contributions of carbon sources in PM10 at both stations (traffic-dominated and urban-background) (in%) calculated using isotope mass balance equations.
Atmosphere 12 01364 g004
Figure 5. Elemental Enrichment Factors for elements at traffic-dominated (AK) (A) and urban-background (ZR) (B) stations, (calculated for summer and winter seasons).
Atmosphere 12 01364 g005
Figure 6. Monthly contributions of the sources to PM10 mass at traffic-dominated (AK) (A) and urban-background (ZR) (B) stations identified through PMF modelling.
Atmosphere 12 01364 g006
Table 1. The characteristics of monthly aggregated PM10 samples (traffic-dominated site and urban-background site).
Traffic-Dominated Site
No.Aggregation PeriodNumber of Aggregated SamplesPM10
(μg/m3)
OC
(μg/m3)
EC
(μg/m3)
δ13CVPDB
(‰)
pMC
(%)
FF
(%)
11–28.06.20181540.19.626.045−28.041.658.5
21–29.07.20181535.58.535.555−28.141.858.2
322–30.11.2018854.720.726.777−28.437.262.8
41–27.12.20186100.824.588.220−26.136.763.3
510–27.01.2019765.324.085.910−25.639,660.4
61–25.02.20195112.726.4410.157−26.439.160.9
urban-background site
No.Aggregation periodNumber of aggregated samplesPM10
(μg/m3)
OC
(μg/m3)
EC
(μg/m3)
δ13CVPDB
(‰)
pMC
(%)
FF
(%)
11–28.06.20181526.87.741.265−27.955.444.6
21–29.07.20181629.18.971.595−27.858.641.4
322–30.11.2018848.517.162.830−26.752.447.6
41–27.12.20181053.621.783.718−25.840.959.1
510–27.01.2019747.222.462.416−25.142.857.2
61–25.02.2019968.523.874.697−25,840.359.7
Table 2. The contribution of carbon sources in PM10 at both stations during summer and winter season (in µg/m3 ± St.dev. and in %) calculated using isotope mass balance equations.
SourceSummer 2018Winter 2018/2019
AKZRAKZR
Biogenic and biomass burning4.9 ± 1.7 (33%)3.9 ± 0.8 (47%)9.5 ± 5.1 (32%)9.6 ± 5.3 (39%)
Hard Coal1.5 ± 1.1 (10%)0.5 ± 0.6 (5%)11 ± 5.6 (35%)10 ± 6.2 (42%)
Traffic8.5 ± 2.3 (57%)4.7 ± 0.9 (48%)11 ± 6 (33%)4.7 ± 3.6 (19%)
Table 3. Sources of PM10 identified by PMF.
Identified SourceChemical Species Identifying Source
Fossil Fuel CombustionCl, NO3, Na+, OC, EC
Secondary Inorganic AerosolsNO3, SO42−, NH4+
Traffic ExhaustEC, SO42−, NO3, NH4+, OC, Ti, Cu, Fe, Co
SoilPO43−, Ni, Na+
Road Dust, Industry, Construction workCa, Ti, Co, Cr, Fe, Mn, Zn, Cu, EC
Table 4. Contribution of different sources to PM10 mass identified through PMF modelling during summer 2018 and winter 2018/2019 (in µg/m3 ± St.dev. and in %).
SourceSummer 2018Winter 2018/2019
Traffic-Dominated (AK)Urban-Background (ZR)Traffic-Dominated (AK)Urban-Background (ZR)
Fossil Fuel Combustionnd2 ± 1 (8%)7 ± 4 (10%)20 ± 8 (36%)
Road dust, Industry, Construction work11 ± 8 (32%)13 ± 7 (48%)18 ± 12 (24%)5 ± 5 (8%)
Soil3 ± 2 (9%)2 ± 2 (8%)5 ± 4 (7%)4 ± 4 (7%)
Secondary Inorganic Aerosols2 ± 2 (5%)4 ± 3 (16%)21 ± 19 (28%)16 ± 10 (29%)
Traffic exhaust17 ± 5 (48%)1 ± 1 (4%)18 ± 10 (24%)9 ± 5 (16%)
Non identified2 ± 1 (6%)5 ± 2 (19%)6 ± 3 (8%)2 ± 1 (4%)
nd-not determined; St.dev.—The variability of contribution of sources in measured period.
Publisher’s Note: MDPI stays neutral with regard to jurisdictional claims in published maps and institutional affiliations.