Article

Relationships among Indoor Radon, Earthquake Magnitude Data and Lung Cancer Risks in a Residential Building of an Apulian Town (Southern Italy)

1
Interdisciplinary Department of Medicine, Section of Occupational Medicine, University of Bari, Piazza Giulio Cesare 11, 70124 Bari, Italy
2
Occupational Medicine Unit, University Hospital of Bari, Piazza Giulio Cesare 11, 70124 Bari, Italy
3
Regional Agency for Environmental Protection—Agenzia Regionale per la Protezione Ambientale (ARPA) Puglia Corso Trieste, 27, 70126 Bari, Italy
4
Coing Soc Coop a RL, Via dei Mestieri snc, 75100 Matera, Italy
5
Stam S.r.l., Piazza della Vittoria, 14/11, 16121 Genova, Italy
*
Author to whom correspondence should be addressed.
Atmosphere 2021, 12(10), 1342; https://doi.org/10.3390/atmos12101342
Submission received: 2 September 2021 / Revised: 6 October 2021 / Accepted: 10 October 2021 / Published: 14 October 2021
(This article belongs to the Special Issue Atmospheric Radon Measurements, Control, Mitigation and Management)

Abstract

:
(1) Background: The association of radon-222 with lung cancer is well studied. The aim of the study was to validate a model of indoor radon measurements, to apply radon software to estimate lung cancer cases that are attributable to radon and to study the relationship between radon and earthquakes. (2) Methods: Different data detectors were used to obtain radon measurements in different places. Continuous data collection and predictions of indoor radon concentrations were carried out. Software was used to assess radon-attributable lung cancer cases, and data related to earthquake magnitudes were downloaded from Italian Vulcanology Institute. (3) Results: As expected, the highest radon concentrations were observed on the ground floor (232 ± 232 Bq/m3), with higher values measured during winter than in other seasons. The comparison of the detectors showed the overlapping of the two detectors-measured data sets. The cases of lung cancer that were attributable to radon in Locorotondo were studied (3.66/10,000). From the multivariate analysis of the relationship between high radon concentrations and high earthquake magnitude values, they show statistically significant ORs of just over 1. (4) Conclusions: Although the measured values are, on average, within the reference level, prevention measures must be implemented, as the measured radon values allow us to estimate an expected value of 3.66 cases of lung cancer per 10,000 people in the resident population.

1. Background

Radon is a naturally occurring radioactive noble gas. Globally, the products of radon decay are responsible for approximately 50% of the effective dose of radiation that every person receives due to exposure to natural sources of radiation [1].
Radon (222Rn) has a half-life of 3.82 days. The biological damage induced by alpha particles was analytically described in Biological Effects of Ionizing Radiation BEIR VI (BEIR VI)] [2]. Radon is classified as a group 1 carcinogen (carcinogenic to humans) by IARC [3]. Radon exposure is the second leading cause of lung cancer [4,5,6]. Low and average concentrations of radon may cause most radon-induced lung cancers because high concentrations of radon in indoor environments are rare [7]. The “stochastic” effects of radon exposure represent the “precautionary principle” [2].
A higher risk of lung cancer associated with residential radon exposure has previously been described [8,9,10,11,12,13,14,15,16,17]. In addition to other oncological diseases related to the respiratory system (mesothelioma) [18] and lung cancer (LC) resulting from exposure to radon, various genetic polymorphisms have been studied that may be involved in the development of lung cancer in carriers that contribute to the susceptibility of individuals to LC. Effect modifications have been observed between some polymorphisms and residential radon, such as the one on chromosome 15q25.1, a well-known LC susceptibility region [19,20,21]. The incidence rates of chronic lymphocytic leukemia (CLL) among US states have been reported to be significantly correlated with the levels of residential radon (RR) [22]. Radon is the main cause of the onset of pulmonary neoplasia after cigarette smoking [23]. The World Health Organization (WHO) noted that indoor radon exposure causes 3% to 14% of lung cancer cases worldwide [24,25]. According to current estimates by the US Environmental Protection Agency (EPA), each year, approximately 21,000 lung cancer deaths in the United States are associated with radon exposure [26]. In 2012, 17% of lung cancer cases in Alberta were found to be attributable to residential radon exposure [27]. Occupational exposure to high concentrations of radon has also been demonstrated to increase the risk of lung cancer in non-smokers [28], and the effects of occupational exposure to radon have also been described in the mining industry [29,30,31,32,33,34,35].and in other workplaces [36].
Recently some studies have discussed the so called “radon effect” as the long-term radon residential exposure estimates may be subject to errors due to different methodology for radon risk assessment and for retrospective assessment of smoking habits [37,38,39]. Likewise, other studies applying various statistical methods and considering additional carcinogenic risk factors and risk modifiers or confounding factors (gender, age, smoke habits, ultraviolet B (UVB), elevation of inhabited dwellings) found that the relative risk of lung cancer is independent of low radon concentration below about 800 Bq/m3 [40,41,42].
Nevertheless, it is currently necessary to comply with the reference levels established by the international and national regulatory agencies in compliance with the As Low As Reasonably Achievable (ALARA) principle [24,43].

1.1. Indoor Exposure to Radon

The carcinogenic risk associated with buildings in the past was linked to the presence of asbestos [44]. To date, however, the focus is on indoor exposure to radon [7,8,9,10,45,46,47,48,49].
Reference Level. Following the results of numerous epidemiological studies carried out in the last 20 years and the consequential re-evaluation of the risk of lung cancer associated with exposure to radon in homes, in 2009, the World Health Organization [24] published the report “WHO Handbook on Indoor Radon: A Public Health Perspective”, in which it was recommended that countries possibly adopt a reference level of 100 Bq/m3 or, in any case, a reference level no higher than 300 Bq/m3. According to EURATOM, the National Radon Plan and Apulian regional law (2016 n. 30; modified in 2017), as well as then also taken up nationally by the legislative decree 101/2020 the reference level indoor radon concentration in Apulia is 300 Bq/m3 [43,50,51]. Because of the stochastic relationship between exposure to radon and cancer, previous studies have reported methods for estimating lung cancer cases that are attributable to radon [49].

1.2. Earthquakes and Radon

Anomalous increases in radon concentrations have been determined before and after the occurrence of earthquakes [52,53,54,55,56]. The 2012 Pollino (Calabria, Italy) seismic sequence, culminating in a moment magnitude (Mw) 5.2 earthquake on 25 October 2012, was investigated by exploiting data collected during a long-term continuous radon monitoring experiment performed in the epicentral area from late 2011 to the end of 2014, this work has identified characteristic variations in radon exhalations during the preparation processes of large earthquakes [57]. The necessity of continuous monitoring of atmospheric radon concentrations combined with statistical anomaly detection methods to evaluate future seismic risks [45,52,58,59,60], as well as low-cost radon monitoring methods and the application of expert systems to the prevention of indoor radon gas exposition risks, have been reported [61,62,63,64].

1.3. Aims

This study was carried out within the CARQUAI project (the Italian acronym of Contaminazione Ambientale Radon Qualità dell’Aria Indoor or Environmental Radon Contamination Indoor Air Quality). CARQUAI is an intelligent system used for the detection, monitoring and optimization of the indoor air quality (IAQ) parameters of buildings, through the instrumentation used in the model that includes CO2, air pollutants, microclimate and lighting detectors, and concentrations of radon gas.
The study aims were:
  • to validate a model of indoor radon measurements,
  • to apply our radon software for the estimation of lung cancer cases attributable to radon and
  • to study the relationship between radon and earthquakes.

2. Methods

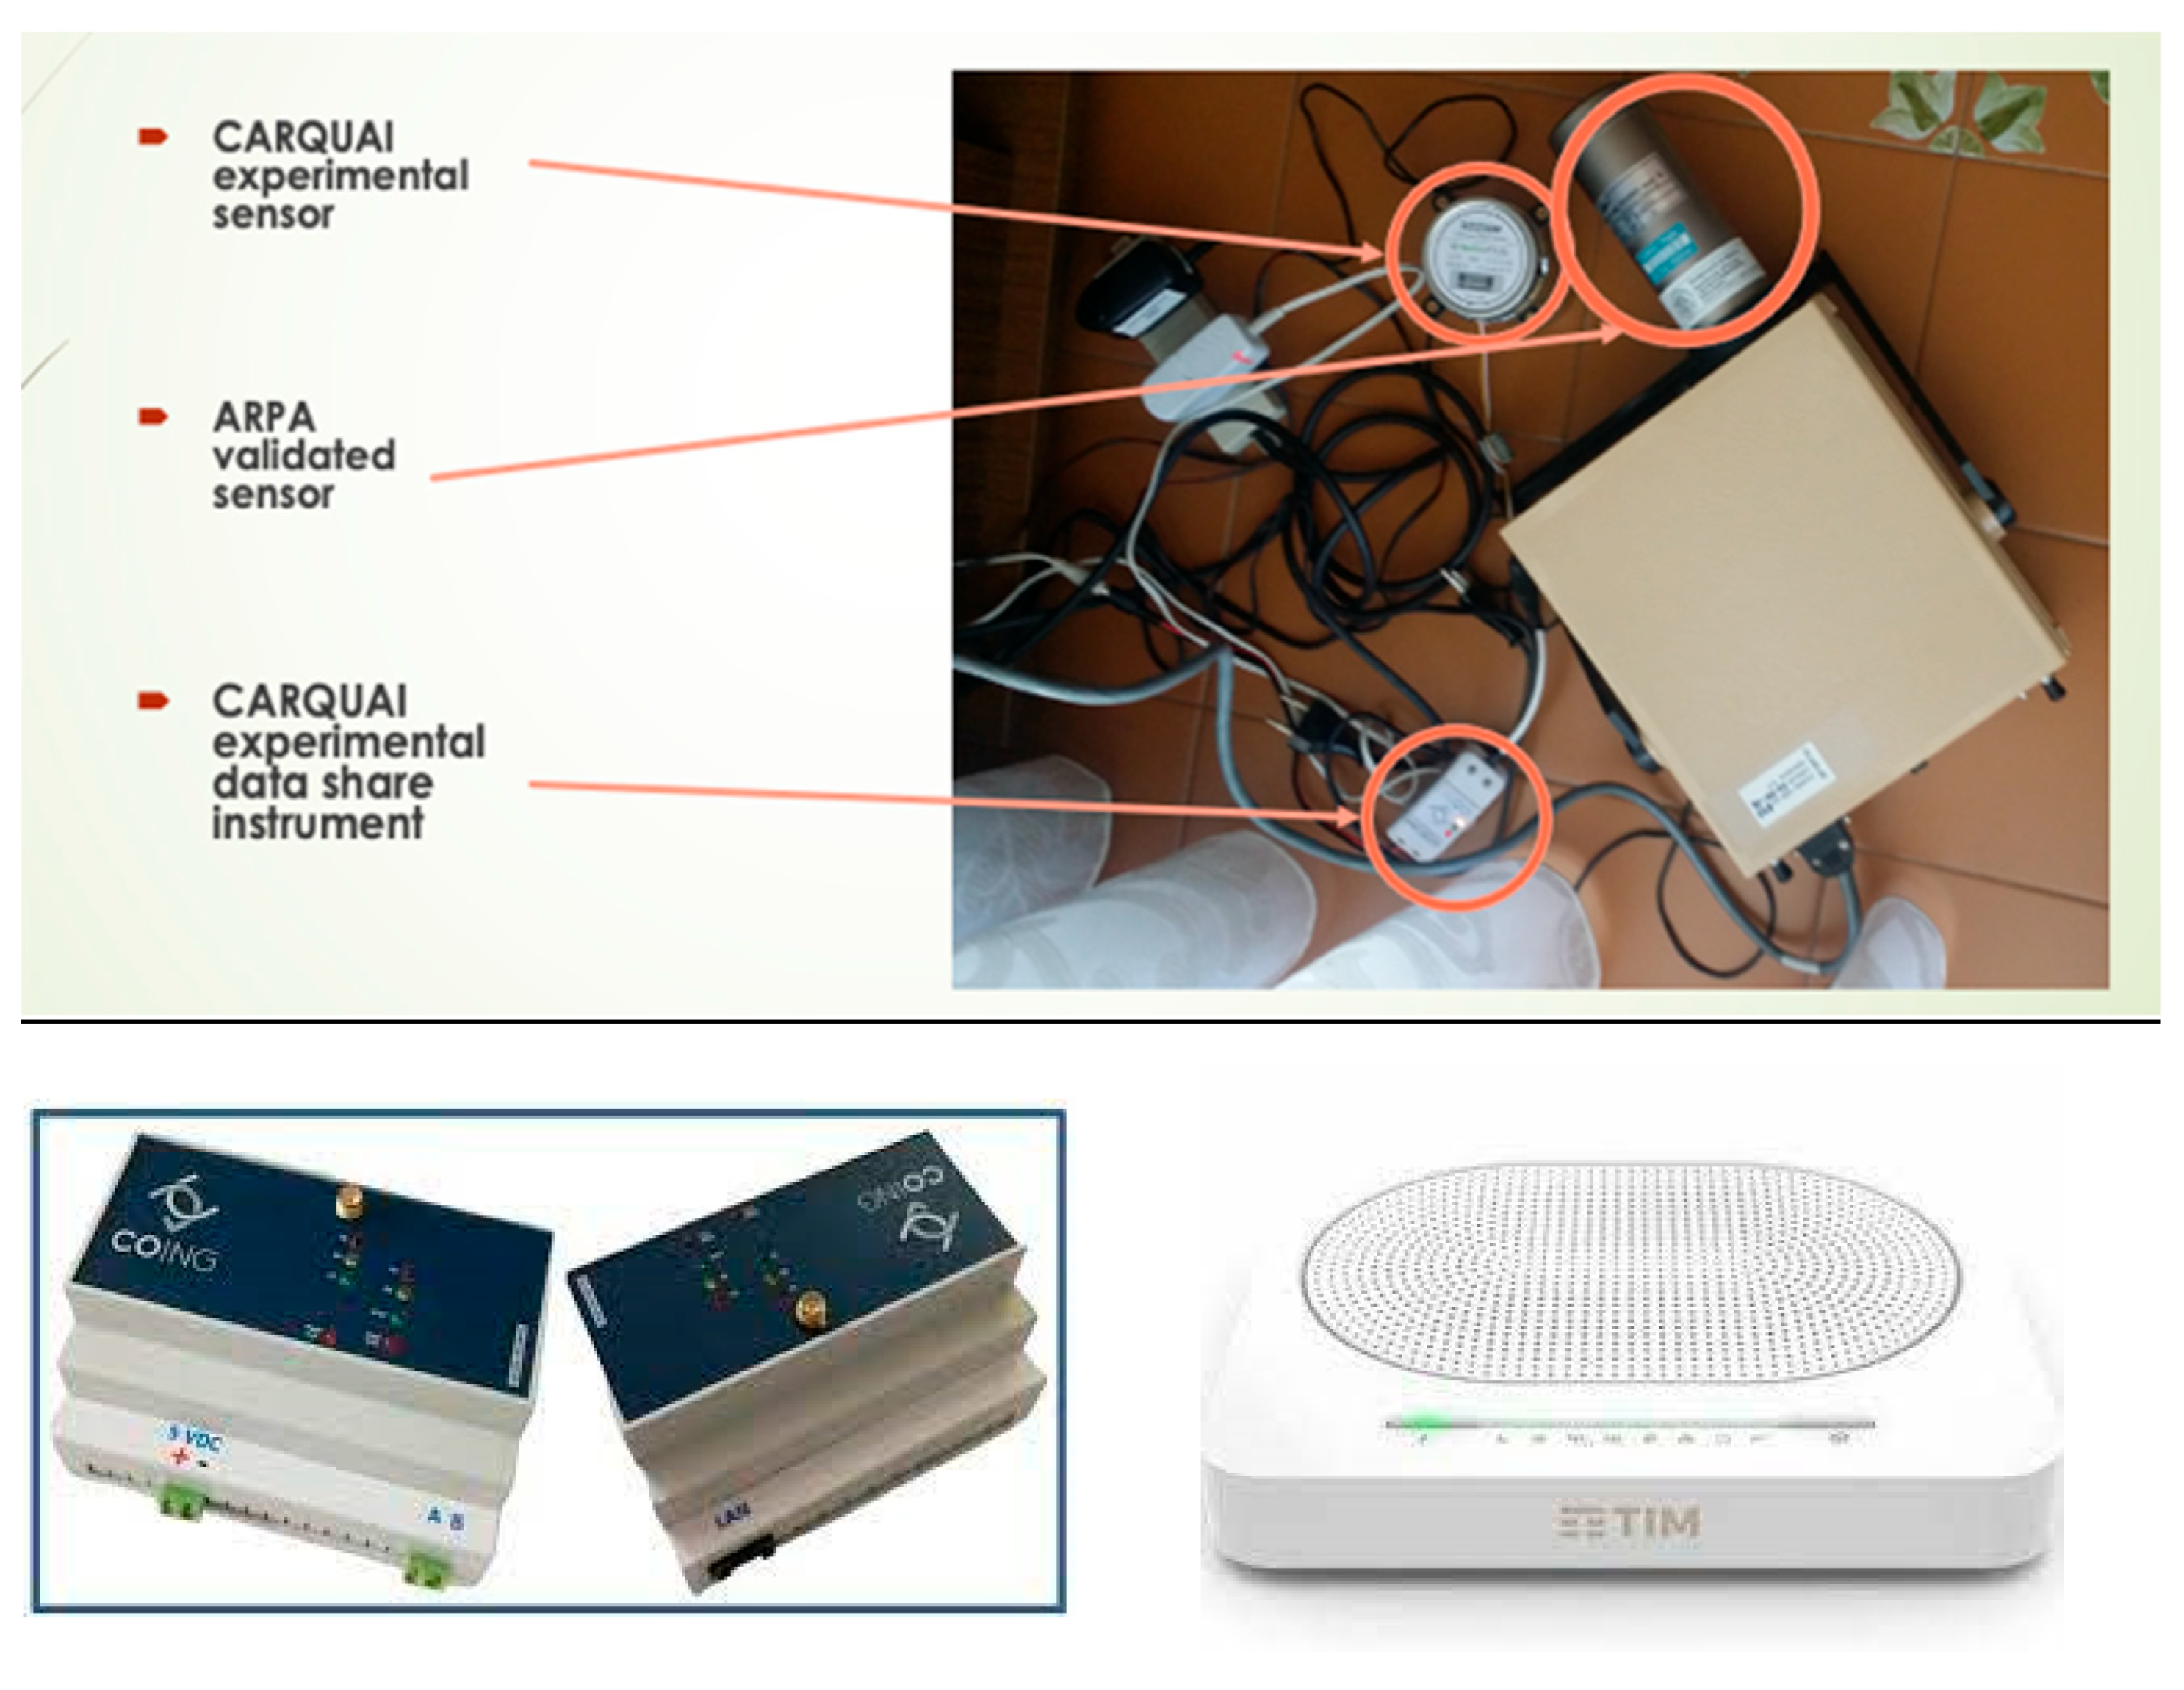
2.1. Environmental Radon Measurements

Radon Detectors Used in This Study Technical Characteristics

The CARQUAI active detector (RD200M detector). Produced and calibrated to traceable international standards (ISO 11665-8-2019) by Radon FT Lab Radon Testing Laboratory in Korea (KTL,503ho, 8, 330gil, Haebong-ro, Danwon-gu, Ansan-city, Gyeonggi-do, South Korea). This detector is optimized for the IAQ monitor, air purifier, radon detector and auto ventilation system.
The measurement type of these detectors represents pulsed ion chambers; the first data are out in <60 min; the data interval represents a 10-min update (60-min moving average); the sensitivity is 0.37 cpm/Becquerel m3; the operating temperature range is 10~40 °C, and that of RH is <80%; the data range is 0.37~3700 Bq/m3; the reproducibility is <±10% at 0.37 Becquerel Bq/m3; the accuracy is <±10% (with a minimum error <±0.018 5 Becquerel Bq/m3); the size is Φ68 (mm) × 98 (mm) and the data communication is conducted with a UART.
Continuous Radon ARPA (regional environmental protection agency) detector.
Model AB-5 Portable Radiation Monitors (PYLON ELECTRONICS INC. 147 Colonnade Road, Ottawa, Ontario K2E 7L9 Canada) are versatile instruments used for the fast and accurate measurement of environmental radiation levels.
Scintillation cells. Lucas ZnS (Ag) scintillation cells (Nuvia Italia srl c/o JRC—TP800 Via E. Fermi, 2749 21027 Ispra (VA)) are frequently used to measure radon gas [65,66].
Gateway. The Gateway device is the central element of the CoLoRa network, a protocol that enables Multi-Packet Reception (MPR) in LoRa (Long Range), and is necessary to put the LoRa network nodes in communication with the Cloud. The main modular features that make up a specific device are as follows: cloud connection via LAN, GSM, NBIoT or Wi-Fi.
Wi-Fi system. A local Wi-Fi Smart Modem Wi-Fi for ADSL and fiber correlated to the home telephone line in use. This system allows high-speed and wireless navigation using the Wi-Fi interface or through four Ethernet ports. Regarding security, WPA and WPA2 encryption prevents unauthorized access to the Wi-Fi network, and advanced features such as MAC are included (Figure 1).
We used two detectors, the CARQUAI active detector (RD200M) and the continuous Radon ARPA detector, simultaneously in the site identified for the validation procedure of the CARQUAI (RD200M) detector. ARPA continuous radon detector is the reference detector (gold standard).
The CARQUAI (RD200M) detector was tested on the ground floor in a residential home in the municipality of Locorotondo in the province of Bari, at an elevation of 410 m. From the geological structural map, it appears that Locorotondo it is placed on a carbonate platform (Middle Jurassic, Upper Cretaceous) micritic limestone and bioclastic calcarenite laminate well stratified irregularly alternated with dolomicrite layers and subordinately with biostromal and rudist banks (https://www.isprambiente.gov.it/files2017/pubblicazioni/periodici-tecnici/memorie-descrittive-della-carta-geologica-ditalia/volume 92/tavole/memdes_92_tav_1_carta_geologica%20.pdf (accessed on 9 October 2021)).

2.2. Web Cloud System and Access with a Smartphone App

The model used in this study monitors the indoor environment through an intelligent system in continuous acquisition mode based on the results obtained from the monitoring history. In addition, the instrumentation used in the model includes CO2, air pollutants, microclimate and lighting detectors to prevent future building-related illnesses. The monitored data arrive in the cloud, where they are stored and elaborated. Additionally, future radon predictions based on the received data are carried out on the cloud. Access to this cloud is also possible with a smartphone.

2.3. Software Used for Estimating Radon-Attributable Lung Cancer

The estimates were obtained using software realized by our operative unit. The realization of the software was finalized to represent a flexible tool that is easy to use and is based on a data set for each municipality. The software calculated the expected annual tumor cases resulting from radon out of 10,000 cases. The software is extremely intuitive. It was developed in Microsoft Access 2010 (Microsoft Corporation, Redmond, WA, USA) and works with Microsoft Windows operating systems, versions XP and later. A table was created in Access with the calculated fields related to the following parameters:
(1)
the population of the municipality;
(2)
C (the average annual concentration (Bq/m3));
(3)
F (the equilibrium factor);
(4)
N (the number of hours recorded in a year);
(5)
EEC (the equilibrium equivalent radon concentration at 1 WLM (working level month));
(6)
P (the probability of lung cancer in excess).
A management mask was set up for the insertion/modification/searching of data related to the referenced municipality. Once the data entry process was complete, the “Calculate the Estimation” button was clicked to produce the estimate.
The data produced by the software were as follows:
(1)
the annual cumulative concentration (Bq/m3);
(2)
EEC1;
(3)
210Po (Ca);
(4)
214Pb (CB);
(5)
214Bi (Cc);
(6)
WLM;
(7)
estimates of the annual number of lung cancer cases attributable to radon.
This model was derived from a model used in a cohort study on miners working in underground uranium mines, performed by the “Health Sciences Center” of the University of New Mexico [67]; this model was used in Italy in a previous study [68].
Factor significance. The working level month (WLM) represents the cumulative exposure [evaluated over the entire lifetimes of mining workers] of 1 WL for 1 working month of 170 h and represents the conventional unit of exposure. One working level (WL) is any combination of radon progeny in 1 L air that ultimately releases 1.3 × 10⁵ MeV of alpha energy during decay.
In the model, the following factors are also used:
  • the probability of excess lung tumors resulting from annual exposure to 1 WLM (18–64 years) = 2.83/10,000;
  • F (equilibrium factor) = EEC × C−1;
  • CA (210Po unstable decay product of radon); CB (214Bi unstable decay product of Radon);
  • Cc (214Pb stable decay product of radon);
  • C (average annual concentration);
  • Ccum (average annual cumulative exposure);
  • EEC (radon concentration equivalent to equilibrium) = C × F (in this study, this value is estimated to be 6.3 × 10⁵ Bqh/m3).
  • The EEC value is equal to 0.10CA + 0.52CB + 0.38Cc. These units and factors are useful for estimating lung cancer cases that are attributable to radon [49,67,68,69].

2.4. Earthquake Data

The National Institute of Geophysics and Volcanology (INGV) seismic center collects data related to Italian earthquakes by means of different allocated seismographs and produces a collection of available data to obtain relative seismograms. All the data are transformed in magnitude (Richter’s local magnitude (mL); body waves magnitude (Mb); and moment magnitude (Mw)). The magnitude data used in this study were downloaded from the INGV web page. Data related to the period from January to October of 2020 were downloaded.

2.5. Statistical Analysis

We used STATA 12 software (StataCorp LLC 4905 Lakeway Drive College Station, Texas 77845-4512 USA) for the statistical analysis in this study. Histograms and summary statistics of all continuous variables were produced to assess their Gaussian or non-Gaussian distributions, and end-log transformations of non-Gaussian distributions were carried out. Magnitude data and radon exposure measurements were dichotomized at 2.7 m (75th percentile) and 553.15 Bq/m3 (90th percentile). The risk (odds ratios) of observing earthquake measurements higher than 2.7 m with radon concentration measurements above 553.15 Bq/m3 and Cornfield’s approximation, χ2, were calculated. Additionally, distributional box plot graphics and median spline distributions were produced. The adjusted multivariate analysis was carried out by means of a logistic regression model. This model is based on Magnitude (>2.7 mL) as depended variable and on the radon exposure ≥ 557 Bq/m3, Humidity, Temperature, Season as independent variables. Furthermore, the adjusted risks (ORs) were evaluated also for dummy variables of the Season independent variable (Winter, Spring, Summer, Autumn).

3. Results

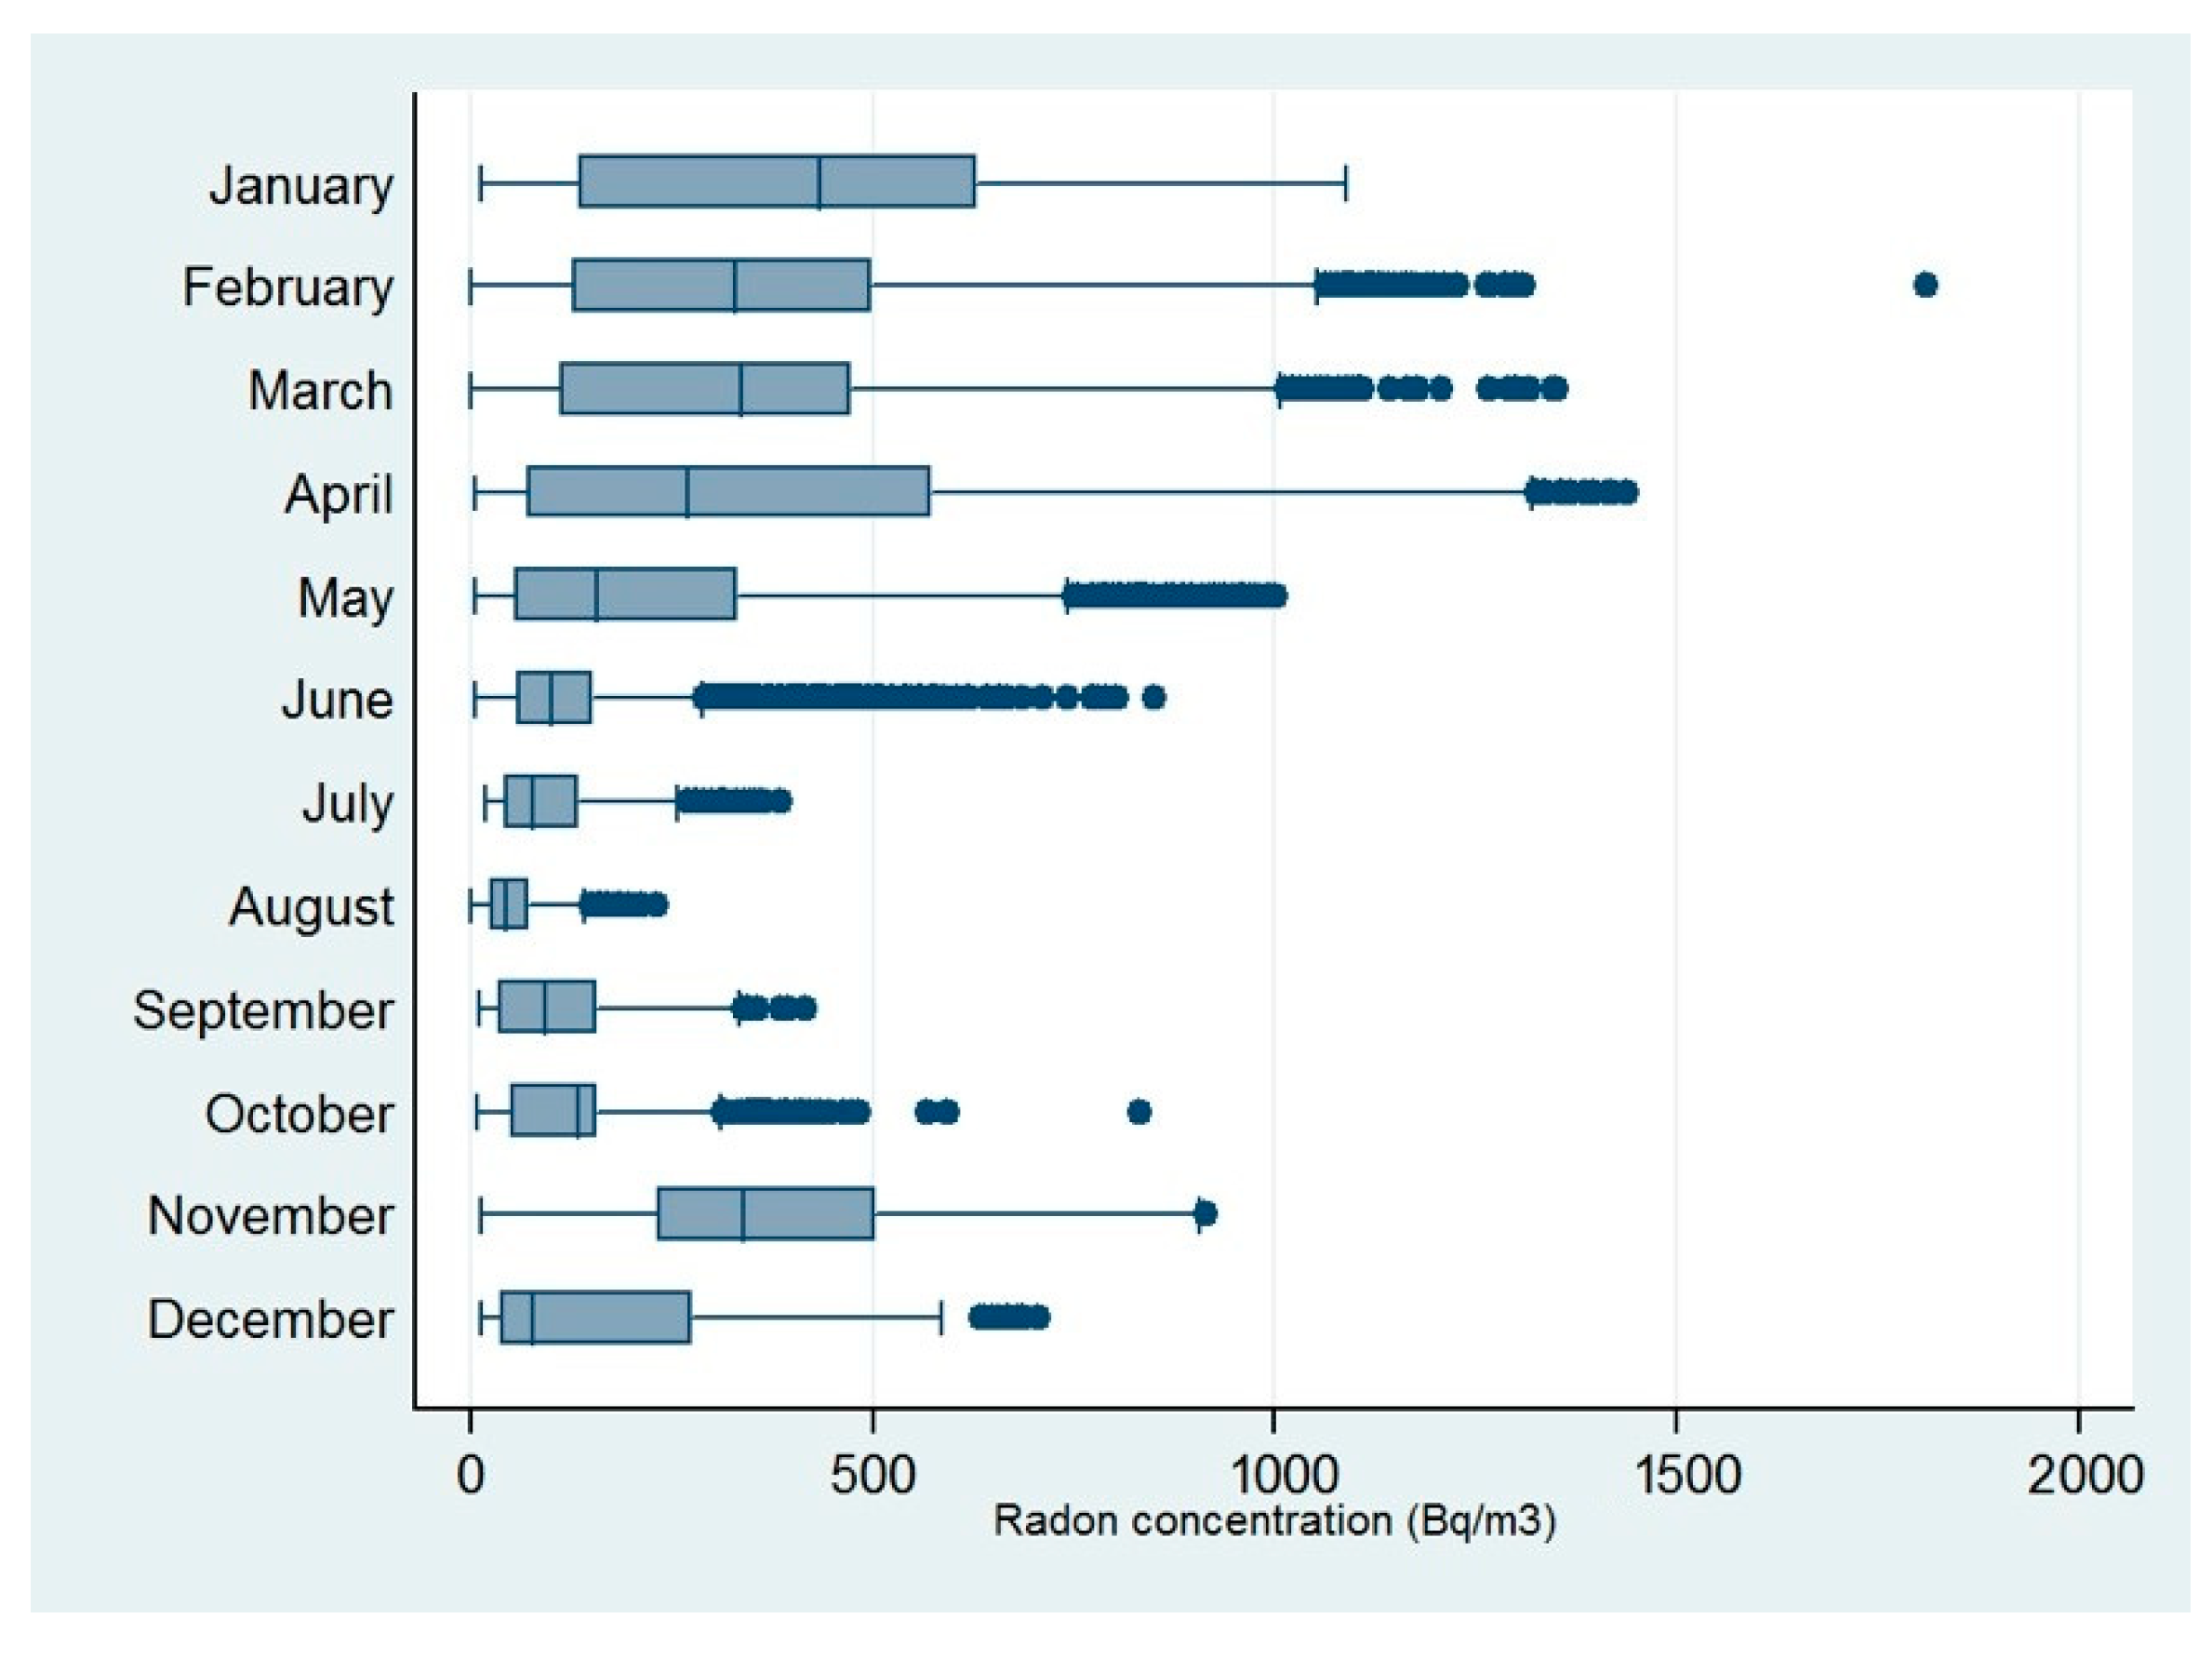
3.1. Radon Measurements

The radon values measurements were carried out simultaneously by the two ARPA and CARQUAI detectors for the validation procedure of the CARQUAI prototype.
The radon measurements recorded on the ground floor of the residential building in Locorotondo (Ba), were often above the reference level of 300 Bq/m3, with maximum values over 1000 Bq/m3, the measurements were higher during the first four months of study and in November (Table 1 and Figure 2).
Additionally, the median values of the first three months were higher than the remaining months (Table 1).

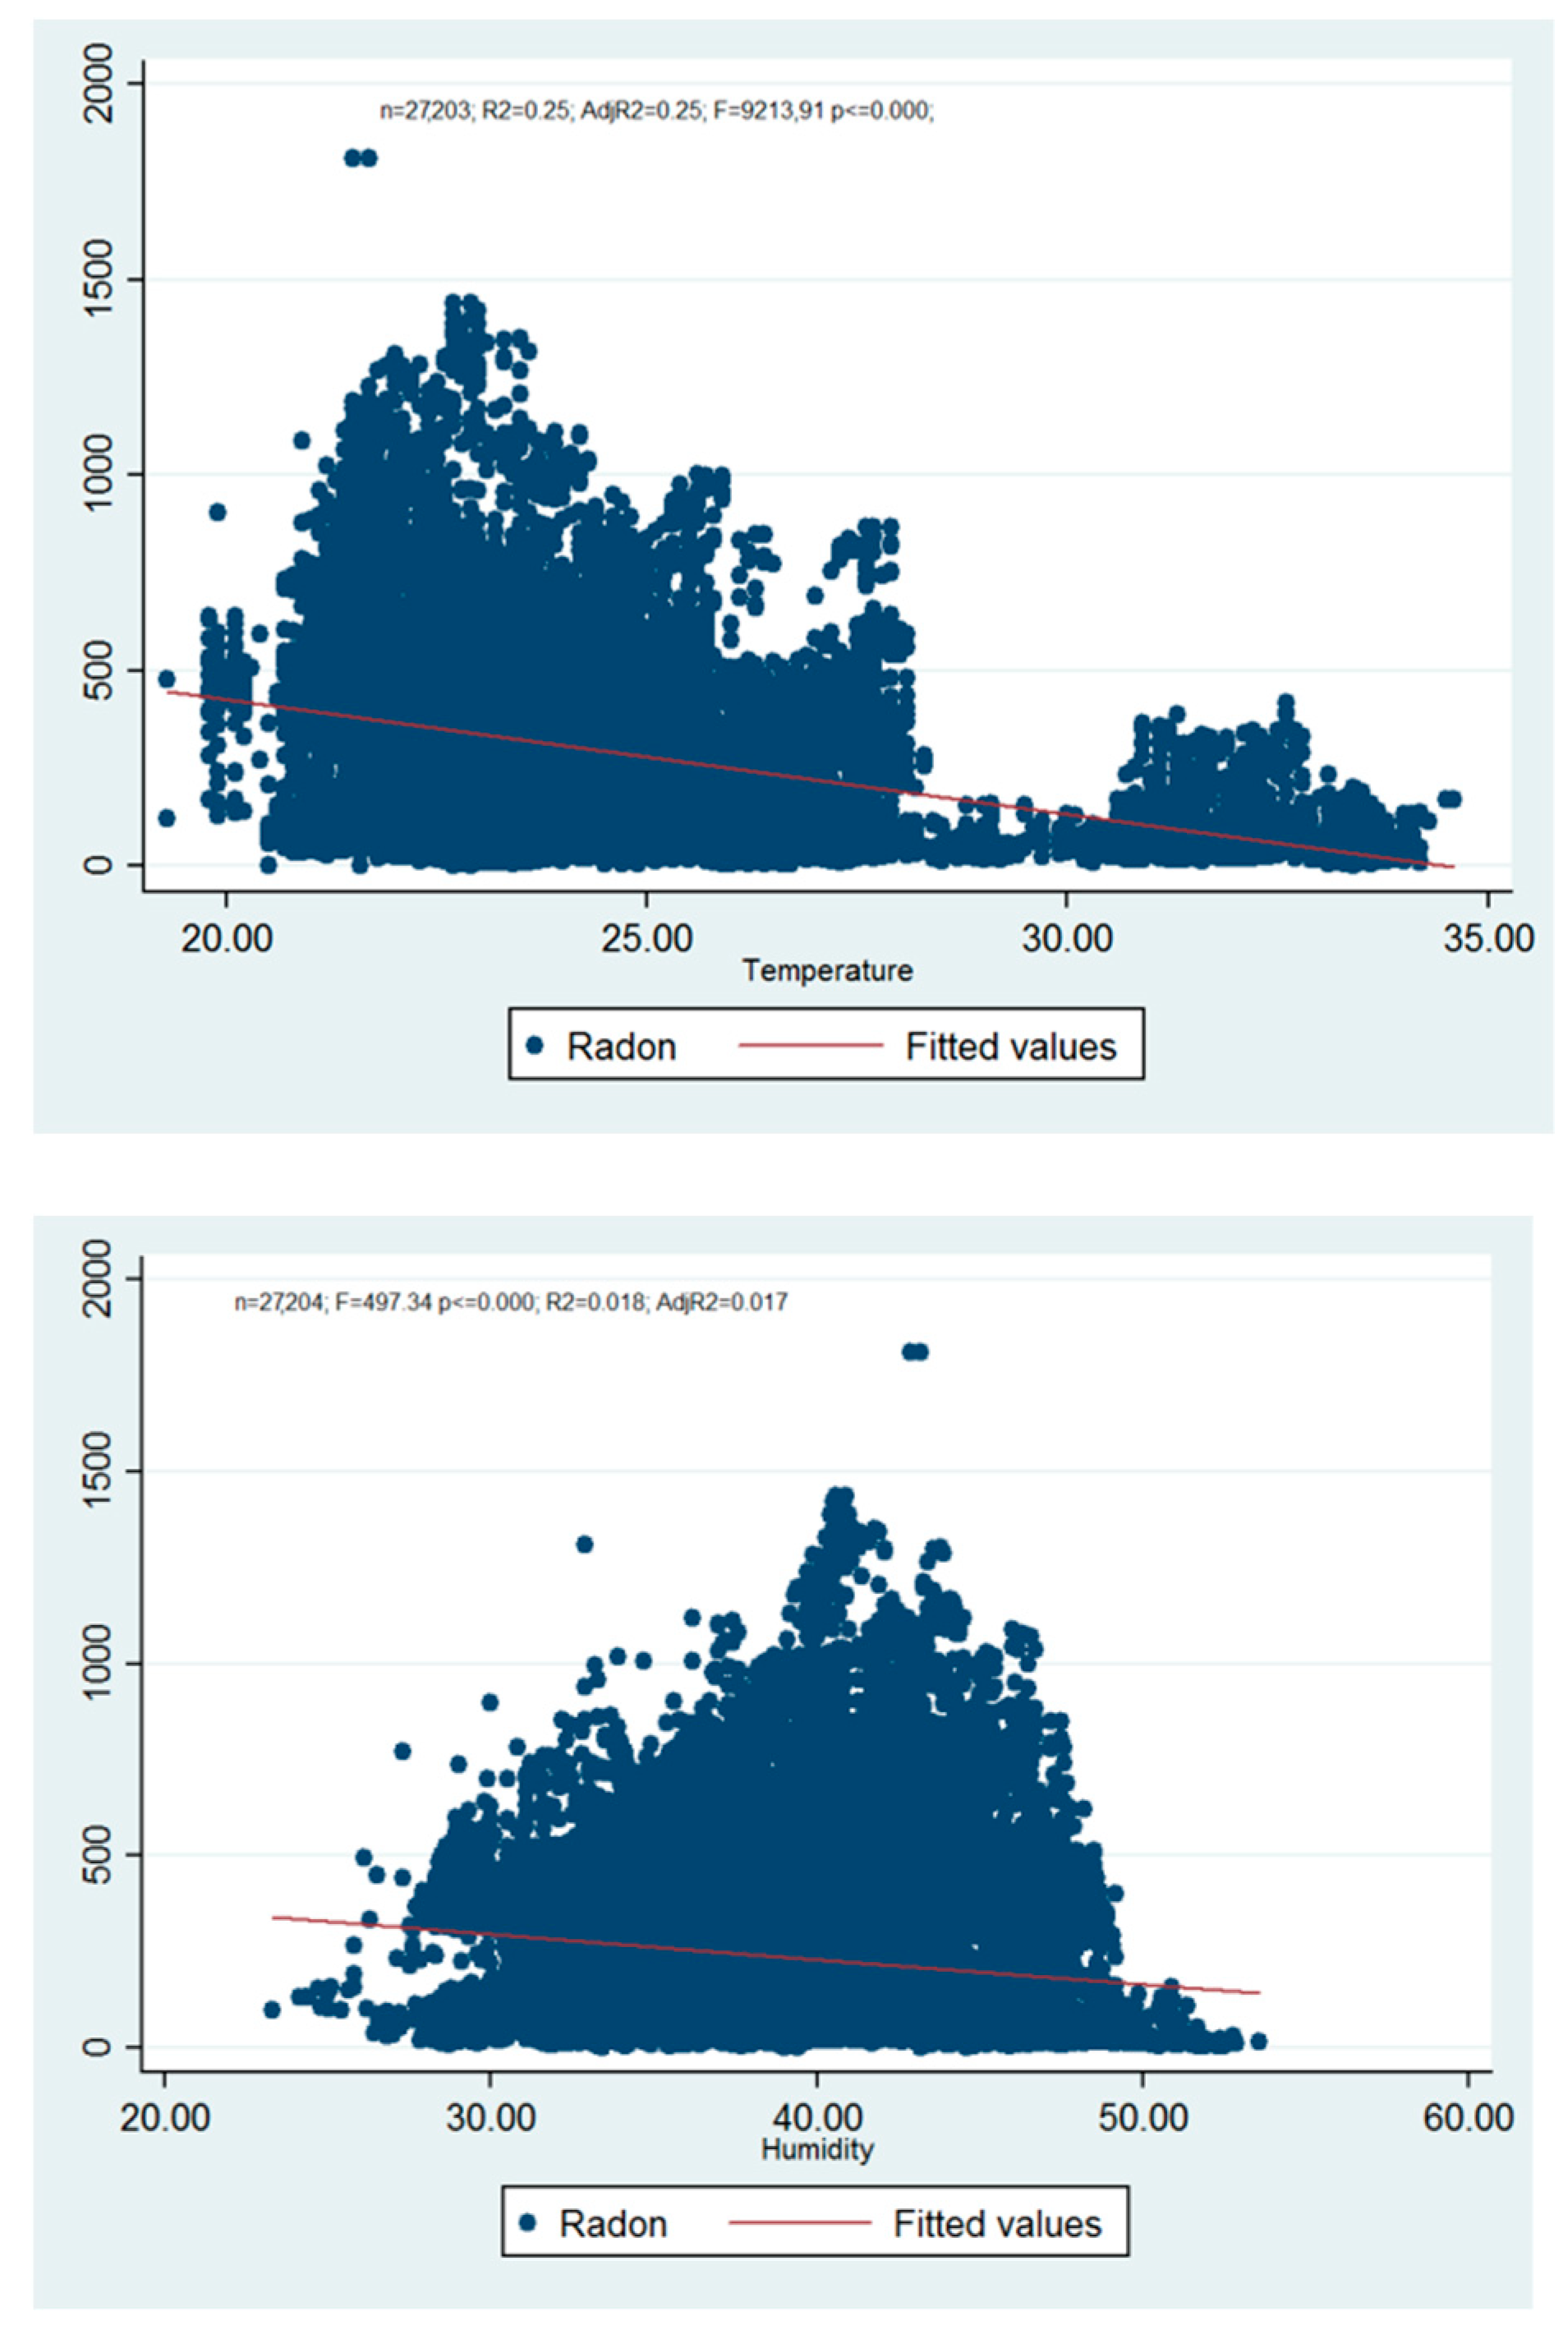
3.2. Temperature and Humidity

The temperature and humidity data were normally distributed. The temperature measurements were highest from July to September, and the humidity measurements were low only in February, March and April (Table 2 and Figure 3).

3.3. Radon Data Measurement Evaluation

The distribution of the radon data was absolutely non-Gaussian, with very strong asymmetry (skewness = 1.41) and a heavy right-tailed distribution (kurtosis = 5.14). There was also an evident strong difference between the mean (232.72 ± 232.73 Bq/m3) and median (134.68 Bq/m3) (Table 1). The standard error represents a measurement of the precision of the estimator (mean), and it was not extremely high (standard error = 1.34 Bq/m3) for the annual estimate, but it was very high for the winter estimates (Table 1).The variation coefficient (%), an indicator of precision, was very high both for annual and monthly radon concentration values, and it was very low for the temperature and humidity measurements of the same detectors located in the same places (Table 1). Due to the asymmetrical distribution of the data, a dichotomized new variable was built using the value corresponding to the 90th percentile (557 Bq/m3) as the cut-off.

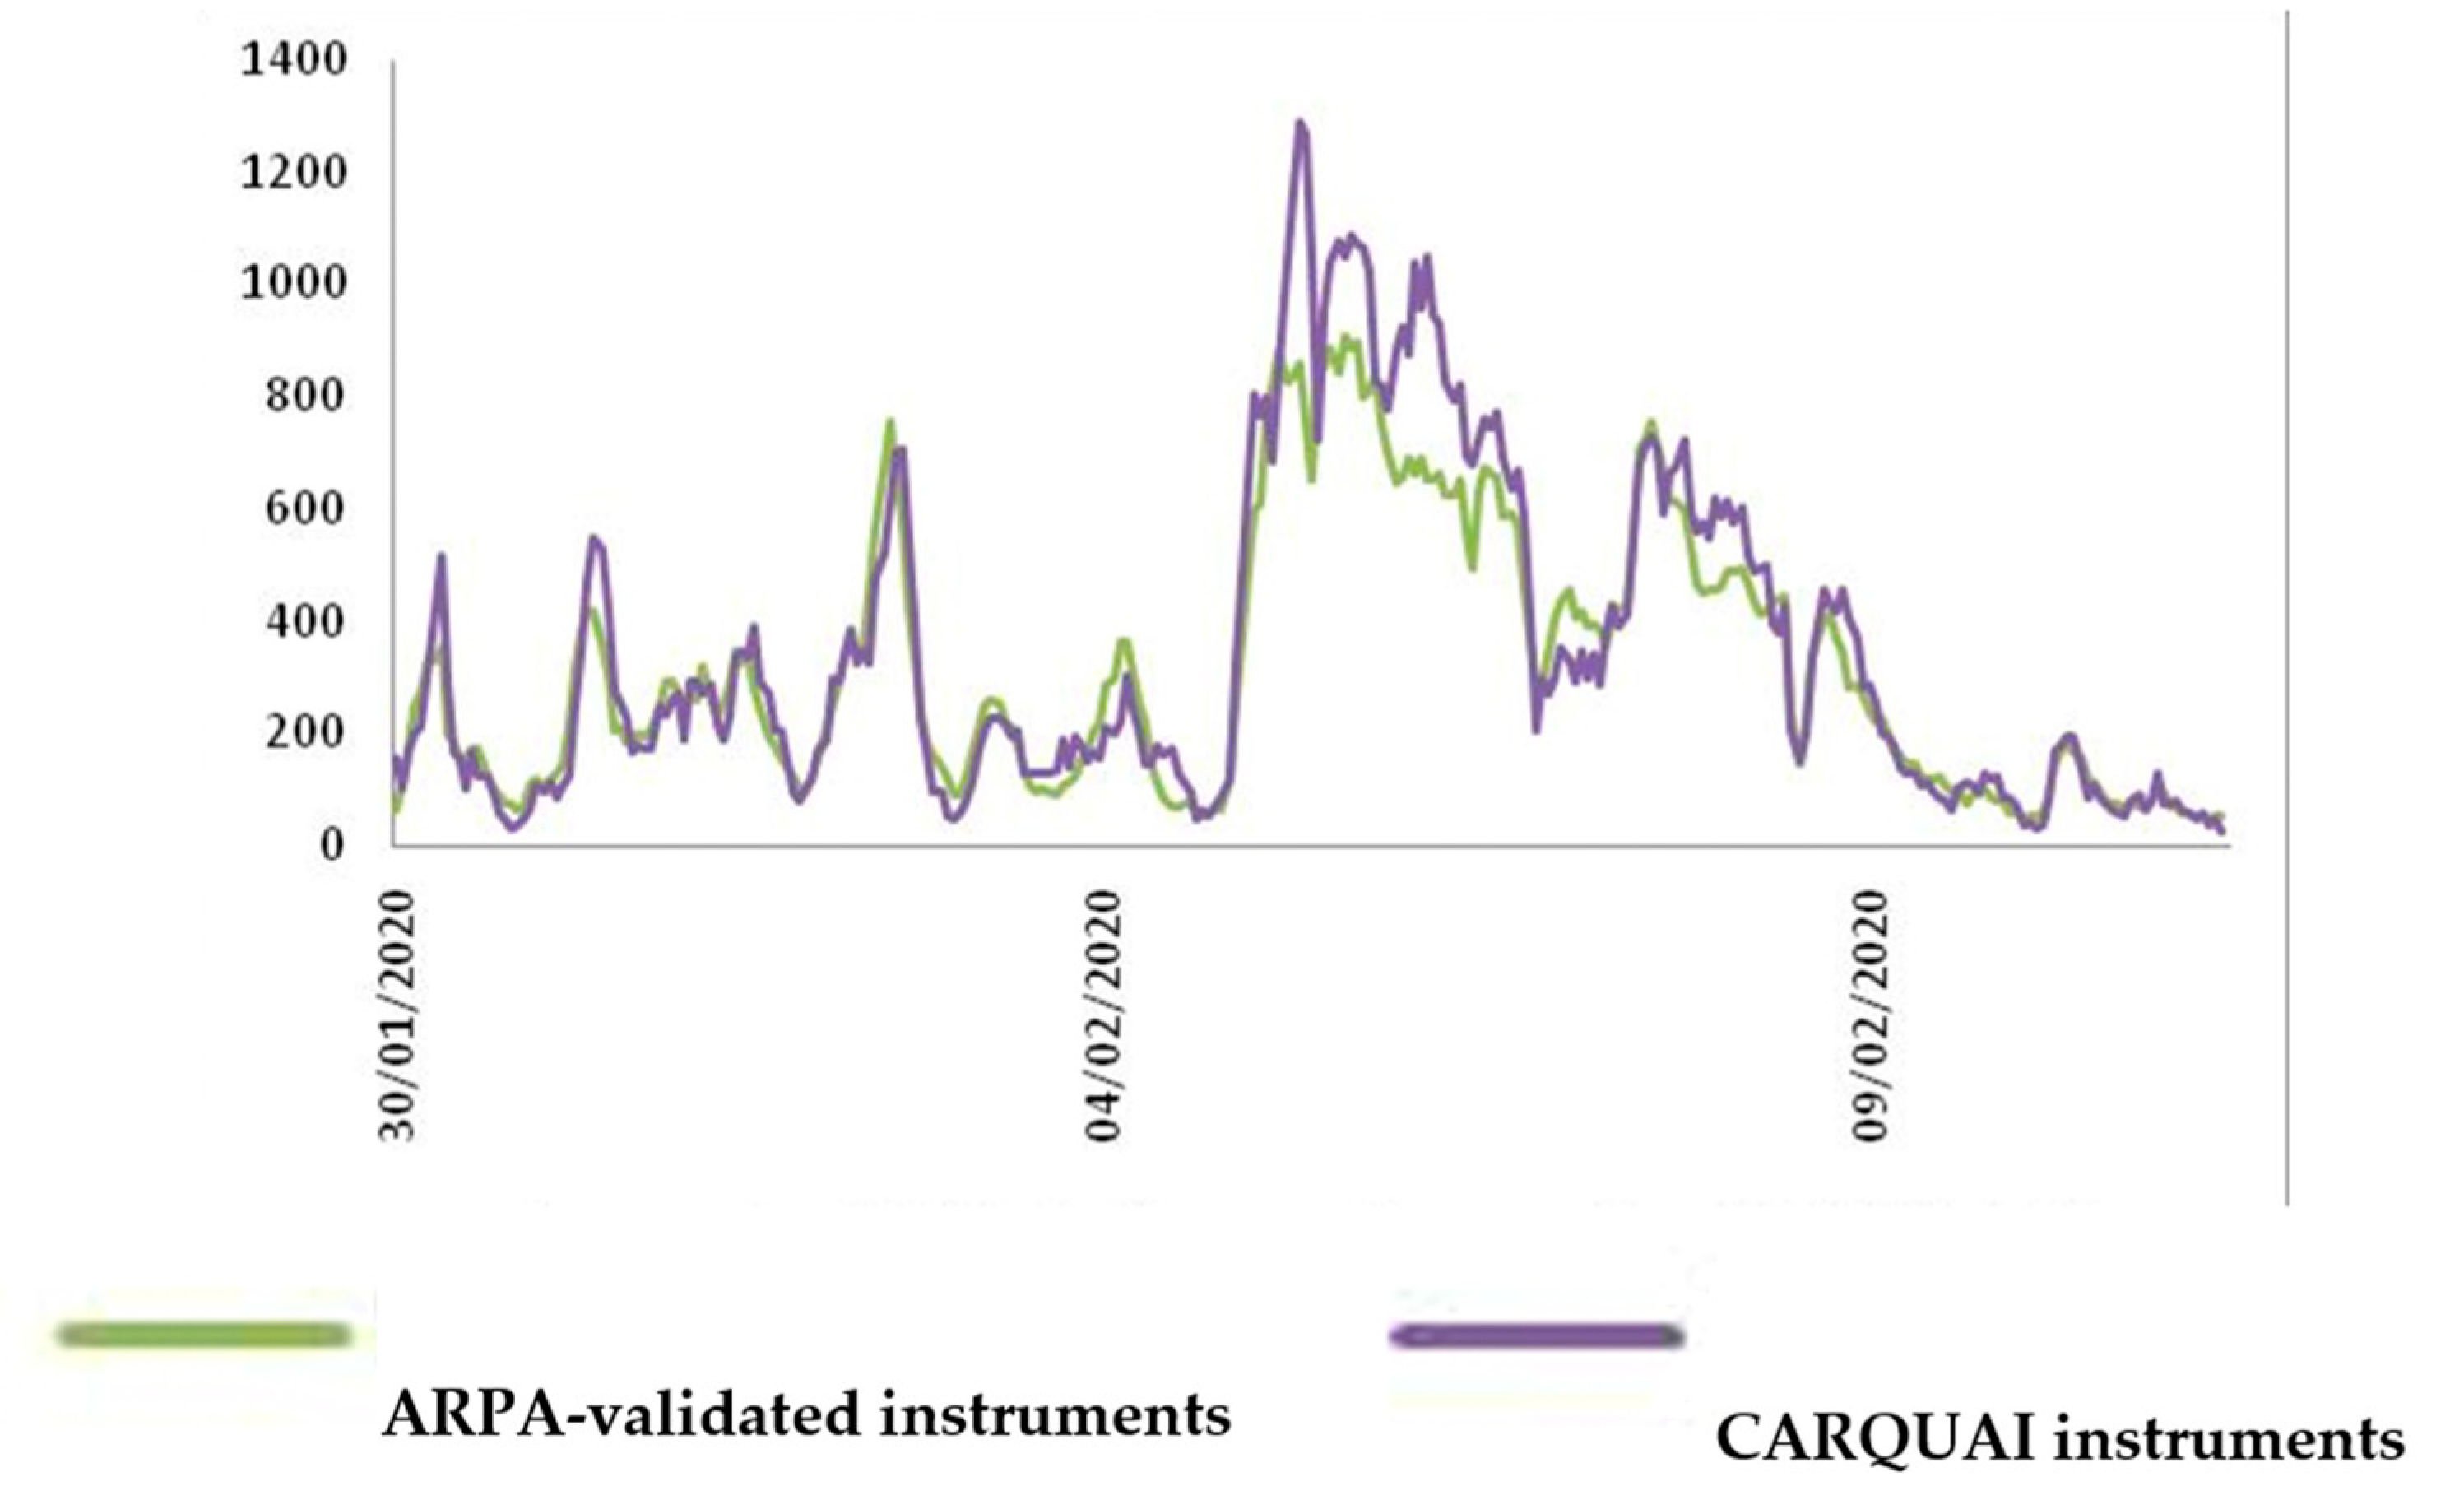
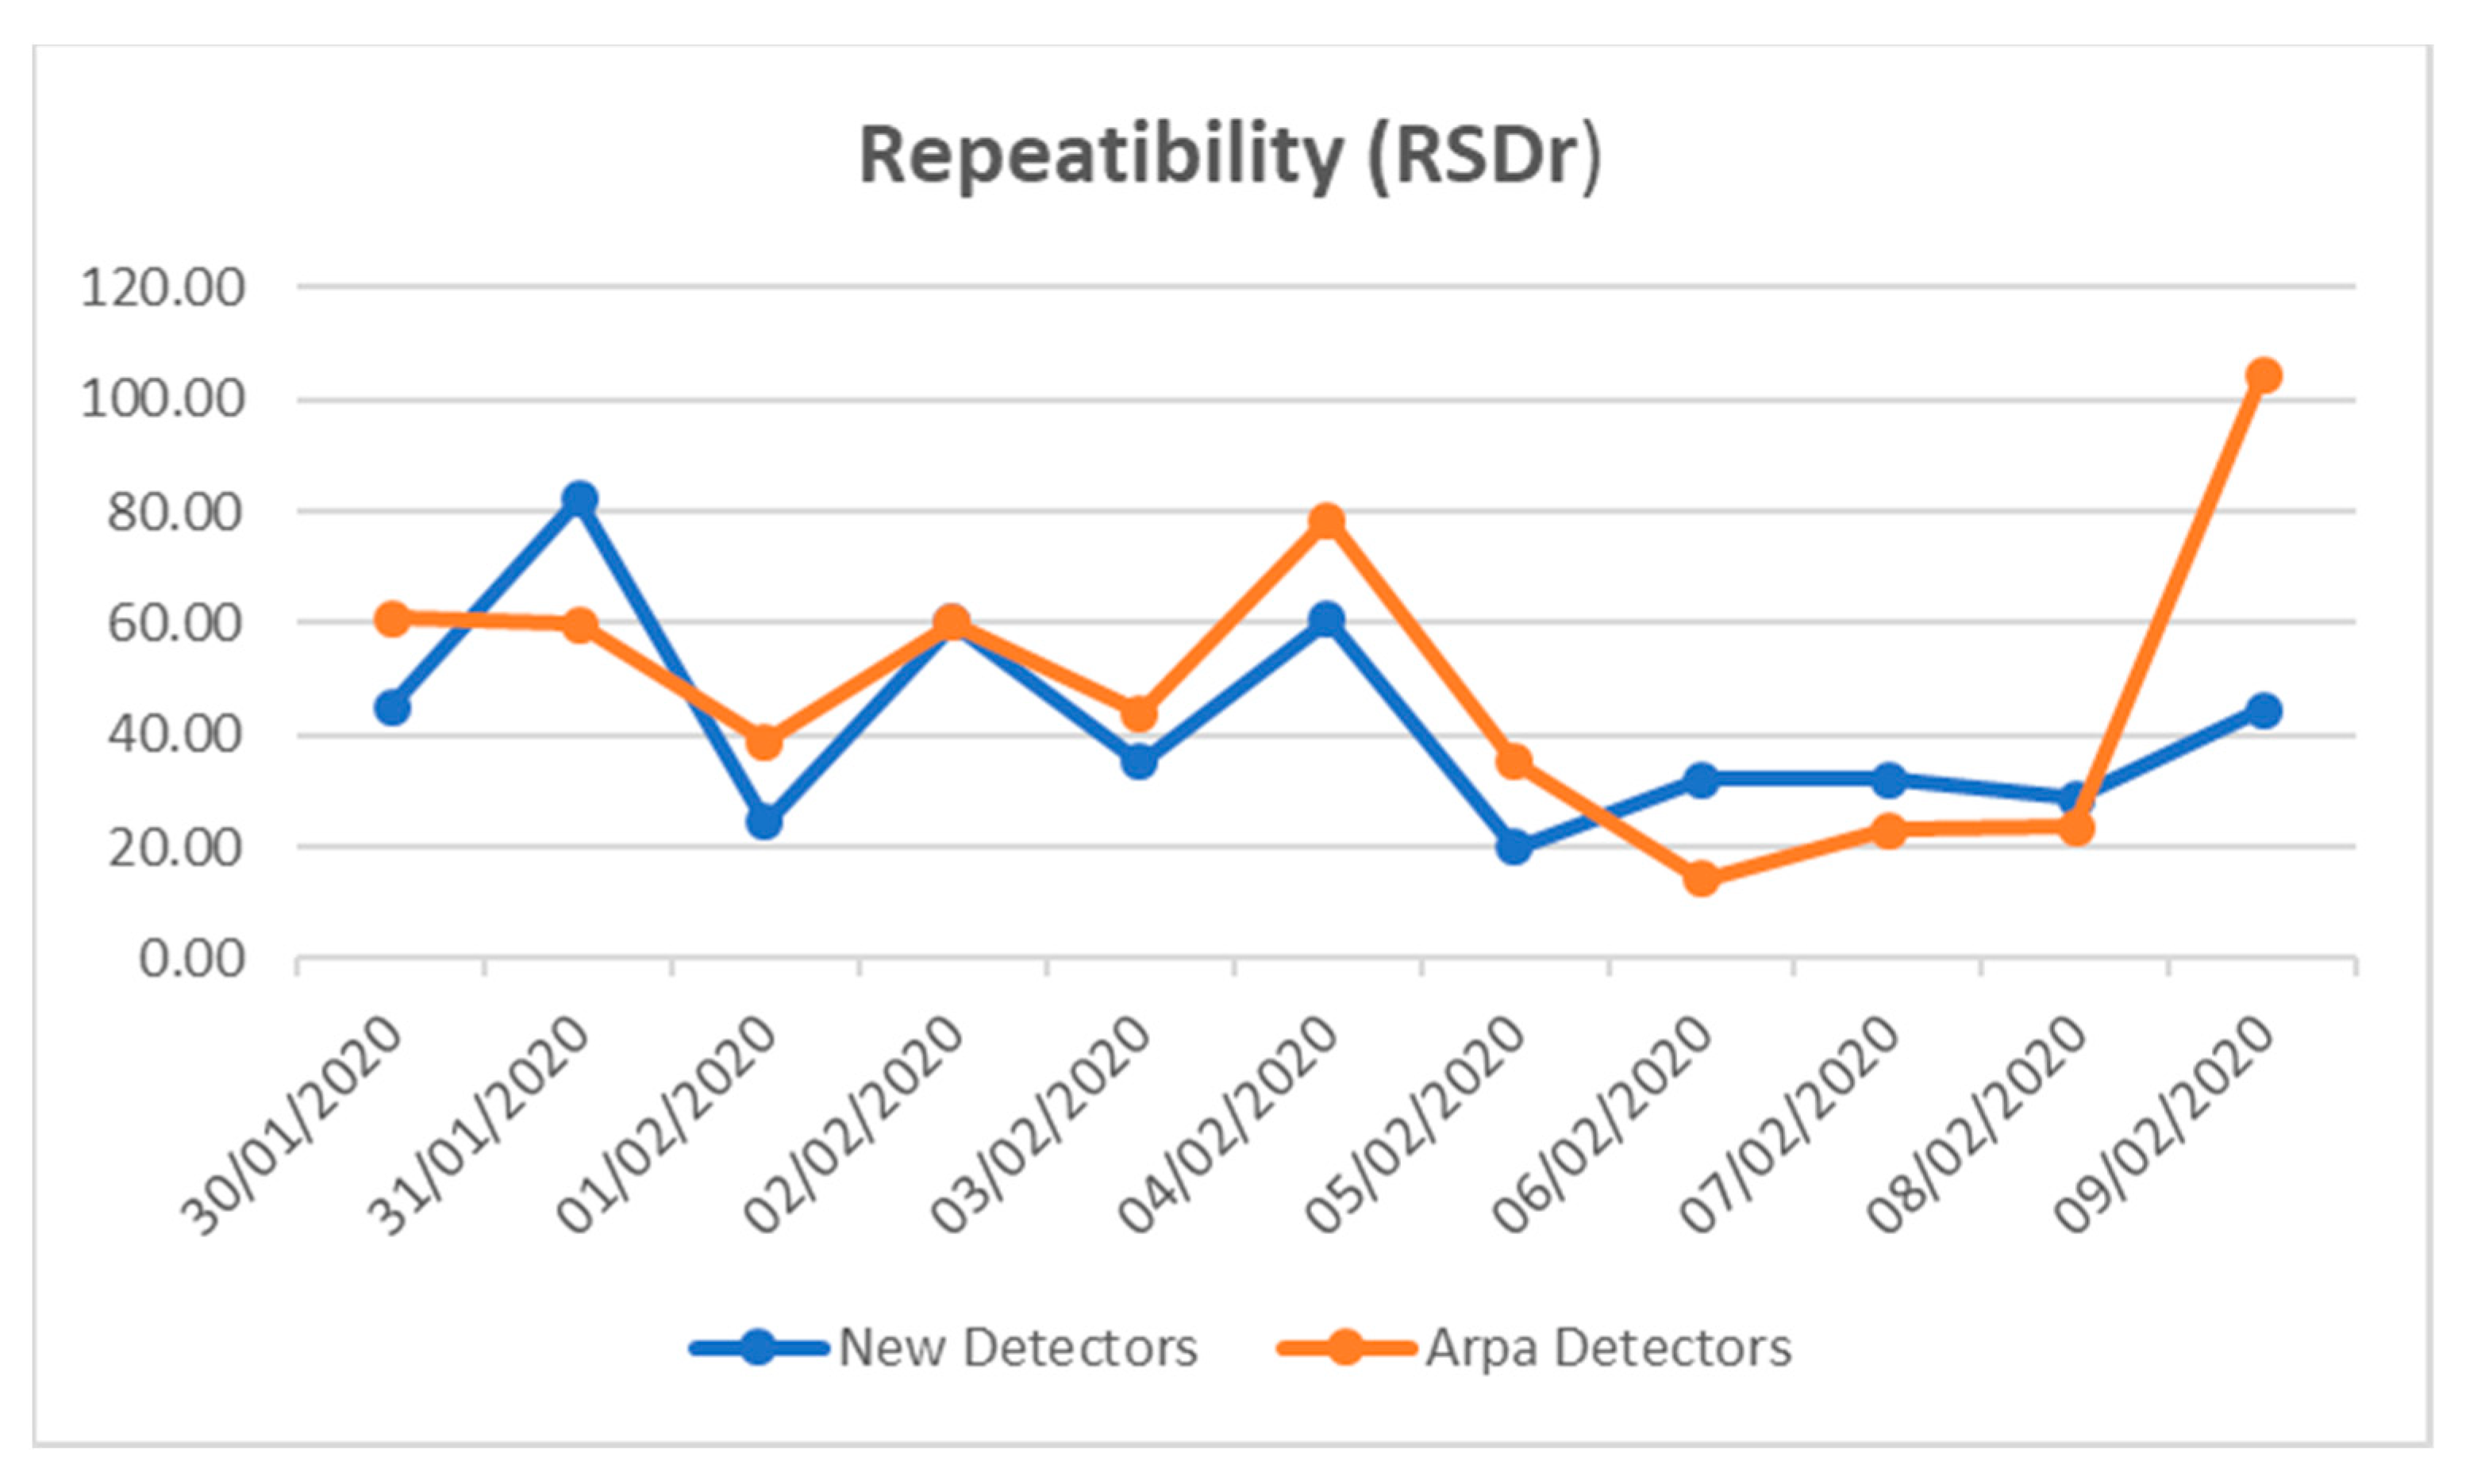
3.4. Validation of the New Radon Detectors Used Herein

Due to the constancy of high radon concentrations at the residential ground floor, attention was focused on the residential building, and a comparison of the CARQUAI active detectors and ARPA detectors was carried out on the ground floor of the residential building in Locorotondo. The concomitant or simultaneous validity and reliability of the detectors was evident, with perfect temporal overlap of the simultaneous measurements of the two detectors (Figure 4, Figure 5, Figure 6 and Figure 7 and Table 3). The Wi-Fi data transmission with the cloud worked well. The availability of the data for subsequent applications was excellent.
Table 3 shows the relative standard deviation (SDr) precision (repeatability) indicators between the two detectors used, the asterisks indicate how the values of the new detectors (CARQUAI) are lower than those of the ARPA detectors which are therefore more precise. The reproducibility was analyzed with ANOVA, with no statistically significant differences being detected (p > 0.05), so the two methods ARPA (already validated) and CARQUAI are superimposable.

3.5. Annual Radon-Attributed Lung Cancer Estimates

Starting from the assumption that the average annual measurements of radon in the entire studied city (Locorotondo) carried out in the past were similar to those carried out currently on the ground floor of the residence building (274 Bq/m3 in the past vs. 233 Bq/m3 in this study) we applied the software we designed for the estimation of lung cancer cases attributable to radon exposure among the residents. The estimation of lung cancer cases that were attributable to radon in Locorotondo with the annual average radon concentration of 233 Bq/m3, would be 3.66 cases per 10,000 inhabitants. Other relevant estimates include the annual cumulative exposure to radon [16,30], 210Po (CA) (2.12 atoms/m3), 214Pb (CB) (2.12 atoms/m3) and 214Bi (Cc) (18.00 atoms/m3) (Table 4).

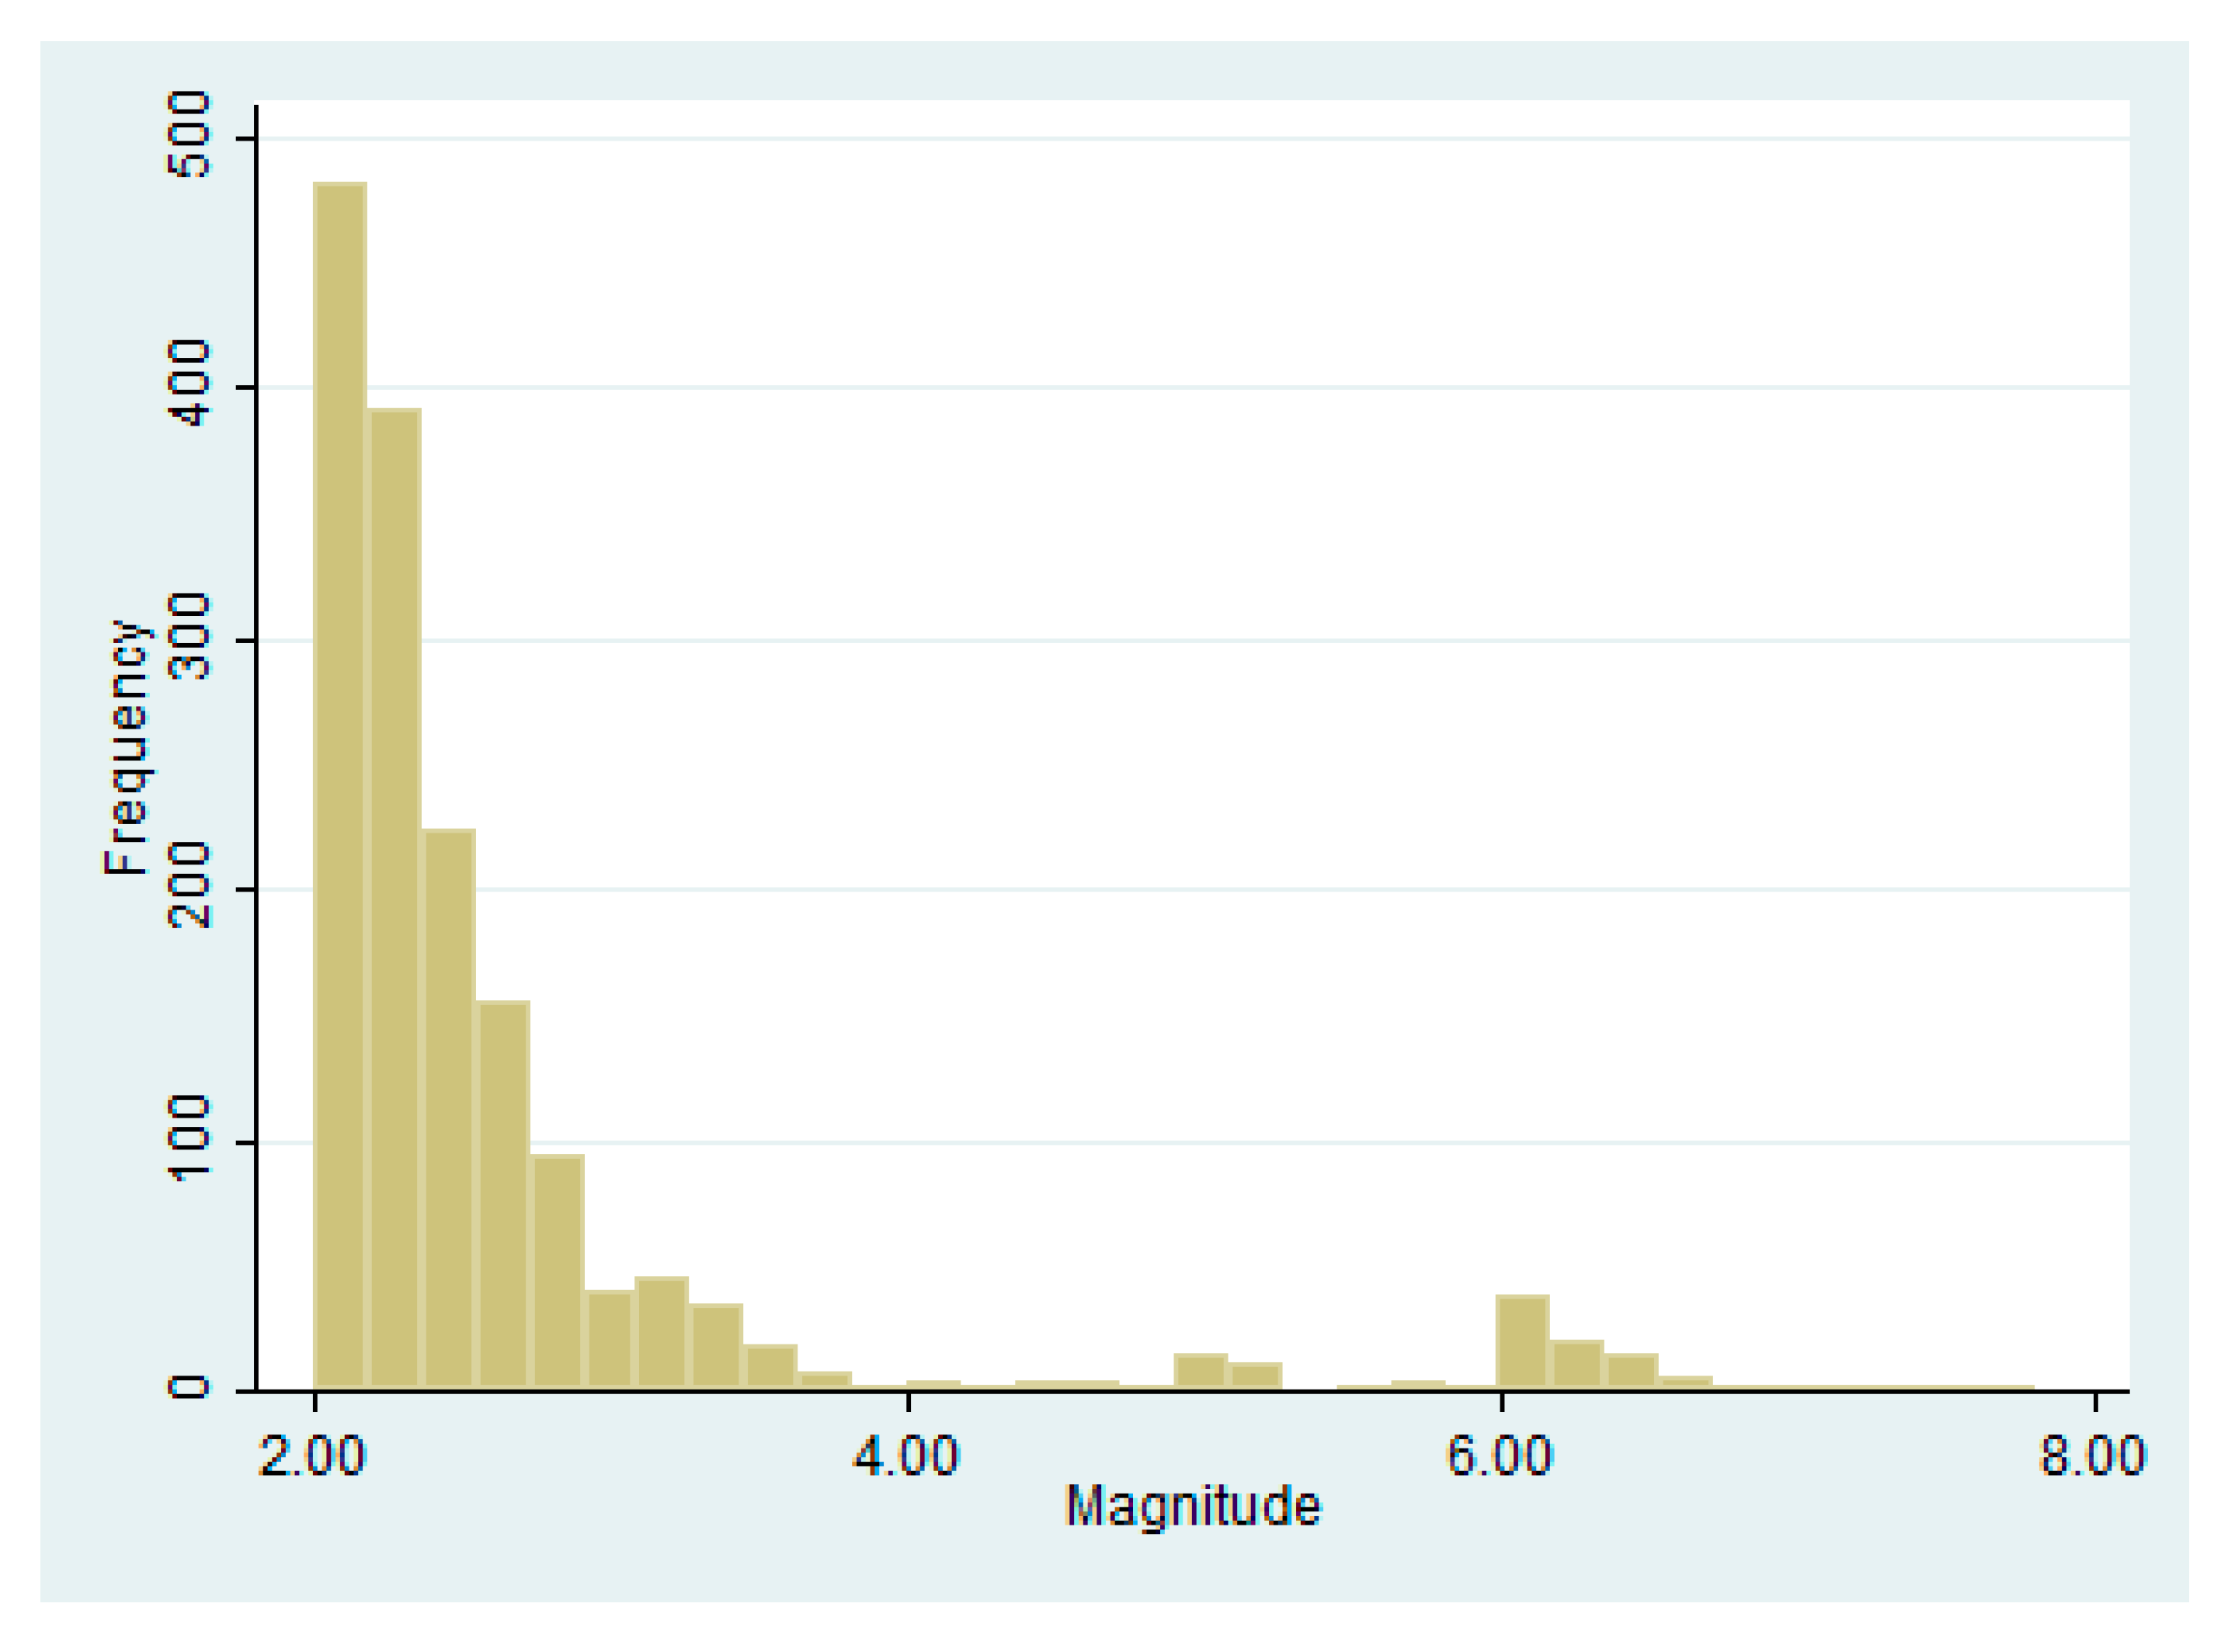
3.6. Earthquake Data Distribution

The 2020 earthquake magnitude (mL) data, obtained from the National Institute of Geology and Vulcanology, show a non-Gaussian distribution with the presence of a first mode at 2.3 (mL) and a small second mode at approximately 6.00 (mL) (Figure 6).
The annual mean value was 2.69 ± 1.10 mL, and the median value was 2.30 (min 2.00 and max 7.80) mL. The distribution of the monthly medians in 2020 shows higher values in January and July (2.40 mL) and a lower observed value in November (2.10 mL) (Table 5). A comparison of the medians of radon and magnitude showed similar trends (Figure 7). The variation in the magnitude data resulting from its non-Gaussian distribution was dichotomized on the value corresponding to the 77th percentile (2.70 mL), and a new variable was created.

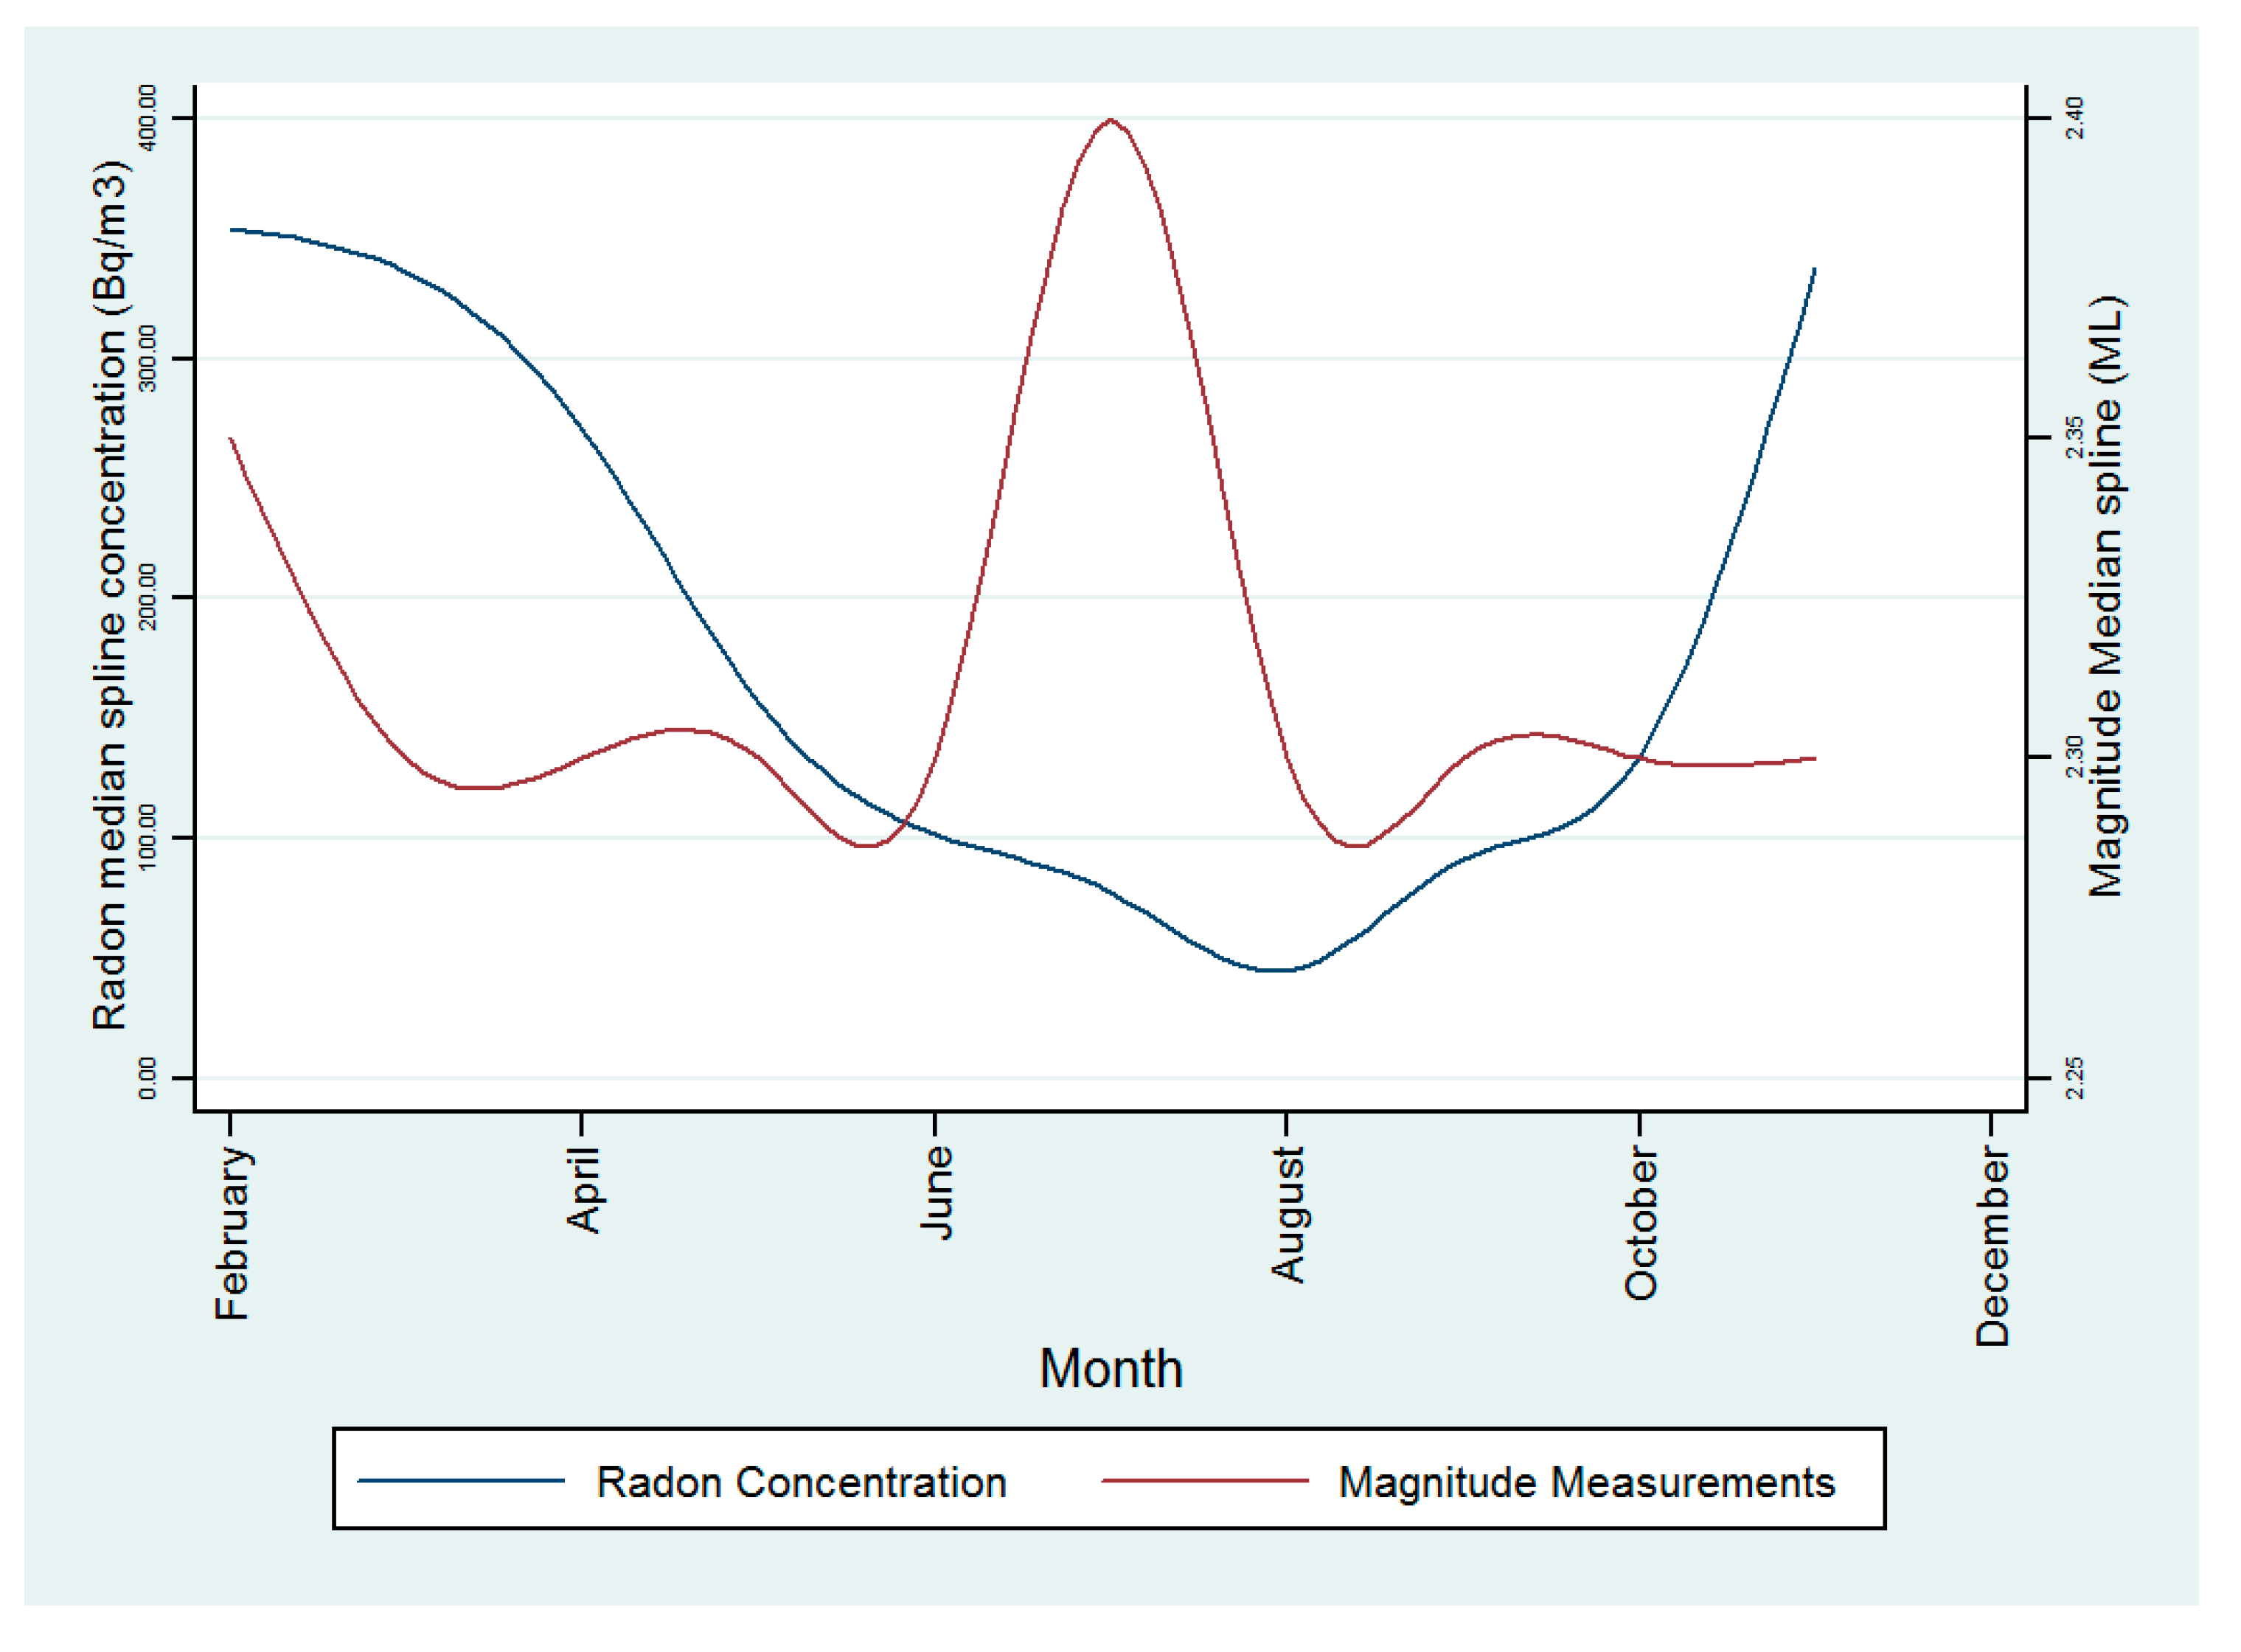
3.7. Relationship between Radon and Earthquake Data

A contingency table of the dichotomized variables representing radon and earthquake magnitudes was created for the univariate estimate of the risk of observing an earthquake magnitude value above 2.7 mL with radon values above 557 Bq/m3. The observed odds ratio was 24% higher for high concentrations of radon, and this relationship was nearly statistically significant (OR = 1.24 (0.860–1.800)) (Table 6). The multivariate analysis showed a statistically significant adjusted odds ratio (OR = 1.231 (1.028–1.474)) (Table 7). Adjustments were made for temperature, humidity and season (Table 7). The best adjustment was due to the summer season (OR = 1.235 (1.033–1.472)) (Table 8).

4. Discussion

4.1. Radon Monitoring and Measurement Validations

The results indicate that the data have an asymmetrical distribution, showing a large amount of “outlier data” (>2 SD from the mean), which induced us to use non-parametric statistical methods to reach our analytical results. The values measured in the residential Locorotondo building were higher of the reference level of 300 Bq/m3. Central tendency measurements (means and medians) above the previously indicated regional reference level were observed in the winter-autumn months (Table 1). Additionally, a high number of outliers near the value of 1000 Bq/m3 was observed. It must be emphasized that the regional average is 52 Bq/m3, and the Italian national average is 70 Bq/m3 [70]. Moreover, according to the new European Directive 2013/59/Euratom and Apulia Regional Law no. 30/2016, the identified reference value is 300 Bq/m3 for homes and public buildings [43,50,51].
The highest values found in the Locorotondo residence were correlated to the different geological compositions of the “Murgian area”, including calcareous soils belonging to the Cretaceous period, comprising Plio-Quaternary (Plio-Pleistocene) units of the “bradanic fossa” (Gravina calcarenite and sub-Apennine clays) on which marine units and terraced continental medium-upper Pleistocene deposits are found.
This result is consistent with the results of other studies [70,71,72,73,74,75]. The data validation showed a very high coefficient of variation for the data related to the Locorotondo residential building, especially for the last months of 2020, and the overall CV was high. A comparison of the data trends of the two detectors (ARPA (validated) and experimental CARQUAI) allocated on the ground floor of the Locorotondo residential building showed strong overlapping (Figure 4). The new detector (CARQUAI active detector (RD200M) optimized for the IAQ monitor, air purifier, radon detector and auto ventilation system, for its characteristics, its portability and low cost may be a useful tool to increase the public opinion awareness of the risks caused by radon [76].

4.2. Radon-Attributable Lung Cancer Risk

The global burden of lung cancer mortality attributed to residential radon was estimated for the 66 countries in which representative national radon surveys have been conducted. Radon-attributable lung cancer deaths for all 66 countries totaled 226,057 in 2012 and represented a median of 3.0% of total cancer deaths [77]. Recently, multiple published studies have measured the risk of developing lung cancer following residential or occupational radon exposure in various regions of the world, as well as the synergistic effect of cigarette smoking and the effect in never-smokers [8,9,10,73,77,78,79,80,81] as well as analyzing the histological types of lung cancer [82].
In this study, the risk is only estimated from the overlapping of the annual average radon concentrations (233 Bq/m3) measured on the ground floor of a residential building in the city of Locorotondo with a previously measured annual average (274 Bq/m3) measured in the same city (in different buildings) some years ago with passive detectors by ARPA. The estimate was calculated by means of our previously created access application, a software tool created to estimate the probability that a given cancer (lung) was caused by preceding exposure to ionizing radiation [49], as later reported by other similar studies [83,84].
A limitation of our results is obviously given by the size of our data set, a widespread monitoring in the urban area and a data set large enough to allow extrapolating risk to the broader population would be a more robust strategy for population level estimates of risk. Another limitation of our access application is the lack of data on smoking due to difficulties in estimating the retrospective assessment of smoking habits among residents. The complexity in environmental sciences involves that the residential analysis did not adjust for the effects of competing causes of lung cancer and also because of the differences in the smoking specific baseline rates in the population.
Our result (3.66 lung cases attributable to radon per 10,000 inhabitants) are in accordance with the United Nations Scientific Committee on the Effects of Atomic Radiation (UNSCEAR), who reported a lifetime risk of lung cancer, calculated using the data of several miner cohorts, of 2.4–7.5 × 10⁻⁴ per Working Level Month (WLM) of radon-222 progeny exposure for a mixed male/female population [84]. In the near future, a study of the annual urban radon average will be conducted with the newly studied monitoring system, and appropriate measures addressing radon should be undertaken in areas of increased exposure to this noble gas to obtain longitudinal analyses of the risk of populations resulting from indoor radon exposure [73]. Monitoring the exposure of resident populations is relevant in light of the small lung cancer burden associated with occupational radon, with the greatest burden occurring among those exposed to low levels of radon [8,80,85,86,87].
Our data are also in agreement with the results of other studies conducted in Apulia in the province of Lecce, including a spatial analysis of the distribution of indoor radon concentrations. An ecological study was conducted to verify any overlap among areas with the highest measured radon concentrations and lung cancer mortalities [88].

4.3. Radon and Earthquakes

Although in Figure 5 an inverse relationship between seismicity and radon levels appears, the association between radon and earthquake exist when we can adjust the estimates for humidity temperature and season. Our observed adjusted risk of higher earthquake magnitude data (mL) levels associated with higher levels of radon is explainable by the presence of anomalous geochemical changes related to earthquakes. This hypothesis has been controversial despite widespread, long-term challenges in predicting earthquakes. Establishing only quantitative relationships between geochemical changes and geodetical or seismological changes can clarify their hidden connections. The findings of some scientific studies have suggested that changes in radon exhaled from the ground were induced by ascending flows of soil gases acting as radon carriers, degassed from mantle-derived crustal fluid upwelling due to modulation of the crustal stress regime [53]. Nevertheless, multi-station, multi-variate analyses have provided strong indications that local site effects play major roles in modulating radon signal interactions with environmental parameter variations. Such evidence prevents us from uniquivocally assessing meteorological correction parameters, and consequently, the results of our approach used to address atmospheric conditions should be considered as a complementary attempt to provide further insights into our dataset and not necessarily make our results more reliable or robust [54]. The results of other studies have suggested that radon monitoring stations can be subject to massive site effects, especially regarding rainfall, making data interpretations more difficult. Nevertheless, statistical analyses show that the method used herein is a viable approach for quantitatively relating radon emanation variations to seismic energy releases. Although much work is still needed to make radon time series analysis a robust complement to traditional seismological tools, this work has identified a characteristic variation in radon exhalations during the preparation process of large earthquakes [56]. An alternative explanation for this result could be the strong and sudden strain releases that occur in earthquake swarms, with consequent variations in the permeability of rocks at large scales, given the apparent correlations between those anomalies and intense seismicity [57]. In experiments carried out in the Himalayas, changes in the soil radon concentration were treated as anomalous for values exceeding one and two standard deviations (m ± σ and m ± 2σ) from the mean value over the selected duration. The two nearby and strongest events suggest pre-seismic variations that are related to earthquake precursor signatures. The observed results are explained in light of the dilatancy-diffusion model [89]. In India, soil radon has been monitored continuously in the Kutch region of Gujarat India to study pre-seismic anomalies. In these studies, radon was observed showing a maximum concentration during the rainy season compared to the other two seasons. The empirical mode decomposition (EMD)-based Hilbert-Huang transform (HHT) method has been suggested to be useful in identifying earthquake precursors in radon time series. Several interesting non-linear features were observed in the EMD-HHT analysis. The temporal variation in the instantaneous energy had a good correlation with four local earthquakes during the study period [90]. A significant decrease in the atmospheric radon concentrations was temporally linked to seismic quiescence before the 2018 Northern Osaka earthquake occurred at a hidden fault with complex rupture dynamics. During this seismic quiescence, deep-seated sedimentary layers in the Osaka Basin, which might have been the main sources of radon, became less damaged and fractured. The reduction in damage led to a decrease in radon exhalation to the atmosphere near the fault, causing the pre-seismic radon decrease observed in the atmosphere [60].
Herein, we highlight the necessity of continuous monitoring of atmospheric radon concentrations, combined with the statistical anomaly detection method, to evaluate future seismic risks [59]. Ambrosino et al. studied two-year data from two sites in the Czech Republic and in the Italian Phlegrean Fields to contribute to the prevention of natural hazards. The radon anomalies resulting from endogenous phenomena were well-correlated with fault displacements, fumarolic tremors, and earthquakes under a characteristic delay time for each area [91].
Our data suggests that there is a lag or at least a time discrepancy between seismic activity and radon levels. A limitation of the seasonal analysis done in the results (Table 7) may not be granular enough to address issues such as precursor signatures or drops in radon that can occur prior to earthquakes. A continuous monitoring is necessary to correlate measurements around the seismic events with radon levels in the buildings pre and post higher seismic activity, to check if radon monitoring is important in order to predict seismic events, simultaneously with a monitoring of soil gas radon.
Our study was carried out using contextual temperature and humidity measurements for the adjustment of the risk estimates. Nevertheless, some limitations of our study are represented by the limited number of sites where radon was reported and the absence of rainfall data, that may hamper the interpretation of these results. Because we know that the best adjustment would be more accurate if rainfall data related to the same period were included, we requested these data from the national agency. These data have been measured but are not yet available.

5. Conclusions

Radon is a known risk factor for lung cancer, and residential radon exposure is the leading cause of lung cancer in never-smokers, but in Italy still today there is a lack of public opinion awareness regarding the risk caused by residential radon exposure. In this study, a model of indoor radon measurements was validated, radon software was applied to estimate the lung cancer cases attributable to radon, and the relationship between radon and earthquakes in a residential building of an Apulian town (southern Italy) was studied. Although the measured radon values were, on average, within the reference level, prevention measures must be implemented.
Monitoring indoor radon is of fundamental importance both for evaluating the findings against the established references levels, for comparing radon distribution levels between upstairs and downstairs, for identifying the influence of new construction materials on corresponding radon concentrations and so on. At the same time, assuming a sub-multiplicative model for the joint effect of radon and smoke (BEIR VI) [2], the monitoring of the various factors that can influence the concentration of indoor radon (e.g.,: temperature, humidity, rainfall data, seismic data, etc.) can effectively contribute to radon mitigation in homes along with modifying smoking habit to maximize risk reduction.
In our study the measured radon values allowed us to estimate an expected value of 3.66 cases of lung cancer per 10,000 people in the resident population. These findings of overall low levels with high variability suggest that perhaps continuous monitoring is the best option. This result deserves attention because residential and occupational radon levels could usually be reduced, often by simple and low-price intervention measures, with the prospect of reducing the number of radon-related lung cancer deaths through preventive measures.
Moreover, this study is only a small piece of evidence in support of previous scientific studies and needs further in-depth verification through the performance of appropriate multiple-measure and multidisciplinary long-term studies to increase appropriate preventive measures.

Author Contributions

Conceptualization, G.M.F., D.C., L.V.; Methodology, G.E., G.S., V.C., G.M.F., V.B.; Software, G.E., G.S., V.C., G.M.F.; Validation, V.B., G.M.F.; Formal analysis, G.M.F.; Investigation, M.C.D., L.D.M., A.C., S.S.; Data curation, G.M.F.; Writing—original draft preparation, G.M.F., D.C.; Writing—review and editing, G.M.F., D.C., L.V.; Supervision, L.V. All authors have read and agreed to the published version of the manuscript.

Funding

This study was based on the funding of a project based on the “Intelligent system for monitoring and optimizing the Indoor Air Quality (IAQ) parameters of buildings and reducing the risk of sick building Syndrome related to exposure to Radon gas” study (CARQUAI PROJECT). CARQUAI PROJECT: CUP B33D17003160007—Codice MIR A0104.213.

Institutional Review Board Statement

Not applicable.

Informed Consent Statement

Not applicable.

Data Availability Statement

The data presented in this study are available on request from the corresponding author. The data are not publicly available due to privacy.

Acknowledgments

The authors thank Luigi Vitucci of ARPA Apulia who collaborated in the research as co-author and died prematurely.

Conflicts of Interest

The authors declare no conflict of interest.

References

  1. National Council on Radiation Protection and Measurements. Ionizing Radiation Exposure of the Population of the United States; NCRP Report 160; National Council on Radiation Protection and Measurements: Bethesda, MD, USA, 2009. [Google Scholar]
  2. National Research Council. Health Effects of Exposure to Radon. BEIR VI; National Academy Press: Washington, DC, USA, 1999; p. 21. [Google Scholar]
  3. International Agency for Research on Cancer (IARC). IARC Monograph on the Evaluation of the Carcinogenic Risk to Human. Man-made Mineral Fibers and Radon; IARC: Lyon, France, 1988; Volume 43. [Google Scholar]
  4. Eidy, M.; Tishkowski, K. Radon Toxicity. In StatPearls; StatPearls Publishing: Treasure Island, FL, USA, 2021. [Google Scholar]
  5. Ćujić, M.; Mandić, L.J.; Petrović, J.; Dragović, R.; Đorđević, M.; Đokić, M.; Dragović, S. Radon-222: Environmental behavior and impact to (human and non-human) biota. Int. J. Biometeorol. 2020, 65, 69–83. [Google Scholar] [CrossRef]
  6. Thandra, K.C.; Barsouk, A.; Saginala, K.; Aluru, J.S.; Barsouk, A. Epidemiology of lung cancer. Contemp. Oncol. (Pozn) 2021, 25, 45–52. [Google Scholar] [CrossRef]
  7. Kim, S.-H.; Hwang, W.J.; Cho, J.-S.; Kang, D.R. Attributable risk of lung cancer deaths due to indoor radon exposure. Ann. Occup. Environ. Med. 2016, 28, 8. [Google Scholar] [CrossRef] [Green Version]
  8. Noh, J.; Jang, H.; Cho, J.; Kang, D.R.; Kim, T.H.; Shin, D.C.; Kim, C. Estimating the disease burden of lung cancer attributable to residential radon exposure in Korea during 2006–2015: A socio-economic approach. Sci. Total. Environ. 2020, 749, 141573. [Google Scholar] [CrossRef]
  9. Ponciano-Rodríguez, G.; Gaso, M.I.; Armienta, M.A.; Trueta, C.; Morales, I.; Alfaro, R.; Segovia, N. Indoor radon exposure and excess of lung cancer mortality: The case of Mexico—An ecological study. Environ. Geochem. Health 2020, 43, 221–234. [Google Scholar] [CrossRef]
  10. Lorenzo-Gonzalez, M.; Ruano-Ravina, A.; Torres-Duran, M.; Kelsey, K.T.; Provencio, M.; Parente-Lamelas, I.; Piñeiro-Lamas, M.; Varela-Lema, L.; Perez-Rios, M.; Fernandez-Villar, A.; et al. Lung cancer risk and residential radon exposure: A pooling of case-control studies in northwestern Spain. Environ. Res. 2020, 189, 109968. [Google Scholar] [CrossRef] [PubMed]
  11. Torres-Durán, M.; Casal-Mouriño, A.; Ruano-Ravina, A.; Provencio, M.; Parente-Lamelas, I.; Hernández-Hernández, J.; Vidal-García, I.; Varela-Lema, L.; Cuadrado, L.V.; Fernández-Villar, A.; et al. Residential radon and lung cancer characteristics at diagnosis. Int. J. Radiat. Biol. 2021, 97, 997–1002. [Google Scholar] [CrossRef]
  12. Giraldo-Osorio, A.; Ruano-Ravina, A.; Varela-Lema, L.; Barros-Dios, J.M.; Pérez-Ríos, M. Residential Radon in Central and South America: A Systematic Review. Int. J. Environ. Res. Public Health 2020, 17, 4550. [Google Scholar] [CrossRef] [PubMed]
  13. Jiang, J.; Shang, X.; Wang, H.; Xu, Y.-B.; Gao, Y.; Zhou, Q. Diagnostic value of contrast-enhanced ultrasound in thyroid nodules with calcification. Kaohsiung J. Med. Sci. 2015, 31, 138–144. [Google Scholar] [CrossRef] [PubMed] [Green Version]
  14. Harley, N.H. Potential lung cancer risk from indoor radon exposure. CA Cancer J. Clin. 1990, 40, 265–275. [Google Scholar] [CrossRef] [PubMed]
  15. Samet, J.M. Indoor radon and lung cancer. Estimating the risks. West. J. Med. 1992, 156, 25–29. [Google Scholar]
  16. Darby, S.; Hill, D.; Auvinen, A.; Barros-Dios, J.M.; Baysson, H.; Bochicchio, F.; Deo, H.; Falk, R.; Forastiere, F.; Hakama, M.; et al. Radon in homes and risk of lung cancer: Collaborative analysis of individual data from 13 European case-control studies. BMJ 2004, 330, 223. [Google Scholar] [CrossRef] [PubMed] [Green Version]
  17. Kojo, K.; Kurttio, P. Indoor Radon Measurements in Finnish Daycare Centers and Schools-Enforcement of the Radiation Act. Int. J. Environ. Res. Public Health 2020, 17, 2877. [Google Scholar] [CrossRef] [PubMed] [Green Version]
  18. Serio, G.; Vimercati, L.; Pennella, A.; Gentile, M.; Cavone, D.; Buonadonna, A.L.; Scattone, A.; Fortarezza, F.; De Palma, A.; Marzullo, A. Genomic changes of chromosomes 8p23.1 and 1q21: Novel mutations in malignant mesothelioma. Lung Cancer 2018, 126, 106–111. [Google Scholar] [CrossRef]
  19. Ruano-Ravina, A.; Pereyra, M.F.; Castro, M.T.; Pérez-Ríos, M.; Abal-Arca, J.; Barros-Dios, J.M. Genetic Susceptibility, Residential Radon, and Lung Cancer in a Radon Prone Area. J. Thorac. Oncol. 2014, 9, 1073–1080. [Google Scholar] [CrossRef] [PubMed] [Green Version]
  20. Rosenberger, A.; Hung, R.; Christiani, D.C.; Caporaso, N.E.; Liu, G.; Bojesen, S.E.; Le Marchand, L.; Haiman, C.A.; Albanes, D.; Aldrich, M.C.; et al. Genetic modifiers of radon-induced lung cancer risk: A genome-wide interaction study in former uranium miners. Int. Arch. Occup. Environ. Health 2018, 91, 937–950. [Google Scholar] [CrossRef] [Green Version]
  21. González, M.L.; Ruano-Ravina, A.; Torres-Durán, M.; Kelsey, K.T.; Provencio, M.; Parente-Lamelas, I.; Leiro-Fernández, V.; Vidal-García, I.; Castro-Añón, O.; Martínez, C.; et al. Residential radon, genetic polymorphisms in DNA damage and repair-related. Lung Cancer 2019, 135, 10–15. [Google Scholar] [CrossRef]
  22. Nikkilä, A.; Arvela, H.; Mehtonen, J.; Raitanen, J.; Heinäniemi, M.; Lohi, O.; Auvinen, A. Predicting residential radon concentrations in Finland: Model development, validation, and application to childhood leukemia. Scand. J. Work. Environ. Health 2019, 46, 278–292. [Google Scholar] [CrossRef]
  23. Casal-Mouriño, A.; Ruano-Ravina, A.; Torres-Durán, M.; Parente-Lamelas, I.; Provencio-Pulla, M.; Castro-Añón, O.; Vidal-García, I.; Pena-Álvarez, C.; Abal-Arca, J.; Piñeiro-Lamas, M.; et al. Lung cancer survival in never-smokers and exposure to residential radon: Results of the LCRINS study. Cancer Lett. 2020, 487, 21–26. [Google Scholar] [CrossRef]
  24. World Health Organization. WHO Handbook on Indoor Radon: A Public Health Perspective; World Health Organization: Geneva, Switzerland, 2009; ISBN 978-92-4-154767-3. [Google Scholar]
  25. Available online: https://www.who.int/news-room/fact-sheets/detail/radon-and-health (accessed on 14 May 2021).
  26. Available online: https://www.epa.gov/sites/production/files/201612/documents/2016_a_citizens_guide_to_radon.pdf (accessed on 14 May 2021).
  27. Grundy, A.; Brand, K.; Khandwala, F.; Poirier, A.; Tamminen, S.; Friedenreich, C.M.; Brenner, D.R. Lung cancer incidence attributable to residential radon exposure in Alberta in 2012. CMAJ Open 2017, 5, E529–E534. [Google Scholar] [CrossRef] [Green Version]
  28. Oh, S.-S.; Koh, S.; Kang, H.; Lee, J. Radon exposure and lung cancer: Risk in nonsmokers among cohort studies. Ann. Occup. Environ. Med. 2016, 28, 11. [Google Scholar] [CrossRef] [Green Version]
  29. Lubin, J.H.; Boice, J.D.; Edling, C.; Hornung, R.W.; Howe, G.R.; Kunz, E.; Kusiak, R.A.; Morrison, H.I.; Radford, E.P.; Samet, J.M.; et al. Lung Cancer in Radon-Exposed Miners and Estimation of Risk From Indoor Exposure. J. Natl. Cancer Inst. 1995, 87, 817–827. [Google Scholar] [CrossRef] [PubMed]
  30. Darby, S.C.; Whitely, E.; Howe, G.R.; Hutchings, S.J.; Kusiak, R.A.; Lubin, J.H.; Morrison, H.I.; Tirmarche, M.; Tomásek, L.; Radford, E.P.; et al. Radon and Cancers Other Than Lung Cancer in Underground Miners: A Collaborative Analysis of 11 Studies. J. Natl. Cancer Inst. 1995, 87, 378–384. [Google Scholar] [CrossRef] [PubMed]
  31. Tirmarche, M.; Harrison, J.; Laurier, D.; Blanchardon, E.; Paquet, F.; Marsh, J. Risk of lung cancer from radon exposure: Contribution of recently published studies of uranium miners. Ann. ICRP 2012, 41, 368–377. [Google Scholar] [CrossRef]
  32. Shahrokhi, A.; Adelikhah, M.; Imani, M.; Kovács, T. A brief radiological survey and associated occupational exposure to radiation in an open pit slate mine in Kashan, Iran. J. Radioanal. Nucl. Chem. 2021, 2, 1–8. [Google Scholar]
  33. Kreuzer, M.; Deffner, V.; Schnelzer, M.; Fenske, N. Mortality in underground miners in a former uranium ore mine. Dtsch. Aerzteblatt Online 2021, 118, 41–48. [Google Scholar] [CrossRef]
  34. Kojo, K.; Laine, J.-P.; Turtiainen, T.; Kurttio, P. Radon in Finnish underground mines 2011–2019. J. Radiol. Prot. 2021, 41, 619–627. [Google Scholar] [CrossRef]
  35. Kelly-Reif, K.; Sandler, D.P.; Shore, D.; Schubauer-Berigan, M.K.; Troester, M.A.; Nylander-French, L.; Richardson, D.B. Radon and cancer mortality among underground uranium miners in the Příbram region of the Czech Republic. Am. J. Ind. Med. 2020, 63, 859–867. [Google Scholar] [CrossRef]
  36. Fijałkowska-Lichwa, L.; Przylibski, T.A. Assessment of occupational exposure from radon in the newly formed underground tourist route under Książ castle, Poland. Radiat. Environ. Biophys. 2021, 60, 329–345. [Google Scholar] [CrossRef]
  37. Becker, K. Health Effects of High Radon Environments in Central Europe: Another Test for the LNT Hypothesis? Nonlinearity Biol. Toxicol. Med. 2003, 1, 3–35. [Google Scholar] [CrossRef] [Green Version]
  38. Thompson, R.E.; Nelson, D.F.; Popkin, J.H.; Popkin, Z. Case-Control Study of Lung Cancer Risk from Residential Radon Exposure in Worcester County, Massachusetts. Health Phys. 2008, 94, 228–241. [Google Scholar] [CrossRef] [Green Version]
  39. Fornalski, K.W.; Adams, R.; Allison, W.; Corrice, L.E.; Cuttler, J.M.; Davey, C.; Dobrzyński, L.; Esposito, V.J.; Feinendegen, L.E.; Gomez, L.S.; et al. The assumption of radon-induced cancer risk. Cancer Causes Control. 2015, 26, 1517–1518. [Google Scholar] [CrossRef]
  40. Dobrzyński, L.; Fornalski, K.; Reszczyńska, J. Meta-analysis of thirty-two case–control and two ecological radon studies of lung cancer. J. Radiat. Res. 2017, 59, 149–163. [Google Scholar] [CrossRef]
  41. Scott, B.R. Epidemiologic Studies Cannot Reveal the True Shape of the Dose–Response Relationship for Radon-Induced Lung Cancer. Dose-Response 2019, 17. [Google Scholar] [CrossRef] [PubMed] [Green Version]
  42. Pylak, M.; Fornalski, K.W.; Reszczyńska, J.; Kukulski, P.; Waligórski, M.P.R.; Dobrzyński, L. Analysis of Indoor Radon Data Using Bayesian, Random Binning, and Maximum Entropy Methods. Dose-Response 2021, 19. [Google Scholar] [CrossRef] [PubMed]
  43. Council Directive 2013/59/Euratom of 5 December 2013. Laying down Basic Safety Standards for Protection against the Dangers Arising from Exposure to Ionising Radiation, and Repealing Directives 89/618/Euratom, 90/641/Euratom, 96/29/ Euratom, 97/43/Euratom and 2003/122/Euratom1. Available online: https://ec.europa.eu/energy/sites/ener/files/documents/CELEX- 32013L0059-EN-TXT.pdf(accessed on 14 May 2021).
  44. Vimercati, L.; Cavone, D.; Caputi, A.; Delfino, M.C.; De Maria, L.; Ferri, G.M.; Serio, G. Malignant mesothelioma in construction workers: The Apulia regional mesothelioma register, Southern Italy. BMC Res. Notes 2019, 12, 1–7. [Google Scholar] [CrossRef]
  45. Chiavacci, S.J.; Shapiro, C.D.; Pindilli, E.J.; Casey, C.F.; Rayens, M.K.; Wiggins, A.T.; Andrews, W.M., Jr.; Hahn, E.J. Economic valuation of health benefits from using geologic data to communicate radon risk potential. Environ. Health 2020, 19, 36. [Google Scholar] [CrossRef] [Green Version]
  46. Bossew, P.; Cinelli, G.; Ciotoli, G.; Crowley, Q.G.; De Cort, M.; Medina, J.E.; Gruber, V.; Petermann, E.; Tollefsen, T. Development of a Geogenic Radon Hazard Index—Concept, History, Experiences. Int. J. Environ. Res. Public Health 2020, 17, 4134. [Google Scholar] [CrossRef] [PubMed]
  47. Petermann, E.; Bossew, P. Mapping indoor radon hazard in Germany: The geogenic component. Sci. Total. Environ. 2021, 780, 146601. [Google Scholar] [CrossRef]
  48. Pantelić, G.; Čeliković, I.; Živanović, M.; Vukanac, I.; Nikolić, J.K.; Cinelli, G.; Gruber, V. Literature Review of Indoor Radon Surveys in Europe; JRC Technical Reports; European Commission: Brussels, Belgium, 2018; p. 14. [Google Scholar]
  49. Ferri, G.M.; Intranuovo, G.; Cavone, D.; Corrado, V.; Birtolo, F.; Tricase, P.; Fuso, R.; Vilardi, V.; Sumerano, M.; L’Abbate, N.; et al. Estimates of the Lung Cancer Cases Attributable to Radon in Municipalities of Two Apulia Provinces (Italy) and Assessment of Main Exposure Determinants. Int. J. Environ. Res. Public Health 2018, 15, 1294. [Google Scholar] [CrossRef] [Green Version]
  50. Legge Regionale n. 30 del 3/11/2016: “Norme in Materia di Riduzione Dalle Esposizioni alla Radioattività Naturale Derivante dal gas ‘Radon’ in Ambiente Chiuso”, Modificata dall’art. 25 Legge Regionale 36/2017 del 09/08/2017 e Dall’art.12 Della Legge Regionale 18/2019. Available online: http://www.arpa.puglia.it/web/ guest/agentifisici_radon_normativa (accessed on 14 May 2021).
  51. Legislative Decree 31 July 2020, n. 101 “Implementation of Directive 2013/59 / Euratom” (GU General Series n.201 of 12-08-2020–Ordinary Suppl. N. 29). Available online: https://www.gazzettaufficiale.it/eli/id/2020/08/12/20G00121/sg (accessed on 1 September 2021).
  52. Goto, M.; Yasuoka, Y.; Nagahama, H.; Muto, J.; Omori, Y.; Ihara, H.; Mukai, T. Anomalous changes in atmospheric radon concentration before and after the 2011 northern Wakayama Earthquake (Mj 5.5). Radiat. Prot. Dosim. 2016, 174, 412–418. [Google Scholar] [CrossRef] [Green Version]
  53. Muhammad, S.; Ullah, R.; Turab, S.A.; Khan, M.Y.; Khattak, N.U.; Khan, M.A. Radon concentration in drinking water and soil after the September 24, 2019, Mw 5.8 earthquake, Mirpur, Azad Jammu, and Kashmir: An evaluation for potential risk. Environ. Sci. Pollut. Res. 2020, 27, 32628–32636. [Google Scholar] [CrossRef]
  54. Omori, Y.; Nagahama, H.; Yasuoka, Y.; Muto, J. Radon degassing triggered by tidal loading before an earthquake. Sci. Rep. 2021, 11, 1–10. [Google Scholar] [CrossRef]
  55. Soldati, G.; Cannelli, V.; Piersanti, A. Monitoring soil radon during the 2016–2017 central Italy sequence in light of seismicity. Sci. Rep. 2020, 10, 1–12. [Google Scholar] [CrossRef] [PubMed]
  56. Tuccimei, P.; Mollo, S.; Soligo, M.; Scarlato, P.; Castelluccio, M. Real-time setup to record radon emission during rock de-formation: Implications for geochemical surveillance. Geosci. Instrum. Methods Data Syst. Discuss. 2015, 5, 39–62. [Google Scholar]
  57. Piersanti, A.; Cannelli, V.; Galli, G. The Pollino 2012 seismic sequence: Clues from continuous radon monitoring. Solid Earth 2016, 7, 1303–1316. [Google Scholar] [CrossRef] [Green Version]
  58. Içhedef, M.; Giammanco, S.; Neri, M.; Catalano, R.; Immé, G.; Morelli, D.; Muré, F.; Giudice, N. In soil radon anomalies and volcanic activity on Mt. Etna (Italy). J. Environ. Radioact. 2020, 218, 106267. [Google Scholar] [CrossRef]
  59. Iwata, D.; Nagahama, H.; Muto, J.; Yasuoka, Y. Non-parametric detection of atmospheric radon concentration anomalies related to earthquakes. Sci. Rep. 2018, 8, 13028. [Google Scholar] [CrossRef] [PubMed]
  60. Muto, J.; Yasuoka, Y.; Miura, N.; Iwata, D.; Nagahama, H.; Hirano, M.; Ohmomo, Y.; Mukai, T. Preseismic atmospheric radon anomaly associated with 2018 Northern Osaka earthquake. Sci. Rep. 2021, 11, 1–8. [Google Scholar] [CrossRef]
  61. Cerqueiro-Pequeño, J.; Comesaña-Campos, A.; Casal-Guisande, M.; Bouza-Rodríguez, J.-B. Design and Development of a New Methodology Based on Expert Systems Applied to the Prevention of Indoor Radon Gas Exposition Risks. Int. J. Environ. Res. Public Health 2020, 18, 269. [Google Scholar] [CrossRef]
  62. Studnička, F.; Štěpán, J.; Šlégr, J. Low-Cost Radon Detector with Low-Voltage Air-Ionization Chamber. Sensors 2019, 19, 3721. [Google Scholar] [CrossRef] [PubMed] [Green Version]
  63. Alvarellos, A.; Gestal, M.; Dorado, J.; Rabuñal, J.R. Developing a Secure Low-Cost Radon Monitoring System. Sensors 2020, 20, 752. [Google Scholar] [CrossRef] [PubMed] [Green Version]
  64. Kim, S.; Brewster, M.S.; Schwartz, G.G. Communicating radon risk via a smartphone app: A pilot intervention study. BMC Public Health 2020, 20, 1–7. [Google Scholar] [CrossRef] [PubMed]
  65. Butterweck, G.; Schmidt, V.; Buchröder, H.; Hügi, R.; Hohmann, E.; Foerster, E.; Mayer, S. Reference instruments based on spectrometric measurement with Lucas Cells. Radiat. Prot. Dosim. 2015, 167, 298–301. [Google Scholar] [CrossRef]
  66. Abbady, A.; Michel, R. Indoor radon measurement with The Lucas cell technique. Appl. Radiat. Isot. 2004, 61, 1469–1475. [Google Scholar] [CrossRef]
  67. Mulloy, K.B.; James, D.S.; Mohs, K.; Kornfeld, V. Lung Cancer in a Nonsmoking Underground Uranium Miner. Environ. Health Perspect. 2001, 109, 305–309. [Google Scholar] [CrossRef]
  68. L’Abbate, N.; Marcuccio, P.; Dipace, C.; Carbonara, M.; Carioggia, E.; Martucci, V.; Salamanna, S.; Simeone, G.; Vitucci, L. Contaminazione da radon indoor nelle abitazioni pugliesi e valutazione della probabilità di insorgenza di tumore polmonare nella popolazione residente [Indoor radon pollution in houses in the Apulian Region of Italy and evaluation of the probability of lung cancer in the population]. Med. Lav. 2002, 93, 527–539. (In Italian) [Google Scholar]
  69. Hunter, N.; Muirhead, C.; Bochicchio, F.; Haylock, R.G.E. Calculation of lifetime lung cancer risks associated with radon exposure, based on various models and exposure scenarios. J. Radiol. Prot. 2015, 35, 539–555. [Google Scholar] [CrossRef] [Green Version]
  70. Bochicchio, F.; Campos Venuti, G.; Piermattei, S.; Torri, G.; Nuccetelli, C.; Risica, S.; Tommasino, L. Results of the national survey on radon indoors in the all the 21 Italian Regions. In Proceedings of the “Radon in the Living Environment” Workshop, Athens, Greece, 19–23 April 1999; pp. 997–1006. [Google Scholar]
  71. Loffredo, F.; Savino, F.; Amato, R.; Irollo, A.; Gargiulo, F.; Sabatino, G.; Serra, M.; Quarto, M. Indoor Radon Concentration and Risk Assessment in 27 Districts of a Public Healthcare Company in Naples, South Italy. Life 2021, 11, 178. [Google Scholar] [CrossRef]
  72. Vienneau, D.; Boz, S.; Forlin, L.; Flückiger, B.; de Hoogh, K.; Berlin, C.; Bochud, M.; Bulliard, J.-L.; Zwahlen, M.; Röösli, M. Residential radon—Comparative analysis of exposure models in Switzerland. Environ. Pollut. 2020, 271, 116356. [Google Scholar] [CrossRef]
  73. Antignani, S.; Venoso, G.; Ampollini, M.; Caprio, M.; Carpentieri, C.; Di Carlo, C.; Caccia, B.; Hunter, N.; Bochicchio, F. A 10-year follow-up study of yearly indoor radon measurements in homes, review of other studies and implications on lung cancer risk estimates. Sci. Total. Environ. 2020, 762, 144150. [Google Scholar] [CrossRef] [PubMed]
  74. Murphy, P.; Dowdall, A.; Long, S.; Curtin, B.; Fenton, D. Estimating population lung cancer risk from radon using a resource efficient stratified population weighted sample survey protocol—Lessons and results from Ireland. J. Environ. Radioact. 2021, 233, 106582. [Google Scholar] [CrossRef] [PubMed]
  75. Vimercati, L.; Fucilli, F.; Cavone, D.; De Maria, L.; Birtolo, F.; Ferri, G.M.; Soleo, L.; Lovreglio, P. Radon Levels in Indoor Environments of the University Hospital in Bari-Apulia Region Southern Italy. Int. J. Environ. Res. Public Health 2018, 15, 694. [Google Scholar] [CrossRef] [PubMed] [Green Version]
  76. Khan, S.M.; Chreim, S. Residents’ perceptions of radon health risks: A qualitative study. BMC Public Health 2019, 19, 1–11. [Google Scholar] [CrossRef] [Green Version]
  77. Gaskin, J.; Coyle, D.; Whyte, J.; Krewksi, D. Global Estimate of Lung Cancer Mortality Attributable to Residential Radon. Environ. Health Perspect. 2018, 126, 057009. [Google Scholar] [CrossRef]
  78. Park, E.J.; Lee, H.; Kim, H.C.; Sheen, S.S.; Koh, S.B.; Park, K.S.; Cho, N.H.; Lee, C.-M.; Kang, D.R. Residential Radon Exposure and Cigarette Smoking in Association with Lung Cancer: A Matched Case-Control Study in Korea. Int. J. Environ. Res. Public Health 2020, 17, 2946. [Google Scholar] [CrossRef] [PubMed]
  79. Mirdoraghi, M.; Einor, D.; Asghari, F.B.; Esrafili, A.; Heidari, N.; Mohammadi, A.A.; Yousefi, M. Assess the annual effective dose and contribute to risk of lung cancer caused by internal radon 222 in 22 regions of Tehran, Iran using geographic information system. J. Environ. Health Sci. Eng. 2020, 18, 211–220. [Google Scholar] [CrossRef]
  80. Ge, C.B.; Kim, J.; Labrèche, F.; Heer, E.; Song, C.; Arrandale, V.H.; Pahwa, M.; Peters, C.E.; Demers, P.A. Estimating the burden of lung cancer in Canada attributed to occupational radon exposure using a novel exposure assessment method. Int. Arch. Occup. Environ. Health 2020, 93, 871–876. [Google Scholar] [CrossRef] [Green Version]
  81. Cheng, E.S.; Egger, S.; Hughes, S.; Weber, M.; Steinberg, J.; Rahman, B.; Worth, H.; Ruano-Ravina, A.; Rawstorne, P.; Yu, X.Q. Systematic review and meta-analysis of residential radon and lung cancer in never-smokers. Eur. Respir. Rev. 2021, 30, 200230. [Google Scholar] [CrossRef]
  82. Li, C.; Wang, C.; Yu, J.; Fan, Y.; Liu, D.; Zhou, W.; Shi, T. Residential Radon and Histological Types of Lung Cancer: A Meta-Analysis of Case‒Control Studies. Int. J. Environ. Res. Public Health 2020, 17, 1457. [Google Scholar] [CrossRef] [Green Version]
  83. Ulanowski, A.; Shemiakina, E.; Güthlin, D.; Becker, J.; Preston, D.; Apostoaei, A.I.; Hoffman, F.O.; Jacob, P.; Kaiser, J.C.; Eidemüller, M. ProZES: The methodology and software tool for assessment of assigned share of radiation in probability of cancer occurrence. Radiat. Environ. Biophys. 2020, 59, 601–629. [Google Scholar] [CrossRef] [PubMed]
  84. Harrison, J.D. Lung cancer risk and effective dose coefficients for radon: UNSCEAR review and ICRP conclusions. J. Radiol. Prot. 2021, 41, 433–441. [Google Scholar] [CrossRef] [PubMed]
  85. Chen, J. Evaluation of occupational radon exposure and comparison with residential radon exposure in Canada—A population-level assessment. J. Radiol. Prot. 2020, 41, 1–20. [Google Scholar] [CrossRef] [PubMed]
  86. Lane, R.S.D.; Tomášek, L.; Zablotska, L.B.; Rage, E.; Momoli, F.; Little, J. Low radon exposures and lung cancer risk: Joint analysis of the Czech, French, and Beaverlodge cohorts of uranium miners. Int. Arch. Occup. Environ. Health 2019, 92, 747–762. [Google Scholar] [CrossRef] [Green Version]
  87. Kreuzer, M.; Sobotzki, C.; Schnelzer, M.; Fenske, N. Factors Modifying the Radon-Related Lung Cancer Risk at Low Exposures and Exposure Rates among German Uranium Miners. Radiat. Res. 2017, 189, 165–176. [Google Scholar] [CrossRef]
  88. Maggiore, G.; De Filippis, G.; Totaro, T.; Tamborino, B.; Idolo, A.; Serio, F.; Castorini, I.F.; Valenzano, B.; Riccio, A.; Miani, A.; et al. Evaluation of radon exposure risk and lung cancer incidence/mortality in South-eastern Italy. J. Prev. Med. Hyg. 2020, 61, E31–E38. [Google Scholar] [CrossRef]
  89. Shukla, V.; Chauhan, V.; Kumar, N.; Hazarika, D. Assessment of Rn-222 continuous time series for the identification of anomalous changes during moderate earthquakes of the Garhwal Himalaya. Appl. Radiat. Isot. 2020, 166, 109327. [Google Scholar] [CrossRef]
  90. Sahoo, S.K.; Katlamudi, M.; Barman, C.; Lakshmi, G.U. Identification of earthquake precursors in soil radon-222 data of Kutch, Gujarat, India using empirical mode decomposition based Hilbert Huang Transform. J. Environ. Radioact. 2020, 222, 106353. [Google Scholar] [CrossRef]
  91. Ambrosino, F.; Thinová, L.; Briestenský, M.; Giudicepietro, F.; Roca, V.; Sabbarese, C. Analysis of geophysical and meteorological parameters influencing 222Rn activity concentration in Mladeč caves (Czech Republic) and in soils of Phlegrean Fields caldera (Italy). Appl. Radiat. Isot. 2020, 160, 109140. [Google Scholar] [CrossRef]
Figure 1. Experimental & validated radon detectors. Multiple data collector and web cloud system.
Atmosphere 12 01342 g001
Figure 2. Box plot of radon distributions by month on the ground floor of the Locorotondo residential building location.
Atmosphere 12 01342 g002
Figure 3. Correlations among radon, temperature and humidity.
Atmosphere 12 01342 g003
Figure 4. Trend comparison of radon concentration measurements in the first two months of the detector for validation.
Atmosphere 12 01342 g004
Figure 5. Comparison of the precision (repeatability) of the two detectors (CARQUAI new detector and ARPA detector).
Atmosphere 12 01342 g005
Figure 6. Frequency distribution of earthquake magnitudes.
Atmosphere 12 01342 g006
Figure 7. Median spline distributions of radon concentration and magnitude measurements.
Atmosphere 12 01342 g007
Table 1. Summary statistics of radon concentrations by month (Bq/m3).
Radon Residential LOCOROTONDO (Ground Floor)
MonthNumber of SamplesMedianMinMaxMeanSt.Dev.St.Err.Var. Coef. (%)SkewnessKurtosis
January1824434.01111087412.59274.586.4366.550.181.92
February2780329.1201811358.06269.445.1175.250.953.89
March2996336.3301350324.37232.304.2471.620.783.90
April2805270.8441438366.01323.216.1088.310.873.01
May2350156.5141001222.06206.354.2692.931.354.59
June2879101.384849137.01124.042.3190.531.907.04
July233640.60304895.8068.621.4271.631.374.58
August297644.77023258.0242.530.7873.291.724.16
September288091.399417118.9192.401.7277.710.832.62
October2980134.688833162.97165.913.04101.812.6710.81
November2873338.1813914366.23198.803.7154.280.422.56
December42975.8511706162.92169.768.20104.201.343.99
Annual30,078134.6801811232.72232.731.34100.001.495.14
St.Dev. = Standard deviation; St.Err. = Standard error; Var.Co. = Variation coefficient.
Table 2. Average distributions of temperature and humidity by month on the residential ground floor (Locorotondo).
Temperature Residential (Ground Floor)Humidity Residential (Ground Floor)
MonthNumber of SamplesMeanSt.Dev.St.Err.Var. Coef. (%)Number of SamplesMeanSt.Dev.St.Err.Var. Coef. (%)
January182421.770.760.023.50182443.752.410.065.51
February278223.001.150.025.02278037.274.660.0912.50
March296623.101.230.025.32296636.333.390.069.32
April208523.951.140.034.77280537.903.920.0710.35
May235026.420.700.012.64235040.393.470.078.59
June287927.391.320.024.83287945.792.980.066.52
July233631.430.730.022.33233640.922.500.056.12
August297633.340.740.012.23297642.272.640.056.24
September288031.591.310.024.14288043.633.710.078.50
October298026.811.190.024.43298045.573.330.067.31
November42726.160.250.010.9642845.651.080.052.36
DecemberData not available---------
Annual27,20527.023.950.0214.6227,20741.414.740.0311.45
St.Dev. = Standard deviation; St.Err. = Standard error; Var.Co. = Variation coefficient.
Table 3. Repeatability (RSDr) & Reproducibility (F) of the Radon detectors.
New Detectors (CARQUAI)Arpa Detectors
DateMeanSdRSDrMeanSdRSDr
30/01/2020214.6396.4444.93143.0087.0660.87*
31/01/2020191.26157.1682.17177.08106.0559.88
01/02/2020251.5561.6224.50208.1881.0938.95*
02/02/2020319.68191.8460.01340.00203.7659.95*
03/02/2020149.0552.4235.17104.4445.8643.90*
04/02/2020179.03108.5260.62139.17109.0078.32*
05/02/2020943.14188.0319.77659.52231.5735.11*
06/02/2020720.02230.1731.97596.6785.1614.27
07/02/2020498.07159.3231.99361.5482.9522.94
08/02/2020440.03125.9128.61465.83109.9123.59
09/02/2020138.0361.5844.62107.65112.52104.52*
Total368.17287.7278.15328.63243.2274.01
F = 1.76; p = 0.20. * indicates statistically significant values.
Table 4. Data estimates following the use of the software finalized to assess the annual cases of lung cancer attributable to radon.
Data Input
CityLocorotondo
ProvinceBari
Population14,500
Annual Mean concentration (Bq/m3)233
F0.50
Number of hours a year7000
EEC D 1WLM6.30
Probability of lung cancer in eccess2.83
Data Output
Annual Cumulative Exposure16.29
EEC18.15
210Po (CA)2.12Annual cases of Radon attributable lung cancer3.66
214Pb (CB)2.12
214Bi (Cc)18.00
WLM1.29
Table 5. Median distributions of radon and magnitude on the ground floor of the residential Locorotondo building by month.
Radon Residential (Ground Floor)Magnitude
MonthNumber of SamplesMedianMinMaxNumber of MeasurementsMedianMinMax
January1824434.011110871202.402.007.80
February2780329.12018111882.302.006.90
March2966336.33013501872.302.007.60
April2805270.84414381852.302.006.40
May2350156.51410011962.302.006.70
June2879101.3848491382.302.007.60
July233640.603048912.402.007.70
August297644.7702321542.302.007.10
September288091.3994171682.302.006.80
October2980134.6888331962.302.007.40
November2873338.1813914172.102.006.10
December42975.8511706Not available---
Annual30,078134.680181116402.302.007.80
Table 6. Risks (ORs) of observing high-magnitude values with high radon high levels.
Magnitude
Radon conc. (≥2.7 mL)(<2.7 mL)Total
(≥557 Bq/m3)43114157
(<557 Bq/m3)34511381483
Total38812521640
Odds Ratio95% LCL95% UCLχ2p
1.2400.8601.8001.3400.240
Conc.: concentration.
Table 7. Adjusted risks (ORs) of observing high-magnitude values (≥2.7 mL) with high radon levels (≥557 Bq/m3) *: statistically significant.
MagnitudeOdds RatioStd. Err.Zp > Z(95% Conf. Interval)
Radon1.231 *0.1132.2600.0241.0281.474
Humidity1.0080.0620.1300.8940.8941.137
Temperature1.436 *0.0995.2300.0001.2541.645
Season0.9930.035−0.2000.8420.9261.065
_cons13.545 *1.03534.1100.00011.66215.733
Conf.: confidence. Cons: value obtained by adjusting for all the variables considered.
Table 8. Adjusted risk (ORs) of observing earthquake magnitudes >2.7 mL at radon concentrations >557 Bq/m3 by season.
Odds RatioStd. Err.Zp > Z(95% Conf. Interval)
Winter1.227 *0.1122.2300.0261.0251.468
Spring1.235 *0.1132.3200.0211.0331.477
Summer1.252 *0.1142.4600.0141.0471.497
Autumn1.221 *0.1122.1900.0291.0211.461
*: statistically significant.
Publisher’s Note: MDPI stays neutral with regard to jurisdictional claims in published maps and institutional affiliations.

