
Potentially Toxic Elements (PTEs) Composition and Human Health Risk Assessment of PM10 on the Roadways of Industrial Complexes in South Korea


Abstract
:1. Introduction
2. Materials and Methods
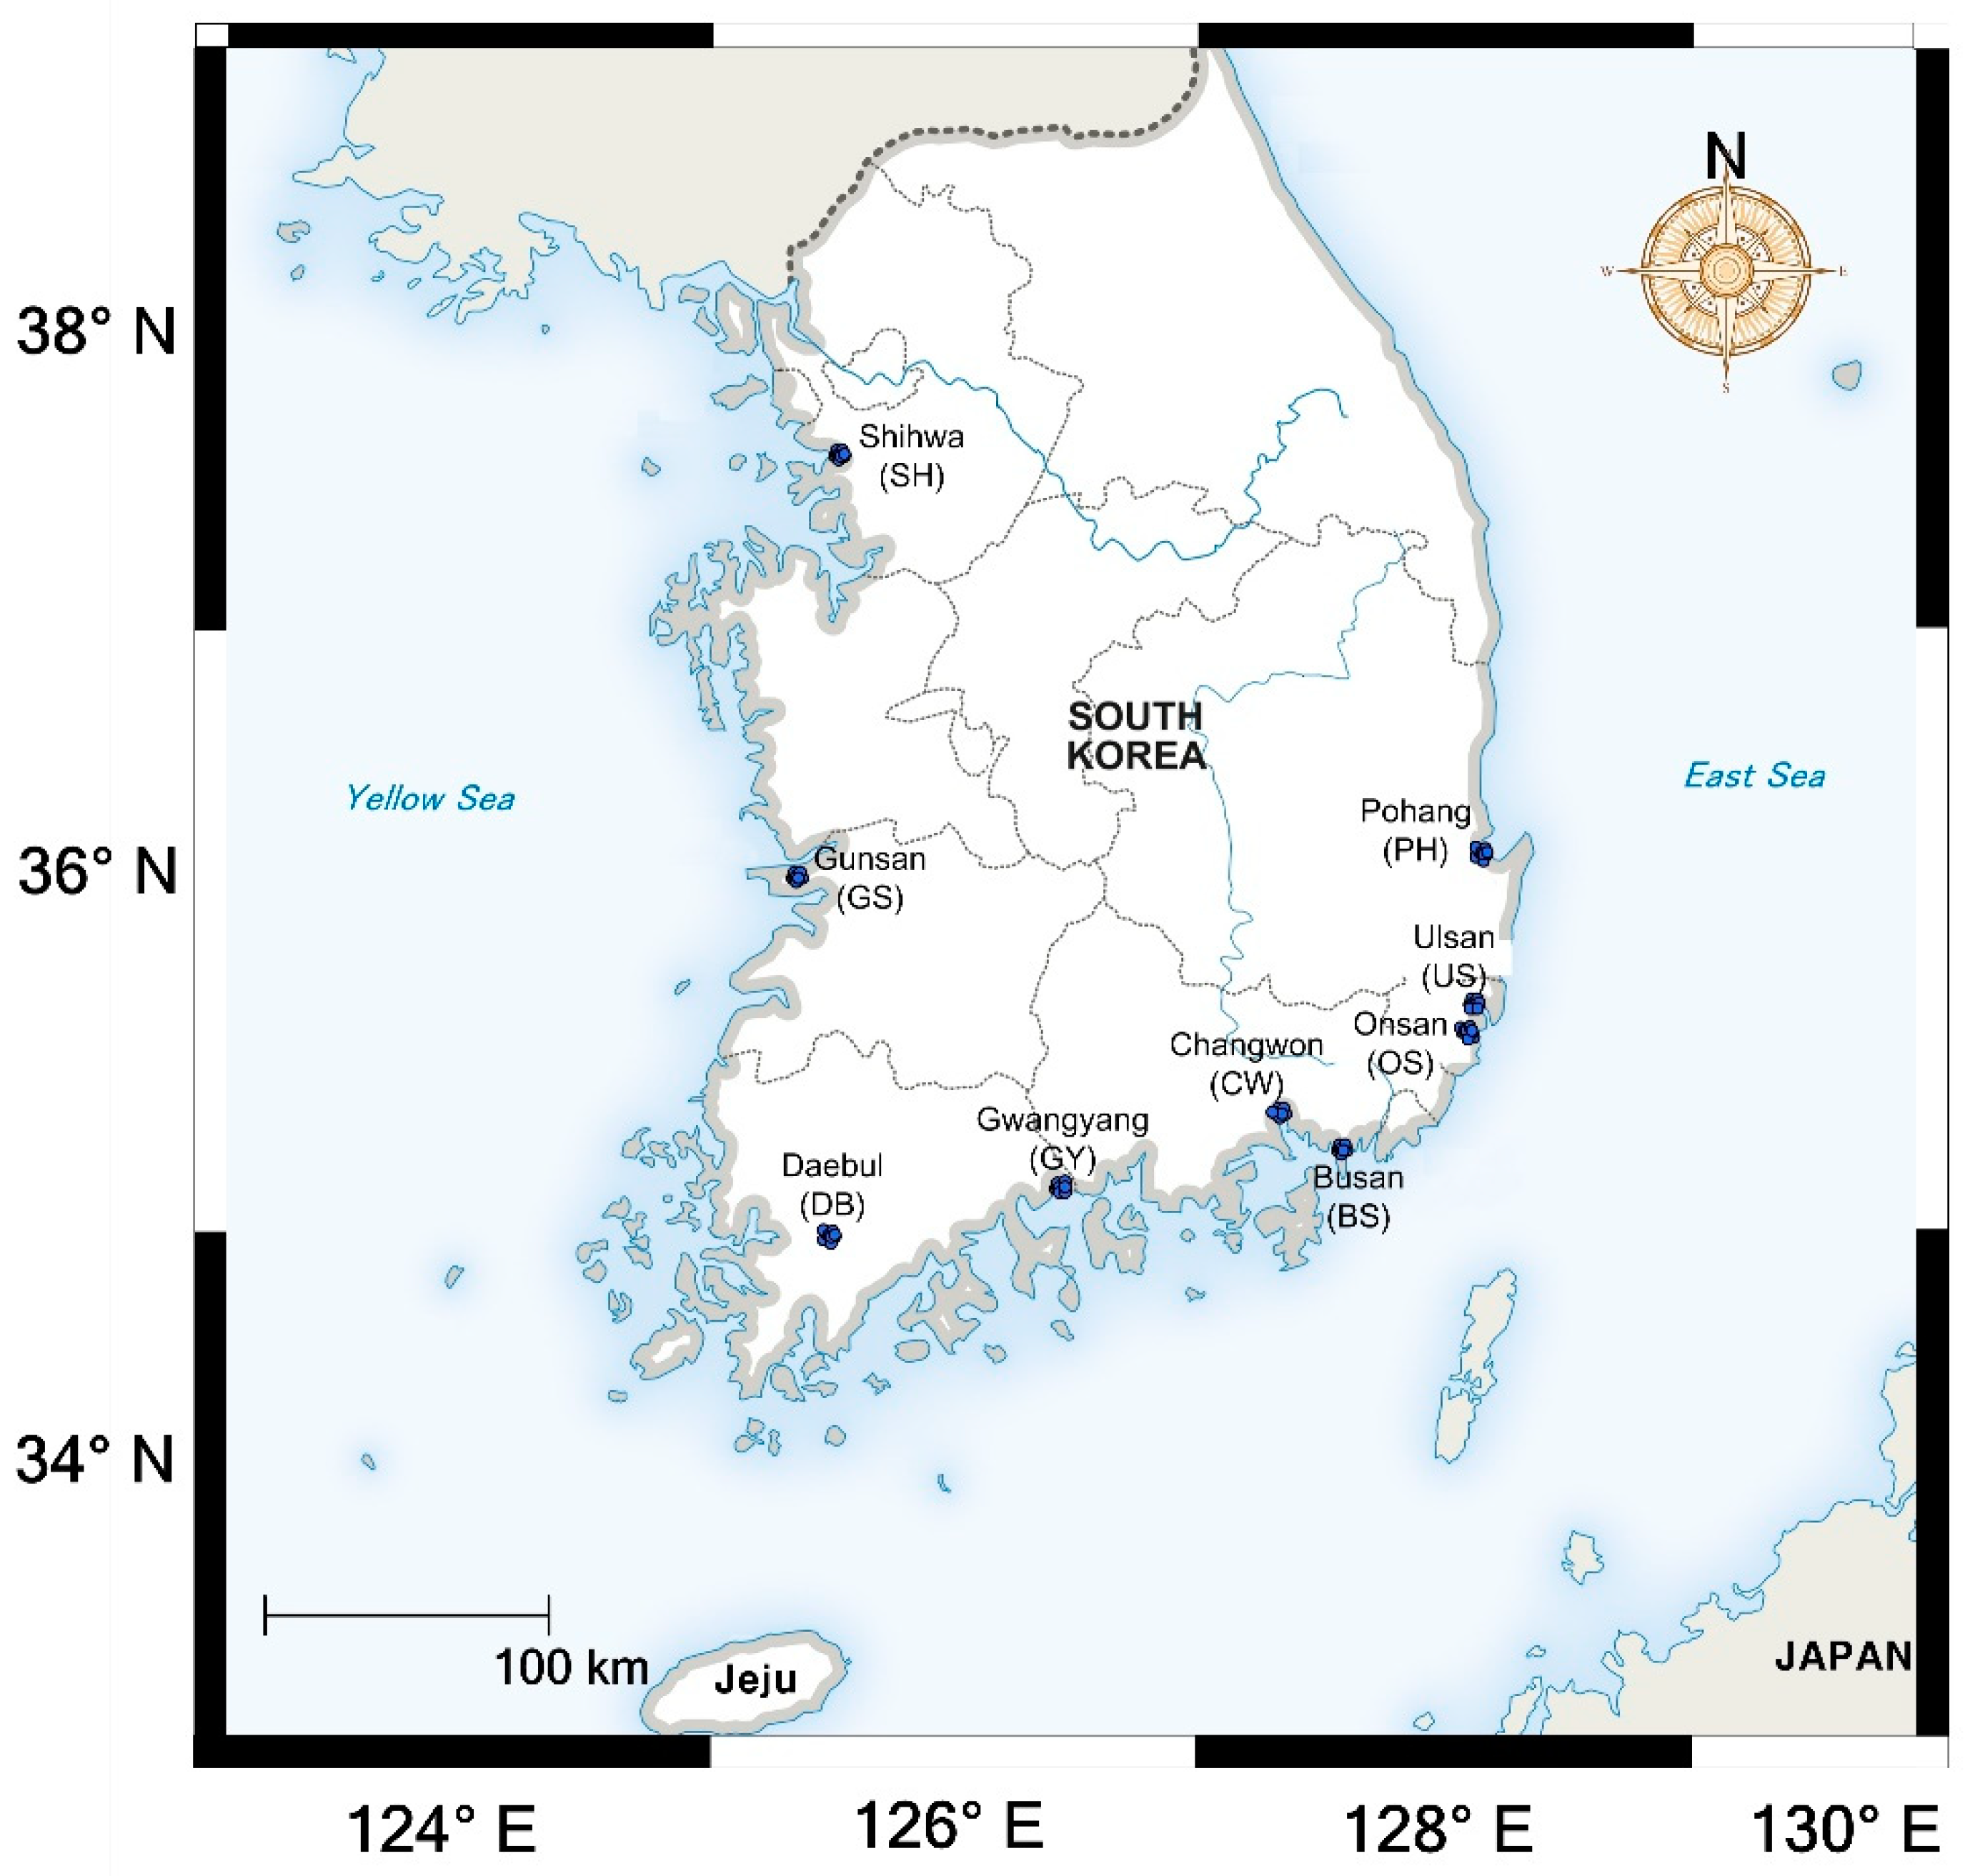
2.1. Study Areas
2.2. Sample Collection and Separation of PM10
2.3. Analytical Techniques and QA/QC
2.4. Pollution Evaluation Methods
2.4.1. Geo-Accumulation Index (Igeo)
2.4.2. Pollution Load Index (PLI)
2.5. Health Risk Assessment
2.5.1. Non-Carcinogenic Risk Assessment
2.5.2. Carcinogenic Risk Assessment
2.6. Statistical Analysis
3. Results and Discussion
3.1. PTE Contamination in PM10 of Road-Deposited Sediment (RDS)
3.1.1. Concentrations of PTEs
3.1.2. Assessment of Pollution Degree with Igeo and PLI
3.2. Source Identification of PTEs in PM10 from RDS
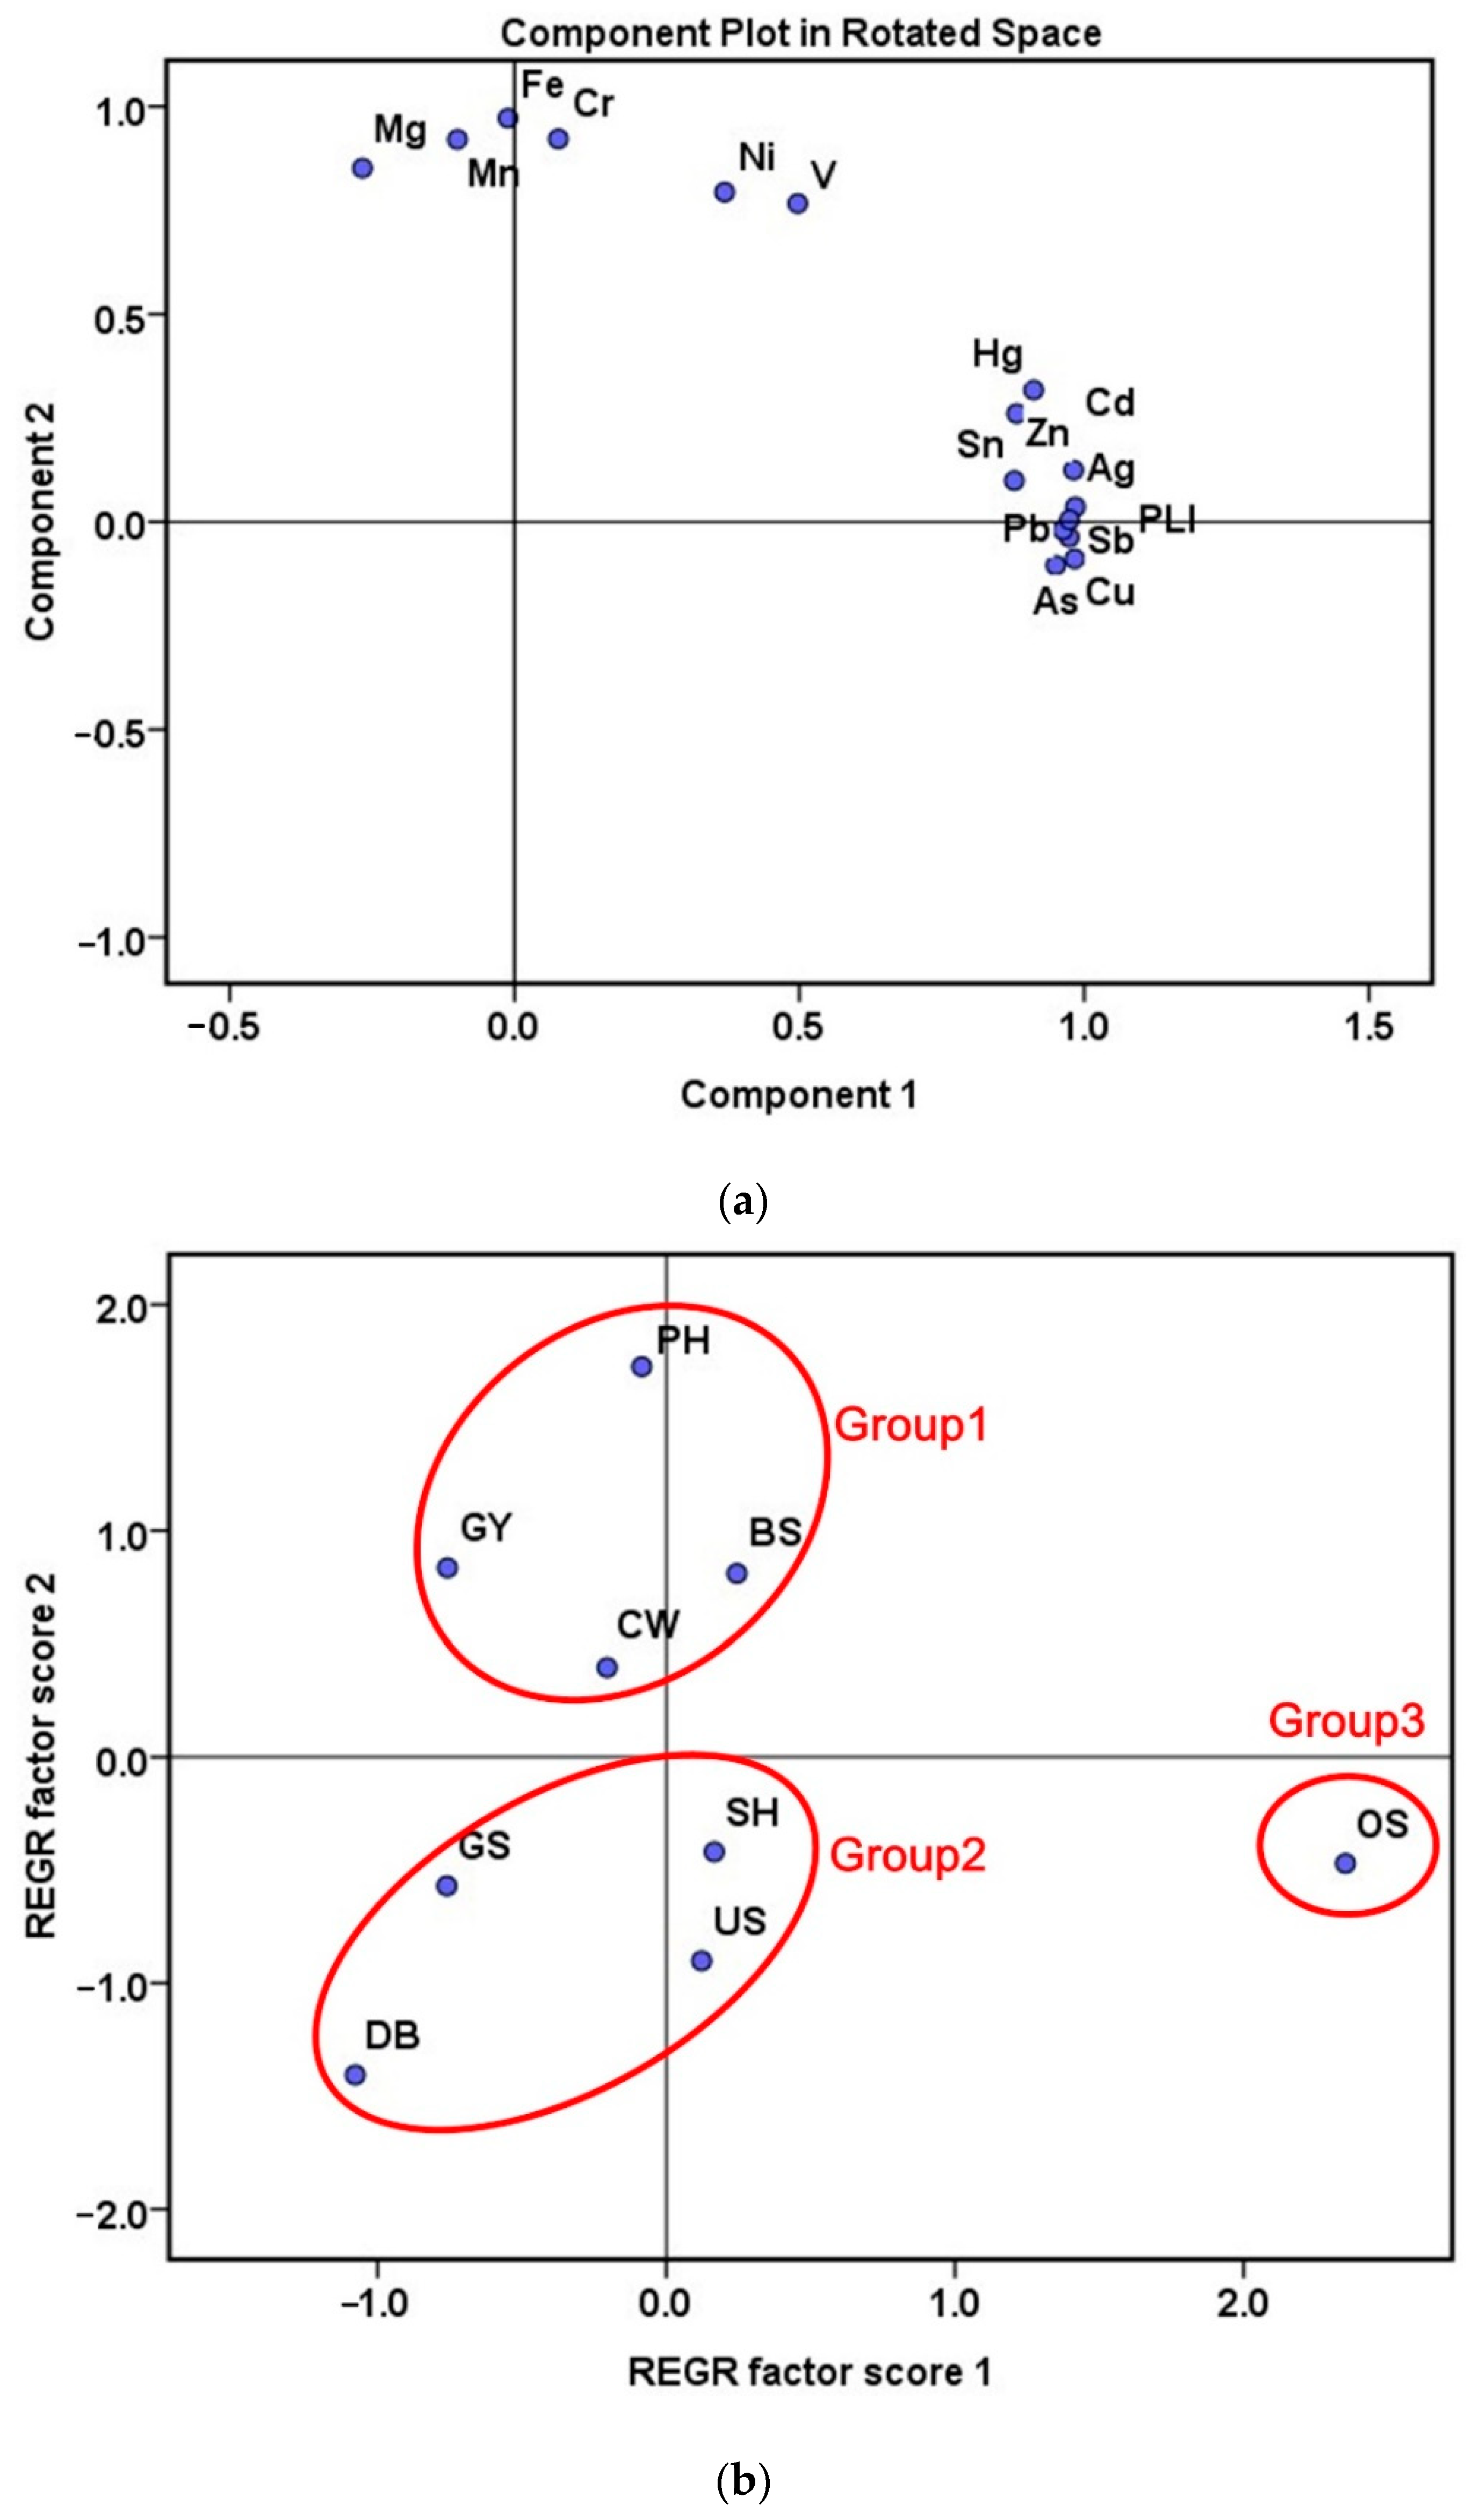
3.2.1. Source Apportionment of PTEs
3.2.2. Chemical Tracers of Non-Exhaust Emissions
3.3. Health Risk Assessment of PTEs in PM10 from RDS
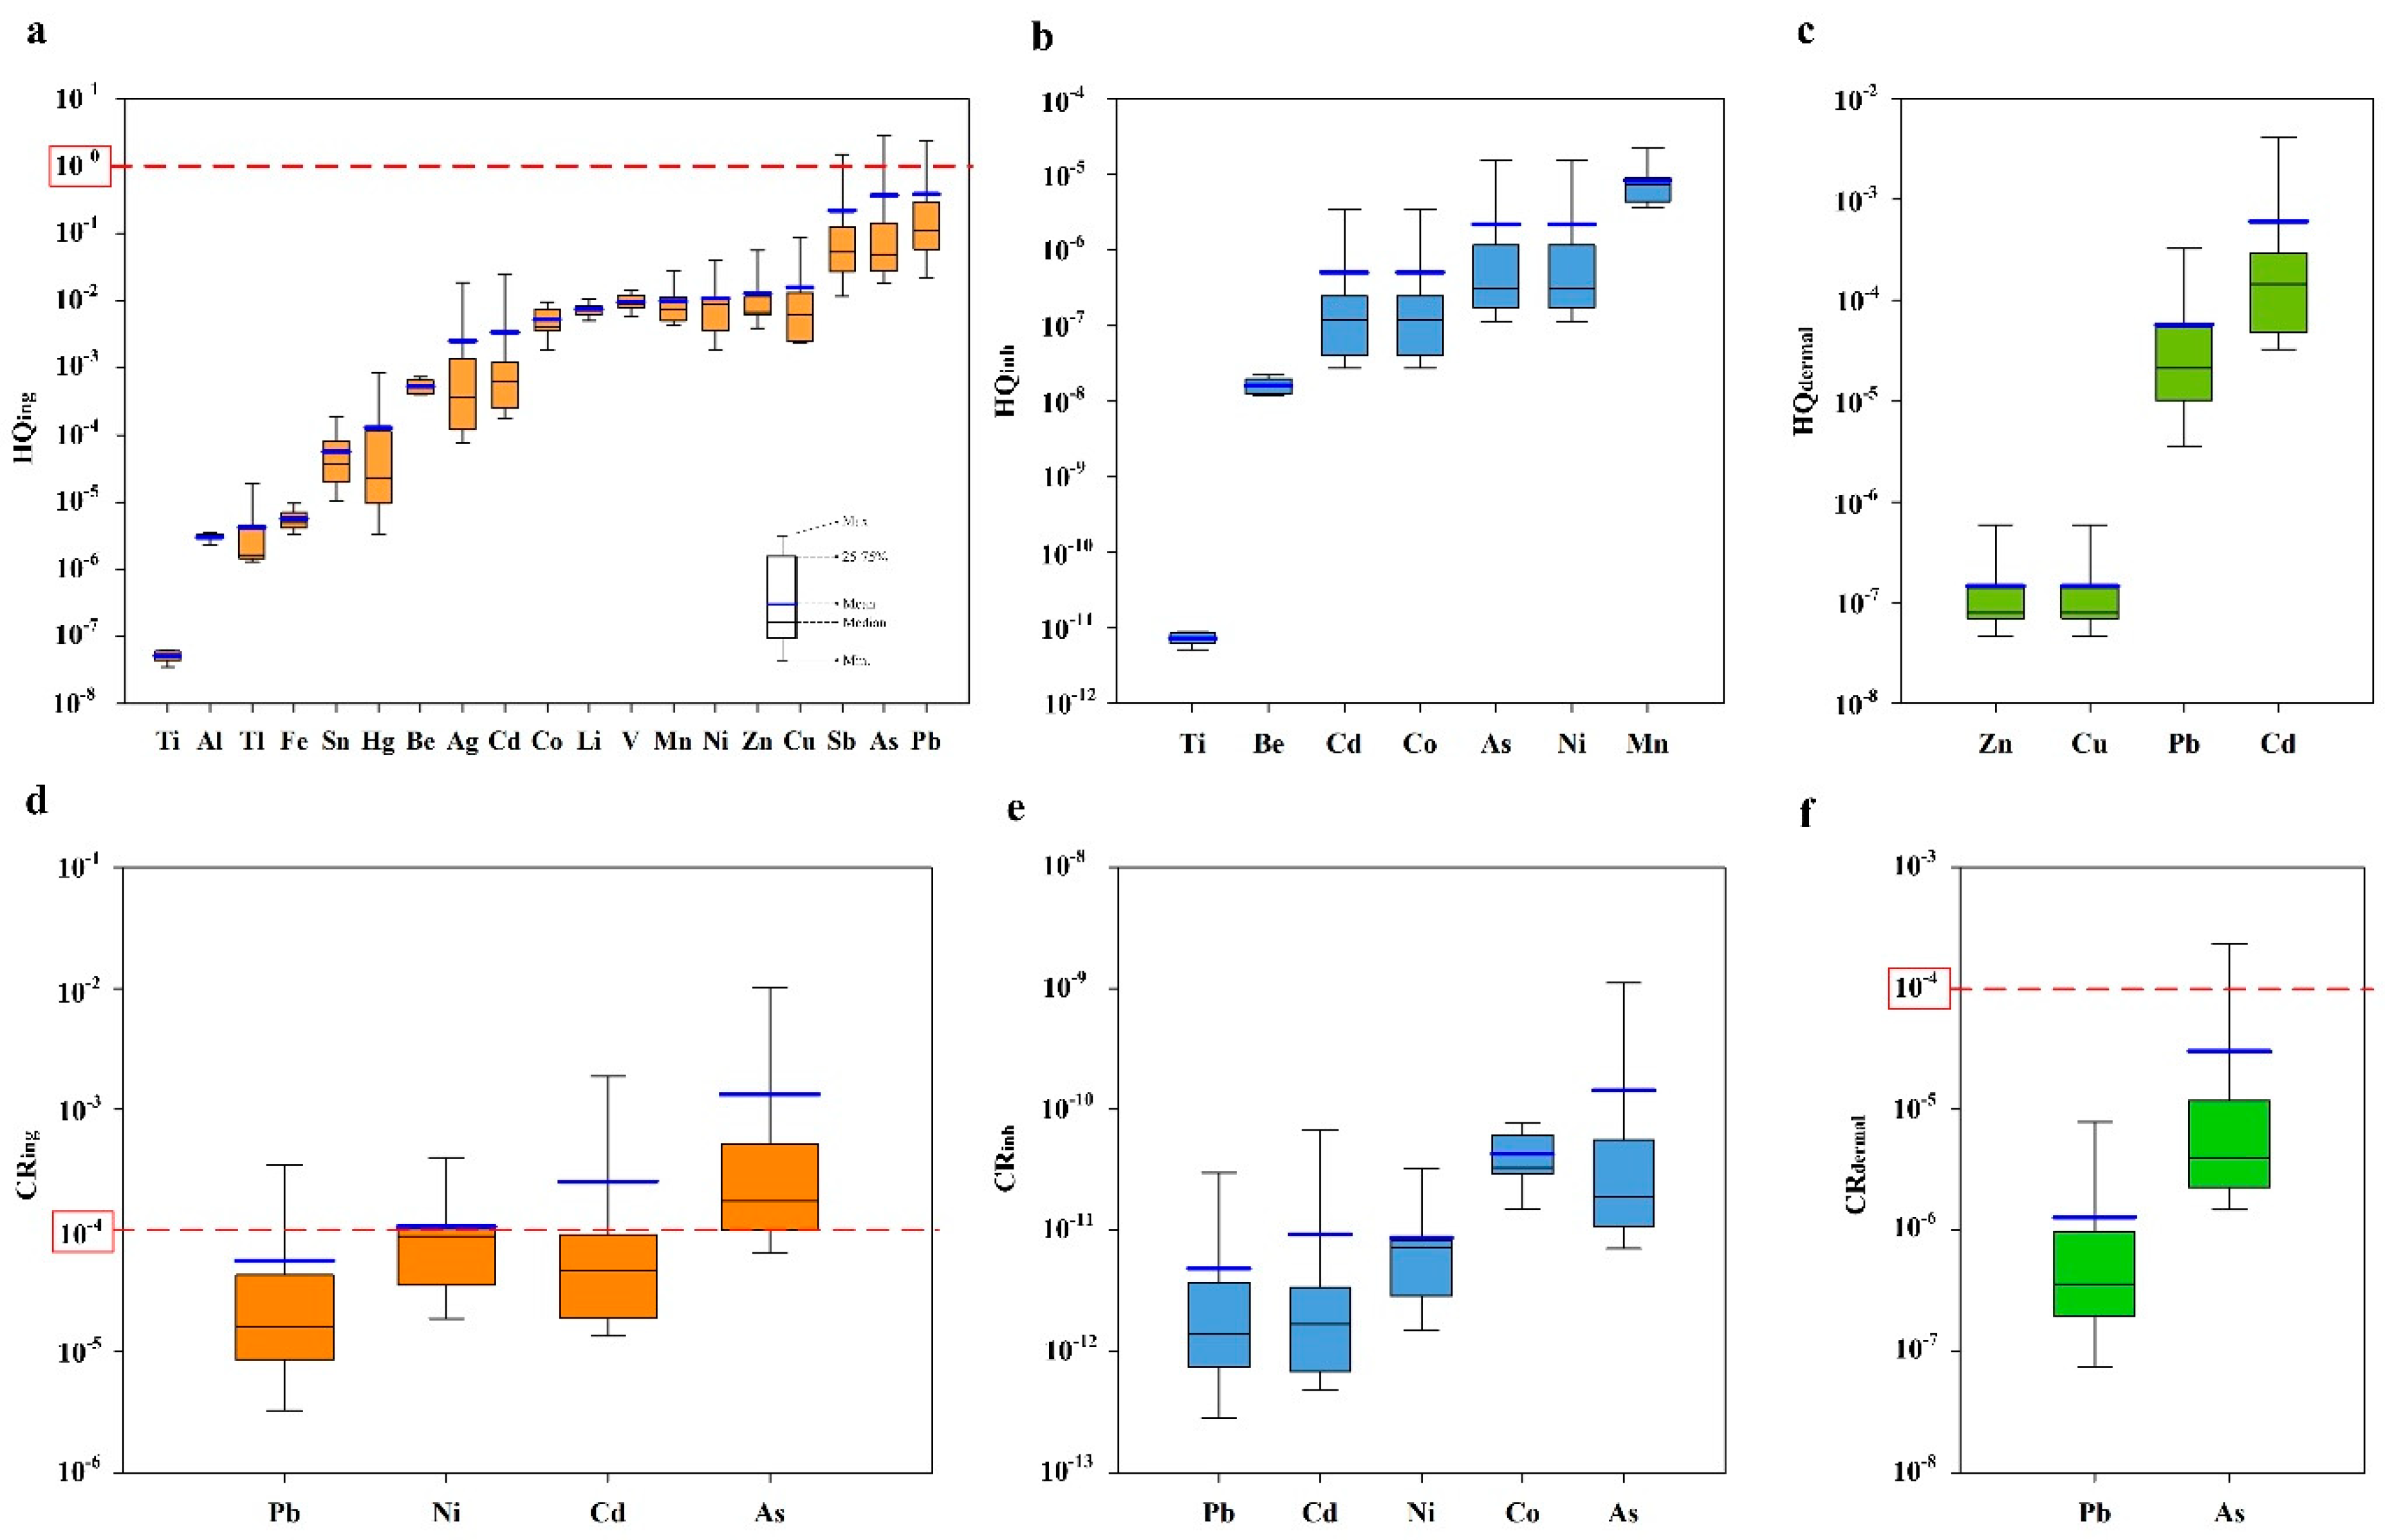
3.3.1. Non-Carcinogenic and Carcinogenic Risk
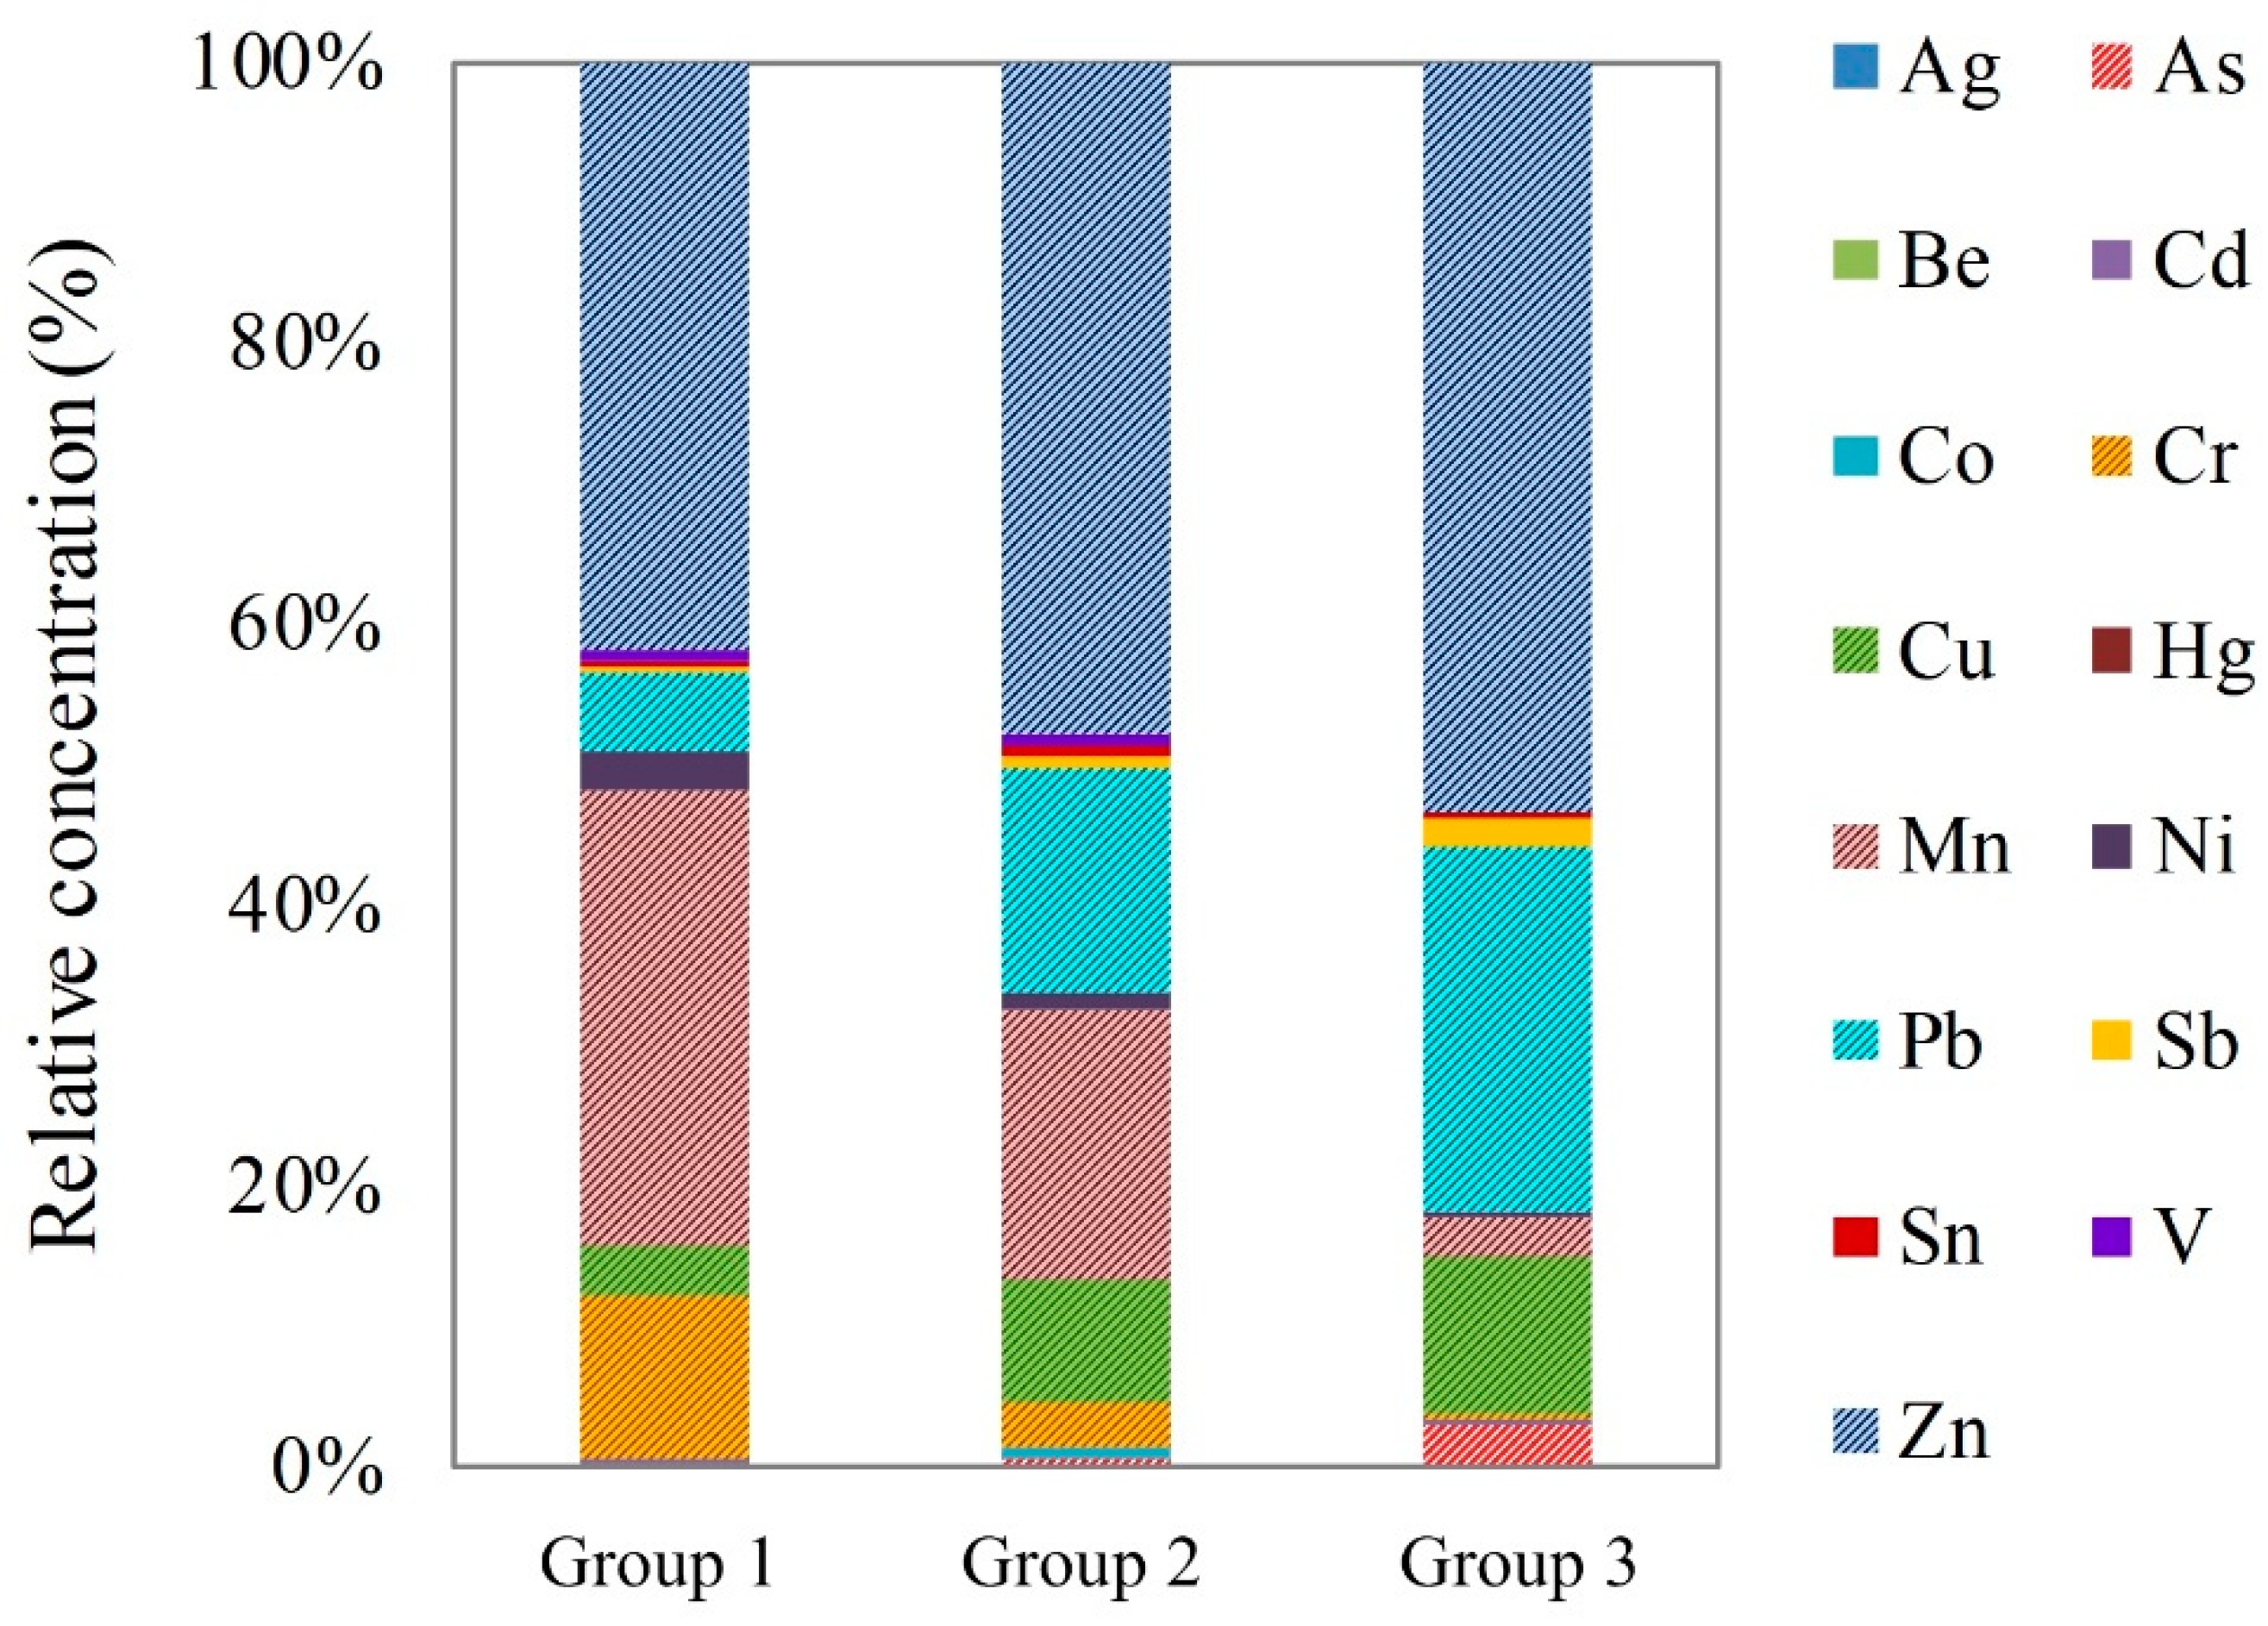
3.3.2. Pollution Sources of Traffic-Origin PTEs and Health Risks
4. Conclusions
Supplementary Materials
Author Contributions
Funding
Institutional Review Board Statement
Informed Consent Statement
Data Availability Statement
Acknowledgments
Conflicts of Interest
References
- Loganathan, P.; Vigneswaran, S.; Kandasamy, J. Road-deposited sediment pollutants: A critical review of their characteristics, source apportionment, and management. Crit. Rev. Environ. Sci. Technol. 2013, 43, 1315–1348. [Google Scholar] [CrossRef]
- Ordoñez, A.; Loredo, J.; De Miguel, E.; Charlesworth, S. Distribution of heavy Metals in the street dusts and soils of an industrial city in Northern Spain. Arch. Environ. Contam. Toxicol. 2003, 44, 160–170. [Google Scholar] [CrossRef] [PubMed]
- Denby, B.R.; Kupiainen, K.J.; Gustafsson, M. Review of road dust emissions. In Non-Exhaust Emissions: An Urban Air Quality Problem for Public Health; Impact and Mitigation Measures; Amato, F., Ed.; Academic Press: Amsterdam, The Netherlands, 2018; pp. 183–203. [Google Scholar] [CrossRef]
- Lorenzi, D.; Entwistle, J.A.; Cave, M.; Dean, J.R. Determination of polycyclic aromatic hydrocarbons in urban street dust: Implications for human health. Chemosphere 2011, 83, 970–977. [Google Scholar] [CrossRef] [PubMed]
- United States Environmental Protection Agency. Technical Air Pollution Resources. Available online: http://www.epa.gov/ttn/chief/ap42/ch13/ (accessed on 1 September 2020).
- Wang, L.; Wang, L.; Tao, W.; Smardon, R.C.; Shi, X.; Lu, X. Characteristics, sources, and health risk of polycyclic aromatic hydrocarbons in urban surface dust: A case study of the city of Xi’an in Northwest China. Environ. Sci. Pollut. Res. 2016, 23, 13389–13402. [Google Scholar] [CrossRef] [PubMed]
- Gunawardana, C.; Goonetilleke, A.; Egodawatta, P.; Dawes, L.; Kokot, S. Source characterization of road dust based on chemical and mineralogical composition. Chemosphere 2012, 87, 163–170. [Google Scholar] [CrossRef] [Green Version]
- Wei, B.; Yang, L. A review of heavy metal contaminations in urban soils, urban road dusts and agricultural soils from China. Microchem. J. 2010, 94, 99–107. [Google Scholar] [CrossRef]
- Kong, S.; Lu, B.; Ji, Y.; Zhao, X.; Bai, Z.; Xu, Y.; Liu, Y.; Jiang, H. Risk assessment of heavy metals in road and soil dusts within PM2.5, PM10 and PM100 fractions in Dongying city, Shandong Province, China. J. Environ. Monit. 2012, 14, 791–803. [Google Scholar] [CrossRef]
- Zheng, N.; Liu, J.; Wang, Q.; Liang, Z. Heavy metals exposure of children from stairway and sidewalk dust in the smelting district, northeast of China. Atmos. Environ. 2010, 44, 3239–3245. [Google Scholar] [CrossRef]
- Timmers, V.R.J.H.; Achten, P.A.J. Non-exhaust PM emissions from electric vehicles. Atmos. Environ. 2016, 134, 10–17. [Google Scholar] [CrossRef]
- Grigoratos, T.; Martini, G. Brake wear particle emissions: A review. Environ. Sci. Pollut. Res. 2015, 22, 2491–2504. [Google Scholar] [CrossRef] [Green Version]
- Kumar, L.; Morawska, W.; Birmili, P.; Paasonen, M.; Hu, M.; Kulmala, R. Britter Ultrafine particles in cities. Environ. Int. 2014, 66, 1–10. [Google Scholar] [CrossRef] [Green Version]
- Denier van der Gon, H.; Hulskotte, J.; Jozwicka, M.; Kranenburg, R.; Kuenen, J.; Visschedijk, A. European emission inventories and projections for road transport non-exhaust emissions: Analysis of consistency and gaps in emission inventories from EU member states. In Non-Exhaust Emissions: An Urban Air Quality Problem for Public Health; Impact and Mitigation Measures; Amato, F., Ed.; Academic Press: Amsterdam, The Netherlands, 2018; pp. 101–121. [Google Scholar] [CrossRef]
- Amato, F.; Pandolfi, M.; Moreno, T.; Furger, M.; Pey, J.; Alastuey, A.; Bukowiecki, N.; Prevot, A.S.H.; Baltensperger, U.; Querol, X. Sources and variability of inhalable road dust particles in three European cities. Atmos. Environ. 2011, 45, 6777–6787. [Google Scholar] [CrossRef]
- Adachi, K.; Tainosho, Y. Characterization of heavy metal particles embedded in tire dust. Environ. Int. 2004, 30, 1009–1017. [Google Scholar] [CrossRef] [PubMed]
- Lu, X.; Pan, H.; Wang, Y. Pollution evaluation and source analysis of heavy metal in roadway dust from a resource-typed industrial city in Northwest China. Atmos. Pollut. Res. 2017, 8, 587–595. [Google Scholar] [CrossRef]
- Fujiwara, E.; Rebagliati, R.J.; Dawidowski, L.; Gomez, D.; Polla, G.; Pereyra, V.; Smichowski, P. Spatial and chemical patterns of size fractionated road dust collected in a megacity. Atmos. Environ. 2011, 45, 1497–1505. [Google Scholar] [CrossRef]
- Kreider, M.L.; Panko, J.M.; McAtee, B.L.; Sweet, L.I.; Finley, B.L. Physical and chemical characterization of tire-related particles: Comparison of particles generated using different methodologies. Sci. Total Environ. 2010, 480, 652–659. [Google Scholar] [CrossRef] [PubMed]
- Lee, J.; Jeong, H.; Ra, K.; Choi, J.Y. Assessment of particle size distribution and pollution impact of heavy metals in road-deposited sediments (RDS) from Shihwa Industrial Complex. J. Environ. Impact Assess. 2020, 29, 8–25. [Google Scholar] [CrossRef]
- Directive 2008/50/EC of the European Parliament and of the Council of 21 May 2008 on ambient air quality and cleaner air for Europe. Off. J. Eur. Union 2008, 152, 1–44.
- Jimmink, B.; de Leeuw, F.; Noordijk, E.; Ostatnická, J.; Coňková, M. Reporting on Ambient Air Quality Assessment in the EU Member States, ETC/ACC Technical Paper 2010/11. 2008. Available online: https://www.eionet.europa.eu/etcs/etc-atni/products/etc-atni-reports/etcacc_tp_2010_11_aqq2008 (accessed on 1 September 2020).
- Thorpe, A.J.; Harrison, R.M. Sources and properties of non-exhaust particulate matter from road traffic: A review. Sci. Total. Environ. 2008, 1, 270–282. [Google Scholar] [CrossRef]
- Cao, Z.; Zhao, L.; Kuang, J.; Chen, Q.; Zhu, G.; Zhang, K.; Wang, S.; Wu, P.; Zhang, X.; Wang, X.; et al. Vehicles as outdoor BFR sources: Evidence from an investigation of BFR occurrence in road dust. Chemosphere 2017, 179, 29–36. [Google Scholar] [CrossRef]
- United States Environmental Protection Agency. Air Quality Criteria for Particulate Matter. Available online: https://cfpub.epa.gov/ncea/risk/recordisplay.cfm?deid=87903 (accessed on 1 September 2020).
- Dockery, D.W.; Pope, C.A., III. Acute respiratory effects of particulate air pollution. Annu. Rev. Public Health 1994, 15, 107–132. [Google Scholar] [CrossRef]
- Godzik, S.; Florkowski, T.; Piorek, S.; Sassen, M.M.A. An attempt to determine the tissue contamination of Quercus robur L. and Pinus silvestris L. foliage by particulates from zinc and lead smelters. Environ. Pollut. 1979, 18, 97–106. [Google Scholar] [CrossRef]
- Wang, S.; Wang, P.; Fan, C.Q.; Xu, H. Phytoavailability and speciation of aluminum carried by total suspended particulates (TSP) to Masson pine (Pinus massoniana L.). Atmos. Environ. 2012, 47, 358–364. [Google Scholar] [CrossRef]
- Davies, S.J.; Unam, L. Smoke-haze from the 1997 Indonesian forest fires: Effects on pollution levels, local climate, atmospheric CO2 concentrations, and tree photosynthesis. For. Ecol. Manag. 1999, 124, 137–144. [Google Scholar] [CrossRef]
- Park, S.S.; Kim, Y.J.; Cho, S.Y.; Kim, S.J. Characterization of PM2.5 aerosols dominated by local pollution and Asian dust observed at an urban site in Korea during aerosol characterization experiments (ACE)–Asia project. J. Air Waste Manag. Assoc. 2007, 57, 434–443. [Google Scholar] [CrossRef] [Green Version]
- Kang, J.K. Development of Road Facilities in Korea Since 1960 Road Brief. CHIRS 2018, 128, 10–12. Available online: https://www.krihs.re.kr/issue/roadPolicyView.do?&seq=761 (accessed on 1 September 2020).
- Ministry of Environment. White Paper of Environment 2006; 11-1480000-000586-10; Ministry of Environment: Sejong, Korea, 2007; p. 627.
- Baek, K.-M.; Kim, M.-J.; Kim, J.-Y.; Seo, Y.-K.; Baek, S.-O. Characterization and health impact assessment of hazardous air pollutants in residential areas near a large iron-steel industrial complex in Korea. Atmos. Pollut. Res. 2020, 11, 1754–1766. [Google Scholar] [CrossRef]
- Commoner, B. The environmental cost of economic growth. Chem Br. 1972, 8, 52–56. [Google Scholar] [PubMed]
- Smith, S.J.; van Aardenne, J.; Klimont, Z.; Andres, R.J.; Volke, A.; Delgado Arias, S. Anthropogenic sulfur dioxide emissions: 1850–2005. Atmos. Chem. Phys. 2011, 11, 1101–1116. [Google Scholar] [CrossRef] [Green Version]
- World Steel Association. Top Steel-Producing Companies. 2020. Available online: https://www.worldsteel.org/steel-by-topic/statistics/top-producers.html (accessed on 1 September 2020).
- Kim, J.-C.; Ko, Y.-H. Future strategy of the Korean petrochemical industry by analysing integrated emerging issues. J. Korea Convergence Soc. 2017, 8, 307–315. [Google Scholar] [CrossRef]
- Jia, J.; Cheng, S.; Yao, S.; Xu, T.; Zhang, T.; Ma, Y.; Wang, H.; Duan, W. Emission characteristics and chemical components of size-segregated particulate matter in iron and steel industry. Atmos. Environ. 2018, 182, 115–127. [Google Scholar] [CrossRef]
- Marquès, M.; Domingo, J.L.; Nadal, M.; Schuhmacher, M. Health risks for the population living near petrochemical industrial complexes. 2. Adverse health outcomes other than cancer. Sci. Total Environ. 2020, 730, 139122. [Google Scholar] [CrossRef]
- Lee, P.-K.; Kang, M.-J.; Yu, S.; Kwon, Y.K. Assessment of trace metal pollution in roof dusts and soils near a large Zn smelter. Sci. Total Environ. 2020, 713, 136536. [Google Scholar] [CrossRef] [PubMed]
- Kelepertzis, E.; Argyraki, A.; Chrastný, V.; Botsou, F.; Skordas, K.; Komárek, M.; Fouskas, A. Metal(loid) and isotopic tracing of Pb in soils, road and house dusts from the industrial area of Volos (central Greece). Sci. Total Environ. 2020, 725, 138300. [Google Scholar] [CrossRef] [PubMed]
- Spencer, M.T.; Shields, L.G.; Sodeman, D.A.; Toner, S.M.; Prather, K.A. Comparison of oil and fuel particle chemical signatures with particle emissions from heavy and light duty vehicles. Atmos. Environ. 2006, 40, 5224–5235. [Google Scholar] [CrossRef]
- Korea Legislation Research Institute. Legislative Evaluation of Laws on the Development and Management of Industrial Complexes. Issue Paper 09–16, 2009; p. 195. Available online: http://www.klri.re.kr (accessed on 1 September 2020).
- Jeong, H.; Choi, J.Y.; Lim, J.; Ra, K. Pollution caused by potentially toxic elements present in road dust from industrial areas in Korea. Atmosphere 2020, 11, 1366. [Google Scholar] [CrossRef]
- Jeong, H.; Lee, J.; Choi, J.Y.; Kim, K.T.; Kim, E.S.; Sun, C.; Park, J.K.; Ra, K. Study on dissolved and particulate heavy metals in stream water and stormwater runoff from Suyeong watershed in Busan Special Management Area, Korea. J. Korean Soc. Mar. Environ. Energy 2019, 22, 203–214. [Google Scholar] [CrossRef]
- Jeong, H.; Choi, J.Y.; Lee, J.; Lim, J.; Ra, K. Heavy metal pollution by road-deposited sediments and its contribution to total suspended solids in rainfall runoff from intensive industrial areas. Environ. Pollut. 2020, 265, 115028. [Google Scholar] [CrossRef]
- Klöckner, P.; Reemtsma, T.; Eisentraut, P.; Braun, U.; Ruhl, A.S.; Wagner, S. Tire and road wear particles in road environment-Quantification and assessment of particle dynamics by Zn determination after density separation. Chemosphere 2019, 222, 714–721. [Google Scholar] [CrossRef]
- He, M.; Wang, N.; Long, X.; Zhang, C.; Ma, C.; Zhong, Q.; Wang, A.; Wang, Y.; Pervaiz, A.; Shan, J. Antimony speciation in the environment: Recent advances in understanding the biogeochemical processes and ecological effects. J. Environ. Sci. 2019, 75, 14–39. [Google Scholar] [CrossRef]
- Yang, S.; Liu, J.; Bi, X.; Ning, Y.; Qiao, S.; Yu, Q.; Zhang, J. Risks related to heavy metal pollution in urban construction dust fall of fast-developing Chinese cities. Ecotoxicol. Environ. Saf. 2020, 197, 110628. [Google Scholar] [CrossRef]
- Adamiec, E.; Jarosz-Krzemińska, E.; Wieszała, R. Heavy metals from non-exhaust vehicle emissions in urban and motorway road dusts. Environ Monit Assess. 2016, 188, 369. [Google Scholar] [CrossRef] [Green Version]
- Bretón, J.G.C.; Bretón, R.M.C.; Guzman, A.A.E.; Guarnaccia, C.; Morales, S.M.; Severino, R.C.L.; Marrón, M.R.; López, G.H.; Lozada, S.E.C.; Kahl, J.D.W.; et al. Trace metal content and health risk assessment of PM10 in an urban environment of León, Mexico. Atmosphere 2019, 10, 573. [Google Scholar] [CrossRef] [Green Version]
- Lanzerstorfer, C.; Logiewa, A. Heavy metals in the finest size fractions of road-deposited sediments. Environ. Pollut. 2018, 239, 522–531. [Google Scholar] [CrossRef]
- Kamani, H.; Mahvi, A.H.; Seyedsalehi, M.; Jaafari, J.; Hoseini, M.; Safari, G.H.; Ashrafi, S.D. Contamination and ecological risk assessment of heavy metals in street dust of Tehran, Iran. Int. J. Environ. Sci. Technol. 2017, 14, 2675–2682. [Google Scholar] [CrossRef]
- Ma, Y.; Mummullage, S.; Wijesiri, B.; Egodawatta, P.; McGree, J.; Ayoko, G.A.; Goonetilleke, A. Source quantification and risk assessment as a foundation for risk management of metals in urban road deposited solids. J. Hazard. Mater. 2021, 124912. [Google Scholar] [CrossRef] [PubMed]
- Wang, L.; Lu, X.; Ren, C.; Li, X.; Chen, C. Contamination assessment and health risk of heavy metals in dust from Changqing industrial park of Baoji, NW China. Environ. Earth Sci. 2014, 71, 2095–2104. [Google Scholar] [CrossRef]
- Ma, J.; Singhirunnusorn, W. Distribution and health risk assessment of heavy metals in surface dusts of Maha Sarakham Municipality. Procedia-Soc. Behav. Sci. 2012, 50, 280–293. [Google Scholar] [CrossRef] [Green Version]
- Shi, G.; Chen, Z.; Bi, C.; Li, Y.; Teng, J.; Wang, L.; Xu, S. Comprehensive assessment of toxic metals in urban and suburban street deposited sediments (SDSs) in the biggest metropolitan area of China. Environ. Pollut. 2010, 158, 694–703. [Google Scholar] [CrossRef]
- Wang, H.; Shen, C.; Kang, Y.; Deng, Q.; Lin, X. Spatial distribution of pollution characteristics and human health risk assessment of exposure to heavy elements in road dust from different functional areas of Zhengzhou, China. Environ. Sci. Pollut. Res. Int. 2020, 27, 26650–26667. [Google Scholar] [CrossRef]
- Ferreira-Baptista, L.; de Miguel, E. Geochemistry and risk assessment of street dust in Luanda, Angola: A tropical urban environment. Atmos. Environ. 2005, 39, 4501–4512. [Google Scholar] [CrossRef] [Green Version]
- Guo, G.; Zhang, D.; Wang, Y. Source apportionment and source-specific health risk assessment of heavy metals in size-fractionated road dust from a typical mining and smelting area, Gejiu, China. Environ. Sci. Pollut. Res. Int. 2021, 28, 9313–9326. [Google Scholar] [CrossRef]
- Wei, C.; Bandowe, B.A.; Han, Y.; Cao, J.; Zhan, C.; Wilcke, W. Polycyclic aromatic hydrocarbons (PAHs) and their derivatives (alkyl-PAHs, oxygenated-PAHs, nitrated-PAHs and azaarenes) in urban road dusts from Xi’an, Central China. Chemosphere 2015, 134, 512–520. [Google Scholar] [CrossRef] [PubMed]
- Hu, B.; Liu, B.; Zhou, J.; Guo, J.; Sun, Z.; Meng, W.; Duan, J. Health risk assessment on heavy metals in urban street dust of Tianjin based on trapezoidal fuzzy numbers. Human Ecolo. Risk Assess. 2016, 22, 678–692. [Google Scholar] [CrossRef]
- Saeedi, M.; Li, L.Y.; Salmanzadeh, M. Heavy metals and polycyclic aromatic hydrocarbons: Pollution and ecological risk assessment in street dust of Tehran. J. Hazard. Mater. 2012, 228, 9–17. [Google Scholar] [CrossRef]
- Li, H.; Qian, X.; Wei, H.; Wang, Y.; Gao, H. Chemical speciation and human health risk of trace metals in urban street dusts from a metropolitan city, Nanjing, SE China. Sci. Total Environ. 2013, 456–457, 212–221. [Google Scholar] [CrossRef]
- Shabanda, I.S.; Koki, I.B.; Low, K.H.; Zain, S.M.; Khor, S.M.; Abu Bakar, N.K. Daily exposure to toxic metals through urban road dust from industrial, commercial, heavy traffic, and residential areas in Petaling Jaya, Malaysia: A health risk assessment. Environ. Sci. Pollut. Res. Int. 2019, 26, 37193–37211. [Google Scholar] [CrossRef]
- Krupnova, T.G.; Rakova, O.V.; Gavrilkina, S.V.; Antoshkina, E.G.; Baranov, E.O.; Yakimova, O.N. Road dust trace elements contamination, sources, dispersed composition, and human health risk in Chelyabinsk, Russia. Chemosphere 2020, 261, 127799. [Google Scholar] [CrossRef] [PubMed]
- Najmeddin, A.; Keshavarzi, B. Health risk assessment and source apportionment of polycyclic aromatic hydrocarbons associated with PM(10) and road deposited dust in Ahvaz metropolis of Iran. Environ. Geochem. Health 2019, 41, 1267–1290. [Google Scholar] [CrossRef]
- Korea Industrial Complex Corporation. Status Statistical Table of National Industrial Complex (1Q,21). Available online: https://www.kicox.or.kr/user/bbs/BD_selectBbs.do?q_bbsCode=1036&q_bbscttSn=20210615181721444&q_order=&q_clCode=2 (accessed on 30 September 2021).
- Korea Research Institute for Human Settlements. KRISHS Policy Brief No. 686. Available online: http://www.klri.re.kr (accessed on 1 September 2020).
- Choi, S.-D.; Kwon, H.-O.; Lee, Y.-S.; Park, E.-J.; Oh, J.-Y. Improving the spatial resolution of atmospheric polycyclic aromatic hydrocarbons using passive air samplers in a multi-industrial city. J. Hazard. Mater. 2012, 241–242, 252–258. [Google Scholar] [CrossRef]
- Thang, P.Q.; Kim, S.-J.; Lee, S.-J.; Ye, J.; Seo, Y.-K.; Baek, S.-O.; Choi, S.-D. Seasonal characteristics of particulate polycyclic aromatic hydrocarbons (PAHs) in a petrochemical and oil refinery industrial area on the west coast of South Korea. Atmos. Environ. 2019, 198, 398–406. [Google Scholar] [CrossRef]
- Vu, V.-T.; Lee, B.-K.; Ny, M.T.; Kim, J.-T. A Study on Characteristics of Organic Carbon and Polycyclic Aromatic Hydrocarbons (PAHs) in PM10 at the Residential and Industrial Areas in Ulsan of Korea. In Proceedings of the International Forum on Strategic Technology 2010, Ulsan, Korea, 13–15 October 2010; pp. 263–266. [Google Scholar] [CrossRef]
- Ministry of Environment. Improvement of Air Pollution Emission Inventory and Its Reliability; 411-113-009; Ministry of Environment: Sejong, Korea, 2014; p. 486.
- Hong, N.; Zhu, P.; Liu, A.; Zhao, X.; Guan, Y. Using an innovative flag element ratio approach to tracking potential sources of heavy metals on urban road surfaces. Environ. Pollut. 2018, 243, 410–417. [Google Scholar] [CrossRef]
- Choi, J.Y.; Jeong, H.; Choi, K.-Y.; Hong, G.H.; Yang, D.B.; Kim, K.; Ra, K. Source identification and implications of heavy metals in urban roads for the coastal pollution in a beach town, Busan, Korea. Mar. Pollut. Bull. 2020, 161, 111724. [Google Scholar] [CrossRef]
- Novotny, V.; Chesters, G. Handbook of Nonpoint Pollution: Sources and Management; Van Nostrand Reinhold Company: New York, NY, USA, 1981; p. 255. [Google Scholar]
- Müller, G. Index of geo-accumulation in sediments of the Rhine River. Geo. J. 1969, 2, 108–118. [Google Scholar]
- Rudnick, R.L.; Gao, S. Composition of the continental crust. In The Crust; Rudnick, R.L., Ed.; Elsevier: Amsterdam, The Netherlands, 2005; pp. 1–64. [Google Scholar]
- Yoon, J.K.; Kim, D.H.; Kim, T.S.; Park, J.G.; Chung, I.R.; Kim, J.H.; Kim, H. Evaluation on natural background of the soil heavy metals in Korea. J. Soil Groundwater Environ. 2009, 14, 32–39. [Google Scholar]
- National Institute of Environmental Research. Assessment of Soil Contamination by New Soil Contaminants; NIER: Incheon, Korea, 2008; No. 2008-96-1047. [Google Scholar]
- Tomlinson, D.L.; Wilson, J.G.; Harris, C.R.; Jeffrey, D.W. Problems in the assessment of heavy metal levels in estuaries and the formation of a pollution index. Helgolaender Meeresunter. 1980, 33, 566–575. [Google Scholar] [CrossRef] [Green Version]
- United States Environmental Protection Agency. Exposure Factors Handbook. 2011 Edition (Final Report). Available online: https://ofmpub.epa.gov/eims/eimscomm.getfile?p_download_id=522996 (accessed on 27 January 2017).
- United States Environmental Protection Agency. Mid Atlantic Risk Assessment. Regional Screening Level (RSL) Summary Table; EPA: Washington, DC, USA, 2013.
- Adamiec, E.; Jarosz-Krzemińska, E. Human health risk assessment associated with contaminants in the finest fraction of sidewalk dust collected in proximity to trafficked roads. Sci. Rep. 2019, 9, 16364. [Google Scholar] [CrossRef]
- Jose, J.; Srimuruganandam, B. Investigation of road dust characteristics and its associated health risks from an urban environment. Environ. Geochem. Health 2020, 42, 2819–2840. [Google Scholar] [CrossRef]
- Men, C.; Liu, R.; Xu, F.; Wang, Q.; Guo, L.; Shen, Z. Pollution characteristics, risk assessment, and source apportionment of heavy metals in road dust in Beijing, China. Sci. Total Environ. 2018, 612, 138–147. [Google Scholar] [CrossRef]
- United States Environmental Protection Agency. Exposure Factors Handbook (1997, Final Report); U.S. Environmental Protection Agency: Washington, DC, USA, 1997.
- Zhou, Q.; Zheng, N.; Liu, J.; Wang, Y.; Sun, C.; Liu, Q.; Wang, H.; Zhang, J. Residents health risk of Pb, Cd and Cu exposure to street dust based on different particle sizes around zinc smelting plant, Northeast of China. Environ. Geochem. Health 2015, 37, 207–220. [Google Scholar] [CrossRef]
- Hieu, N.T.; Lee, B.K. Characteristics of particulate matter and metals in the ambient air from residential area in the largest city in Korea. Atmos. Environ. 2010, 98, 526–537. [Google Scholar] [CrossRef]
- Zhou, S.; Yuan, Q.; Li, W.; Lu, Y.; Zhang, Y.; Wang, W. Trace metals in atmospheric fine particles in one industrial urban city: Spatial variations, sources, and health implications. J. Environ. Sci. 2014, 26, 205–213. [Google Scholar] [CrossRef]
- Koukoulakis, K.G.; Chrysohou, E.; Kanellopoulos, P.G.; Karavoltsos, S.; Katsouras, G.; Dassenakis, M.; Nikolelis, D.; Bakeas, E. Trace elements bound to airborne PM10 in a heavily industrialized site nearby Athens: Seasonal patterns, emission sources, health implications. Atmos. Pollut. Res. 2019, 10, 1347–1356. [Google Scholar] [CrossRef]
- Guan, Q.; Zhao, R.; Pan, N.; Wang, F.; Yang, Y.; Luo, H. Source apportionment of heavy metals in farmland soil of Wuwei, China: Comparison of three receptor models. J. Clean. Prod. 2019, 237, 117792. [Google Scholar] [CrossRef]
- Yaroshevsky, A.A. Abundances of chemical elements in the Earth’s crust. Geochem. Int. 2006, 44, 48–55. [Google Scholar] [CrossRef]
- Rudnick, R.L.; Shaner, A.; Webb, S.; Portillo, K. Top 5 Elements in the Upper Crust of Earth. Available online: https://repository.hou.usra.edu/handle/20.500.11753/1307 (accessed on 10 October 2019).
- Westerlund, K.G. Metal Emissions from Stockholm Traffic—Wear of Brake Linings. Report SLB Analysis No. 3:2001; Stockholm Environment and Health Protection Administration: Stockholm, Sweden, 2001. [Google Scholar]
- von Uexküll, O.; Skerfving, S.; Doyle, R.; Braungart, M. Antimony in brake pads-a carcinogenic component? J. Clean. Prod. 2005, 13, 19–31. [Google Scholar] [CrossRef]
- Iijima, A.; Sato, K.; Yano, K.; Tago, H.; Kato, M.; Kimura, H.; Furuta, N. Particle size and composition distribution analysis of automotive brake abrasion dusts for the evaluation of antimony sources of airborne particulate matter. Atmos. Environ. 2007, 41, 4908–4919. [Google Scholar] [CrossRef]
- Sun, T.Y.; Gottschalk, F.; Hungerbühler, K.; Nowack, B. Comprehensive probabilistic modelling of environmental emissions of engineered nanomaterials. Environ. Pollut. 2014, 185, 69–76. [Google Scholar] [CrossRef]
- Slomberg, D.L.; Auffan, M.; Guéniche, N.; Angeletti, B.; Campos, A.; Borschneck, D.; Aguerre-Chariol, O.; Rose, J. Anthropogenic Release and Distribution of Titanium Dioxide Particles in a River Downstream of a Nanomaterial Manufacturer Industrial Site. Front. Environ. Sci. 2020, 8, 76. [Google Scholar] [CrossRef]
- Hwang, H.M.; Fiala, M.J.; Park, D.; Wade, T.L. Review of pollutants in urban road dust and stormwater runoff: Part 1. Heavy metals released from vehicles. Int. J. Urban Sci. 2016, 20, 334–360. [Google Scholar] [CrossRef]
- McKenzie, E.R.; Money, J.E.; Green, P.G.; Young, T.M. Metals associated with stormwater-relevant brake and tire samples. Sci. Total Environ. 2009, 407, 5855–5860. [Google Scholar] [CrossRef] [Green Version]
- Mark, J.E.; Erman, B.; Roland, M. The Science and Technology of Rubber, 4th ed.; Academy Press: New York, NY, USA, 2013; pp. 337–381. [Google Scholar]
- Varrica, D.; Bardelli, F.; Dongarrà, G.; Tamburo, E. Speciation of Sb in airborne particulate matter, vehicle brake linings, and brake pad wear residues. Atmos. Environ. 2013, 64, 18–24. [Google Scholar] [CrossRef]
- Hu, X.; He, M.; Li, S. Antimony leaching release from brake pads: Effect of pH, temperature and organic acids. J. Environ. Sci. 2015, 1, 11–17. [Google Scholar] [CrossRef]
- Dupont, D.; Arnout, S.; Jones, P.T.; Binnemans, K. Antimony Recovery from End-of-Life Products and Industrial Process Residues: A Critical Review. J. Sustain. Metall. 2016, 2, 79–103. [Google Scholar] [CrossRef] [Green Version]
- Zhang, X.; Yang, L.; Li, Y.; Li, H.; Wang, W.; Ye, B. Impacts of lead/zinc mining and smelting on the environment and human health in China. Environ. Monit. Assess. 2012, 184, 2261–2273. [Google Scholar] [CrossRef]
- Xia, Q.; Zhang, J.; Chen, Y.; Ma, Q.; Peng, J.; Rong, G.; Tong, Z.; Liu, X. Pollution, sources and human health risk assessment of potentially toxic elements in different land use types under the background of industrial cities. Sustainability 2020, 12, 2121. [Google Scholar] [CrossRef] [Green Version]
- Karanasiou, A.; Amato, F.; Moreno, T.; Lumbrearas, J.; Borge, R.; Linares, C.; Boldo, E.; Alastuey, A.; Querol, X. Road Dust Emission Sources and Assessment of Street Washing Effect. Aerosol Air Qual. Res. 2014, 14, 734–743. [Google Scholar] [CrossRef]
- Gietl, J.K.; Lawrence, R.; Thorpe, A.J.; Harrison, R.M. Identification of brake wear particles and derivation of a quantitative tracer for brake dust at a major road. Atmos. Environ. 2010, 44, 141–146. [Google Scholar] [CrossRef]
- Parviainen, A.; Papaslioti, E.M.; Casares-Porcel, M.; Garrido, C.J. Antimony as a tracer of non-exhaust traffic emissions in air pollution in Granada (S Spain) using lichen bioindicators. Environ. Pollut. 2020, 263, 114482. [Google Scholar] [CrossRef]
- Weckwerth, G. Verification of traffic emitted aerosol components in the ambient air of Cologne (Germany). Atmos. Environ. 2001, 35, 5525–5536. [Google Scholar] [CrossRef]
- Grigoratos, T.; Gustafsson, M.; Eriksson, O.; Martini, G. Experimental investigation of tread wear and particle emission from tyres with different treadwear marking. Atmos. Environ. 2018, 182, 200–212. [Google Scholar] [CrossRef]
- California Stormwater Quality Association. Brake pad copper reduction-metrics for tracking progress. In Menlo Park, CA: Technical Memo; California Stormwater Quality Association: Redondo Beach, CA, USA, 2016; p. 4. [Google Scholar]
- Singh, V.; Biswal, A.; Kesarkar, A.P.; Mor, S.; Ravindra, K. High resolution vehicular PM10 emissions over megacity Delhi: Relative contributions of exhaust and non-exhaust sources. Sci. Total Environ. 2020, 699, 134273. [Google Scholar] [CrossRef] [PubMed]
- Shinya, M.; Funasaka, K.; Katahira, K.; Ishikawa, M.; Matsui, S. Lead isotope ratios in urban road runoff. Water Sci. Technol. 2006, 53, 185–191. [Google Scholar] [CrossRef] [PubMed]
- Gottschalk, F.; Kost, E.; Nowack, B. Engineered nanomaterials in water and soils: A risk quantification based on probabilistic exposure and effect modeling. Environ. Toxicol. Chem. 2013, 32, 1278–1287. [Google Scholar] [CrossRef]
- Yasur, J.; Rani, P.U. Environmental effects of nanosilver: Impact on castor seed germination, seedling growth, and plant physiology. Environ. Sci. Pollut. Res. Int. 2013, 20, 8636–8648. [Google Scholar] [CrossRef] [PubMed]
- Lead, J.R.; Batley, G.E.; Alvarez, P.J.J.; Croteau, M.N.; Handy, R.D.; McLaughlin, M.J.; Judy, J.D.; Schirmer, K. Nanomaterials in the environment: Behavior, fate, bioavailability, and effects-An updated review. Environ. Toxicol. Chem. 2018, 37, 2029–2063. [Google Scholar] [CrossRef]
- Chen, J.; Hoek, G. Long-term exposure to PM and all-cause and cause-specific mortality: A systematic review and meta-analysis. Environ. Int. 2020, 143, 105974. [Google Scholar] [CrossRef]
- Shi, D.; Lu, X. Accumulation degree and source apportionment of trace metals in smaller than 63 μm road dust from the areas with different land uses: A case study of Xi’an, China. Sci. Total Environ. 2018, 636, 1211–1218. [Google Scholar] [CrossRef]
- Mummullage, S.; Egodawatta, P.; Ayoko, G.A.; Goonetilleke, A. Use of physicochemical signatures to assess the sources of metals in urban road dust. Sci. Total Environ. 2016, 541, 1303–1309. [Google Scholar] [CrossRef]
- Furlani, E.; Tonello, G.; Aneggi, E.; Maschio, S. Possible use of waste olivine powders from a foundry process into the ceramic industry: Sintering behaviour of olivine, kaolin and their blends. Ceramics Int. 2013, 39, 1257–1263. [Google Scholar] [CrossRef]
- Watt, J.A.J.; Burke, I.T.; Edwards, R.A.; Malcolm, H.M.; Mayes, W.M.; Olszewska, J.P.; Pan, G.; Graham, M.C.; Heal, K.V.; Rose, N.L.; et al. Vanadium: A re-emerging environmental hazard. Environ. Sci. Technol. 2018, 52, 11973–11974. [Google Scholar] [CrossRef] [Green Version]
- Park, J.W. Interfacial Phenomena between MgO-Based Refractories and a Liquid Slag or Ferromanganese Metal. Master’s Thesis, Korea Politechnic University of Graduate School, Siheung, Korea, 2016. [Google Scholar]
- Kang, S.G.; Choi, M.S.; Oh, I.S.; Wright, D.A.; Koh, C.H. Assessment of metal pollution in Onsan Bay, Korea using Asian periwinkle Littorina brevicula as a biomonitor. Sci. Total Environ. 1999, 234, 127–137. [Google Scholar] [CrossRef]
- Cho, S.H.; Kim, H.; Kim, S.M. Possibility of cadmium poisoning in a zinc galvanizing factory. Korean J. Occup. Environ. Med. 1991, 3, 153–164. [Google Scholar] [CrossRef]
- Hulskotte, J.H.J.; Roskam, G.D.; Denier van der Gon, H.A.C. Elemental composition of current automotive braking materials and derived air emission factors. Atmos. Environ. 2014, 99, 436–445. [Google Scholar] [CrossRef]
- Li, Y.; Zhang, B.; Liu, Z.; Wang, S.; Yao, J.; Borthwick, A.G.L. Vanadium contamination and associated health risk of farmland soil near smelters throughout China. Environ. Pollut. 2020, 263, 114540. [Google Scholar] [CrossRef] [PubMed]
- Gope, M.; Masto, R.E.; George, J.; Balachandran, S. Tracing source, distribution and health risk of potentially harmful elements (PHEs) in street dust of Durgapur, India. Ecotoxicol. Environ. Saf. 2018, 154, 280–293. [Google Scholar] [CrossRef] [PubMed]
- Jiang, Y.; Shi, L.; Guang, A.L.; Mu, Z.; Zhan, H.; Wu, Y. Contamination levels and human health risk assessment of toxic heavy metals in street dust in an industrial city in Northwest China. Environ. Geochem. Health 2017, 40, 2007–2020. [Google Scholar] [CrossRef]
- Office of Superfund Remediation and Technology Innovation: Environmental Protection Agency. Risk Assessment Guidance for Superfund Volume I: Human Health Evaluation Manual (Part F, Supplemental Guidance for Inhalation Risk Assessment). Available online: https://www.epa.gov/sites/default/files/2015-09/documents/partf_200901_final.pdf (accessed on 1 September 2020).
- Baykov, B.D.; Stoyanov, M.P.; Gugova, M.L. Lead and cadmium bioaccumulation in fowl eggs depending on different food concentration. Toxicol. Environ. Chem. 1996, 54, 149–154. [Google Scholar] [CrossRef]
- Benjelloun, M.; Tarrass, F.; Hachim, K.; Medkouri, G.; Benghanem, M.G.; Ramdani, B. Chronic lead poisoning: A “forgotten” cause of renal disease. Saudi J. Kidney. Dis. Transpl. 2007, 18, 83–86. [Google Scholar]

| Upper Size Limit (μm) | Land Type (City) | Reference (Year) | Suitable Research Scope with this Particle Size Fraction |
|---|---|---|---|
| 2000 | Urban (Tehran) | Kamani et al., 2017 [53] | Pollution level of study area and human health risk from RDS including ingestion and dermal contact |
| Urban and Industrial areas (Queensland, Australia) | Ma et al., 2021 [54] | ||
| 1000 | industrial park (Baoji) | Wang et al., 2014 [55] | |
| 850 | Urban (Maha Sarakham) | Ma and Singhirunnusorn, 2012 [56] | |
| 100–150 | Urban (Shanghai) | Shi et al., 2010 [57] | |
| Urban (Zhengzhou) | Wang et al 2020 [58] | ||
| Urban (Zhengzhou) | Ferreira-Baptista and de Miguel, 2005 [59] | ||
| 89 | Urban (7 cities in China) | Yang et al., 2020 [49] | Stormwater runoff with RDS and environmental and human health risks from RDS (including ingestion and dermal contact) |
| 75 | Urban (Gejiu) | Guo et al., 2021 [60] | |
| Urban (Xi’an) | Wei et al., 2015 [61] | ||
| 63 | Industrial area (Tianjin) | Hu et al., 2016 [62] | |
| Urban (Tehran) | Saeedi et al, 2012 [63] | ||
| Urban (Nanjing) | Li et al., 2013 [64] | ||
| Urban (Petaling Jaya) | Shabanda et al., 2019 [65] | ||
| Urban (Chelyabinsk) | Krupnova et al., 2020 [66] | ||
| 25 | Urban (Xinxiang) | Cao et al 2017 [23] | |
| 10 | Urban (Ahvaz) | Najmeddin and Keshavarzi 2018 [67] | The relationship between air quality and RDS, human health risks from RDS including ingestion, dermal contact and inhalation |
| Name of Industrial Complex (Abbreviation) | Major Industries | Established Year | Area for Industrial Facilities 1 | Employee 1 | Total Production 1 | Estimated Unit Rate for Traffic with Industrial Trucks 2 | Location | Numbers of Samples | |
|---|---|---|---|---|---|---|---|---|---|
| 1000 m2 | Persons | 100 Million Won | Trucks/1000m2 | Longitude | Latitude | N | |||
| Shihwa (SH) | machine and fabricated metal | 1977~ | 30,800 [43] | 292,070 [43] | 8,833,926 | 1.09 | 37°18′ N | 126°46′ E | 25 |
| Bussan: Myeongji·Noksan (BS) | steel manufacture and automotive | 1990~2007 | 4317 | 35,702 | 2,654,877 | 0.26 | 35°05′ N | 128°51′ E | 19 |
| Gunsan (GS) | shipbuilding | 1988~1994 | 5577 | 8,189 | 1,599,063 | - | 35°57′ N | 126°35′ E | 12 |
| Chagnwon (CW) | steel manufacture, machine | 1974~ | 17,242 | 93,094 | 12,292,492 | - | 35°12′ N | 128°39′ E | 15 |
| Daebul (DB) | Shipbuilding | 1989~1997 | 6640 | 13,738 | 768,158 | 0.12 | 34°46′ N | 126°27′ E | 14 |
| Pohang (PH) | iron manufacture | 1990~ | 13,613 | 12,654 | 3,986,076 | 0.4 | 35°58′ N | 129°22′ E | 19 |
| Ulsan (US) | Petrochemical, fertilizer, Shipbuilding and automotive | 1991~ | 33,771 | 101,415 | 36,157,916 | 0.26 | 35°32′ N | 129°20′ E | 26 |
| Gwangyang (GY) | iron manufacture | 1992~ | 21,833 | 11,354 | 4,738,990 | 0.12 | 34°56′ N | 127°45′ E | 21 |
| Onsan (OS) | nonferrous metal processing and smelting Industry | 1993~ | 16,573 | 16,306 | 12,937,634 | - | 35°26′ N | 129°20′ N | 14 |
| Elements | Unit | Min | Max | Median | Mean | SD | CV (%) | Background Level | |
|---|---|---|---|---|---|---|---|---|---|
| Major elements | Al | % | 3.9 | 9.5 | 6.5 | 6.4 | 1.1 | 18 | 8.15 [79] |
| Fe | 2.9 | 27 | 7.3 | 8.4 | 4.5 | 53 | 3.88 [79] | ||
| Li | 12 | 97 | 30 | 32 | 11 | 34 | 24 [78] | ||
| Mg | 0.49 | 4.3 | 1.1 | 1.2 | 0.37 | 31 | 1.488 [79] | ||
| P | 0.041 | 0.35 | 0.094 | 0.11 | 0.047 | 45 | 0.033 [79] | ||
| Ti | 0.19 | 0.88 | 0.43 | 0.43 | 0.11 | 25 | 0.384 [79] | ||
| Trace elements (heavy metals, HMs) | Ag | mg/kg | 0.570 | 509 | 3.74 | 22.3 | 70.8 | 317 | 0.053 [78] |
| As | 7.0 | 6671 | 24 | 193 | 668 | 345 | 6.83 [80] | ||
| Be | 0.96 | 4.0 | 2.2 | 2.3 | 0.61 | 27 | 2.1 [78] | ||
| Cd | 0.889 | 927 | 6.37 | 29.6 | 107 | 361 | 0.287 [79] | ||
| Co | 7.12 | 713 | 24.0 | 33.8 | 60.7 | 180 | 12.99 [79] | ||
| Cr | 57.2 | 19224 | 351 | 894 | 1843 | 206 | 25.36 [79] | ||
| Cu | 54.5 | 19776 | 446 | 1223 | 2703 | 221 | 15.26 [79] | ||
| Hg | 0.030 | 64 | 0.41 | 2.4 | 6.9 | 292 | 0.05 [78] | ||
| Mn | 744 | 18893 | 2020 | 2915 | 2545 | 87 | 774 [78] | ||
| Ni | 20.5 | 9192 | 144 | 258 | 727 | 282 | 17.68 [79] | ||
| Pb | 62.61 | 47827 | 695 | 2539 | 6380 | 251 | 18.43 [79] | ||
| Sb | 3.32 | 3476 | 39.5 | 161 | 460 | 286 | 0.46 [78] | ||
| Sn | 6.09 | 639 | 45.1 | 71.4 | 87.4 | 122 | 2.1 [79] | ||
| V | 48.3 | 656 | 95.9 | 103 | 52.4 | 51 | 44 [79] | ||
| Zn | 629.26 | 169955 | 3868.6 | 7501.2 | 15716 | 210 | 54.27 [79] | ||
| City, Country | Characterization | Size μm | Zn | Cu | Pb | Sb | Cr | Hg | Ni | Cd | As | V | Reference |
|---|---|---|---|---|---|---|---|---|---|---|---|---|---|
| 9 industrial cities, Korea | Industrial area, RDS | <10 | 7501.2 | 1223 | 2539 | 161 | 894 | 2.4 | 258 | 29.6 | 193 | 103 | This study |
| Fushun, China | Coal-based city, RDS | <10 | 174 | 115 | 50.7 | - | 5558 | 0 | 9 | 1.3 | 14 | 14 | Kong et al., 2012 [9] |
| Madrid, Sapin | Urban, RDS | <10 | 1135 | 444 | 121 | 82 | 56 | - | 139 | - | - | 13 | Karanasiou et al., 2014 [108] |
| Zǖrich, Switzerland | Urban, RDS | <10 | 2183 | 3547 | 247 | 324 | 330 | - | 504 | 10 | 19 | 56 | Amato et al. 2011 [15] |
| Barcelona, Spain | Urban, RDS | <10 | 1572 | 1332 | 248 | 196 | 229 | - | 58 | 3 | 12 | 84 | Amato et al. 2011 [15] |
| Girona, Spain | Urban, RDS | <10 | 1760 | 1055 | 128 | 64 | 188 | - | 191 | 2 | 11 | 54 | Amato et al. 2011 [15] |
| London, UK | Urban, ambient dust | <10 | 44.6 | 53.2 | - | 6.73 | - | - | - | - | - | 2.1 | Gietl et al., 2010 [109] |
| ICs | SH | BS | GS | CW | DB | PH | US | GY | OS | Mean | Min | Max | SD | CV% | |
|---|---|---|---|---|---|---|---|---|---|---|---|---|---|---|---|
| Igeo | Sb | 7.2 | 5.9 | 5.0 | 5.9 | 5.8 | 6.5 | 4.8 | 4.8 | 10.4 | 6.2 | 4.8 | 10.4 | 1.7 | 0.3 |
| Zn | 5.4 | 6.7 | 4.8 | 5.7 | 6.0 | 5.1 | 5.5 | 5.5 | 8.1 | 5.9 | 4.8 | 8.1 | 1.0 | 0.2 | |
| Ag | 5.3 | 6.6 | 3.8 | 5.5 | 5.7 | 6.6 | 4.0 | 4.0 | 10.8 | 5.8 | 3.8 | 10.8 | 2.2 | 0.4 | |
| Pb | 6.2 | 5.5 | 4.0 | 4.5 | 4.4 | 5.0 | 3.2 | 3.2 | 8.8 | 5.0 | 3.2 | 8.8 | 1.7 | 0.4 | |
| Cu | 5.1 | 4.9 | 3.1 | 4.4 | 4.0 | 5.0 | 3.0 | 3.0 | 7.9 | 4.5 | 3.0 | 7.9 | 1.5 | 0.3 | |
| Cd | 3.6 | 4.9 | 2.3 | 3.8 | 4.4 | 4.3 | 2.7 | 2.7 | 8.7 | 4.1 | 2.3 | 8.7 | 1.9 | 0.5 | |
| Sn | 5.1 | 4.4 | 3.1 | 4.0 | 3.6 | 3.3 | 2.7 | 2.7 | 6.0 | 3.9 | 2.7 | 6.0 | 1.1 | 0.3 | |
| Cr | 3.3 | 5.4 | 2.9 | 4.3 | 5.8 | 2.2 | 3.4 | 3.4 | 2.7 | 3.7 | 2.2 | 5.8 | 1.2 | 0.3 | |
| Hg | 2.2 | 2.8 | 0.2 | 2.4 | 4.6 | 3.1 | 1.7 | 1.7 | 7.3 | 2.9 | 0.2 | 7.3 | 2.1 | 0.7 | |
| Ni | 2.6 | 4.2 | 1.5 | 2.8 | 3.0 | 1.4 | 3.0 | 3.0 | 2.7 | 2.7 | 1.4 | 4.2 | 0.8 | 0.3 | |
| As | 1.5 | 1.4 | 0.9 | 0.7 | 2.0 | 2.9 | 0.8 | 0.8 | 7.0 | 2.0 | 0.7 | 7.0 | 2.0 | 1.0 | |
| Mn | 0.1 | 1.3 | 0.6 | 1.2 | 2.7 | 0.2 | 1.7 | 1.7 | 0.7 | 1.1 | 0.1 | 2.7 | 0.8 | 0.7 | |
| P | 1.5 | 1.4 | 1.3 | 0.9 | 0.8 | 1.1 | 0.5 | 0.5 | 0.5 | 1.0 | 0.5 | 1.5 | 0.4 | 0.4 | |
| V | 0.3 | 0.6 | 0.2 | 0.5 | 1.1 | 0.5 | 0.8 | 0.8 | 0.9 | 0.6 | 0.2 | 1.1 | 0.3 | 0.4 | |
| Co | 0.9 | 0.7 | 0.9 | 0.4 | 0.2 | 0.0 | 0.2 | 0.2 | 0.9 | 0.5 | 0.0 | 0.9 | 0.4 | 0.7 | |
| Fe | 0.3 | 0.8 | 0.0 | 0.6 | 1.2 | −0.3 | 0.7 | 0.7 | 0.1 | 0.5 | −0.3 | 1.2 | 0.5 | 1.0 | |
| Li | −0.1 | −0.4 | 0.3 | −0.1 | −0.5 | 0.0 | −0.5 | −0.5 | −0.8 | −0.3 | −0.8 | 0.3 | 0.3 | −1.1 | |
| Ti | −0.2 | −0.3 | −0.1 | −0.4 | −0.9 | −0.6 | −0.5 | −0.5 | −0.7 | −0.5 | −0.9 | −0.1 | 0.3 | −0.6 | |
| Be | 0.0 | −0.9 | −0.1 | −0.9 | −0.9 | −0.6 | −0.6 | −0.6 | −0.6 | −0.6 | −0.9 | 0.0 | 0.3 | −0.6 | |
| Al | −0.8 | −1.0 | −0.8 | −1.0 | −1.3 | −0.9 | −1.1 | −1.1 | −1.0 | −1.0 | −1.3 | −0.8 | 0.2 | −0.2 | |
| Mg | −1.1 | −1.0 | −1.0 | −0.8 | −0.6 | −1.1 | −0.6 | −0.6 | −1.3 | −0.9 | −1.3 | −0.6 | 0.3 | −0.3 | |
| PLI | 6.4 | 7.3 | 3.8 | 5.5 | 2.7 | 7.2 | 5.7 | 4.1 | 17.8 | 6.7 | 2.7 | 17.8 | 4.4 | 0.7 |
| (a) | ||||
|---|---|---|---|---|
| Component | Initial Eigenvalues | |||
| Total | % of Variance | Cumulative % | ||
| 1 | 8.685 | 41.356 | 41.356 | |
| 2 | 4.576 | 21.790 | 63.147 | |
| 3 | 2.097 | 9.985 | 73.132 | |
| 4 | 1.276 | 6.076 | 79.207 | |
| (b) | ||||
| Component | ||||
| 1 | 2 | 3 | 4 | |
| Mg | −0.277 | 0.535 | −0.048 | 0.458 |
| Al | −0.145 | −0.407 | 0.803 | 0.074 |
| Ti | −0.148 | 0.025 | 0.775 | −0.188 |
| Fe | −0.012 | 0.843 | −0.362 | −0.027 |
| P | 0.083 | 0.166 | 0.137 | −0.756 |
| Li | −0.337 | −0.188 | 0.662 | −0.105 |
| Be | −0.132 | −0.372 | 0.738 | −0.100 |
| V | 0.278 | 0.464 | −0.131 | 0.681 |
| Cr | 0.055 | 0.874 | −0.286 | −0.036 |
| Mn | −0.172 | 0.676 | −0.491 | 0.365 |
| Co | 0.475 | 0.520 | 0.330 | −0.117 |
| Ni | 0.295 | 0.841 | −0.100 | −0.025 |
| Cu | 0.897 | −0.030 | −0.154 | −0.191 |
| Zn | 0.684 | 0.316 | −0.327 | −0.077 |
| As | 0.881 | −0.20 | −0.165 | 0.250 |
| Ag | 0.924 | 0.010 | −0.222 | 0.067 |
| Cd | 0.923 | 0.059 | −0.287 | 0.099 |
| Sn | 0.853 | 0.272 | 0.132 | −0.220 |
| Sb | 0.956 | −0.012 | −0.008 | −0.004 |
| Pb | 0.945 | 0.109 | 0.003 | −0.151 |
| Hg | 0.803 | 0.162 | −0.376 | 0.233 |
| City | Type of Area | Sample | Zn/Cu | Cu/Sb | Reference |
|---|---|---|---|---|---|
| Barcelona | Urban | RDS | 1.2 | 6.8 | Amato et al., 2011 [30] |
| Zürich | Urban | RDS | 0.6 | 13.5 | |
| Girona | Urban | RDS | 1.7 | 17.0 | |
| Fushun | Urban | RDS | 2 | - | Kong et al., 2012 [9] |
| London | School area | RDS | 3.5 | 7.1 | Gietl et al., 2010 [107] |
| Urban | RDS | 0.8 | 7.9 | ||
| SH | Industrial area | RDS | 5 | 10 | This study |
| BS | Industrial area | RDS | 13 | 21 | |
| GS | Industrial area | RDS | 16 | 19 | |
| CW | Industrial area | RDS | 9 | 12 | |
| DB | Industrial area | RDS | 17 | 23 | |
| PH | Industrial area | RDS | 16 | 11 | |
| US | Industrial area | RDS | 6 | 16 | |
| GY | Industrial area | RDS | 22 | 11 | |
| OS | Industrial area | RDS | 11 | 12 | |
| Average | 11 | 13 | |||
| Brake pad | - | 9–18 | Iijima et al., 2007 [97] | ||
| 0.13 | - | Westerlund, 1998 [95] | |||
| Tier tread | 14.5 | - | Adachi and Tainosho, 2004 [15] | ||
| Tier dust | 16.0 | - | |||
| (a) | |||||||||||
|---|---|---|---|---|---|---|---|---|---|---|---|
| SH | BS | GS | CW | DB | PH | US | GY | OS | Mean | ||
| HQing | 6.57 × 10⁻¹ | 3.87 × 10⁻¹ | 1.82 × 10⁻¹ | 2.23 × 10⁻¹ | 8.51 × 10⁻² | 3.70 × 10⁻¹ | 4.79 × 10⁻¹ | 1.46 × 10⁻¹ | 6.91 × 100 | 9.07 × 10⁻¹ | |
| HQinh | 7.44 × 10⁻⁶ | 1.93 × 10⁻⁵ | 8.65 × 10⁻⁶ | 1.12 × 10⁻⁵ | 5.39 × 10⁻⁶ | 2.74 × 10⁻⁵ | 6.44 × 10⁻⁶ | 1.45 × 10⁻⁵ | 2.98 × 10⁻⁵ | 1.40 × 10⁻⁵ | |
| HQdermal | 1.65 × 10⁻⁴ | 2.53 × 10⁻⁴ | 5.13 × 10⁻⁵ | 1.26 × 10⁻⁴ | 3.60 × 10⁻⁵ | 2.41 × 10⁻⁴ | 2.05 × 10⁻⁴ | 5.80 × 10⁻⁵ | 4.96 × 10⁻³ | 5.60 × 10⁻⁴ | |
| HI | 6.57 × 10⁻¹ | 3.87 × 10⁻¹ | 1.82 × 10⁻¹ | 2.23 × 10⁻¹ | 8.52 × 10⁻² | 3.70 × 10⁻¹ | 4.79 × 10⁻¹ | 1.46 × 10⁻¹ | 6.91 × 100 | 9.08 × 10⁻¹ | |
| (b) | |||||||||||
| SH | BS | GS | CW | DB | PH | US | GY | OS | Mean | ||
| CRing | As | 1.75 × 10⁻⁴ | 1.96 × 10⁻⁴ | 1.07 × 10⁻⁴ | 9.46 × 10⁻⁵ | 6.49 × 10⁻⁵ | 4.77 × 10⁻⁴ | 5.58 × 10⁻⁴ | 1.05 × 10⁻⁴ | 1.02 × 10⁻² | 1.09 × 10⁻³ |
| Cd | 4.22 × 10⁻⁵ | 9.25 × 10⁻⁵ | 1.61 × 10⁻⁵ | 4.61 × 10⁻⁵ | 1.33 × 10⁻⁵ | 9.23 × 10⁻⁵ | 7.32 × 10⁻⁵ | 2.13 × 10⁻⁵ | 1.89 × 10⁻³ | 2.09 × 10⁻⁴ | |
| Ni | 8.07 × 10⁻⁵ | 4.01 × 10⁻⁴ | 3.76 × 10⁻⁵ | 8.84 × 10⁻⁵ | 1.86 × 10⁻⁵ | 1.00 × 10⁻⁴ | 3.32 × 10⁻⁵ | 1.02 × 10⁻⁴ | 1.02 × 10⁻⁴ | 1.09 × 10⁻⁴ | |
| Pb | 5.91 × 10⁻⁵ | 2.63 × 10⁻⁵ | 1.14 × 10⁻⁵ | 1.32 × 10⁻⁵ | 3.24 × 10⁻⁶ | 1.59 × 10⁻⁵ | 2.51 × 10⁻⁵ | 5.68 × 10⁻⁶ | 3.45 × 10⁻⁴ | 5.01 × 10⁻⁵ | |
| CRinh | As | 1.90 × 10⁻¹¹ | 2.12 × 10⁻¹¹ | 1.16 × 10⁻¹¹ | 1.03 × 10⁻¹¹ | 7.04 × 10⁻¹² | 5.18 × 10⁻¹¹ | 6.06 × 10⁻¹¹ | 1.14 × 10⁻¹¹ | 1.105 × 10⁻⁹ | 1.18 × 10⁻¹⁰ |
| Cd | 1.54 × 10⁻¹¹ | 3.36 × 10⁻¹² | 5.87 × 10⁻¹³ | 1.68 × 10⁻¹² | 4.83 × 10⁻¹³ | 3.35 × 10⁻¹² | 2.66 × 10⁻¹² | 7.75 × 10⁻¹³ | 6.864 × 10⁻¹¹ | 7.58 × 10⁻¹² | |
| Co | 7.82 × 10⁻¹¹ | 4.84 × 10⁻¹¹ | 7.05 × 10⁻¹¹ | 3.29 × 10⁻¹¹ | 1.5 × 10⁻¹¹ | 2.96 × 10⁻¹¹ | 3.08 × 10⁻¹¹ | 2.93 × 10⁻¹¹ | 5.215 × 10⁻¹¹ | 4.32 × 10⁻¹¹ | |
| Ni | 6.52 × 10⁻¹² | 3.24 × 10⁻¹¹ | 3.04 × 10⁻¹² | 7.14 × 10⁻¹² | 1.5 × 10⁻¹² | 8.09 × 10⁻¹² | 2.68 × 10⁻¹² | 8.26 × 10⁻¹² | 8.277 × 10⁻¹² | 8.82 × 10⁻¹² | |
| Pb | 5.12 × 10⁻¹² | 2.28 × 10⁻¹² | 9.85 × 10⁻¹³ | 1.15 × 10⁻¹² | 2.8 × 10⁻¹³ | 1.38 × 10⁻¹² | 2.17 × 10⁻¹² | 4.92 × 10⁻¹³ | 2.989 × 10⁻¹¹ | 4.34 × 10⁻¹² | |
| CRdermal | As | 3.99 × 10⁻⁶ | 4.46 × 10⁻⁶ | 2.44 × 10⁻⁶ | 2.16 × 10⁻⁶ | 1.48 × 10⁻⁶ | 1.09 × 10⁻⁵ | 1.27 × 10⁻⁵ | 2.40 × 10⁻⁶ | 2.32 × 10⁻⁴ | 2.49 × 10⁻⁵ |
| Pb | 1.35 × 10⁻⁶ | 6.00 × 10⁻⁷ | 2.59 × 10⁻⁷ | 3.02 × 10⁻⁷ | 7.38 × 10⁻⁸ | 3.62 × 10⁻⁷ | 5.73 × 10⁻⁷ | 1.29 × 10⁻⁷ | 7.87 × 10⁻⁶ | 1.14 × 10⁻⁶ | |
 : not acceptable risk.
Publisher’s Note: MDPI stays neutral with regard to jurisdictional claims in published maps and institutional affiliations. |
© 2021 by the authors. Licensee MDPI, Basel, Switzerland. This article is an open access article distributed under the terms and conditions of the Creative Commons Attribution (CC BY) license (https://creativecommons.org/licenses/by/4.0/).
Share and Cite
Choi, J.-Y.; Jeong, H.; Ra, K.; Kim, K.-T. Potentially Toxic Elements (PTEs) Composition and Human Health Risk Assessment of PM10 on the Roadways of Industrial Complexes in South Korea. Atmosphere 2021, 12, 1307. https://doi.org/10.3390/atmos12101307
Choi J-Y, Jeong H, Ra K, Kim K-T. Potentially Toxic Elements (PTEs) Composition and Human Health Risk Assessment of PM10 on the Roadways of Industrial Complexes in South Korea. Atmosphere. 2021; 12(10):1307. https://doi.org/10.3390/atmos12101307
Chicago/Turabian StyleChoi, Jin-Young, Hyeryeong Jeong, Kongtae Ra, and Kyung-Tae Kim. 2021. "Potentially Toxic Elements (PTEs) Composition and Human Health Risk Assessment of PM10 on the Roadways of Industrial Complexes in South Korea" Atmosphere 12, no. 10: 1307. https://doi.org/10.3390/atmos12101307
APA StyleChoi, J.-Y., Jeong, H., Ra, K., & Kim, K.-T. (2021). Potentially Toxic Elements (PTEs) Composition and Human Health Risk Assessment of PM10 on the Roadways of Industrial Complexes in South Korea. Atmosphere, 12(10), 1307. https://doi.org/10.3390/atmos12101307