Abstract
The SCAMPER method for measuring PM10 emission rates from roadways was used to evaluate mitigation methods for public unpaved roads and a treated mine haul road. The SCAMPER method uses a small trailer to measure PM10 concentrations behind a vehicle at a point that is representative of the mean PM10 concentration in the vehicle’s wake. This concentration multiplied by the frontal area has been shown to be a reasonable estimate of the emission rate in units of grams per meter traveled. On public roads it was towed by a 2006 Ford Expedition and on a mine haul road it was towed behind both the Expedition and an earth mover weighing over 150 tons fully loaded. Since the SCAMPER is capable of measuring emission rates on both paved and unpaved roadways, a direct comparison of the effectiveness of mitigation methods with respect to a similar paved road was possible.
1. Introduction
Particulate matter less than 10 µm aerodynamic diameter (PM10) has been implicated as being responsible for a wide variety of adverse health effects that have been shown in epidemiological studies to contribute to premature deaths [1]. For this reason concentration standards have been promulgated by many governments to protect the health of its citizens. These standards are routinely exceeded in many urban areas. In order to formulate effective mitigation approaches, the sources of the PM must be accurately known. Receptor modeling has shown that PM10 of geologic origin is often a significant contributor to the PM10 concentrations in areas that are in non-attainment and a significant portion of this geologic material has been estimated to originate from paved roads [2]. While unpaved roads are less common in urban areas, the nature of their road surface could lead to potentially large emission rates of geologic material and these roads are often found in many parts of the western United States. In addition, construction and other industrial activities sometimes use unpaved roadways, often used by heavy duty vehicles.
Since emissions from roadways cannot, by their nature, be measured directly, they must be calculated from the characteristics of a line source plume. This has been done using dispersion modeling [3,4,5], receptor modeling [6] a combination of dispersion and receptor modeling [7,8], tracer studies [9,10,11], measuring the flux of PM10 through a horizontal plane downwind of the source [12,13,14,15,16,17] and measurement of PM10 concentrations near the wheel or in the wake of a vehicle [18,19,20,21,22]. Using flux measurements the U.S. Environmental Protection Agency (EPA) in document AP-42 has derived empirical equations for estimating particulate emissions from both paved and unpaved roads using metrics such as surface silt and moisture content, mean vehicle weight, and mean speed [23,24].
For industrial unpaved roads the EPA equation for the PM10 emission rate in units of grams (g) per Vehicle Kilometer Traveled (VKT) is:
E = 423 ∗ (s/12)0.9 ∗ (W/3)0.45) g/VKT
For public unpaved roads the EPA equation for the PM10 emission rate in units of g/VKT is:
where:
E = 507 ∗ (s/12) ∗ (S/30)0.5/(M/0.5)0.2 g/VKT
E = PM10 emission factor g/VKT
s = surface material silt (silt defined as dry material passing through a 200 mesh screen) content (%)
W = mean vehicle weight in U.S. tons
M = surface material moisture content (%)
S = mean vehicle speed (miles per hour)
In many cases default values are used for these metrics, which can lead to large uncertainties.
We have previously reported the development and evaluation of SCAMPER (System for the Continuous Aerosol Measurement of Particle Emissions from Roads), a mobile real-time method that samples in the vehicle’s wake on paved roads to determine PM10 emission rates [25,26]. Other mobile methods that sample PM10 near the vehicle’s wheel, require the use of particle diluters so that the concentrations do not exceed the upper limit of the optical sensors used. This adds a great deal of complexity to the sampling system, which is generally integrated into the test vehicle. Since the SCAMPER samples in the vehicle’s wake, the PM is much diluted and concentrations, even on unpaved roads, remain within the sensor’s limits. In addition, it is much easier to move the system from one vehicle to another.
In the following we discuss the use of SCAMPER in measuring the emission rates from unpaved roads. While the AP-42 equation estimates PM10 emissions from unpaved roads using independent variables, the SCAMPER approach directly measures emissions and does not depend on these variables. In addition, a large amount of emission data may be easily collected. The data from the unpaved roads we report here was used to evaluate the effectiveness of surface treatments on public roadways and a mine haul road. We also showed that the measurement equipment can be attached to heavy duty vehicles, in this case 150 tons, to determine PM emission rates from any type of vehicle. This is the first time that mobile methods have been reported in measuring the PM10 emission rates from such heavy duty vehicles.
2. Materials and Methods
2.1. SCAMPER Description
The SCAMPER determines PM emission rates from roads by measuring the PM concentrations in front of (mounted on the hood) and behind the vehicle (mounted on a small open trailer) using optical sensors with a 1 s time resolution. As a first approximation, the concentration difference between the two (in mg m−3) is multiplied by the vehicle’s frontal area (m2) to obtain an emission factor in units of mg m−1. The system and its validation has previously been described [25,26]. Briefly, the SCAMPER includes five major components:
- Tow vehicle and Trailer: A 2006 Ford Expedition was used to tow a small (3.1 m wide by 2 m long) open flatbed trailer. The trailer was fitted with a 1 m hitch extension to place the rear sampling inlet 3 m behind the tow vehicle at a height of 0.8 m above the ground on the centerline of the trailer. This position was found to give PM10 concentrations that were representative of the mean concentration of PM10 in the wake of the tow vehicle [24].
- PM10 Sensors: Thermo Systems Inc. (Shoreville, MN, USA) Model 8520 DustTrak™ optical PM sensors with PM10 inlets.
- Isokinetic Sampling Inlets: A custom made inlet where the inlet speed is matched to the air speed by a PC that monitors the static air pressure and adjusts the inlet pressure to match it by controlling a vacuum pump (mounted on the trailer). This condition creates a no-pressure-drop inlet; therefore, the sampled air stream has the same energy as the ambient air stream.
- Global Positioning System: Garmin (Kansas City, MO, USA) Map76 GPS to determine vehicle speed and location.
- Data Collection System: A laptop PC was used to collect GPS and DustTrak™ data at 1s intervals in addition to controlling the inlet vacuum pumps.
2.2. Public Unpaved Road PM10 Emission Measurements
Field measurements of PM10 emission rates were made on two different Arizona state highways, State Routes SR 88 and SR 288. The SCAMPER test vehicle was operated at speeds consistent with safe operation and that observed of other vehicles. The segment of SR88 between mile point 220.1 and mile point 227.5 (12 km) was treated with Envirotac II Acrylic copolymer (Environmental Products and Applications, Inc., La Quinta, CA, USA) at a rate of 1.1 Lm−2. To the west the road was paved and to the east it was unpaved gravel. The section between mile points 226.5 and 227.5 was treated two years before the measurement study and the section between mile points 220.1 and 226.5 was treated five months before. The SCAMPER testing was conducted from Tortilla Flats, AZ (GPS coordinates 33.5268 by −111.3896) eastbound on paved road to mile point 220.1 (GPS coordinates 33.5383 by −111.3258) where the road transitioned from paved to treated gravel. The treated section ended at mile point 227.5 (GPS coordinates 33.5483 by −111.2563) and the SCAMPER vehicle continued eastward on untreated gravel until reaching GPS coordinates 33.5829 by −111.22143 (10 km) where it turned around and headed westbound back to Tortilla Flats.
The segment of SR 288 between mile points 274.7 and 280.5 (9 km) was treated the year before the study by milling 15 cm of the base material that had just been treated with SS-1 low setting emulsion (McAsphalt Industries Limited, Toronto ON, Canada) followed by an application of their CRS II emulsified liquid at a rate of 1.6 L m−2 and then overlain with 14 kg m−2 of 1 cm stone chips. The road was untreated gravel on both sides of the treated section. The SCAMPER test route consisted of a circuit starting on the south approximately 0.4 km from the treated section (GPS coordinates of 33.7468 by −110.9624), covering the treated section (GPS coordinates 33.7496 by −110.9650 at the southern end and 33.7879 by −110.9714 at the northern end) and continued north on the gravel for another 0.4 km (GPS coordinates of 33.7935 by −110.9719.
2.3. Mine Haul Road PM10 Emission Measurements
The mine haul road was located near the Cricket Mountains in Utah. It was generally straight and approximately eight km long. The native soil of the road had been treated with a dust suppressant. The SCAMPER was used in its normal configuration (Ford Expedition tow vehicle) for measuring PM10 emissions during all of the first day of sampling and all but one roundtrip on the second day of sampling. The average speed was 72 ± 4 km/h. A frontal area of 3.66 m2 was used for the Ford Expedition and the estimated weight is 2.5 tons. After completing four round trips on the second day of sampling, the SCAMPER equipment was installed on the haul vehicle (see Figure 1) for all subsequent testing. The average speed was 53 ± 5 km/h. The frontal area of the haul vehicle was estimated to be 10.6 m2 based on the overall height and width. The weight of the haul truck was approximately 50 tons empty and 150 tons fully loaded.
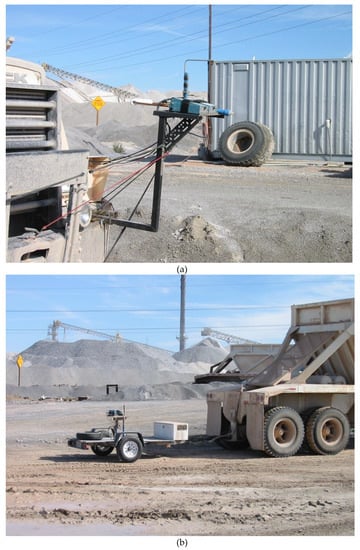
Figure 1.
Photographs of the SCAMPER equipment outfitted on the front (a) and rear (b) of the mine haul vehicle.
PM10 filter samples (47 mm Teflo™ Ringed Filter, 2 μm pore) were also collected on the SCAMPER trailer when it was attached to the haul truck using a Sierra Andersen model 241 inlet adapted to a 47 mm filter holder and sampled at 16.7 L m−1. The inlets of these samples were collocated with the DustTrak™ inlets. A total of sixteen filter samples were collected. Each collection was conducted over one direction of the haul road. Filters were equilibrated to 25 °C and 40% RH and weighed before and after collection to the nearest microgram using a Cahn (Irvine, CA, USA) model C-25 electro-balance.
3. Results
3.1. Arizona Public Roads
The zero of the DustTrak™ was determined before, after, and at least once during the test runs. The drift during the course of the each test day was less than a few μgm−3, near the 1 μgm−3 detection limit of the instrument. The data for each test run was corrected for zero offset using the mean zero response for that day. The output of the rear DustTrak™ occasionally spiked, either positively or negatively. These spikes were probably due to physical shock from the rough unpaved roads. These spikes always showed up on two consecutive seconds. They were unlikely to be associated with an actual PM10 concentration as concentrations rarely change to that degree in less than one second. The two-second characteristic of this noise spike was also expected from the internal averaging and output characteristics of the DustTrak™. On the time constant we selected (which is the shortest available) the DustTrak™ output was a two-second running average that updated every second. A large spike in a one-second period will therefore show up as two smaller spikes for two consecutive seconds. To filter this noise we tabulated the data as 5-second running medians. The two-second spikes therefore were removed from the data set. The net PM10 concentration was determined by subtracting the concentration of the front DustTrak™ from that of the rear. The net value multiplied the net PM10 concentration by the frontal area of the test vehicle, to obtain the PM10 emission rate in units of mg m−1.
3.1.1. SR 88
Figure 2 summarizes the data on a map. In this map the emission rates are represented as circles with the shading becoming darker as the emission rates become larger. Progressing from left to right, the emissions increase as the SCAMPER transverses paved, treated unpaved, and untreated unpaved roads. Figure 3 shows the time series of PM10 emission rates calculated as a running ten-second average for periods when the running average speed was greater than 16 km h−1 (below this speed the wake may not be well formed). The units are in mg m−1. The data from treated and untreated unpaved roads are highlighted, as are the paved road sections.
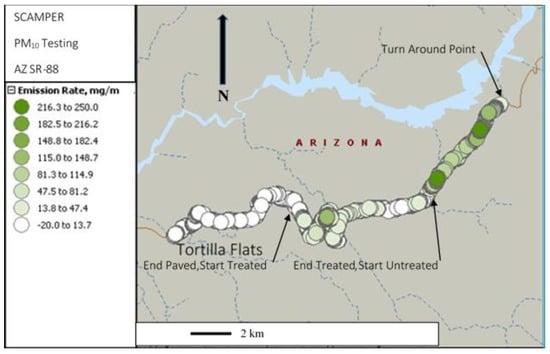
Figure 2.
PM10 emission rates in mg m−1 superimposed on the map of the test segments used on SR 88.
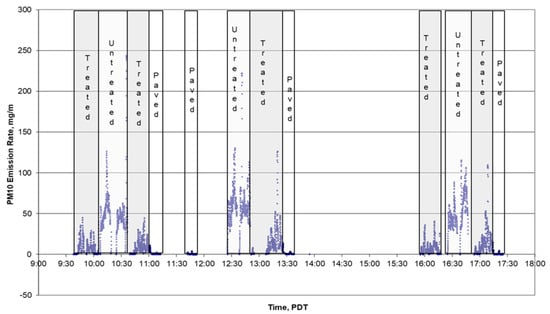
Figure 3.
Time series plot of PM10 emission rates during the test conducted on SR88.
Table 1 summarizes the data for the three completed passes of the test route. The average emission rate of the treated gravel section was approximately five times lower than the untreated gravel section. In both cases the average speed was near 30 km h−1. Spikes in the emission rate were observed at repeatable times for both treated and untreated sections, likely indicating road surfaces containing higher fractions of finer soil. Based on the reproducibility of the segment emission rate data, the precision of the measurements for both the treated and untreated sections was reasonable, especially considering the potential operational variability from run to run. In order to estimate the precision of the measurements the assumption was made that the east and west bound emission rates should be equivalent. The mean emission rate for each circuit are derived from a robust data set of hundreds of measurements conducted over 10 km. The relative standard deviation of the mean emission rates of the treated circuits was 15% while that of the untreated was 27%. This is in good agreement with the precision of approximately 20% for the much larger data set from paved roads [26].

Table 1.
Summary of mean PM10 emission rates (ER) for the test route on SR88.
While neither the silt nor the moisture content of the unpaved roadway was measured, we have typically measured silt content of 14% and moisture of less than 4% in soils from the desert southwestern United States. Using these values, a weight of 2.5 tons for the tow vehicle, and a mean speed of 30 km h−1 yields an emission rate of 700 mg m−1. The AP-42 equation therefore appears to significantly overestimate the PM10 emissions from the unpaved road.
3.1.2. SR 288
Figure 4 summarizes the data on a map. The higher emissions at the top and bottom of the section are from the unpaved segments while the much lower ones are clearly seen in the middle. Figure 5 shows the time series of PM10 emission rates calculated as a running ten-second average for periods when the running average speed was greater than 16 km h−1. The data from treated and untreated unpaved roads are highlighted.
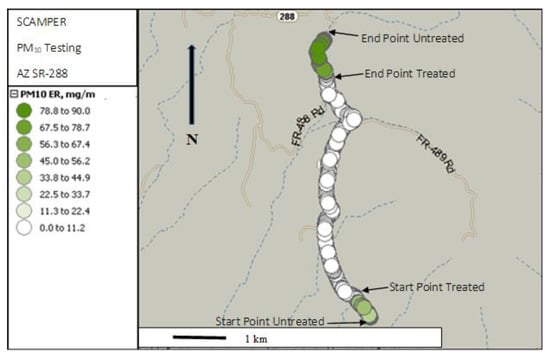
Figure 4.
Map of the test segments used on SR288.
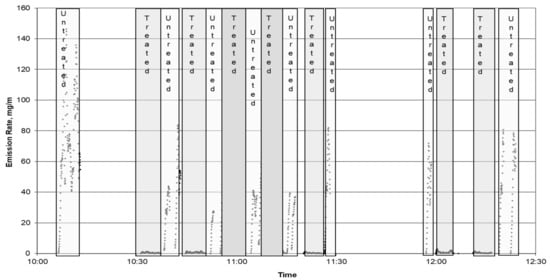
Figure 5.
Time series plot of PM10 emissions during the test on SR288.
Table 2 summarizes the data. The PM10 emission rate from the untreated road was similar to that on the untreated section of SR 88 and much less than the AP-42 estimation of 700 mg m−1. The average emission rate of the treated gravel section was approximately sixty times lower than the untreated gravel section. In addition, the average speed on the treated sections was nearly twice that of the untreated section (52 vs. 25 km h−1), so higher emissions would be expected if the treatment was ineffective. Spikes in the emission rate were observed at repeatable times for only the untreated section, likely indicating road surfaces containing higher fractions of finer soil, which were not found on the treated section. The PM10 emission rate from the treated section was nearly as low as the asphalt paved portion of SR 88. Since SR 88 had a higher traffic density than SR 288, the emissions from its paved segment are expected to be lower than if a segment of SR 288 were paved. We therefore conclude that the PM10 emissions from the treated portion of SR 288 is what would be expected of asphalt pavement. Again assuming that both directions are equivalent, the relative standard deviation for all the untreated circuits was 43% while that of the treated was 32%. The higher value for the untreated segments was likely due to their relatively short lengths (0.4 km).

Table 2.
Summary of mean PM10 emission rates for the test route on SR 288.
3.2. Mine Haul Road
Table 3 shows the average and standard deviation of the PM10 emission rate determined for each pass of the SCAMPER using the Ford Expedition as the test vehicle. The emission rate standard deviations of the individual test runs are higher than the mean value, indicating significant variation in emission rates along the roadway. The overall average emission rate in the northwest direction was 0.51 mg m−1, while in the southeast direction it was 0.52 mg m−1, values similar to the paved portion of SR 88. This shows that the PM10 emission potential for each direction is similar and that the measurement method is reproducible. The precision based on the relative standard deviation of the direction means was approximately 80% and may be due to the relatively low emission rates compared to unpaved roads.

Table 3.
SCAMPER PM10 pass-averaged emission rate data for the Ford Expedition for each direction of each test run.
Table 4 shows the average and standard deviation of the PM10 emission rate determined for each pass of the SCAMPER using the haul truck as the test vehicle. The values for the haul truck were, as expected, considerably higher than that obtained using the Ford Expedition. The average emission rate for the northeast direction (unloaded) was 4.0 mg m−1 while that for the southeast direction (loaded) was significantly higher at 7.3 mg m−1. The overall precision based on the relative standard deviation was 80% in the unloaded direction and 70% in the loaded direction.

Table 4.
SCAMPER PM10 pass-averaged emission rate data for the haul truck for each direction of each test run.
If one assumes 14% silt content, and applies the AP-42 equation for unpaved roads, the PM10 emission rate is calculated to be 450 mg m−1 for the Expedition, 1700 mg/m for an unloaded haul truck and 2800 mg/m for the loaded haul truck. It is clear that the AP-42 equation grossly over predicts the PM10 emission rate for this treated road. Taking the ratio of the AP-42 estimated emission rate to the mean measured rate gives 873 for the Expedition, 425 for the unloaded haul truck, and 383 for the loaded haul truck. Given the large differences between the weights of the Expedition compared to the haul truck, it is not surprising that ratios are quite different. The ratios for the unloaded and loaded haul truck, however, are similar, indicating the weight term in the AP-42 equation is valid.
Although the measured emission rates for the haul road were similar to those measured on paved roads, it is not clear that the AP-42 paved road equation would be appropriate to predict PM10 emission rates of the haul road. This would require vacuuming of the road surface to determine the surface silt loading, which may not be compatible with this treated surface. The AP-42 equation for estimating PM10 emissions from paved roads is as follows:
where:
E = k(sL/)0.92 (W)1.01 g/VKT
E = PM10 emission factor in the units shown
k = A constant dependent on the aerodynamic size range of PM (0.62) for PM10)
sL = Road surface silt loading of material smaller than 75 μm in g/m2
W = mean vehicle weight in tons
VKT = vehicle kilometer traveled
Based on the weight of the vehicles, it would be expected that the PM10 emissions from the full haul truck would be 3 times that of the empty one and 65 times that of the Ford Expedition. The measured ratios were significantly lower, 1.8 and 14. As with the AP-42 values, the large difference in ratio between the haul truck and the Expedition are likely to be due to an over-extrapolation of the equation that was derived from lighter vehicles. The ratio between the unloaded and loaded haul trucks seems reasonable despite this potential over-extrapolation.
3.3. Comparison of DustTrak™ with Filter Samples
The DustTrak™ is calibrated at the factory using a standard NIST Arizona road dust. Figure 6 compares the PM10 filter concentration data with the concentration data from the collocated DustTrak™ integrated over the period in which the collocated filter sampler was operated. The 0.41 R2 value and slope of 2.5 is typical of what we have previously measured with SCAMPER [26], indicating that the DustTrak™ emission measurements presented here are low by this factor when compared to emission rates on a mass basis.
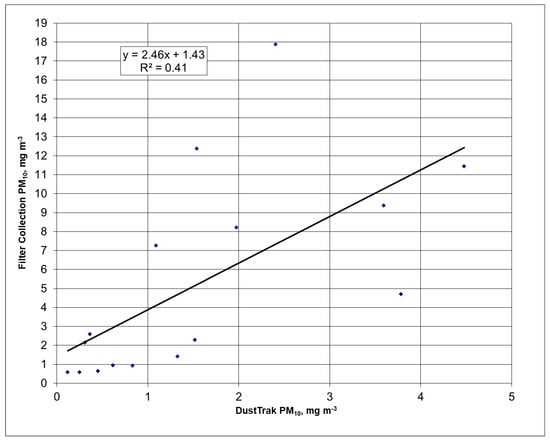
Figure 6.
Comparison of PM10 filter and DustTrak™ data.
4. Summary and Conclusions
The effectiveness of using dust suppressants to reduce PM10 reduction from unpaved roads was quantified for segments of SR 88 and 288. The suppressant applied to SR 88 five months ago reduced PM10 emissions by a factor of five. The suppressant applied to SR 288 a year ago reduced PM10 emissions by a factor of sixty. The SCAMPER has been shown to collect reliable emission rates from unpaved roads with a precision of approximately 20%. The measured emission rates, on a mass basis were approximately seven time higher than those predicted by the AP-42 unpaved road equation.
For the haul road measurements, the average PM10 emission rates were 4.0 and 7.3 mg m−1 for the unloaded and loaded haul trucks, respectively. The ratio of these emission rates are consistent with the weight variation predicted by the AP-42 equation for unpaved roads. The AP-42 PM10 equation for unpaved PM10 emission rates, however, over predicts the emission rates of this haul road by approximately a factor of approximately 170 on a mass basis for haul trucks. Based on the Expedition’s measured emission rate on paved roads indicated that the emissions from this haul road are consistent with a paved road.
Author Contributions
Conceptualization, D.R.F.; Data curation, K.B.; Formal analysis, D.R.F.; Investigation, K.B.; Methodology, D.R.F.; Project administration, D.R.F.; Writing—original draft, D.R.F.; Writing—review & editing, D.R.F. All authors have read and agreed to the published version of the manuscript.
Funding
This research was directly funded by Sierra Research Inc. and Holland and Hart, LLP.
Institutional Review Board Statement
Not applicable.
Informed Consent Statement
Not applicable.
Data Availability Statement
The finalized data are contained within the article. The raw data do not reside in a publicly available data set, but are available from the corresponding author.
Acknowledgments
We thank Sierra Research Inc. and Holland and Hart LLP for providing the financial support to conduct this research.
Conflicts of Interest
The authors declare no conflict of interest.
References
- Pope, C.A.; Thun, M.J.; Namboodiri, M.M.; Dockery, D.W.; Evans, J.S.; Speizer, F.E.; Heath, C.W. Particulate Air Pollution as a Predictor of Mortality in a Prospective Study of U.S. Adults. Am. J. Respir. Crit. Care Med. 1995, 151, 669–674. [Google Scholar] [CrossRef]
- Chow, J.C.; Watson, J.; Lowenthal, D.H.; Solomon, P.A.; Magliano, K.L.; Ziman, S.D.; Richards, L.W. PM10 source apportionment in California’s San Joaquin valley. Atmos. Environ. Part A Gen. Top. 1992, 26, 3335–3354. [Google Scholar] [CrossRef]
- Venkatram, A.; Fitz, D.; Bumiller, K.; Du, S.; Boeck, M.; Ganguly, C. Using a dispersion model to estimate emission rates of particulate matter from paved roads. Atmos. Environ. 1999, 33, 1093–1102. [Google Scholar] [CrossRef]
- Kauhaniemi, M.; Kukkonen, J.; Härkönen, J.; Nikmo, J.; Kangas, L.; Omstedt, G.; Ketzel, M.; Kousa, A.; Haakana, M.; Karppinen, A. Evaluation of a road dust suspension model for predicting the concentrations of PM10 in a street canyon. Atmos. Environ. 2011, 45, 3646–3654. [Google Scholar] [CrossRef]
- Denby, B.; Sundvor, I.; Johansson, C.; Pirjola, L.; Ketzel, M.; Norman, M.; Kupiainen, K.; Gustafsson, M.; Blomqvist, G.; Omstedt, G. A coupled road dust and surface moisture model to predict non-exhaust road traffic induced particle emissions (NORTRIP). Part 1: Road dust loading and suspension modelling. Atmos. Environ. 2013, 77, 283–300. [Google Scholar] [CrossRef]
- Abu-Allaban, M.; Gillies, J.A.; Gertler, A.W. Application of a multi-lag regression approach to determine on-road PM10 and PM2.5 emission rates. Atmos. Environ. 2003, 37, 5157–5164. [Google Scholar] [CrossRef]
- Abu-Allaban, M.; Gillies, J.A.; Gertler, A.W.; Clayton, R.; Proffitt, D. Tailpipe, resuspended road dust, and brake-wear emission factors from on-road vehicles. Atmos. Environ. 2003, 37, 5283–5293. [Google Scholar] [CrossRef]
- Kumar, A.V.; Patil, R.; Nambi, K. A composite receptor and dispersion model approach for estimation of effective emission factors for vehicles. Atmos. Environ. 2004, 38, 7065–7072. [Google Scholar] [CrossRef]
- Claiborn, C.; Mitra, A.; Adams, G.; Bamesberger, L.; Allwine, G.; Kantamaneni, R.; Lamb, B.; Westberg, H. Evaluation of PM10 emission rates from paved and unpaved roads using tracer techniques. Atmos. Environ. 1995, 29, 1075–1089. [Google Scholar] [CrossRef]
- Kantamaneni, R.; Adams, G.; Bamesberger, L.; Allwine, E.; Westberg, H.; Lamb, B.; Claiborn, C. The measurement of roadway PM10 emission rates using atmospheric tracer ratio techniques. Atmos. Environ. 1996, 30, 4209–4223. [Google Scholar] [CrossRef]
- Ferm, M.; Sjöberg, K. Concentrations and emission factors for PM2.5 and PM10 from road traffic in Sweden. Atmos. Environ. 2015, 119, 211–219. [Google Scholar] [CrossRef]
- Sehmel, G. Particle resuspension from an asphalt road caused by car and truck traffic. Atmos. Environ. 1973, 7, 291–309. [Google Scholar] [CrossRef]
- Cowherd, C., Jr.; Englehart, P.J. Paved Road Particulate Emissions; U.S. Environmental Protection Agency Document EPA-600/7-84-077; U.S. Environmental Protection Agency: Washington, DC, USA, 1984.
- Xueli, J.; Dahe, J.; Simei, F.; Hui, Y.; Pinjing, H.; Boming, Y.; Zhongliang, L.; Chang, F. Road dust emission inventory for the metropolitan area of Shanghai City. Atmos. Environ. Part A Gen. Top. 1993, 27, 1735–1741. [Google Scholar] [CrossRef]
- Veranth, J.M.; Pardyjak, E.R.; Seshadri, G. Vehicle-generated fugitive dust transport: Analytic models and field study. Atmos. Environ. 2003, 37, 2295–2303. [Google Scholar] [CrossRef]
- Gillies, J.; Etyemezian, V.; Kuhns, H.; Nikolic, D.; Gillette, D. Effect of vehicle characteristics on unpaved road dust emissions. Atmos. Environ. 2005, 39, 2341–2347. [Google Scholar] [CrossRef]
- Qi, J.; Huang, Y.; Al-Ansari, N.; Knutsson, S. Dust Emission from unpaved roads in Luleå, Sweden. J. Earth Sci. Geotech. Eng. 2013, 3, 1–13. [Google Scholar]
- Fitz, D.R. Measurements on PM10 and PM2.5 Emission Factors from Paved Roads in California. Final Report to the California Air Resources Board under Contract No. 98-723. June 2001. Available online: https://ww2.arb.ca.gov/sites/default/files/classic/research/apr/reports/l819.pdf (accessed on 30 September 2021).
- Kuhns, H.; Etyemezian, V.; Landwehr, D.; MacDougall, C.; Pitchford, M.; Green, M. Testing re-entrained aerosol kinetic emissions from roads (TRAKER): A new approach to infer silt loading on roadways. Atmos. Environ. 2001, 35, 2815–2825. [Google Scholar] [CrossRef]
- Pirjola, L.; Johansson, C.; Kupiainen, K.; Stojiljkovic, A.; Karlsson, H.; Hussein, T. Road Dust Emissions from Paved Roads Measured Using Different Mobile Systems. J. Air Waste Manag. Assoc. 2010, 60, 1422–1433. [Google Scholar] [CrossRef] [Green Version]
- Mathissen, M.; Scheer, V.; Kirchner, U.; Vogt, R.; Benter, T. Non-exhaust PM emission measurements of a light duty vehicle with a mobile trailer. Atmos. Environ. 2012, 59, 232–242. [Google Scholar] [CrossRef]
- Kunz, B.K.; Green, N.S.; Albers, J.L.; Wildhaber, M.L.; Little, E.E. Use of Real-Time Dust Monitoring and Surface Condition to Evaluate Success of Unpaved Road Treatments. Transp. Res. Rec. J. Transp. Res. Board 2018, 2672, 195–204. [Google Scholar] [CrossRef]
- U.S. Environmental Protection Agency. AP-42 Compilation of Air Emission Factors, Section 13.2.2 Unpaved Roads; U.S. Environmental Protection Agency: Washington, DC, USA, 2006.
- U.S. Environmental Protection Agency. AP-42 Compilation of Air Emission Factors, Section 13.2.1 Paved Roads; U.S. Environmental Protection Agency: Washington, DC, USA, 2011.
- Fitz, D.R.; Bumiller, K.; Bufalino, C.; James, D.E. Real-time PM10 emission rates from paved roads by measurement of concentrations in the vehicle’s wake using on-board sensors. Part 1. SCAMPER method characterization. Atmos. Environ. 2020, 230, 117483. [Google Scholar] [CrossRef]
- Fitz, D.R.; Bumiller, K.; Etyemesian, V.; Kuhns, H.D.; Gillies, J.A.; Nikolich, G.; James, D.E.; Langston, R.; Merle, R.S., Jr. Real-time PM10 emission rates from paved roads by measurement of concentrations in the vehicle’s wake using on-board sensors. Part 2. Comparison of SCAMPER, TRAKER™, flux measurements, and AP-42 silt sampling under controlled conditions. Atmos. Environ. 2021, 256, 118453. [Google Scholar] [CrossRef]
Publisher’s Note: MDPI stays neutral with regard to jurisdictional claims in published maps and institutional affiliations. |
© 2021 by the authors. Licensee MDPI, Basel, Switzerland. This article is an open access article distributed under the terms and conditions of the Creative Commons Attribution (CC BY) license (https://creativecommons.org/licenses/by/4.0/).