Article

Diurnal Variation and Distribution of Short-Duration Heavy Rainfall in Beijing–Tianjin–Hebei Region in Summer Based on High-Density Automatic Weather Station Data

Institute of Urban Meteorology, China Meteorological Administration, Beijing 100089, China
*
Author to whom correspondence should be addressed.
Atmosphere 2021, 12(10), 1263; https://doi.org/10.3390/atmos12101263
Submission received: 17 August 2021 / Revised: 21 September 2021 / Accepted: 23 September 2021 / Published: 28 September 2021
(This article belongs to the Section Meteorology)

Abstract

:
The distribution and diurnal variation of short-duration heavy rainfall (SDHR) and the influence of a complex underlying surface were studied by using fine-scale hourly precipitation data in the Beijing–Tianjin–Hebei (BTH) region during the summers of 2014–2020. Areas prone to SDHR are located mainly in the southern foothills of the Yanshan Mountains, the foothills area, and the trumpet-shaped topographic entrance area north of Beijing, areas inland of the west coast of Bohai Bay, and the northern Beijing urban area. Owing to the influence of topography and the geographical location, the distribution and diurnal variation SDHR is significantly different in the western and northern mountainous areas, the foothills, and the plains. Compared to the underlying urban surface, the topography and the land–sea interface have considerable effects on the distribution of SDHR. A key finding is that the foothills of northern of Beijing, eastern slope and piedmont area of the Taihang Mountains, and the land–sea interface of Bohai Bay play important roles in the formation and propagation of SDHR.

1. Introduction

Short-duration heavy rainfall (SDHR), which is the characteristic of strong convective weather, can cause flooding and can have adversary effects on traffic in urban areas. SDHR is also closely related to the occurrence of disasters such as flash floods, debris flows, and landslides. Consequently, it represents one of the focuses of strong convective weather prediction. Davis et al. (2001) [1] showed that precipitation of ≥20 mm h−1 in the United States is likely to cause flash flood disasters. Brooks et al. (2000) [2] analyzed SDHR processes within a 3 h timescale in the United States and found that the distribution of SDHR was very similar to that of flash flood events. Hourly precipitation data are useful for assessing the climatic probability of flash floods. Zhang et al. (2011) [3] adopted 20 mm h−1 as a reasonable criterion for SDHR, and according to the criterion, the annual average distribution of SDHR is consistent with the distribution of rainstorms in eastern China during the warm season. Li et al. (2017) [4] performed statistical analysis of SDHR in the warm season in Beijing and showed that the frequency of rainstorm days with SDHR events (defined as 50 mm day−1) accounts for more than 50% of that of total rainstorm days over the Beijing plains and near the northeast mountains.
Investigation of the spatiotemporal characteristics of heavy rain and extreme precipitation in China has been undertaken [5,6,7]. For example, Yu et al. (2007) [8,9] revealed significant diurnal variation and regional characteristics of summer precipitation in mainland China based on statistical analysis of hourly precipitation data from 485 national meteorological stations. Using the same hourly precipitation data set, Yao et al. (2009) [10] analyzed the spatial and temporal distributions of different levels of rainfall (precipitation per hour) in different seasons in China, as well as the diurnal variation of the frequency of occurrence of different levels of rainfall at representative stations. Zhang et al. (2011) [3] analyzed the geographical distribution and diurnal variation of extreme hourly precipitation during the warm season in China and discussed the mechanism of diurnal precipitation in different regions. Chen et al. (2013) [11] analyzed the spatiotemporal distribution and diurnal variation of different levels of precipitation in China during the warm season, investigated the relationship between the spatiotemporal distribution of precipitation and diurnal mesoscale convective systems using satellite data, and highlighted that extremes of precipitation might be underestimated owing to relatively sparse distributions of observing sites and low-resolution data.
Chen et al. (2007) [12] analyzed hourly precipitation data of heavy rainfall processes in Taiwan and found that rainstorms occurred most frequently over windward slopes in mountainous areas. Focusing on the impact of terrain on heavy rain and extreme heavy precipitation in the Beijing–Tianjin–Hebei (BTH) region, Shen et al. (2018) [13] used daily precipitation data (1981–2016) from 174 national meteorological stations in the BTH region (site spacing: >30 km) to analyze the spatiotemporal distribution and evolution trend of extreme precipitation. It was found that terrain elevation had the effect of increasing the precipitation amount and that the area of extreme precipitation was consistent with the East–West range of the Yanshan Mountains and the Northeast–Southwest range of the northern Taihang Mountains. On the basis of radar reflectivity data analysis, Chen et al. (2012) [14] found an area of foothills and plains with significantly high incidence of convective storms during the afternoon–evening in North China during the warm season. This finding showed that terrain controls the initiation of regional convective storms, as well as their spread and development toward the southeast. With the use of hourly precipitation and wind observation data collected from 26 national meteorological stations in the Beijing and Hebei area, Yin et al. (2011) [15] estimated the distribution and diurnal variation of summer precipitation in Beijing. It was found that the precipitation peaks, which occurred at night in the plains while in the afternoon in the mountains, were determined by the valley circulation and the urban–rural circulation around Beijing. Yuan et al. (2020) [16] analyzed hourly precipitation data from 18 national meteorological stations in the Beijing area. It was found that the extreme hourly precipitation in urban areas is greater than in the suburbs, and the extreme hourly precipitation in urban areas tends to appear during 10:00–02:00 local time. Li et al. (2008) [17] and Yang et al. (2013) [18] both used hourly precipitation data from a single meteorological station and 123 automatic weather stations (AWSs) to study the duration, distribution, and diurnal variation of summer precipitation in Beijing and reported that summer precipitation in Beijing comprises mainly short-duration events. Affected by complex topography and geographical conditions, the diurnal variation of precipitation has considerable spatial discrepancy. The SDHR frequency in Beijing is high in the evening and first half of the night (19:00–23:00 local time), and the amount of precipitation is large, while the peak frequency in the southeastern area occurs mostly in the early morning (03:00–05:00 local time). Zheng et al. (2015) [19] used hourly data from 237 AWSs in the Beijing area to analyze the fine spatiotemporal distribution of summer precipitation in Beijing and the urban–suburban difference and concluded that the distribution of precipitation intensity is roughly consistent with the distribution of the terrain elevation. The urban effect has different effects on precipitation of different intensities and has a more obvious impact on the intensity of local precipitation. Yang et al. (2017) [20] used hourly data from a ground-encrypted AWS to study the correlation between the urban heat island intensity and SDHR events in the Beijing urban area. It was found that the SDHR frequency is high in central urban or nearby areas and that most SDHR events start to appear late at night and end early in the morning. Significant correlation was found between SDHR events and the urban heat island intensity of the previous three hours. Wang et al. (2013) [21] analyzed the spatiotemporal distribution and diurnal variation of the SDHR by using fine-scale observations from 187 AWSs in the Beijing area and elucidated the influence of both the terrain and the city on the local distribution of SDHR. Three areas of high-incidence SDHR in the Beijing area were described: the urban area near the western foothills; the foothills at the junction of Huairou, Changping, and Shunyi districts to the Miyun Reservoir area; and the foothills in Pinggu District. Topography and the urban area have an obvious influence on SDHR distribution in the Beijing area. Generally, SDHR in the BTH region, which can produce large rainfall accumulations, occurs mainly during afternoon through to the first half of the night.
The abovementioned studies highlight that the marked discrepancies in the spatial distribution of SDHR in the BTH region could be attributed to various factors such as local topography and the underlying urban environment. Previous studies have mostly used daily precipitation (daily rainfall too coarse temporarily to capture rainfall (convection)) and hourly precipitation data from national meteorological stations (national meteorological stations lack of station coverage) to study the spatiotemporal distribution and diurnal variation of precipitation in mainland China. Owing to the complex topography of the BTH region, the distribution of the 158 national meteorological stations that are within the region is highly uneven, i.e., there are more (less) stations located in the plain (mountain) areas. Thus, the data obtained from these stations reflect only the average conditions in the local area rather than the full characteristics of the entire BTH region. Current comprehension of the influence of the underlying surface on the spatiotemporal distribution of SDHR remains insufficient for us to understand the initiation and evolution mechanisms of SDHR, which restricts our ability to improve the prediction of SDHR events. Over the previous 10 years, the AWS network in the BTH region has gradually been expanded, and it now comprises more than 3885 stations. In this study, we used a new station network that has 1878 stations (after quality control of 1878 stations, site spacing is about 1–5 km) with hourly records of spatial observation resolution being much higher below the size of rainfall convective system. Based on the above, the objectives of this study were to investigate the spatiotemporal distribution of SDHR events in the BTH region and to reveal the characteristics of the formation and diurnal variation of SDHR using fine-scale hourly precipitation data from 1878 AWSs in the BTH region during the summers of 2014–2020 (7 years).

2. Data and Method

2.1. Data Quality Control

The initial data considered in this study comprised hourly precipitation observations from 3885 national meteorological stations and regional AWSs in the BTH region (average spacing: 1–5 km), acquired from 1 June to 31 August (2014–2020). First, quality control was performed to remove data from stations for which the site information was incorrect, observation values were abnormal (beyond precipitation valid value), or the observation values did not pass the climate extreme value check (the climate threshold was set at 200 mm h−1). Second, stations for which the number of precipitation samples was too small (i.e., no precipitation data or time of site construction was too late) for acceptable statistical analyses of the annual average precipitation and the probability of occurrence of precipitation at various intensity levels were excluded. Moreover, the precipitation data arrival rate of each station was considered, and the data from stations whose report rate did not reach 90% were removed. The precipitation data arrival rate refers to the percentage of the number of effective precipitation observations to the total number of observations. Thus, ultimately, hourly precipitation data from 1878 stations (1878 stations after quality control, the closest distance between stations is approximately 1–5 km) were considered to meet the requirements of the statistical analyses.

2.2. Data Processing Method

At the observation stations, an hourly quantity of precipitation of ≥0.1 mm is recorded as precipitation. The average annual precipitation in summer refers to the total cumulative precipitation/years from June to August (unit: mm a−1). Precipitation intensity refers to the amount of rainfall per unit time (unit: mm h−1), i.e., the greater the precipitation intensity, the more violent the rainfall. There is currently no unified criterion for the definition of SDHR. Therefore, in accordance with the criterion of the China Meteorological Administration “National Short-term Nowcast Operation Regulations”, this study adopted the threshold of 20 mm h−1 as a reasonable criterion for distinguishing SDHR. Here, SDHR contribution rate of precipitation = (SDHR cumulative precipitation/total cumulative precipitation) × 100%, where total cumulative precipitation means the total amount of precipitation in the station.
In accordance with the above classification of precipitation intensity, by counting the number of SDHR events at each site within the study region in the summers from 2014 to 2020 and defining the annual average number of SDHR events as the SDHR frequency (Fr), the spatial distribution of SDHR frequency was analyzed to determine the geographical effect on SDHR in summer. In this study, we calculated the SDHR frequency, i.e., F r i (where i is time (h): 1, 2, 3, …, 24), at each station and for every hour for comprehensive analysis of the diurnal variation of SDHR in the BTH region. Moreover, we also considered both the summer mean patterns and the monthly differences during June, July, and August.
To address the discrepancies in the distribution of the observation stations, we used the inverse distance squared weight interpolation method [22] to interpolate the SDHR frequency at the 1878 stations to a gridded field (1 × 1 km2) in a rectangular analysis domain (510 × 690 km2). Then, we analyzed the diurnal variation of the spatial distribution and propagation of SDHR in the warm season and in each month (June, July, and August) [3,7,8,13,23,24,25].
Unless stated otherwise, all times quoted refer to local standard time (LST), which is 8 h ahead Coordinated Universal Time (UTC), (LST = UTC + 8).

3. Analysis and Results

3.1. Spatial Distribution of SDHR

The BTH region is located in the northeast of the North China Plain (36.0°–42.3° N, 113.5°–120.0° E) [26]. The study area extended over the range 37.0°–42.5° N, 113.5°–119.0° E (shown by the large solid rectangle A–B–C–D, Figure 1a). The topography of the BTH region is complex; high terrain in the northwest declines with a semi-annular characteristic to an area of low terrain in the southeast. The Bashang Plateau is in the northwest of the BTH region. The Yanshan Mountains in the north and northeast of the region have East–West orientation. Huairou, Miyun, and Pinggu districts in the northwest and northeast of Beijing and the northern and northeastern areas of Tangshan City in northeastern Hebei are all located in the southern foothills of the Yanshan Mountains. In this article, they are called the northern foothills of Beijing and the southern foothills of Yanshan in northeastern Hebei. The Taihang Mountains in the west and southwest of the BTH region have Northeast–Southwest orientation, while Baoding City, Shijiazhuang City, Xingtai City, and Handan City in Hebei Province are located in the piedmont plain of the eastern Taihang Mountains. In addition, the area is intercut by Bohai Bay, which extends inland in the southeast of the BTH region (Figure 1a). The distribution of the AWSs within the study area is presented in Figure 1b.
To investigate the impact on SDHR of the Yanshan Mountains in the northeast of Hebei Province, Taihang Mountains in the west, and land–sea topography in the southeast, the BTH region was divided into two zones. The northern zone extended over the range 39.2°–42.0° N, 113.5°–119.5° E (solid rectangle A–B–E–F, Figure 1a), and the southern zone extended over the range 37.0°–39.2° N, 113.5°–119.5° E (solid rectangle F–E–C–D, Figure 1a). The focus of study in the northern zone was on the impact on SDHR of the areas to the west and north of Beijing, the topography of the Yanshan Mountains in the northeast of the BTH region, and the Beijing urban area. The focus of study in the southern zone was on the impact on SDHR of the topography of the Taihang Mountains in the west and the differences in the underlying land–sea surface of the Bohai Bay region in the southeast.
The area of Beijing (small, dashed rectangle, Figure 1a), which is located in the central part of the northern zone, extends over the range 39.2°–41.1° N, 115.4°–117.5° E (Figure 1c). The topography and a map of the districts of the Beijing area are illustrated in Figure 1c. Western, northwestern, and northeastern parts of Beijing are all mountainous areas, while central, eastern, and southern areas are plain areas. The western and northwestern parts of Beijing comprise Xishan Mountain (Taihang Mountains) and Jundushan Mountain (Yanshan Mountains), respectively. Huairou, Miyun, and Pinggu districts are located in the southern foothills of the Yanshan Mountains. To the northeast and northwest are high mountains, whereas to the south is a wide plain, presenting a typical trumpet-shaped topographic area with the opening to the south. Southern parts of Huairou and Miyun districts and northern parts of Shunyi District are at the entrance of this trumpet-shaped topographic area. Fangshan District is located on the southeastern slopes of Baihua Mountain, encompassing the foothills and the plains of southwestern Beijing. The main urban area is located within the Third Ring Road. Chaoyang District is located in eastern parts of the Beijing area, while Pinggu and Tongzhou districts are in the east. Beijing is a major city with a permanent population of more than 21 million residents (China News Network https://www.chinanews.com/cj/2020/01-20/9065335.shtml, accessed on 20 January 2020).
The BTH region is in a monsoon climatic zone, and the water vapor brought by the summer monsoon is an important condition for regional precipitation. The summer monsoon advances from south to north and retreats from north to south; therefore, the BTH region should be characterized by a greater quantity of precipitation and a longer rainy season in the south compared with the north [27]. However, the annual average distribution of summer precipitation (Figure 2a) reveals that the precipitation centers are closely related to topography. Four main precipitation centers are evident: the southern foothills of the Yanshan Mountains in northeastern Hebei Province, southern foothills of the mountainous area in the north of Beijing, eastern slopes of the Taihang Mountains, and west coast of Bohai Bay and surrounding inland areas.
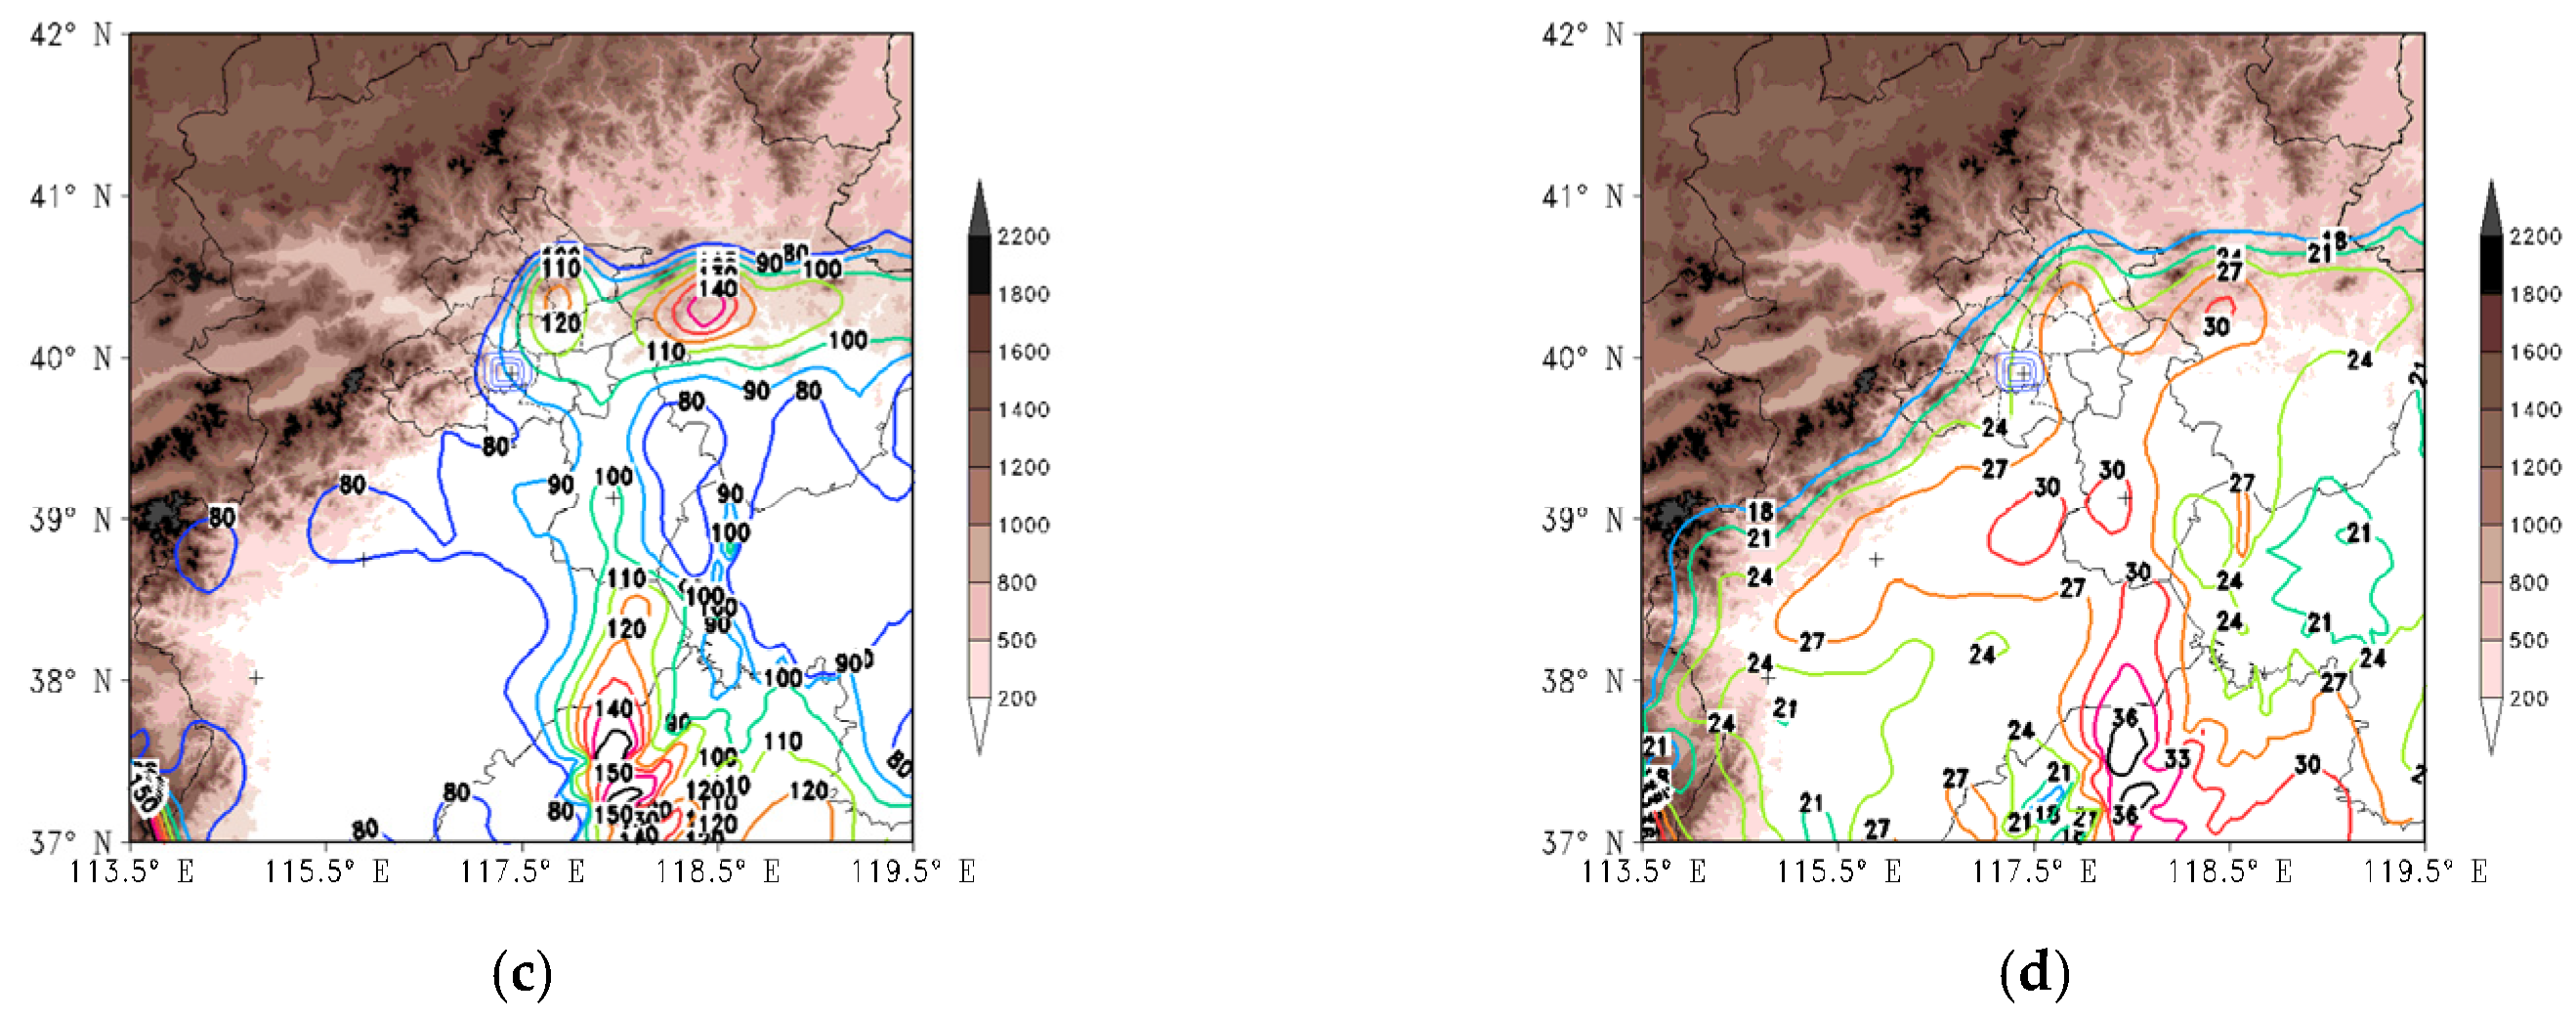
Calculation of the SDHR frequency, cumulative precipitation, and precipitation contribution rate at each station (≥20 mm h−1), in conjunction with investigation of the frequency distribution of precipitation (Figure 2a–c), reveal that the centers of high-frequency SDHR are located in the southern foothills of the Yanshan Mountains in northeastern Hebei Province, southern foothills of the mountainous area in the north of Beijing, eastern slopes of the Taihang Mountains, and west coast of Bohai Bay and surrounding inland areas (Figure 2b). The pattern of the centers of high SDHR frequency is similar to that of SDHR cumulative precipitation (Figure 2c). In central and eastern parts of Hebei Province, the southern foothills of the Yanshan Mountains in the northeast, and the Tianjin area, the contribution rate of precipitation to SDHR is relatively large, and the maximum can exceed 50% (Figure 2d). It shows that strong convective precipitation in the above areas in summer contributes substantially to the total cumulative precipitation (i.e., close to 50%). Therefore, the distribution of SDHR in summer in the BTH region is evidently affected by topography and the interlaced underlying land–sea surface.
The summer monsoon is usually characterized by southwesterly (or southeasterly) winds that transport considerable quantities of water vapor. When the southwesterly winds meet a western mountainous area, local initiation or enhancement of upward airflow is forced, which in the BTH region is conducive to SDHR formation in the foothills and the eastern slopes of the Taihang Mountains. Concurrently, another component of the airflow circulates along the foothills to form local small cyclonic vortices conducive to the formation of SDHR [28]. When summer monsoon winds enter the trumpet-shaped topographic area, vertical motion occurs owing to convergence of the horizontal airflow [29] in conjunction with orographic ascent, which has the effect of enhancing local precipitation. Moreover, in summertime, when humid southeasterly surface winds blow from the ocean, a convergence zone forms near the coast because of the increased roughness of the land surface [30]. This is conducive to SDHR formation over the west coast of Bohai Bay and explains why the local contribution rate of SDHR is greater than in other regions.
Some observation-based experimental studies on the impact of cities on precipitation have indicated that urbanization has increased precipitation in areas 50–70 km downwind of an urban center [31,32,33,34,35,36,37]. It has also been found that the increase in precipitation in a city and its downwind areas is related to the scale of urbanization. Diem and Brown (2003) [38] reported that human activities in urban areas have the effect of increasing summer precipitation, especially in the downwind direction.
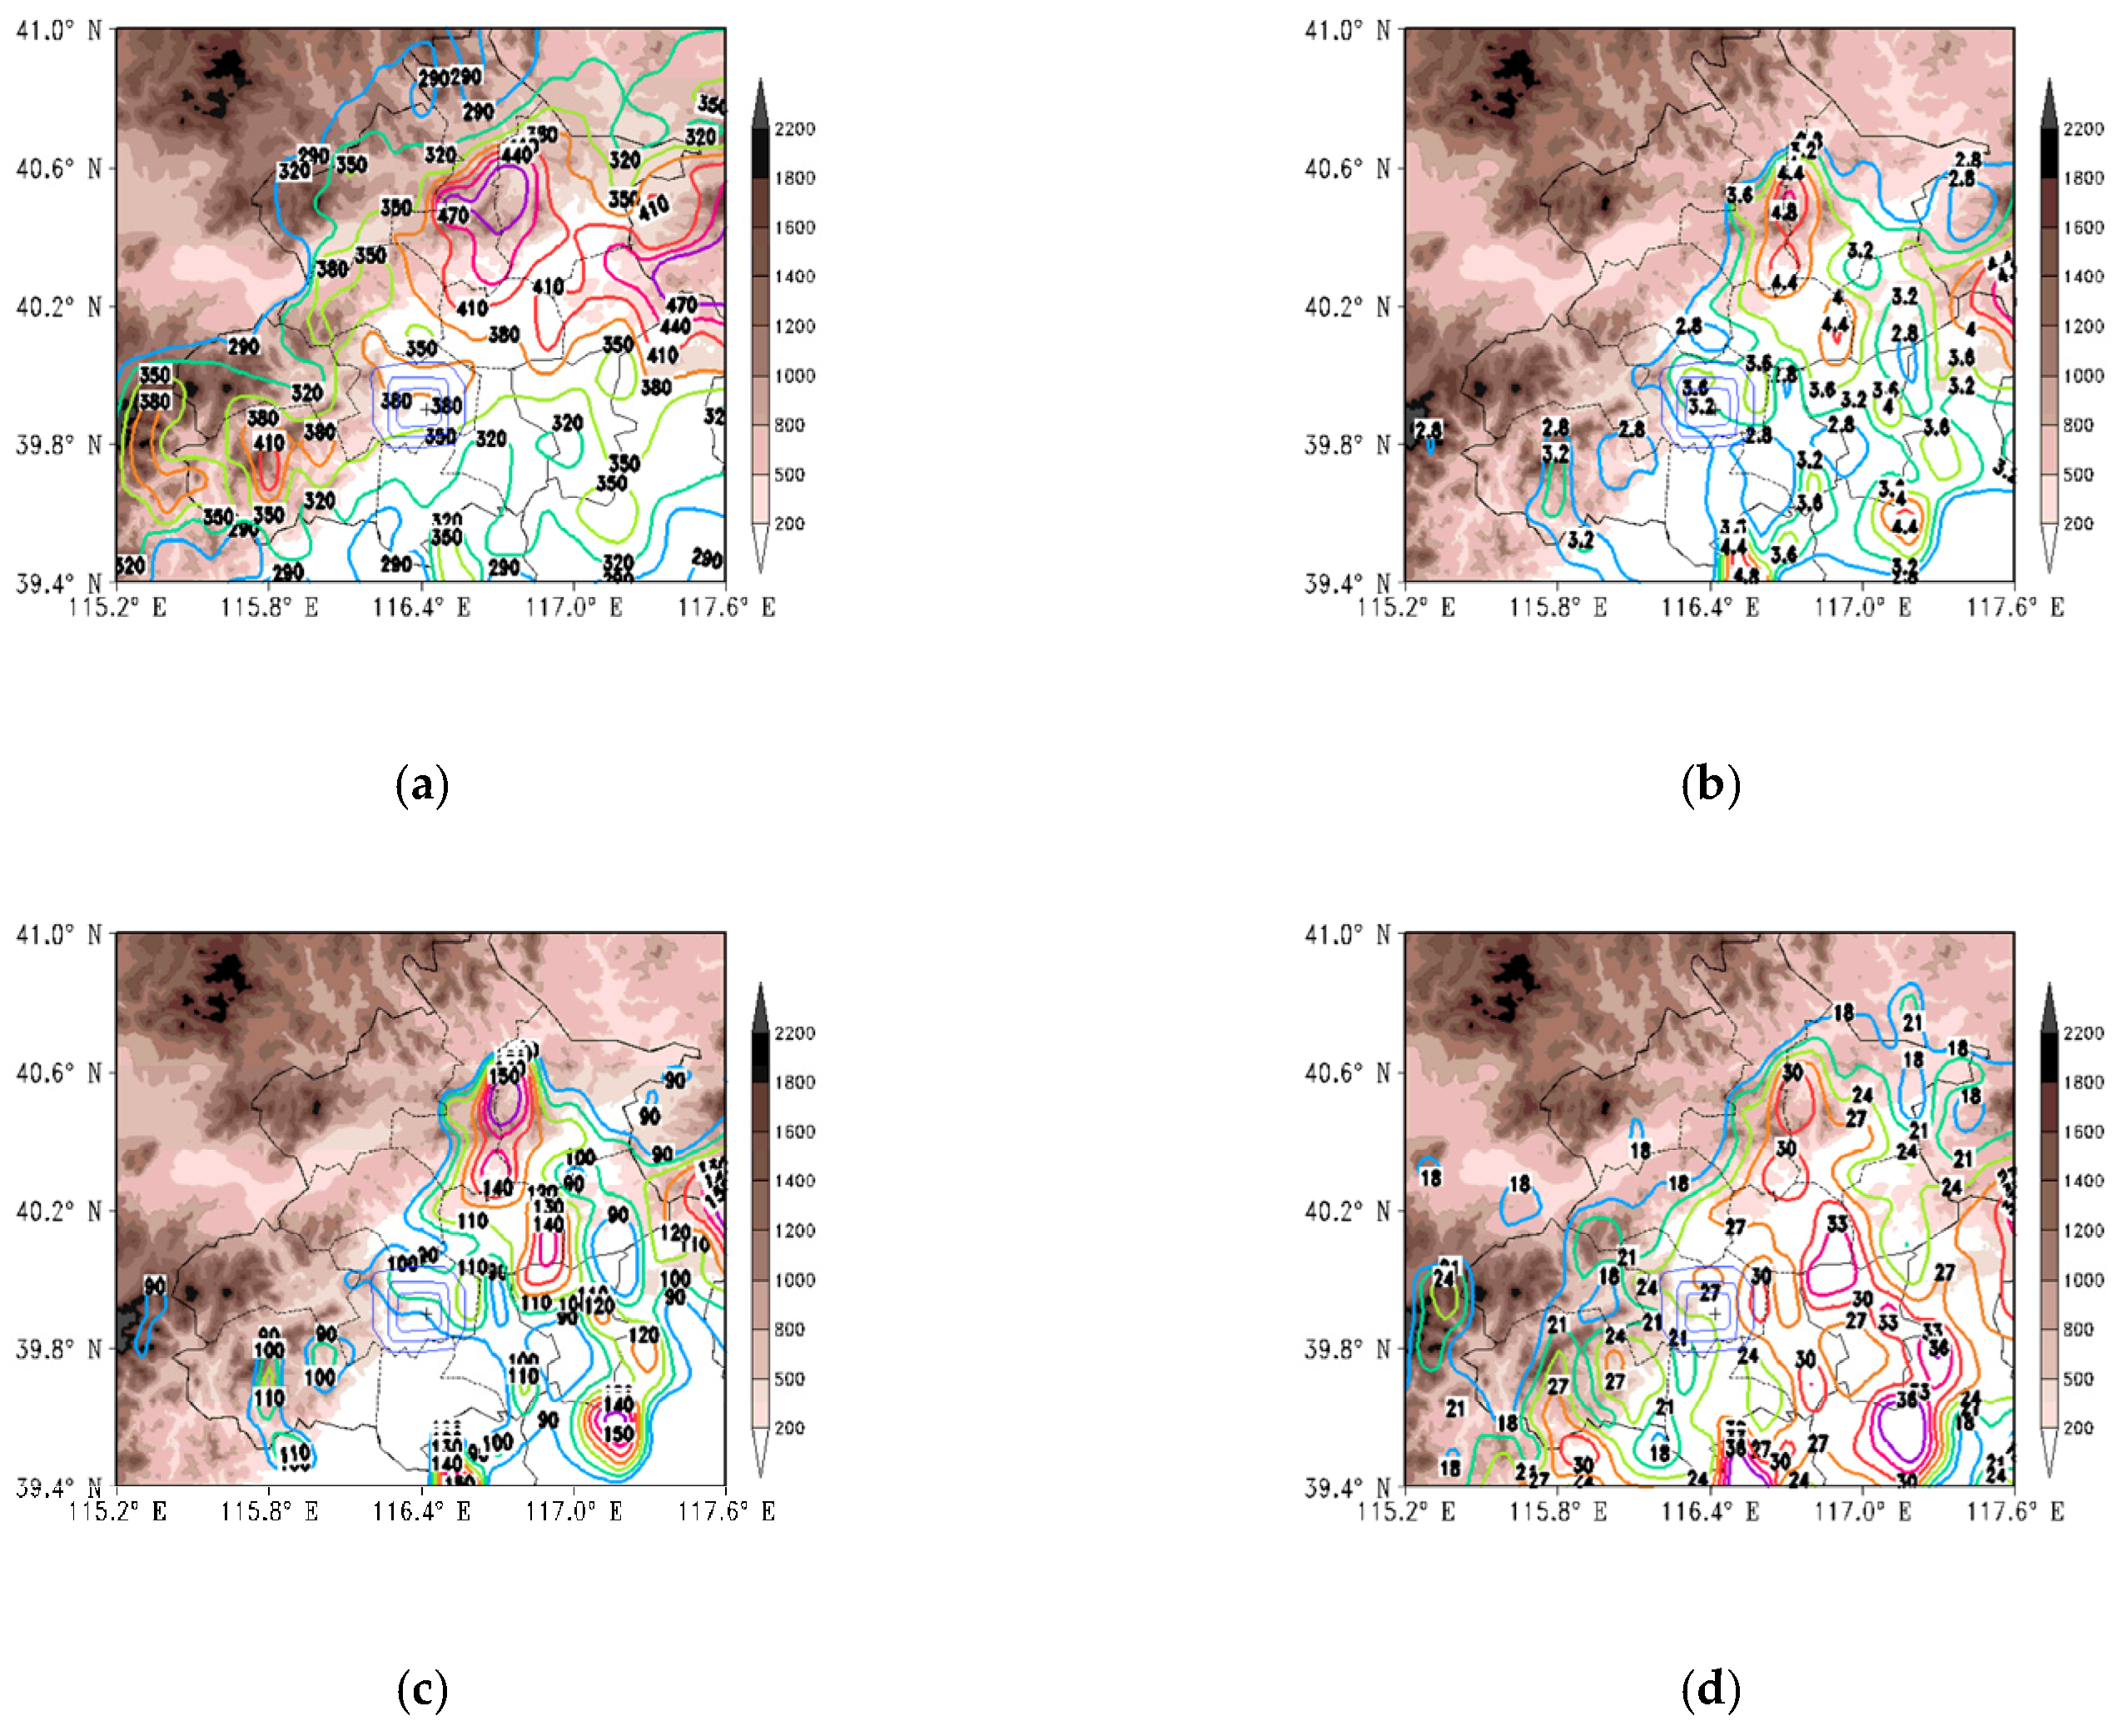
An important consideration is whether the underlying surface of the large urban area of Beijing has an impact on precipitation in general and on the formation/distribution of SDHR in particular. It can be seen from the annual average value of summer precipitation in the Beijing area (Figure 3a) that the distribution of the centers of summer precipitation matches the topography of northern, northeastern, and southwestern Beijing. For example, the centers of high precipitation are found on the southern slopes of the northern mountainous area of Beijing (central Huairou and Miyun districts), southern slopes of the mountainous area of northeastern Beijing (eastern Pinggu District), and southeastern slopes of the mountainous area of southwestern Beijing (Fangshan District). In addition, centers of high precipitation are also evident in northern parts of the city.
Analysis of the distribution of SDHR frequency (Figure 3b) shows three high-frequency centers in the Beijing area: the southern slopes of the northern mountains, the entrance of the trumpet-shaped topographic area (the junction area of Huairou, Miyun, and Shunyi districts), and northern and northeastern parts of the city (Third–Fourth Ring Road). In addition, the SDHR frequency on the southeastern slopes of the mountains of southwestern Beijing (Fangshan District) is also high.
In summer, the prevailing low-level winds over Beijing are southerly, and the areas of high incidence of SDHR are located over the southern slopes of the northern mountains, the entrance of the trumpet-shaped topographic area, and areas downwind of the city (northern and northeastern parts of Beijing City). From the distribution of the cumulative precipitation of SDHR (Figure 3c), it can be seen that the center of large values of cumulative precipitation is similar to that of the high SDHR frequency. It shows that the formation of SDHR and the distribution of precipitation are closely related to the influence of topography and cities. In addition, the contribution rate of SDHR (heavy convective precipitation) in northern, northeastern, and eastern areas of Beijing and the southeastern slopes of the mountainous area in the southwest is relatively large, i.e., up to 40% or more (Figure 3d).

3.2. Diurnal Variation of SDHR

3.2.1. Diurnal Variation of the Spatial Distribution of SDHR

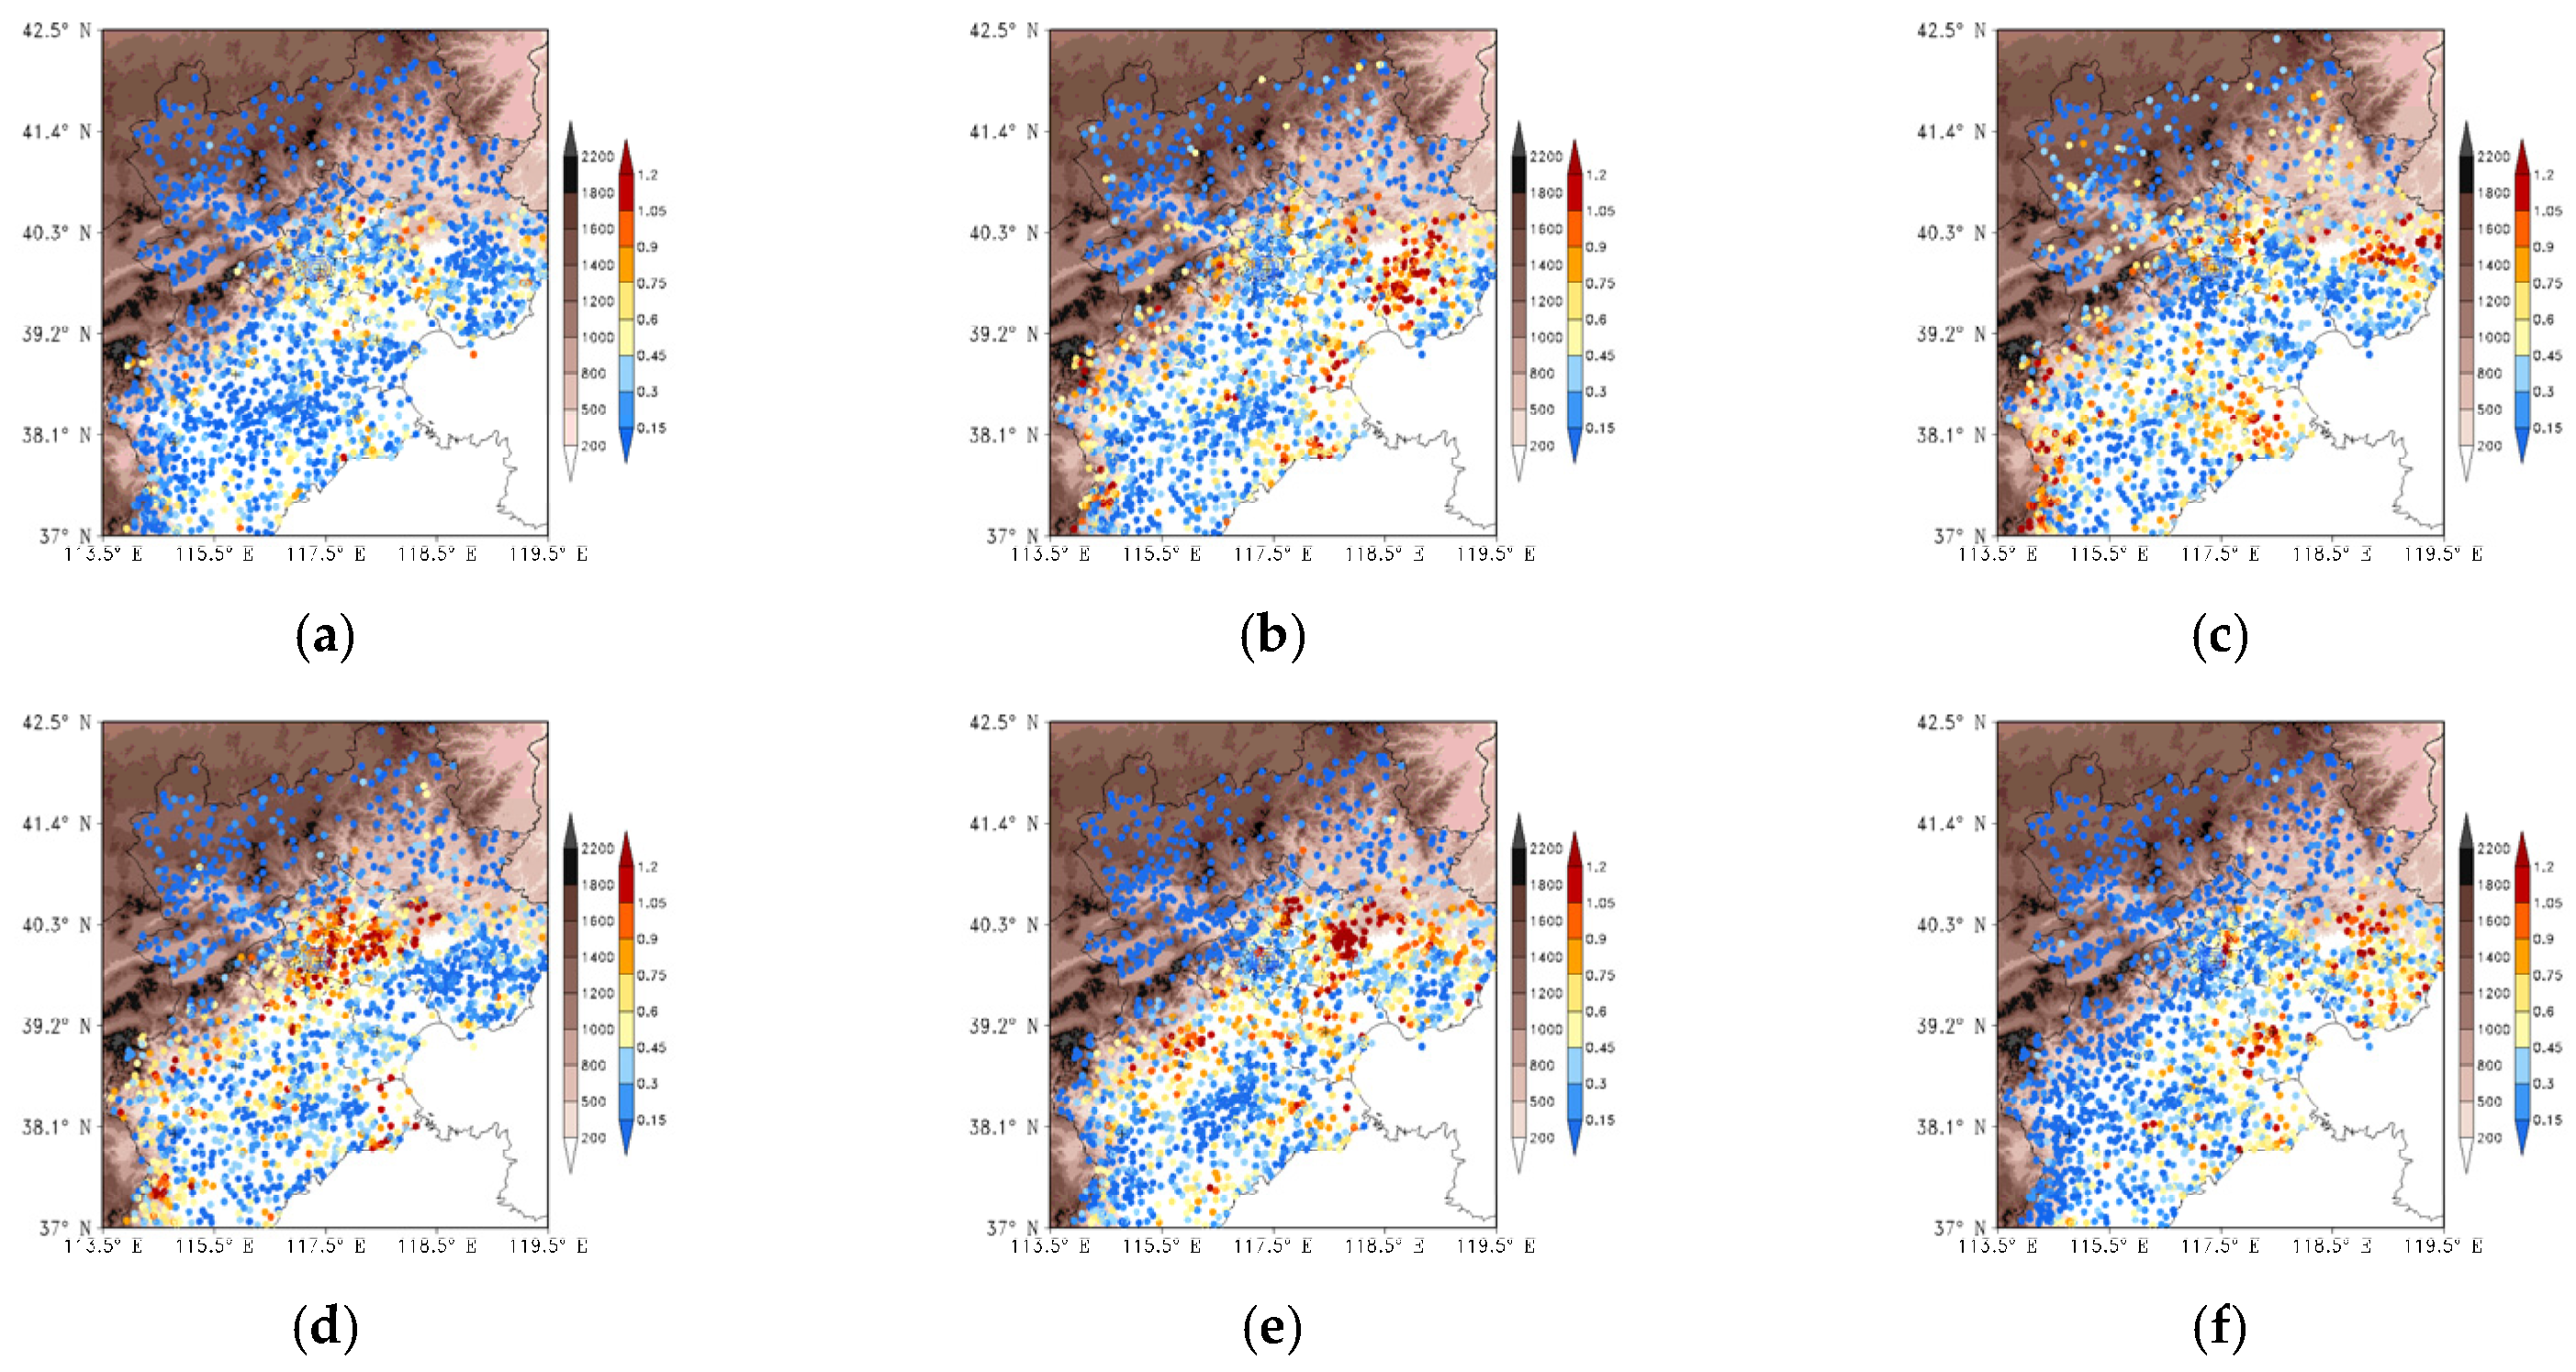
The hourly SDHR frequency at each station in the BTH region is very low in summer. Therefore, the SDHR frequency at each station was divided statistically into six periods: 0900–1200 LST (local morning), 1300–1600 (afternoon), 1700–2000 (evening), 2100–0000 (first half of the night), 0100–0400 (second half of the night), and 0500–0800 (early morning). It can be seen from the figure that the SDHR frequency is highest during 1700–2000 (evening), 2100–0000 (first half of the night), and 0100–0400 (second half of the night). According to the distribution of SDHR frequency, SDHR increases in the afternoon–evening periods (1300–2000) (Figure 4b,c) in the Yanshan Mountains in northeastern Hebei, the Taihang Mountains in the west, and both the western mountains and the northern mountains of Beijing, which is related to the initiation and evolution of thermal convection in these mountainous areas in the afternoon. At the same time, SDHR occurs frequently over the west coast of Bohai Bay and expands into surrounding inland areas. In summer, the sea breeze in Bohai Bay persists during approximately 1300–2200 (afternoon to first half of the night), while the period of sea/land breeze conversion generally occurs during 2200–0200 [36]. Thus, multiple initiation of SDHR might occur during the period of strong sea breeze, which is related to wind convergence and humidity increasing near the coast.
In the first half of the night (2100–0000), SDHR is highly prevalent in the Beijing area and to its east, in the southern foothills of the Yanshan Mountains in northeastern Hebei, and in the area of the eastern slopes and foothills of the Taihang Mountains in western Hebei. Moreover, the area of high SDHR is distributed in a band aligned NE–SW that exhibits eastward movement (Figure 4d,e). In the second half of the night (0100–0400), the area of high SDHR frequency moves eastward to the central and eastern plains of the BTH region, and the area of high SDHR in the eastern parts of Beijing moves slowly eastward. (Figure 4e). In the early morning (0500–0800), the main body of SDHR occurs over the east of the region and the spatial extent of SDHR is reduced substantially (Figure 4f). The range of SDHR is reduced markedly during 0900–1200 (morning), occurring primarily in southern and eastern areas of Beijing (Figure 4a).

3.2.2. Diurnal Variation of Frequency and Propagation of SDHR in Summer

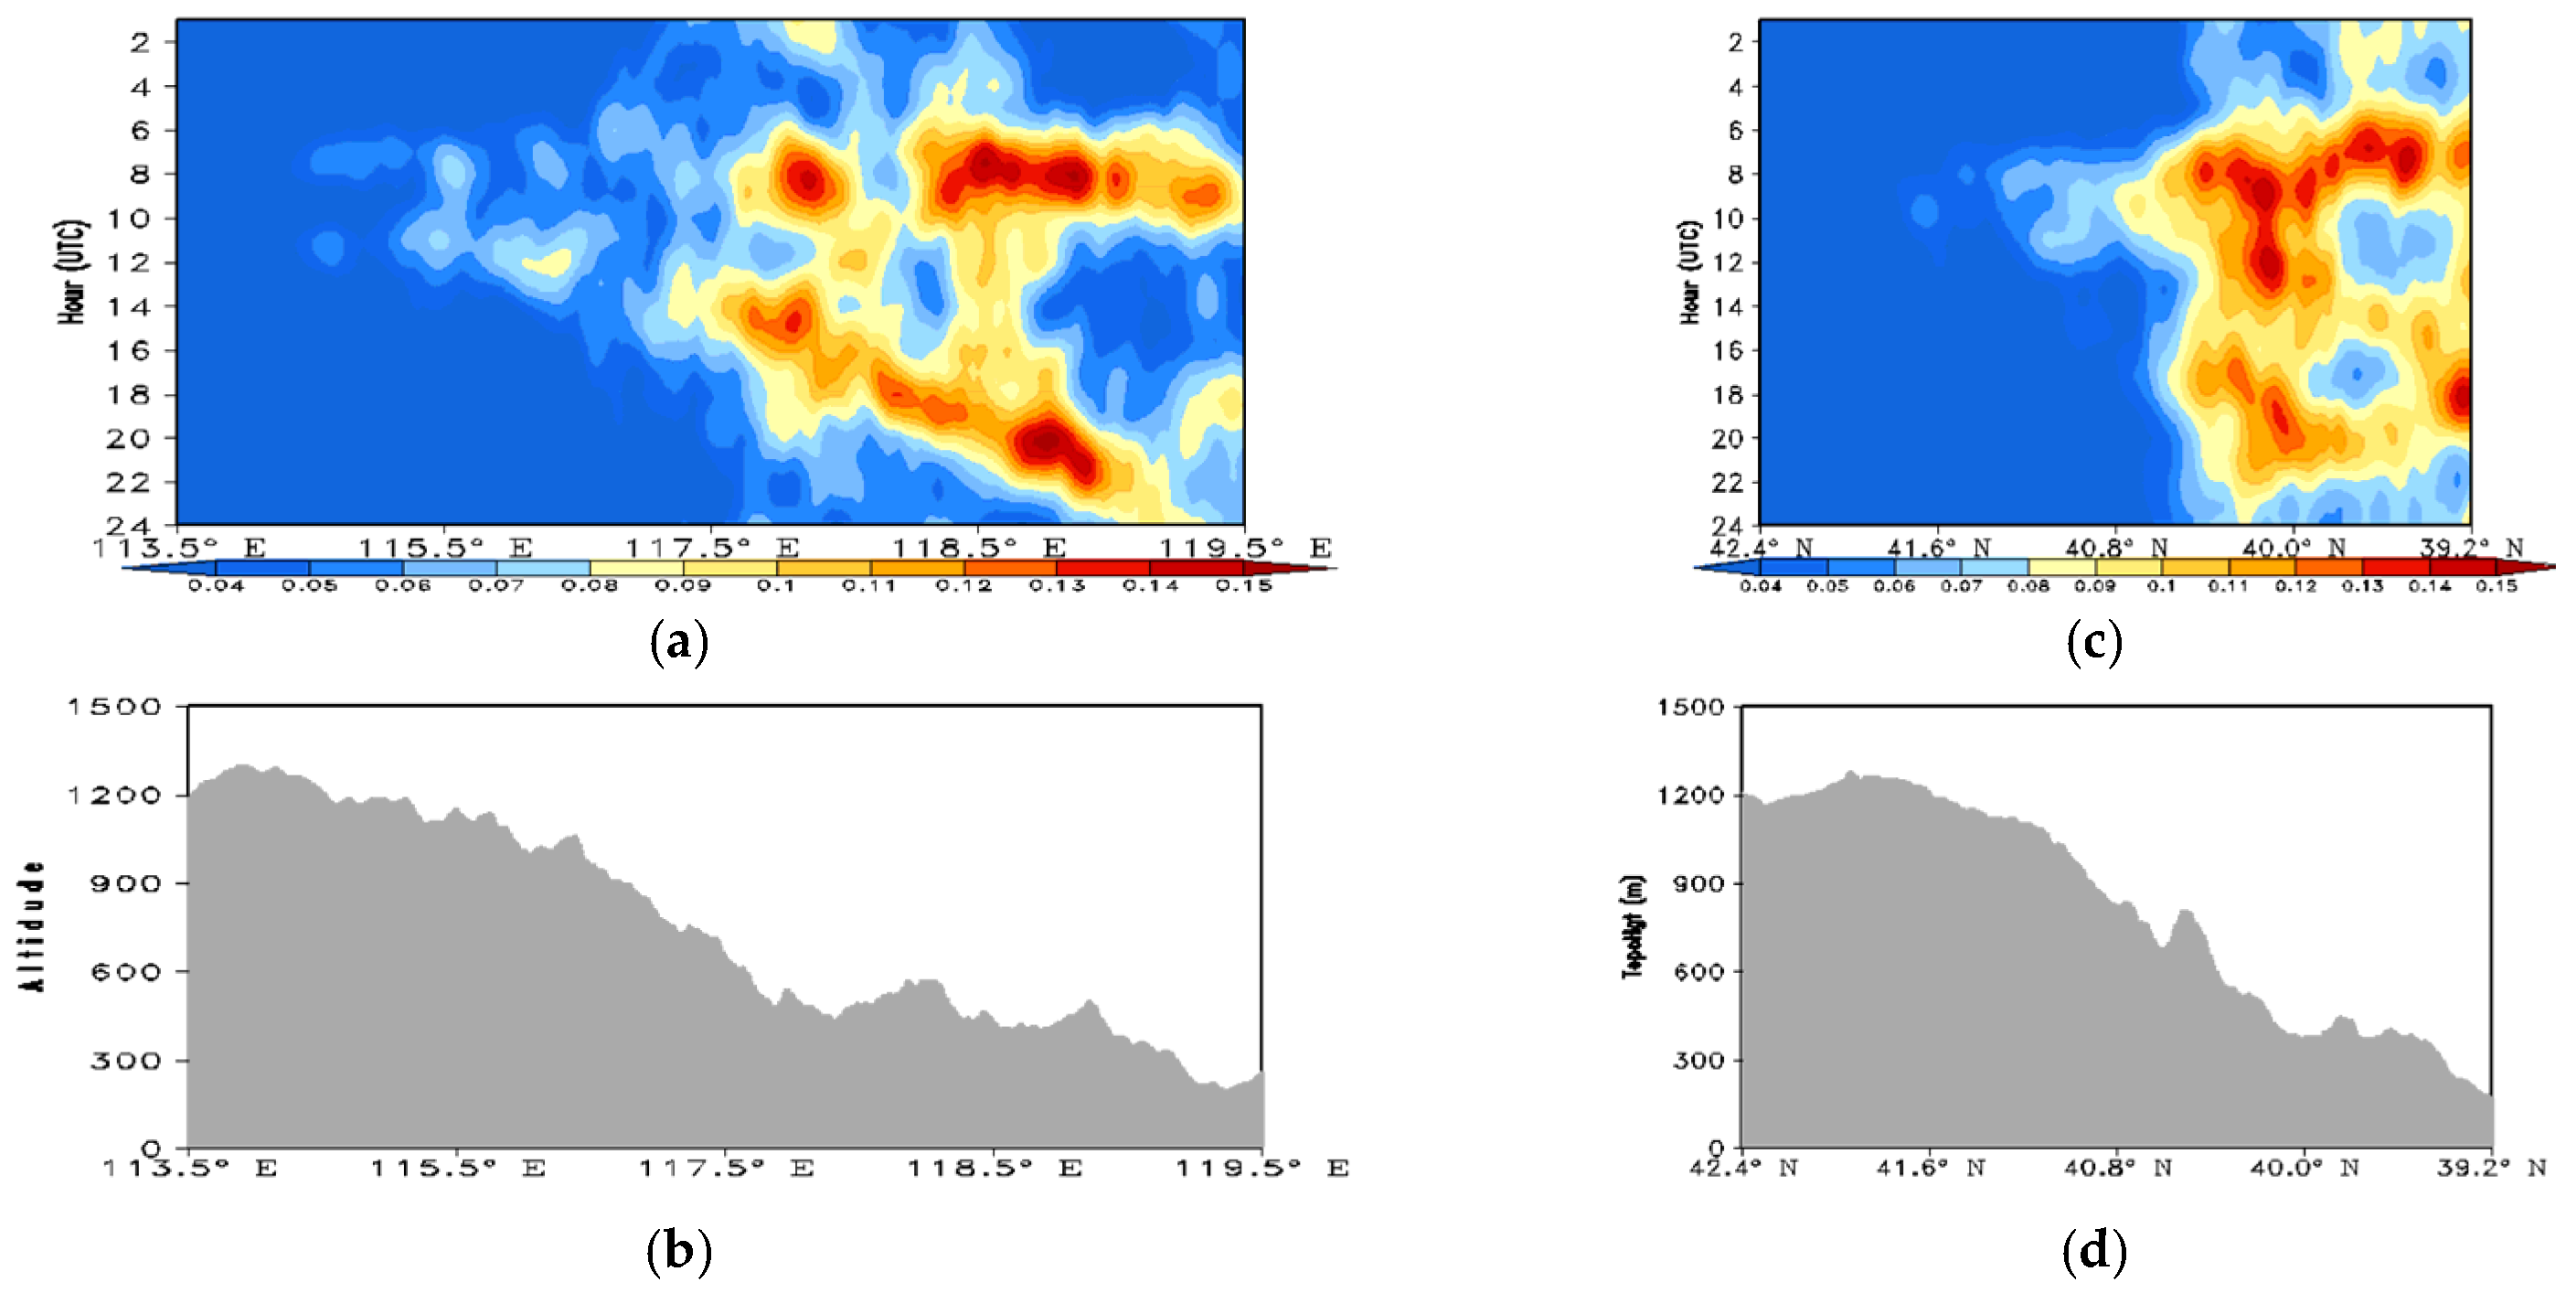
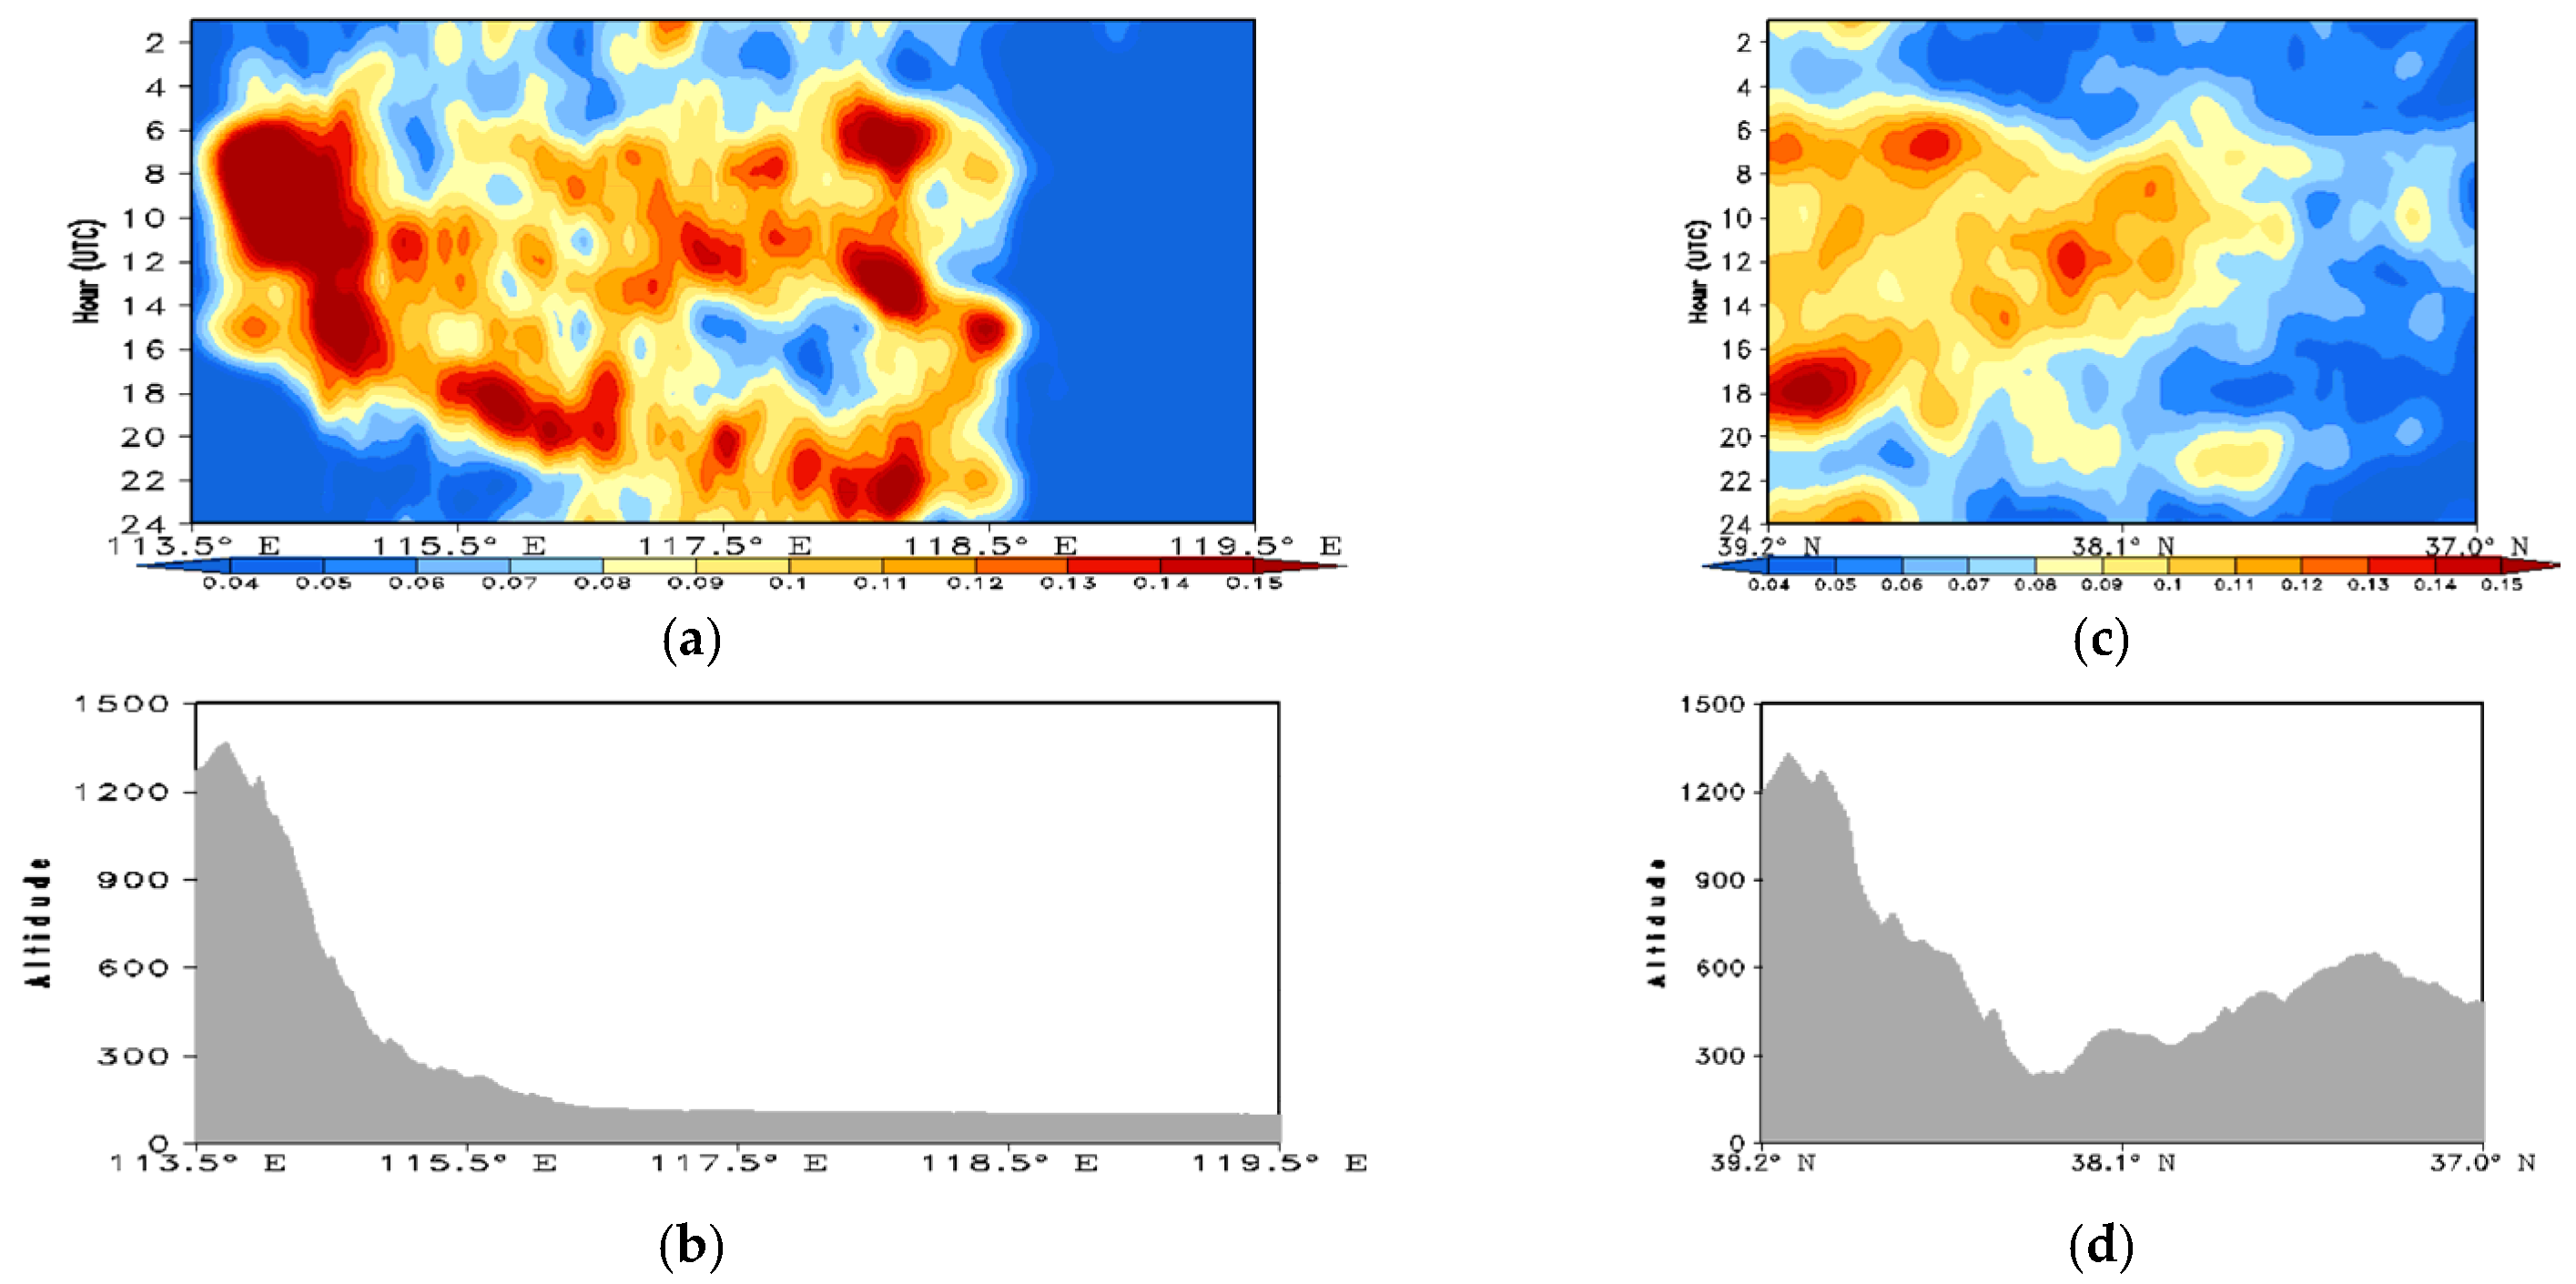
A time–distance plot (i.e., a Hovmöller diagram) can highlight the diurnal evolution and movement of SDHR, as well as the effect of topography on SDHR [3,7,8,13,21,22,23]. On the basis of interpolated gridded station data, Hovmöller diagrams of the averaged SDHR frequency in summer are shown in Figure 5 and Figure 6, together with the averaged topographic profile in the corresponding direction.
By dividing the BTH region into southern and northern zones, the impact on SDHR of the northwestern mountains, northern Yanshan Mountains, southwestern Taihang Mountains, and land–sea terrain in the southeast can be investigated. Hovmöller diagrams of the longitudinal averages (Figure 5a,b) and latitudinal averages (Figure 5c,d) for the northern zone (solid rectangle A–B–E–F, Figure 1) are analyzed. In the northwestern mountainous area of the BTH region (40.8°–42.5° N, 113.5°–116.0° E) and the northeastern mountainous area (40.8°–42.5° N, 116.0°–119.5° E), the SDHR frequency is low, and the diurnal variation of SDHR frequency has single-peak characteristics with the peak appearing primarily in the afternoon and evening (1500–2000).
SDHR is highly prevalent in the area of the eastern slopes and foothills of the northwestern mountains (39.8°–40.8° N, 116.0°–117.5° E). It can be seen that SDHR in this area is similar to the western and northern foothills of Beijing (Figure 5a,b). The SDHR frequency has bimodal diurnal variation with peaks that occur from the afternoon to the evening (1400–1800) and during the night (2000–0400). Additionally, the SDHR in the western and northern foothills of Beijing at night has obvious characteristics of eastward propagation and development (Figure 5a). It shows that the SDHR in this period is mainly triggered by the weather system, persists for longer than the SDHR in the afternoon–evening, and moves eastward as the weather system moves eastward. The area of the southern foothills of the Yanshan Mountain in northeastern Hebei (39.8°–40.8° N, 117.5°–119.5° E) has high SDHR frequency, which has bimodal diurnal variation with peaks appearing at 1400–1900 (afternoon to evening) and 0000–0400 (midnight to early morning) (Figure 5c).
Similar to Figure 5, Hovmöller diagrams of the latitudinal averages (Figure 6a,b) and longitudinal averages (Figure 6c,d) for the southern zone (solid rectangle F–E–C–D, Figure 1) are analyzed. The SDHR frequency on the steep slopes of the eastern Taihang Mountains (37.0°–39.2° N, 113.5°–114.5° E) is very high from the afternoon to the evening (1400–0100) with a single-peaked diurnal variation. The steeper the terrain, the greater the lifting of the low-level warm and humid air in the southeast, which is more conducive to initiation of SDHR. The SDHR frequency in the eastern foothills of the Taihang Mountains (37.0°–39.2° N, 114.5°–116.0° E) is high. It has bimodal diurnal variation with the first peak appearing at 2200–0500 (midnight to early morning) with eastward tendency and the second peak appearing at 1500–2100 (evening to first half of the night).
Affected by the interlaced land–sea underlying surface, the SDHR frequency is high in areas inland (37.0°–38.7° N, 116.7°–118.0° E) of the west coast of Bohai Bay. The diurnal variation has multiple peaks that occur frequently from the afternoon and evening to the first half of the night periods. This SDHR frequency distribution with multiple peaks might be caused by differences in the time of occurrence of peaks at different latitudes. From the Hovmöller diagram of the longitudinal averages in the southern zone (Figure 6c,d), the peak SDHR frequency in areas inland of the west coast of Bohai Bay (37.0°–38.7° N, 116.7°–118.0° E) appears from the evening to the first half of the night (1500–0000) with slight northward movement. The SDHR frequency in the north of the southern zone (38.8°–39.2° N, 113.5°–118.8° E) has a bimodal diurnal variation distribution with a slightly higher value in the afternoon and early morning.

3.2.3. SDHR Frequencies for Each Month in Summer

Diurnal Variation of Cumulative SDHR Times of Multiple Stations for Each Month

To study the characteristics of the diurnal variation of each month in summer, the cumulative SDHR times of multiple stations are calculated for each month, that is, every observation station appears in SDHR, and it will be accumulated one time. The diurnal variation of cumulative SDHR times of multiple stations in summer has approximately bimodal distribution across the entire BTH region (Figure 7b). The first peak occurs in the local afternoon to evening (1500–2100), the second peak occurs in the second half of the night (0300–0400), and the lowest frequency occurs during the morning (0900–1300). The diurnal variation of cumulative SDHR times of multiple stations in the BTH region in each month of summer (June, July, and August) has marked differences (Figure 7a). The SDHR frequency is highest in July, followed by August and then June. The diurnal variation in July has a double-peaked characteristic. The first peak occurs in the local afternoon (1500–1700), and the maximum peak is much greater than that in either August or June with a value of 131 times.h−1.a−1; the second peak occurs in the second half of the night (0300–0400). The diurnal variation in August also has double-peaked characteristics. The first peak occurs in the local early morning (0300–0500), and the maximum peak value is 91 times.h−1.a−1; the second peak occurs in the afternoon (15:00–16:00). The cumulative SDHR times of multiple stations in June is lower than that in either August or July, and the diurnal variation in June has a single peak that occurs in the evening (1800–2000).

Monthly Spatial Variation of SDHR Frequency

Comparison of the hourly SDHR frequency during June, July, and August in the BTH region indicates that the SDHR frequency is much higher in July and August than in June (Figure 8). The distribution of SDHR is affected considerably by the summer monsoon advancing northward and retreating southward, with the interaction of monsoon and topography, and there is marked discrepancy in the spatial distribution of SDHR between each month. In July, the summer monsoon advances from south to north, and the SDHR frequency is high in the foothills of the southern Yanshan Mountains and piedmont area in northeastern Hebei, the foothills and piedmont areas (including urban areas) in western and northern Beijing, the eastern slopes and foothills of the Taihang Mountains (Figure 8b), and in central and western parts of Tianjin (the central peak is located near the Tianjin urban area). In late August, the summer monsoon begins to retreat from north to south, combined with the topography, and the SDHR frequency is highest over the west coast of Bohai Bay and surrounding inland areas, followed by the southern foothills of the Yanshan Mountains in northeastern Hebei and the entrance of the trumpet-shaped topographic area in northern Beijing (Figure 8c). As the advance of the summer monsoon occurs after June, the SDHR frequency in June is very low (Figure 8a). Owing to the influence of afternoon–evening convection, SDHR in June occurs in the mountainous and piedmont areas of northeastern Hebei and in the urban areas of Beijing.

Diurnal Variation of SDHR Frequency in Each Month

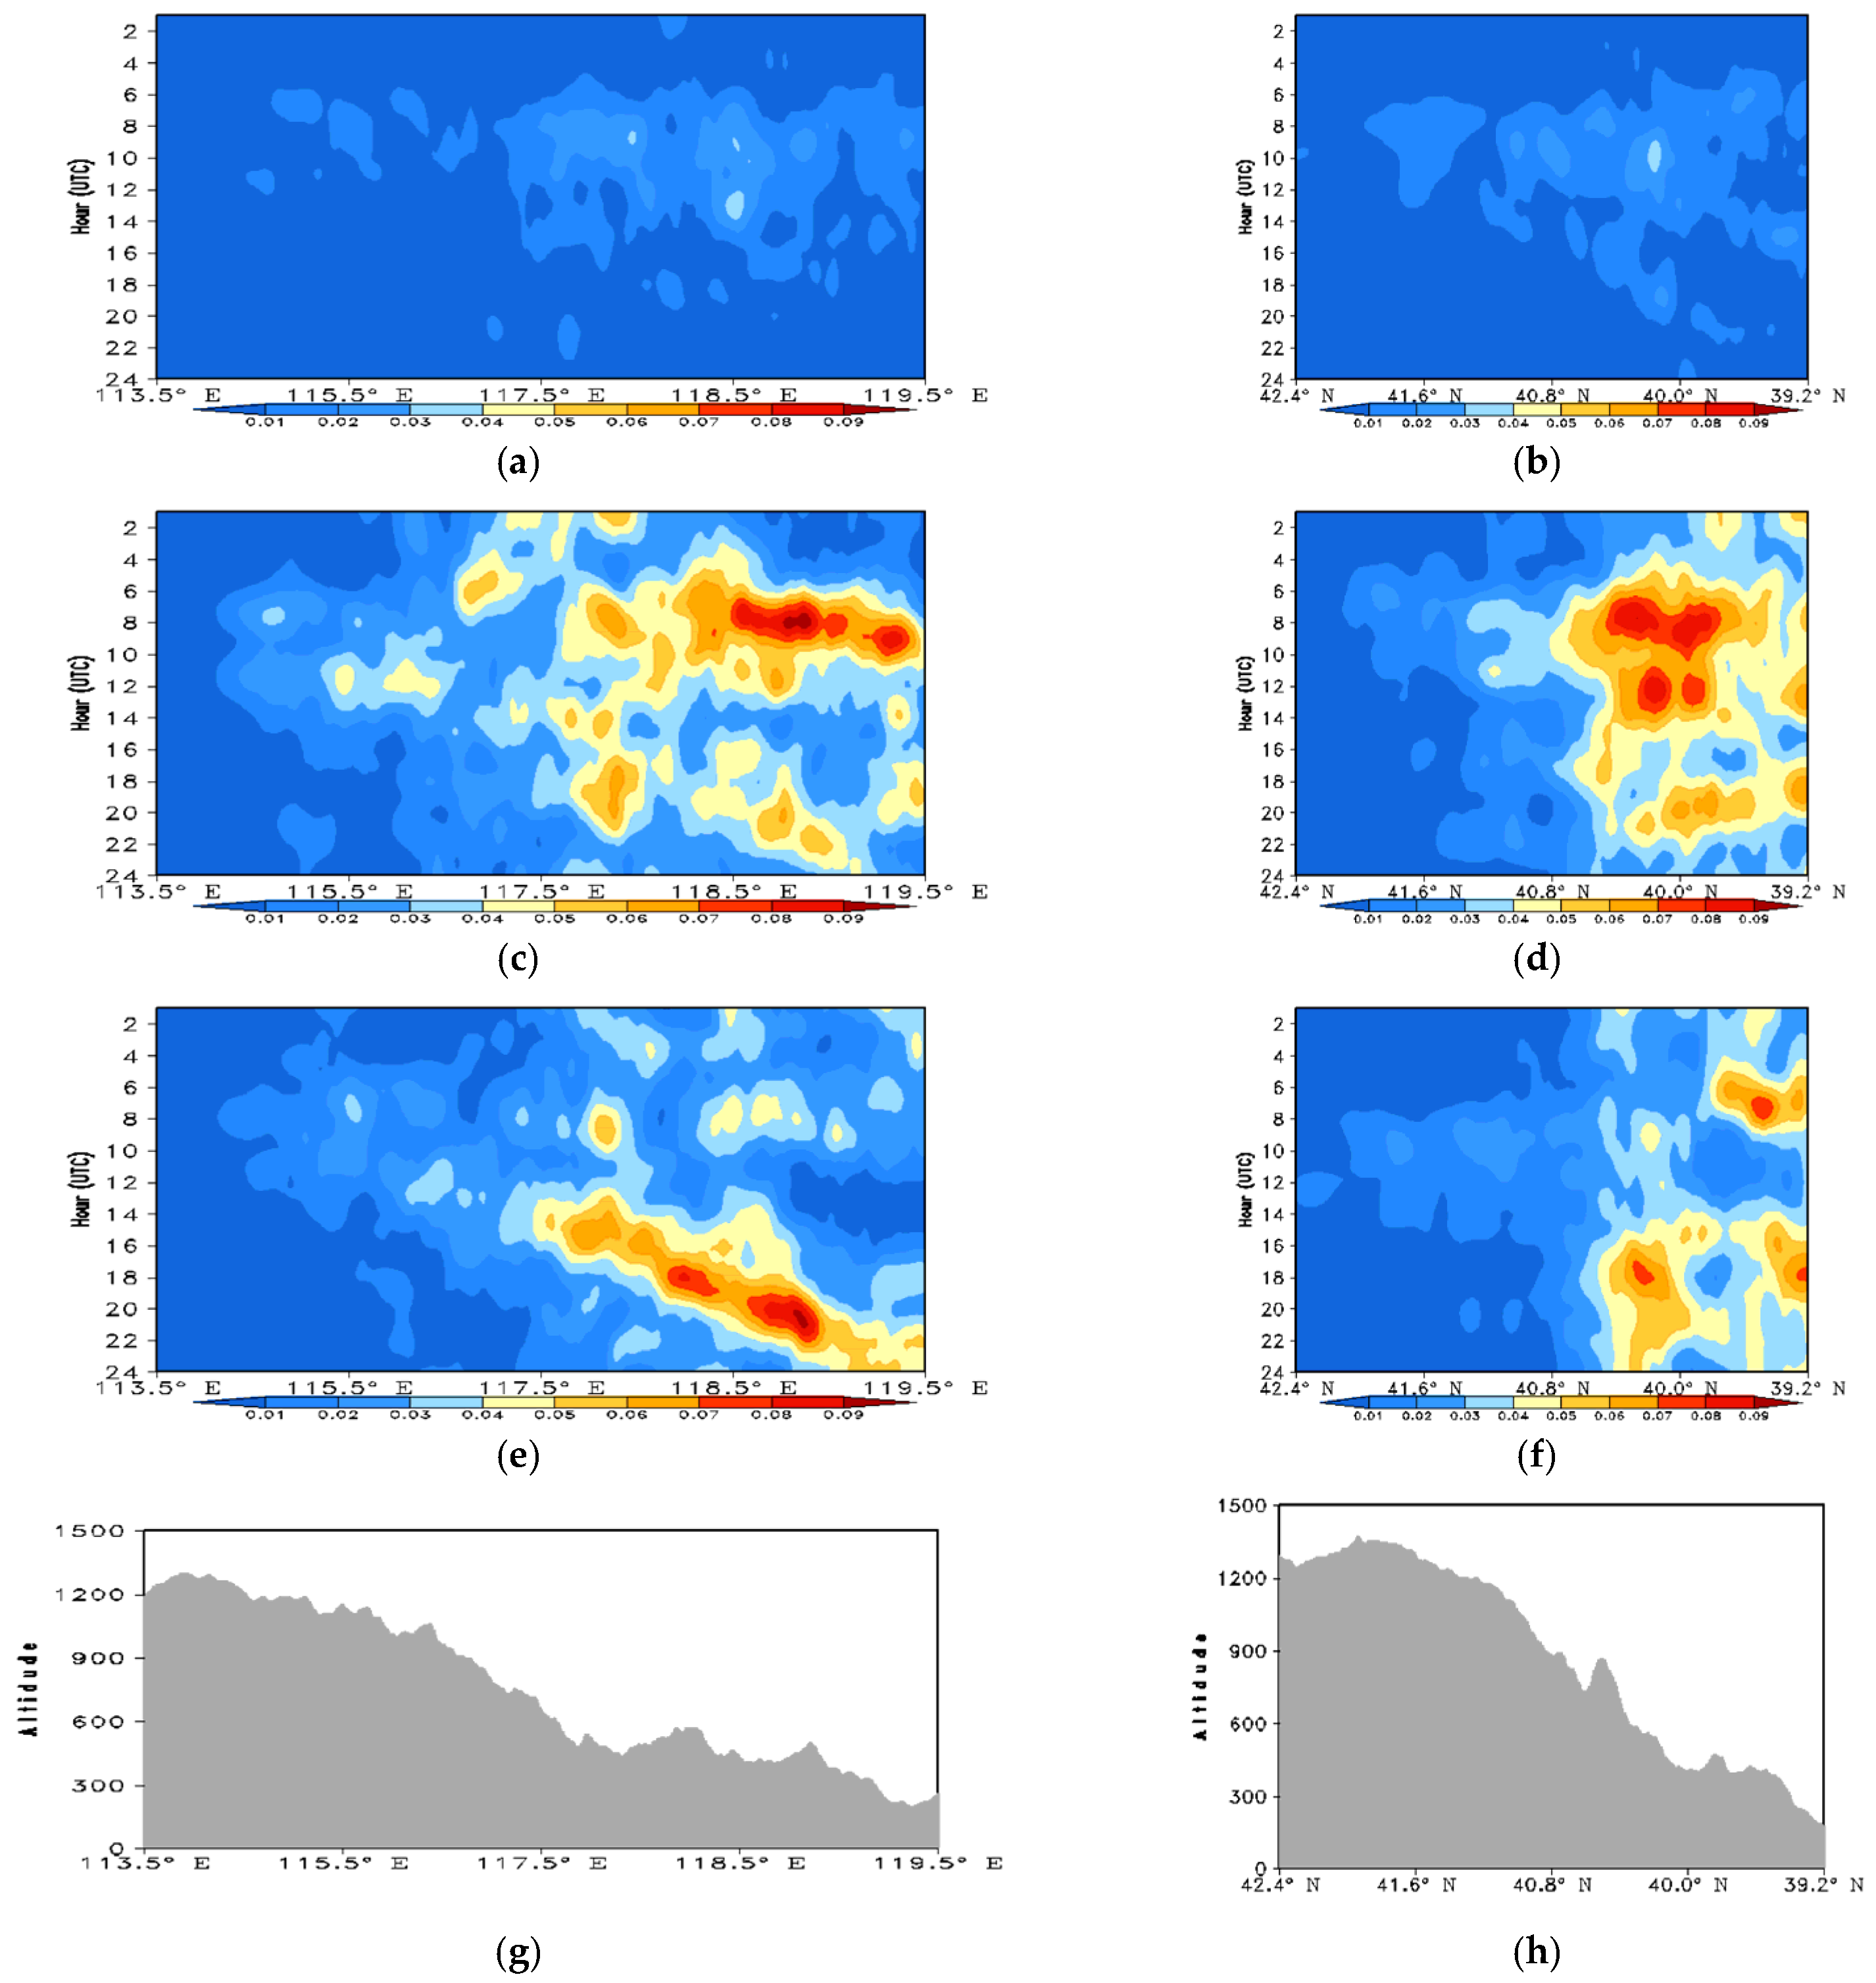
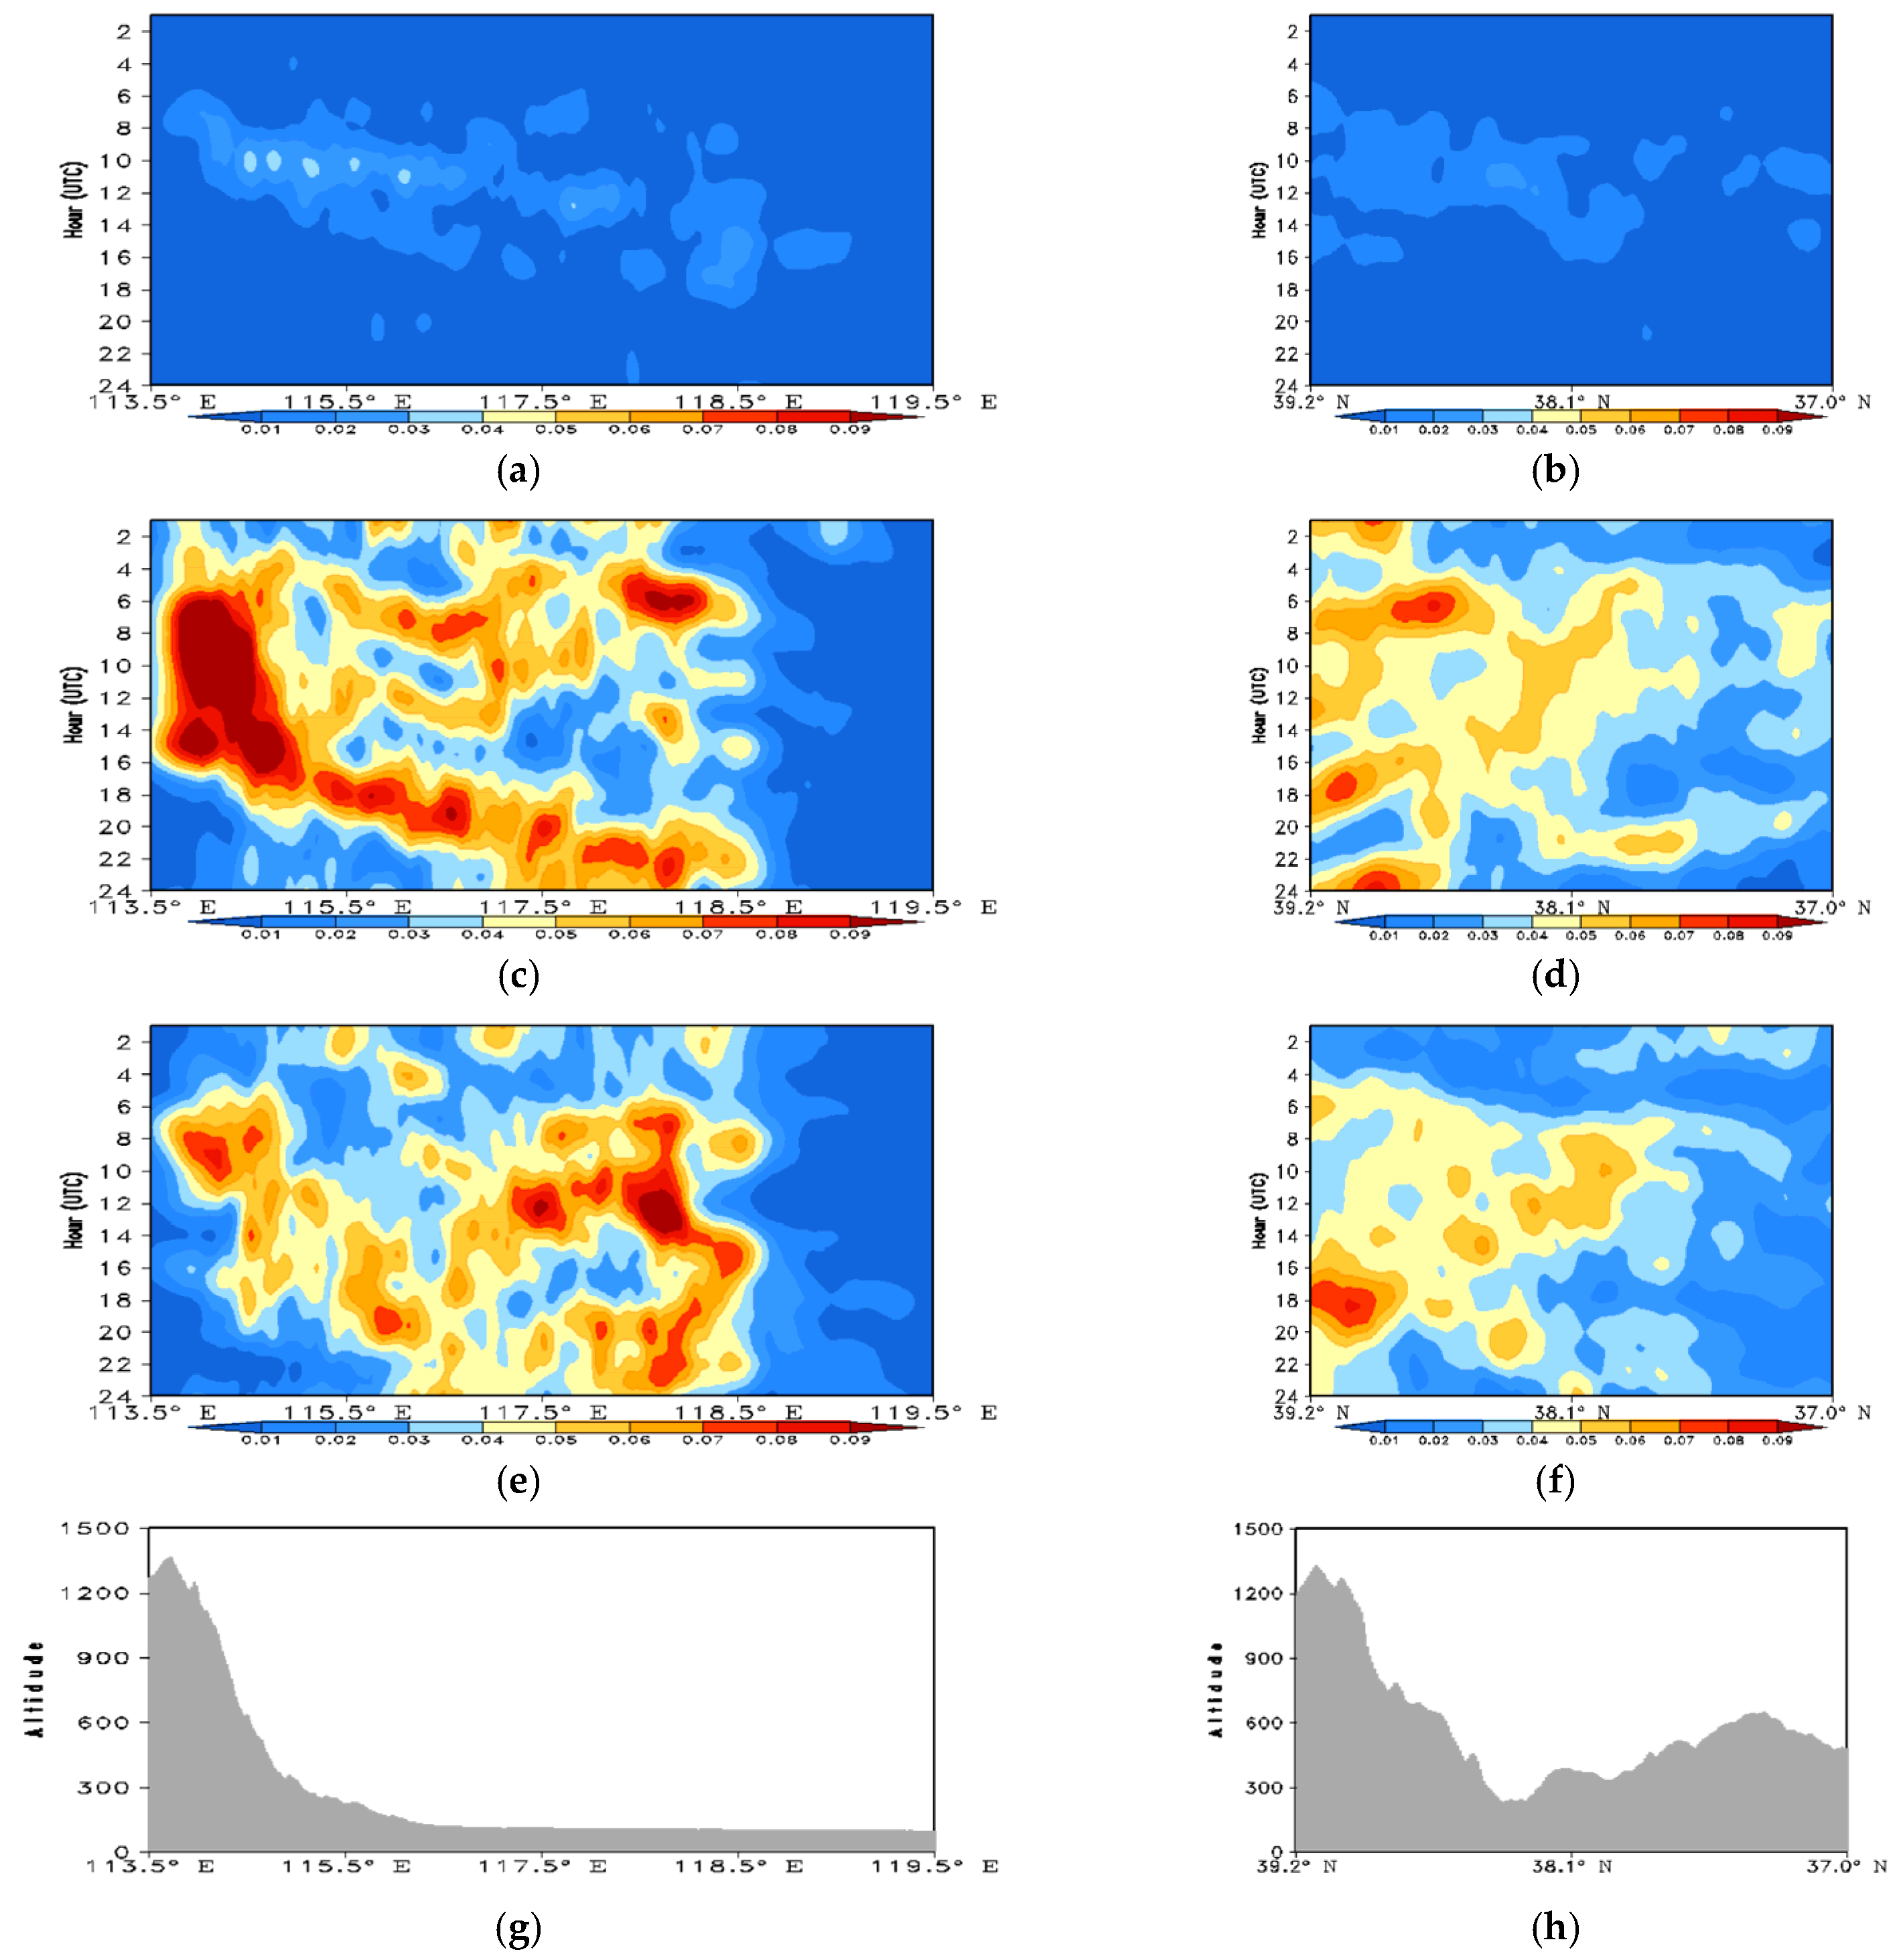
Hovmöller diagrams of the latitudinal and longitudinal averages of SDHR frequency in June, July, and August are shown in Figure 9 and Figure 10. It can be seen that the SDHR frequency in the northern zone of the BTH region (39.2°–42.5° N, 113.5°–119.5° E) is high in both July and August but very low in June. In July, the SDHR frequency in the southern foothills of the Yanshan Mountains in northeastern Hebei (39.8°–40.6° N, 117.5°–119.5° E) is high. The diurnal variation exhibits a single peak that occurs in the afternoon–evening period.
Different from July, the SDHR frequency in the western and northern foothills of Beijing and in the southern foothills of the Yanshan Mountains in northeastern Hebei (30.0°–40.6° N, 116.5°–119.5° E) is relatively high in August during the period from midnight to early morning, and it has eastward propagation with weakening after moving eastward of 118.5° E. In June, the SDHR frequency in the mountainous area and on the plains is low, occurring only from afternoon to evening.
The SDHR frequency in the southern zone of the BTH region (37.0°–39.2° N, 113.5°–119.5° E) is high in both July and August. In July, the SDHR frequency on the eastern slopes of the Taihang Mountains (37.0°–39.2° N, 113.5°–114.5° E) is high (Figure 10e,f). The diurnal variation exhibits a single peak that occurs in the afternoon to early morning period (06:00–17:00) and has eastward propagation. In the eastern foothills of the Taihang Mountains (37.0°–39.2° N, 114.5°–116.0° E), the diurnal variation of SDHR frequency has multiple peaks; the first peak is in the early morning, and the two subsequent peaks occur in the afternoon and evening.
The diurnal variation of SDHR in areas inland of the west coast of Bohai Bay (37.5°–38.8° N, 116.7°–118.0° E) has an approximate dual-peaked distribution with peaks occurring from the afternoon to the first half of the night (1400–0000) and in the early morning (0500–0600) (Figure 10g,h). Different from July, the SDHR frequency in the areas inland of the west coast of Bohai Bay (37.5°–38.8° N, 116.7°–118.0° E) is high in August, and the diurnal variation has an approximate dual-peaked distribution with peaks occurring from the afternoon to the first half of the night (1500–2300) and in the early morning (0400–0600). The SDHR frequency on the eastern slopes of the Taihang Mountainous (37.0°–39.2° N, 113.5°–114.5° E) is high. The diurnal variation exhibits a single peak that occurs from the afternoon to the first half of the night, and it is relatively low in the foothills of the Taihang Mountains. In June, the SDHR frequency is low. It has unimodal diurnal variation in the region of the eastern slopes and piedmont areas of the Taihang Mountains in southwestern Hebei from the afternoon to the evening (1500–2000), but SDHR occurs rarely in other areas.

4. Summary and Discussion

In this study, the significant influence of the complex underlying surface on the temporal and spatial characteristics of SDHR and the diurnal variation is revealed by using fine-scale hourly precipitation data in BTH during the summers of 2014–2020 (the quality-controlled 1878 AWS observations), whose temporal and spatial observation resolution is much higher to capture rainfall (convection). The results are as follows.
(1)
The spatial distribution of SDHR frequency in the BTH region has marked spatial discrepancy. The formation of SDHR in the BTH region in summer is affected substantially by the topography, interlaced land–sea underlying surface, and large cities. Areas prone to SDHR are located mainly in the southern foothills of the Yanshan Mountains in northeastern Hebei, the foothills of Beijing (southern foothills of the northern mountains, entrance of the trumpet-shaped topographic area, and southeastern foothills of the western mountain) and the area downwind of the Beijing urban area, areas inland of the west coast of Bohai Bay, and eastern slopes and southern foothills of the Taihang Mountains in western Hebei. In central and eastern parts of Hebei, Tianjin, and the southern foothills of the Yanshan Mountains in northeastern Hebei, the contribution rate of SDHR precipitation is considerable and can exceed 50%.
(2)
The diurnal variation of SDHR frequency in the BTH region in summer generally has dual-peaked characteristics with peak frequencies occurring in the evening (1500–1800) and first half of the night (0000–0100), and the lowest frequency occurring in the morning (0900–1300).
(3)
Affected by topography and the geographical location, SDHR frequency is low in the northwest and northeast mountainous areas of the BTH region; its diurnal variation has a single peak that occurs during 1500–2100 (afternoon/evening). The diurnal variation of SDHR frequency in the piedmont and plain areas is bimodal, with peaks appearing at 2200–0500 (evening/first half of the night) and 0900–1600 (second half of the night/early morning). In July, the SDHR frequency on the steep eastern slopes of the Taihang Mountains is high (much higher than on the gentle slopes) with a single peak of the diurnal variation occurring from afternoon to second half of the night (1300–0100). The SDHR that occurs at night has the characteristics of spreading eastward. In August, the SDHR frequency in the western and northern foothills of Beijing was high, with peaks in the bimodal diurnal variation appearing from afternoon to evening (1400–1900) and from midnight to early morning (2200–0400). The SDHR that occurs at night has obvious characteristics of eastward propagation.
(4)
In July and August, SDHR occurs frequently in the areas inland of the west coast of Bohai Bay. The diurnal variation of the SDHR frequency was approximately bimodal; the main peak occurs at 1400–0000 (afternoon/first half of the night), while the second peak appears at 0500–0600 (early morning). The SDHR that occurs in the afternoon shows a tendency for northward propagation.
In summary, in favorable weather conditions, topography, the interlaced land–sea underlying surface, and large urban areas all have substantial effect on the spatiotemporal distribution of SDHR in the BTH region in summer. The foothills in northern and western Beijing, eastern slopes and foothills of the Taihang Mountains, and the interlaced land–sea area of Bohai Bay all play an important role in the formation and propagation of regional SDHR. The formation of SDHR is not only the effect of the synoptic system but also the effect of local meteorological conditions such as valley winds and sea-land winds caused by complex geographic environments. The high-density AWS data can be further used to carry out the investigation of the influence of multiple factors such as temperature, wind field, pressure, and other meteorological elements and local meteorological conditions on SDHR and further reveal the causes and characteristics of SDHR.

Author Contributions

Conceptualization, Q.L.; Data curation, C.C.; Software, Y.W.; Visualization, Y.D.; Writing—original draft, Q.L.; Writing—review & editing, C.C. All authors have read and agreed to the published version of the manuscript.

Funding

This research was funded by the National Key Research and Development Program of China (Grant No. 2018YFC1506801).

Institutional Review Board Statement

Not applicable.

Informed Consent Statement

Not applicable.

Data Availability Statement

Not applicable.

Acknowledgments

This work is mainly supported by the National Key Research and Development Program of China (Grant No. 2018YFC1506801 and Grant No. 2017YFC1502104). It is partly supported by Beijing National Science Foundation of China (Grant No. 8171002, Grant No. 8192016, and Grant No.8202021).

Conflicts of Interest

The authors declare no conflict of interest.

References

  1. Davis, R.S. Flash flood forecast and detection methods, severe convective storms. In Meteorological Monographs; American Meteorological Society: Boston, MA, USA, 2001; Volume 28, pp. 481–525. [Google Scholar] [CrossRef]
  2. Brooks, H.E.; Stensrud, D.J. Climatology of heavy rain events in the United States from hourly precipitation observation. Mon. Weather. Rev. 2000, 128, 1194–1201. [Google Scholar] [CrossRef] [Green Version]
  3. Zhang, H.; Zhai, P. Temporal and spatial characteristics of extreme hourly precipitation over Eastern China in the warm season. Adv. Atmos. Sci. 2011, 28, 1177–1183. [Google Scholar] [CrossRef]
  4. Li, H.; Cui, X.; Zhang, D.L. A statistical analysis of hourly heavy rainfall events over the Beijing metropolitan region during the warm seasons of 2007–2014. Int. J. Climatol. 2017, 37, 4027–4042. [Google Scholar] [CrossRef]
  5. Zhang, J.C.; Lin, Z.G. Climate of China, 1985. Shanghai; Shanghai Science and Technology Press: Shanghai, China, 1985; pp. 411–436. [Google Scholar]
  6. Shen, L.L.; He, J.H.; Zhou, X.J.; Chen, L.X.; Zhu, C.W. The regional variabilities of the summer rainfall in China and its relation with anomalous moisture transport during the recent 50 years. Acta Meteorol. Sin. 2010, 68, 918–931. (In Chinese) [Google Scholar]
  7. Huang, Y.; Feng, G.L.; Dong, W.J. Temporal changed in the patterns extreme air temperature and precipitation in the various regions of China in recent 50 years. Acta Meteorol. Sin. 2011, 69, 125–136. (In Chinese) [Google Scholar]
  8. Yu, R.C.; Zhou, T.J.; Xiong, A.Y.; Zhu, Y.J.; Li, J.M. Diurnal variation of summer precipitation over contiguous China. Geophys. Res. Lett. 2007, 34, L01704. [Google Scholar] [CrossRef] [Green Version]
  9. Yu, R.C.; Xu, Y.P.; Zhou, T.J.; Li, J. Relation between rainfall duration and diurnal variation in the warm season precipitation over central eastern China. Geophys. Res. Lett. 2007, 34, L13703. [Google Scholar] [CrossRef] [Green Version]
  10. Yao, L.; Li, X.Q.; Zhang, L.M. Spatial-Temporal Distribution Characteristics of Hourly Rain Intensity in China. Meteorol. Mon. 2009, 35, 80–87. (In Chinese) [Google Scholar]
  11. Chen, J.; Zheng, Y.G.; Zhang, X.L.; Zhu, P.J. Analysis of climatological distribution and diurnal variations of the short-duration heavy rain and its relation with diurnal variations of the MCSs over china during the warm season. Acta Meteorol. Sin. 2013, 71, 367–382. (In Chinese) [Google Scholar]
  12. Chen, C.S.; Chen, Y.L.; Liu, C.L.; Lin, P.L.; Chen, W.C. Statistics of Heavy Rainfall Occurrences in Taiwan. Weather. Forecast. 2007, 22, 981–1002. [Google Scholar] [CrossRef]
  13. Shen, L.L.; Zhang, Y.X.; Long, L.X.; Sun, Y.; Kang, Z.M. Characteristics of extreme precipitation in Beijing-Tianjin-Hebei region from 1981 to 2016. Torrential Rain Disasters 2018, 37, 428–434. (In Chinese) [Google Scholar]
  14. Chen, M.X.; Wang, Y.C.; Gao, F.; Xiao, X. Diurnal variations in convective storm activity over contiguous North China during the warm season based on radar mosaic climatology. J. Geophys. Res. Atmos. 2012, 117, D20115. [Google Scholar] [CrossRef] [Green Version]
  15. Yin, S.Q.; Li, W.J.; Chen, D.L.; Jeong, J.H.; Guo, W.L. Diurnal Variations of Summer Precipitation in the Beijing Area and the Possible Effect of Topography and Urbanization. Adv. Atmos. Sci. 2011, 28, 725–734. [Google Scholar] [CrossRef]
  16. Yuan, Y.F.; Zhai, P.M.; Chen, Y.; Li, J. Hourly extreme precipitation changes under the influences of regional and urbanization effects in Beijing. Int. J. Climatol. 2021, 41, 1179–1189. [Google Scholar] [CrossRef]
  17. Li, J.; Yu, R.; Wang, J. Diurnal variation of summer precipitation in Beijing China. Sci. Bull. 2008, 7, 829–832. (In Chinese) [Google Scholar]
  18. Yang, P.; Ren, G.Y.; Hou, W.; Liu, W.D. Spatial and diurnal characteristics of summer rainfall over Beijing Municipality based on a high-density AWS dataset. Int. J. Climatol. 2013, 33, 2769–2780. [Google Scholar] [CrossRef]
  19. Zheng, Z.; Qi, W.; Li, Q.; Li, L. Statistical characteristics of precipitation in summer in Beijing area during 2007–2011. Clim. Environ. Res. 2015, 20, 201–208. (In Chinese) [Google Scholar]
  20. Yang, P.; Ren, G.Y.; Yan, P.C. Evidence for a Strong Association of Short-Duration Intense Rainfall with Urbanization in the Beijing Urban Area. Int. J. Climatol. 2013, 30, 5851–5870. [Google Scholar] [CrossRef]
  21. Wang, G.R.; Wang, L. Temporal and spatial distribution of short-time heavy rain of Beijing in summer. Torrential Rain Disasters 2013, 32, 276–279. (In Chinese) [Google Scholar]
  22. Haiden, T.; Kann, A.; Wittmann, C.; Pistotnik, G.; Bica, B.; Gruber, C. The Integrated Nowcasting through Comprehensive Analysis (INCA) system and its validation over the eastern Alpine region. Weather. Forecast. 2011, 26, 166–183. [Google Scholar] [CrossRef]
  23. Carbone, R.E.; Tuttle, J.D.; Ahijevich, D.A.; Trier, S.B. Inferences of predictability associated with warm season precipitation episodes. J. Atmos. Sci. 2002, 59, 2033–2056. [Google Scholar] [CrossRef] [Green Version]
  24. Carbone, R.E.; Tuttle, J.D. Rainfall occurrence in the U.S. Warm season: The diurnal cycle. Int. J. Climatol. 2008, 21, 4132–4146. [Google Scholar] [CrossRef]
  25. Lin, P.F.; Chang, P.L.; Jou, J.D.; Wilson, J.W.; Roberts, R.D. Warm season afternoon thunderstorm characteristics under weak synoptic-scale forcing over Taiwan island. Weather. Forecast. 2011, 26, 44–60. [Google Scholar] [CrossRef] [Green Version]
  26. Guo, J.; Xiong, M.M.; Huang, H. Analysis of diurnal variation characteristics of rainfall during warm season in Beijing-Tianjin-Hebei region. J. Mar. Meteorol. 2019, 39, 58–67. [Google Scholar] [CrossRef]
  27. Gu, T.M. Climate of North China, Beijing; Meteorological Press: Beijing, China, 1991; pp. 44–45. [Google Scholar]
  28. Jiao, M.Y.; Bi, B.G. Mesoscale Structure Analysis of Topography induced Heavy Rainfall in Beijing in summer. Meteorol. Mon. 2008, 31, 9–13. (in Chinese). [Google Scholar]
  29. Zhang, Y. The effect of topography on precipitation. Meteorol. Mon. 1983, 2, 9–13. (In Chinese) [Google Scholar]
  30. Chen, B.; Yu, H.G. The weather and climate characteristics of the sea land breeze in the west of Bohai Bay. Mar. Sci. Bull. 1989, 8, 23–29. [Google Scholar]
  31. Huff, F.A.; Vogel, J.L. Urban, topographic and diurnal effects on rainfall in the St. Louis region. J. Appl. Meteorol. 1978, 17, 565–577. [Google Scholar] [CrossRef] [Green Version]
  32. Sanderson, M.; Gorski, R. The effect of metropolitan Detroit-Windsor on precipitation. J. Appl. Meteorol. 1978, 17, 423–427. [Google Scholar] [CrossRef] [Green Version]
  33. Changnon, S.A. Rainfall changes in summer caused by St. Louis. Science 1979, 205, 402–404. [Google Scholar] [CrossRef]
  34. Changnon, S.A.; Semonin, R.G.; Auer, A.H.; Braham, R.R.; Hales, J. METROMEX: A Review and Summary 1981; American Meteorological Society: Boston, MA, USA, 1981; pp. 40–81. [Google Scholar]
  35. Changnon, S.A.; Shealy, R.T.; Scott, R.W. Precipitation changes in fall, winter, and spring caused by St. Louis. J. Appl. Meteorol. 1991, 30, 126–134. [Google Scholar] [CrossRef] [Green Version]
  36. Changnon, S.A. Inadvertent weather modification in urban areas: Lessons for global climate change. Bull. Am. Meteorol. Soc. 1992, 73, 619–627. [Google Scholar] [CrossRef]
  37. Braham, R.R.; Semonin, R.G.; Auer, A.H.; Changnon, S.A.; Hales, J.M. METROMEX: Summary of urban effects on clouds and rain. Bull. Am. Meteorol. Soc. 1981, 40, 141–152. [Google Scholar]
  38. Diem, J.E.; Brown, D.P. Anthropogenic impacts on summer precipitation in central Arizona. Prof. Geogr. 2003, 55, 343–355. [Google Scholar]
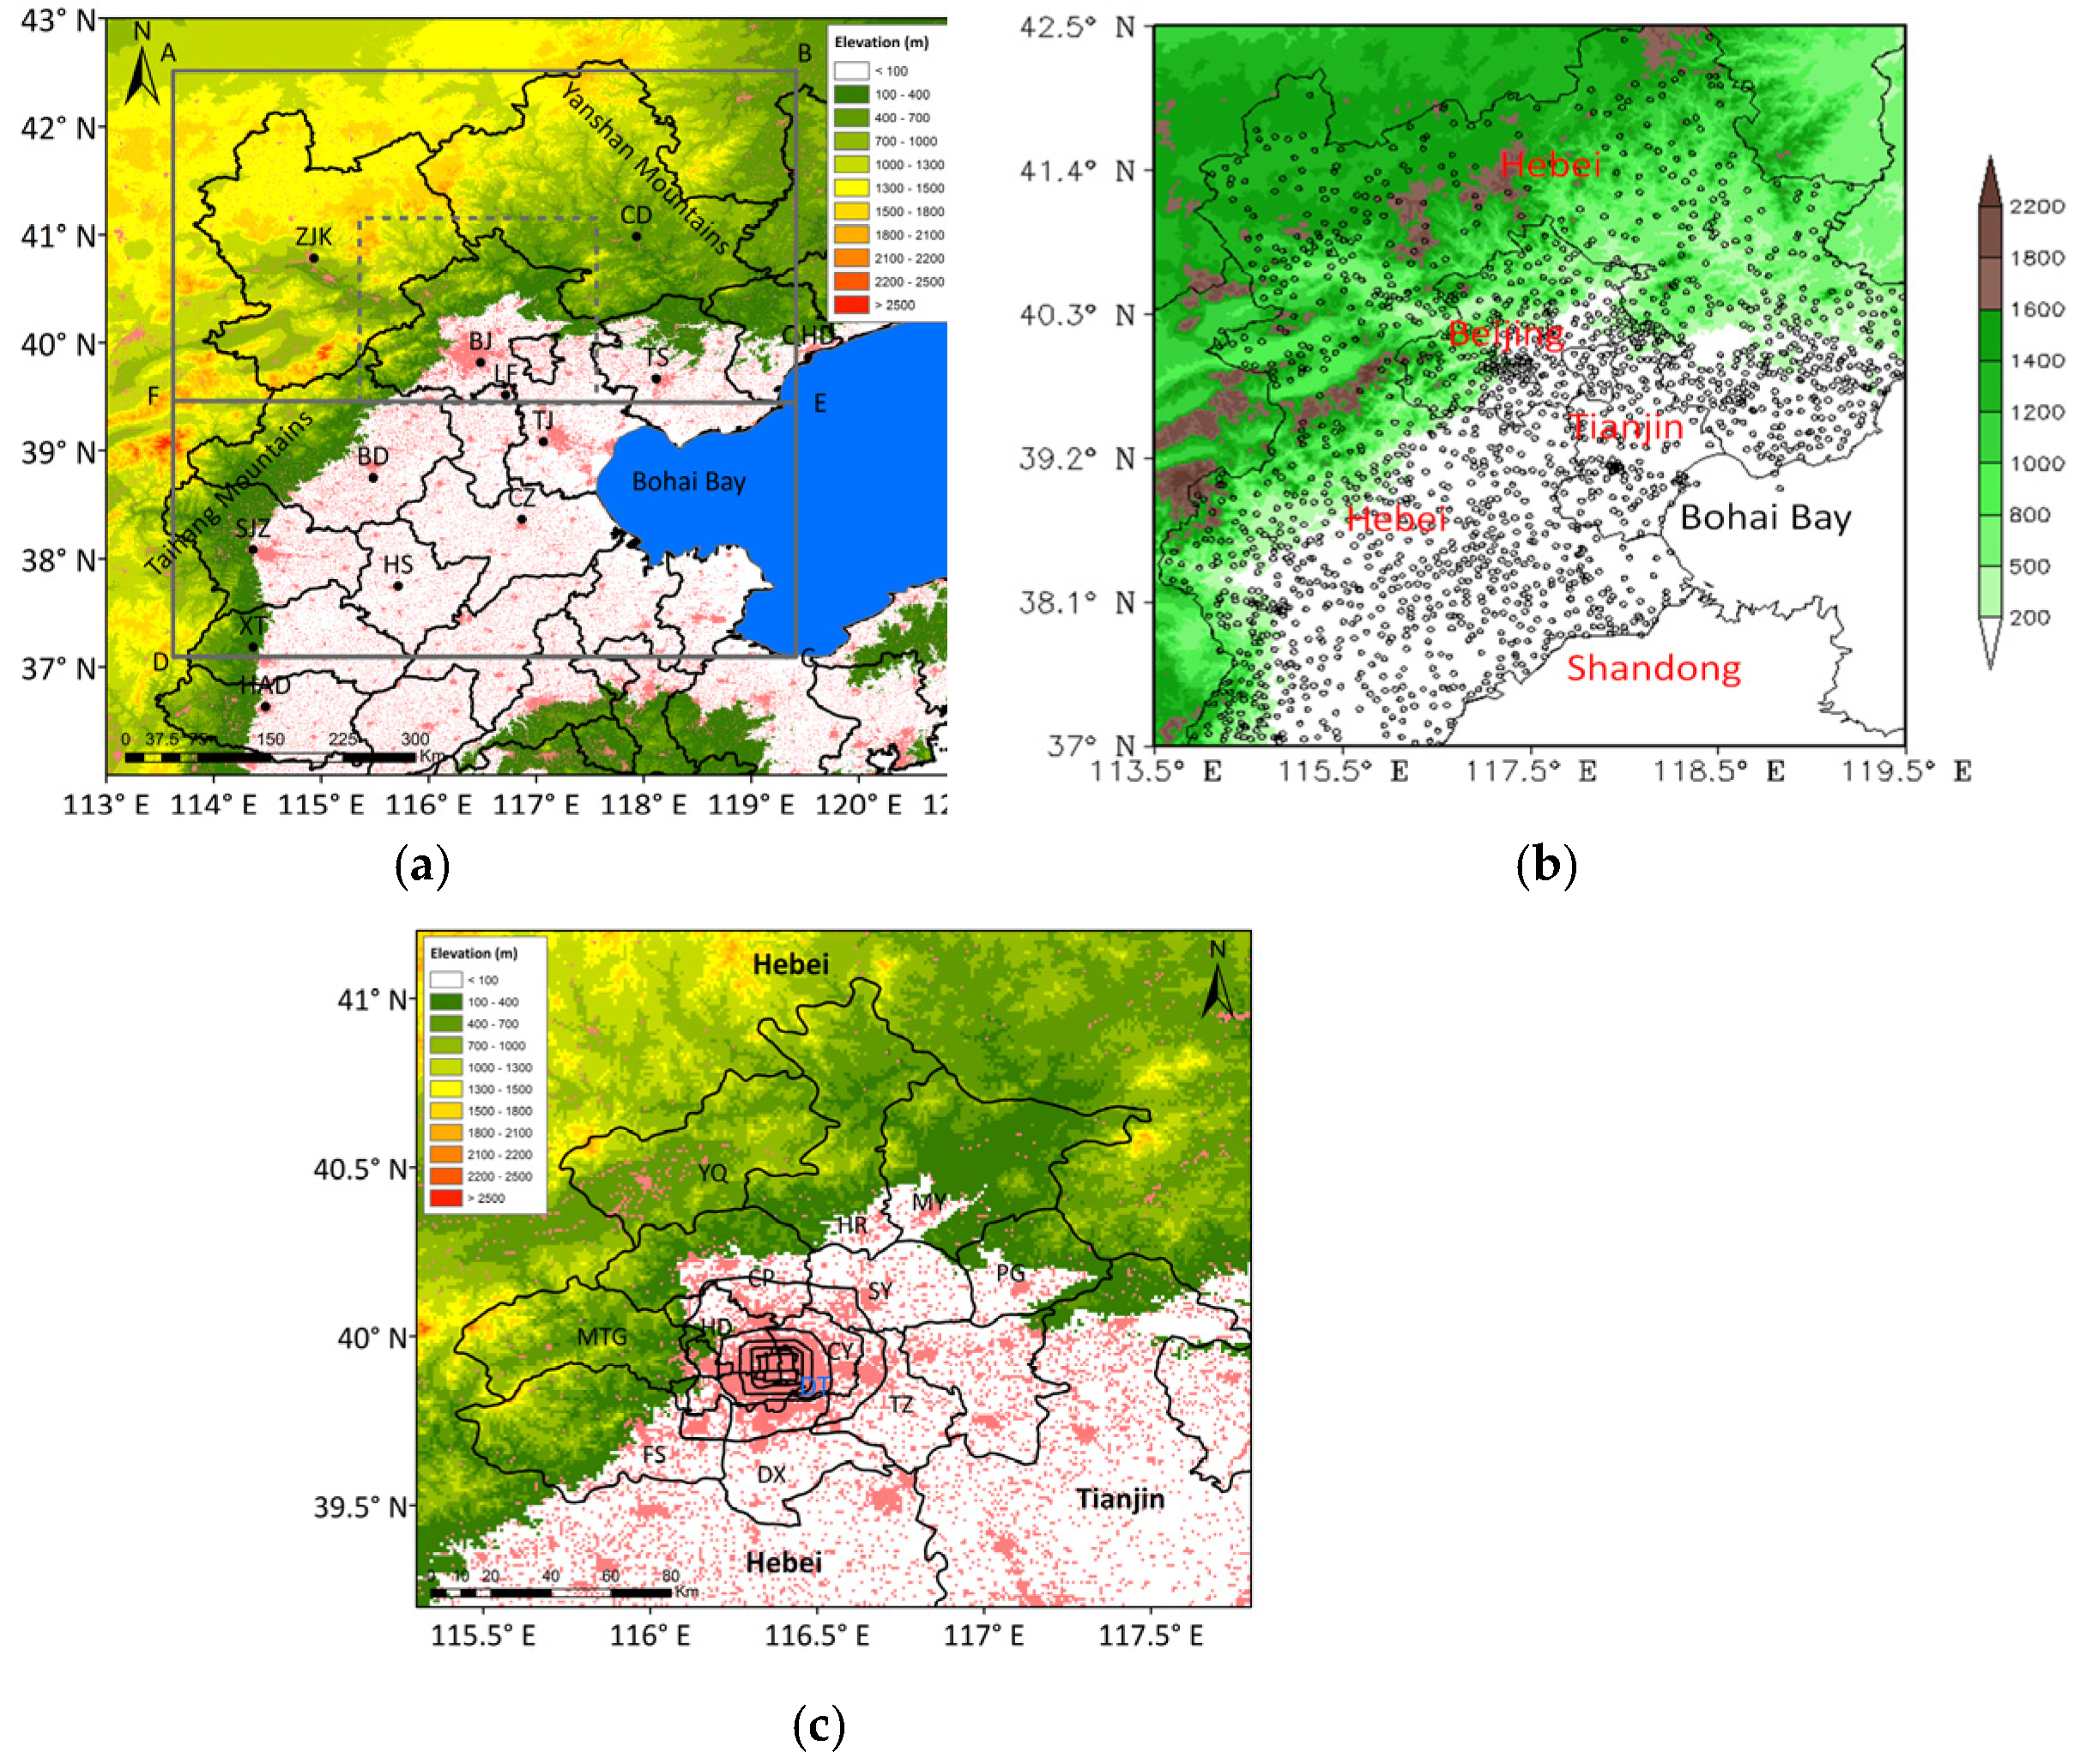
Figure 1. Topography of the BTH region, prefecture-level city names, and district names in the Beijing area. (a) Terrain elevation (m) of the study area in North China. Here, the study area is denoted by the solid-line rectangle A–B–C–D. The solid-line rectangle A–B–E–F represents the northern zone. We denote the solid rectangle F–E–C–D as the southern zone. The brown-red dots represent the building area. Names of prefecture-level cities are the following: BJ (Beijing), TJ (Tianjin), SJZ (Shijiazhuang), ZJK (Zhangjiakou), BD (Baoding), XT (Xingtai), HD (Handan), HS (Hengshui), CZ (Cangzhou), LF (Langfang), TS (Tangshan), QHD (Qinhuangdao), and CD (Chengde). (b) Topography and distribution of observation stations in the study area. The black circles represent AWS sites. The color scale is elevation (m). (c) Beijing area (shown by the dashed rectangle in (a)). The color scale is the elevation (m). The brown-red dots represent the building area. The ring lines indicate the Second–Sixth Ring Roads, and the Third Ring Road defines the main urban area (DT; Downtown). Names of districts are the following: SY (Shunyi), CP (Changping), HD (Haidian), SJS (Shijingshan), FT (Fengtai), DX (Daxing), TZ (Tongzhou), CY (Chaoyang), PG (Pinggu), MY (Miyun), HR (Huairou), YQ (Yanqing), MTG (Mentougou), and FS (Fangshan).
Atmosphere 12 01263 g001
Figure 2. Distribution of average annual precipitation, SDHR annual average frequency, SDHR precipitation, and SDHR precipitation contribution rate in the BTH region in the summers of 2014–2020. (a) Average annual precipitation (unit: mm), (b) SDHR annual average frequency (unit: times), (c) SDHR precipitation (mm), and (d) SDHR precipitation contribution rate (unit: %). (ad) Colored shading represents terrain elevation (unit: m). Plus symbols represent the locations of the Beijing, Tianjin, Baoding, and Shijiazhuang urban centers.
Atmosphere 12 01263 g002aAtmosphere 12 01263 g002b
Figure 3. Same as Figure 2 but for Beijing. (a) Average annual precipitation (unit: mm), (b) SDHR annual average frequency (unit: times), (c) SDHR precipitation (mm), and (d) SDHR precipitation contribution rate (unit: %). (ad) Colored shading represents terrain elevation (unit: m). Location of the center of the Beijing urban area is denoted by a plus symbol.
Atmosphere 12 01263 g003
Figure 4. Distribution of SDHR frequency in the BTH region in six periods of days in summer (unit: times a−1). (a) 0900–1200, (b) 1300–1600, (c) 1700–2000, (d) 2100–0000, (e) 0100–0400, and (f) 0500–0800.
Atmosphere 12 01263 g004
Figure 5. Hovmöller diagrams of annual averaged SDHR frequency and averaged topographic profiles in the northern zone of the BTH region in summer ((a,c), unit: times h−1 a−1; (b,d), unit: m). (a,b) Latitudinal average (39.2°–42.5° N) and (c,d) longitudinal average (113.5°–119.5° E).
Atmosphere 12 01263 g005
Figure 6. The same as Figure 5 but in the southern zone of the BTH region. (a,b) Latitudinal average (37.0°–39.2° N) and (c,d) longitudinal average (113.5°–119.5° E).
Atmosphere 12 01263 g006
Figure 7. (a) Diurnal variation of SDHR frequency (cumulative stations number) for June (blue line), July (orange line), and August (grey line) in the BTH region and (b) diurnal variation of SDHR frequency (cumulative stations number) for summer in the BTH region (unit: times h−1 a−1).
Atmosphere 12 01263 g007
Figure 8. Distribution of SDHR frequency for each of the summer months (June, July, and August) of 2014–2020 in the BTH region. (a) June, (b) July, and (c) August. Colored shading is the terrain elevation (unit: m), and colored contours show the SDHR frequency (unit: times a−1).
Atmosphere 12 01263 g008
Figure 9. Hovmöller diagrams of averaged frequency of SDHR and averaged topographic profiles in the northern zone of the BTH region. (a,b) June, (c,d) July, and (e,f) August. (a,c,e,g) Latitudinal averages (39.2°–42.5° N) and (b,d,f,h) longitudinal averages (113.5°–119.5° E).
Atmosphere 12 01263 g009
Figure 10. The same as Figure 9 but in the southern zone of the BTH region. (a,c,e,g) Latitudinal averages (37.0°–39.2° N) and (b,d,f,h); longitudinal averages (113.5°–119.5° E).
Atmosphere 12 01263 g010
Publisher’s Note: MDPI stays neutral with regard to jurisdictional claims in published maps and institutional affiliations.