Next Article in Journal
A Study on Synoptic Conditions Leading to the Extreme Rainfall in Taiwan during 10–12 June 2012
Next Article in Special Issue
Probabilistic Forecast of Low Level Wind Shear of Gimpo, Gimhae, Incheon and Jeju International Airports Using Ensemble Model Output Statistics
Previous Article in Journal
Impact of Assimilating Advanced Himawari Imager Channel 16 Data on Precipitation Prediction over the Haihe River Basin
Previous Article in Special Issue
Development and Evaluation of SLINE 1.0, a Line Source Dispersion Model for Gaseous Pollutants by Incorporating Wind Shear Near the Ground under Stable and Unstable Atmospheric Conditions
 
 
Correction published on 29 November 2022, see Atmosphere 2022, 13(12), 2004.
Article

Global Clear-Sky Aerosol Speciated Direct Radiative Effects over 40 Years (1980–2019)

by
Marios-Bruno Korras-Carraca
1,2,
Antonis Gkikas
3,
Christos Matsoukas
2 and
Nikolaos Hatzianastassiou
1,*
1
Laboratory of Meteorology, Department of Physics, University of Ioannina, 45110 Ioannina, Greece
2
Department of Environment, University of the Aegean, 81100 Mytilene, Greece
3
Institute for Astronomy, Astrophysics Space Applications and Remote Sensing, National Observatory of Athens, 15236 Athens, Greece
*
Author to whom correspondence should be addressed.
Atmosphere 2021, 12(10), 1254; https://doi.org/10.3390/atmos12101254
Submission received: 21 August 2021 / Revised: 22 September 2021 / Accepted: 23 September 2021 / Published: 27 September 2021 / Corrected: 29 November 2022

Abstract

:
We assess the 40-year climatological clear-sky global direct radiative effect (DRE) of five main aerosol types using the MERRA-2 reanalysis and a spectral radiative transfer model (FORTH). The study takes advantage of aerosol-speciated, spectrally and vertically resolved optical properties over the period 1980–2019, to accurately determine the aerosol DREs, emphasizing the attribution of the total DREs to each aerosol type. The results show that aerosols radiatively cool the Earth’s surface and heat its atmosphere by 7.56 and 2.35 Wm−2, respectively, overall cooling the planet by 5.21 Wm−2, partly counterbalancing the anthropogenic greenhouse global warming during 1980–2019. These DRE values differ significantly in terms of magnitude, and even sign, among the aerosol types (sulfate and black carbon aerosols cool and heat the planet by 1.88 and 0.19 Wm−2, respectively), the hemispheres (larger NH than SH values), the surface cover type (larger land than ocean values) or the seasons (larger values in local spring and summer), while considerable inter-decadal changes are evident. These DRE differences are even larger by up to an order of magnitude on a regional scale, highlighting the important role of the aerosol direct radiative effect for local and global climate.

1. Introduction

Understanding the current climate and predicting its future state is a major challenge and priority in the field of atmospheric sciences. Changes in climate are linked to perturbations of the radiation budget of the Earth–atmosphere system, caused either by external factors (e.g., astronomical) or by internal ones, namely interactions of radiation with greenhouse gases and aerosols, of both natural and anthropogenic origin [1]. However, there are differences between the radiative impacts of these two main atmospheric constituents, arising from the diversity between the life cycle components of greenhouse gases and aerosols [2]. Opposite to the mostly long-lived and spatially homogeneous greenhouse gases and stratospheric aerosols, the suspended tropospheric particles, emitted either by natural or anthropogenic sources [3], have highly variable spatiotemporal distributions in their physical, chemical, optical and radiative properties [4]. This is attributed to the heterogeneity of the production (primary and secondary emissions), transport and removal (sedimentation, diffusion, turbulence and below- and in-cloud scavenging) mechanisms of tropospheric aerosols. Due to their highly variable nature and the complexity of the associated properties and processes, the scientific understanding of the climatic role of aerosols, although improved during the last two decades [1,5], is systematically lower than that of greenhouse gases. The estimates of global and annual mean radiative forcing due to aerosol–radiation interaction still include considerable uncertainties [6].
Aerosols exert a perturbation of the radiation fluxes at the surface, within the atmosphere and at the top-of-the-atmosphere (TOA) via their interaction with the incoming solar and the outgoing terrestrial radiation. The aerosol-induced effects on the radiation fields within the Earth–Atmosphere system, i.e., the anomalies with respect to a reference state, are denoted as aerosol radiative effects (AREs). AREs are divided into Direct Radiative Effects (DREs), arising from the scattering and absorption of radiation by aerosols, and indirect ones, consisting of the modification of clouds’ microphysical/macrophysical and optical properties [7,8,9,10,11]. Due to the redistribution of energy within the atmosphere and the subsequent modifications to the surface radiative and heat (sensible and latent) fluxes [12], rapid adjustments [13,14] to the DREs take place, formerly defined as semi-direct effects [15,16]. Under such conditions there is an evident alteration of temperature/water vapor profiles and atmospheric stability, thus highlighting the role of aerosols in atmospheric dynamics related to clouds formation/dissipation [17] and precipitation. The overall “sign” of the impact on the Earth–Atmosphere system radiation budget, relevant to planetary climatic effects [18], is estimated at the TOA and results from the combination of the associated atmospheric and surface radiative perturbations.
Several modeling studies have documented the importance of the aerosol–radiation interactions in numerical simulations, particularly for mineral particles, towards improving: (i) short-term weather forecasts [19,20], (ii) the simulated near-surface temperatures under specific dust outbreaks [21] or for extended time periods [22] and (iii) the representation of the shortwave (SW) [23] and longwave (LW) [24] cloud-free radiative fluxes at TOA. Nevertheless, large intercomparison initiatives of global circulation models (GCMs), such as AEROCOM [25,26,27], have demonstrated a considerable range among the estimated aerosol radiative effects. Numerous factors contribute to this uncertainty, which are mainly attributed to the representation of the suspended particles’ optical and microphysical properties, the assumptions in the radiative transfer codes or the treatment of surface albedo. In addition, the vertical structure of aerosol layers, especially with respect to the position of the clouds, as well as the nature of the suspended particles in conjunction with the cloud type, are also determinant factors of AREs, which are mainly positive when aerosols reside above cloud decks [28,29], since smoke (strong absorption) or dust (moderate absorption) particles, likely found at higher altitudes, are superimposed on highly reflective cloud tops. On a local/regional scale, the above-cloud AREs can be extremely positive [30,31,32], but when globally averaged over long-term periods they “oscillate” close to zero (i.e., neutral effect) [26]. On the contrary, when aerosols are beneath clouds (e.g., they are confined in the planetary boundary layer), the attenuation of the incoming SW radiation by dense water or ice clouds cancels or substantially suppresses the aerosol-induced radiative effects. Even under clear skies, the estimated AREs can be affected by the vertical aerosol distribution, with surface DREs being less sensitive than those at TOA and within the atmosphere [33].
The key optical (or radiative) properties in aerosol–radiation studies are the aerosol optical depth (AOD), the single scattering albedo (ω) and the asymmetry parameter (g), which are all wavelength dependent. Based on these three optical properties, it is feasible to describe comprehensively the aerosol load, nature and size, which regulate the aerosol impacts on the entire radiation spectrum. The spectral profiles of the radiative properties vary among aerosol species, further strengthening the complexity and difficulty in accurately estimating AREs at the global scale. The AREs of different aerosol species are also variable in space and time. Indeed, significant differences in terms of magnitude exist among the TOA, atmosphere and surface DREs of various aerosol species (dust, sea salt, carbonaceous and sulfate particles), and even in sign for DREs in the atmosphere and at TOA [34,35,36,37,38,39,40,41,42,43,44,45,46,47], inducing uncertainties in the calculation of AREs [48]. This indicates the necessity of accurately estimating the AREs of different aerosol types within the entire Earth–atmosphere system, namely at the surface, within the atmosphere, and at the TOA, as well as their detailed vertical and spectral distribution.
The overarching goal of the current study is to estimate, at the highest possible accuracy, the direct AREs (DREs) of the main aerosol types on a global scale and climatological basis, namely for the 40-year period 1980–2019, via the synergy of the Modern-Era Retrospective Analysis for Research and Applications version 2 (MERRA-2) [49,50,51] and the FORTH (Foundation for Research and Technology-Hellas) deterministic spectral Radiation Transfer Model (RTM) [52,53]. Emphasis is given to the exploitation of the vertically resolved optical properties of the five aerosol species, namely desert dust, sea salt, black carbon, organic carbon and sulfates, available in the MERRA-2 reanalysis dataset, which are used as input to the FORTH RTM. As a first step, the DRE computations are made under clear-sky conditions. This is performed to investigate the aerosol radiative effects at their largest magnitude and free of uncertainties with respect to the all-sky DREs [54]. Additionally, the separate computation of clear- and all-sky DREs allows the quantification of the important role of clouds [55] in determining the aerosol DREs. For consistency, other relevant radiative parameters such as atmospheric gases and surface albedo, both obtained by MERRA-2, are also utilized in the RTM. The DREs are calculated on a monthly basis, emphasizing the regional and decadal variability of total (all aerosol types) and each aerosol type DRE. In the following, we present the RTM and MERRA-2 input data (Section 2). Next, we provide an overview of the global spatiotemporal patterns of the MERRA-2 aerosol optical properties, focusing on AOD (Section 3.1). We then discuss the clear-sky DREs at the TOA, within the atmosphere and at the surface in detail in Section 3.2, focusing on their: (i) annual and seasonal global patterns (Section 3.2.1), (ii) interannual variability throughout the MERRA-2 coverage period (Section 3.2.2), also dealing with climatological values for the whole globe, the hemispheres and specific regions of interest (Section 3.2.2.1). Finally, we summarize the main findings and draw our conclusions in Section 4.

2. Data, Methods and Models

2.1. MERRA-2 Data

All data used in this study were provided by MERRA-2, a reanalysis assimilating data for all important quantities for the clear-sky radiation modeling. One of the reasons MERRA-2 was selected for this work, is that for the first time, radiatively coupled aerosol and meteorological observations are jointly assimilated on a multidecadal temporal horizon. The aerosol treatment of MERRA-2 produces 3-hourly analyses, assimilating these AOD-related observations:
  • Ocean-only reflectances from the Advanced Very High-Resolution Radiometer (AVHRR) instruments (1979–2002)
  • Reflectances from the Moderate Resolution Imaging Spectroradiometer (MODIS) instruments on Terra (2000-present) and Aqua (2002-present)
  • AOD from the Multi-angle Imaging SpectroRadiometer (MISR) over the bright desert regions (2000–2014)
  • AOD observations from the AErosol RObotic NETwork (AERONET) surface station network (1999–2014).
AOD from MODIS and AVHRR comes from cloud-free reflectances. The relevant observations are assimilated into the output of the coupled Goddard Earth Observing System (GEOS-5) and Goddard Chemistry Aerosol Radiation and Transport (GOCART) models [56,57]. The five aerosol types represented in GOCART and inherited by MERRA-2 are dust, sea salt, black carbon, organic carbon and sulfate.
MERRA-2 uses only total AOD observations (integrated over species and vertically), but the classification in aerosol types is performed by GOCART based on their optical properties, as described in the Optical Properties of Aerosols and Clouds (OPAC, [58]) dataset and their simulated life cycles. The emission of dust and sea salt is determined by wind speed in GEOS, separately for each size bin, following the parameterizations in [59,60]. Sulfates, black carbon, and organic carbon are produced from fossil fuel combustion. Additionally, organic carbon is emitted from biogenic sources. Sulfate sources also include DMS (dimethylsulfide), anthropogenic SO2, and eruptive and degassing volcanoes from the AeroCom Phase II project [61]. Some emissions do not extend to the end of the examined period, namely volcanic SO2 ends in 2010, anthropogenic OC/BC and SO2 in 2006 and 2008, respectively. Repeating cycles are used to extend the emissions until the end of the period.
Only AOD is directly constrained in MERRA-2, while less easily observed aerosol properties are more weakly constrained from observations and depend on the model physics and error covariance assumptions [50]. The latter properties contain the vertical distribution, speciation, absorption AOD, etc. [49,51] performed evaluations for both constrained and unconstrained MERRA-2 aerosol properties and found that the reanalysis demonstrates considerable skill.
Quality-controlled AOD at 550 nm is assimilated every 3 h in the GEOS-5/GOCART model results. The internal representation of aerosol extensive properties is the mass mixing ratio for each species. The extinction coefficient per species is derived from Mie theory when the particles are considered spherical or from T-matrix theory for non-spherical dust relying on the updated OPAC dataset [62,63].
Refs. [49,51] have shown that in general AOD correlates well, with low bias, when compared to non-assimilated sun photometer and aircraft observations. Their evaluation shows improvement over the control run M2REPLAY, having no AOD assimilation, and the previous assimilation product MERRA-Aero, where an offline AOD assimilation is implemented. Some known problems are that AAOD (absorption AOD) is underestimated compared to observations, especially over southern Africa. Indeed, over this region, OMI (Ozone Monitoring Instrument) aerosol index is not in good agreement with the corresponding MERRA-2 based data [49]. These discrepancies are related to the non-consideration in GOCART, and therefore in MERRA-2, of the relatively absorbing brown carbon particles emitted during biomass burning processes [49]. Additionally, there are problems with the assumed common size distribution of volcanic and other sulfate particles, leading to an overestimation of post-Pinatubo sulfate AOD and consequently AOD underestimation of non-sulfate types.

2.2. MERRA-2 Data Processing

For the calculation of the aerosol DRE, the FORTH RTM requires both vertically and spectrally resolved optical properties (i.e., AOD, SSA, and g), which are not provided directly by MERRA-2. However, MERRA-2 provides vertically resolved (in 72 layers) 3-hourly instantaneous aerosol mixing ratios. Therefore, based on these data along with spatio-temporally collocated MERRA-2 relative humidity and look-up tables that provide the scattering and absorption efficiencies and asymmetry parameter per aerosol type, aerosol size bin, relative humidity, at 25 wavelengths (from 0.25 to 8.5 μm), we computed the 3-hourly vertically and spectrally resolved scattering and extinction AOD and asymmetry factor. The calculations were performed for the lower 50 layers, because the aerosol load in higher altitudes (greater than, approximately, 30–34 km), is negligible. The 3-hourly optical properties were then averaged to calculate the monthly AOD, SSA and g. In the averaging, we considered only the daytime data because the aerosol DREs are zero during the night. It should be noted that the monthly asymmetry parameter is the weighted mean of daytime 3-hourly g, using the 3-hourly scattering optical depth as weights.

2.3. The FORTH RTM

The aerosol optical depth, single scattering albedo, and asymmetry parameter, calculated from MERRA-2 as described above, are then used as input to the spectral radiative transfer model FORTH, to derive the aerosol DRE on a global monthly basis and at 0.5° × 0.625° resolution. Output from the model includes upwelling and downwelling solar fluxes at TOA, at the surface, and at 50 levels in the atmosphere. The model is run once without any aerosol load and once with all aerosols in place. The total aerosol direct radiative effect ΔF is defined as the difference between the radiation flux Faerosol with aerosols present and the flux Fno-aerosol with aerosols missing.
ΔF = Faerosol − Fno-aerosol
Since a global speciation of aerosols is available, we also perform the same analysis per aerosol type by simply replacing the term Fno-aerosol in Equation (1) with the simulated fluxes (F) computed neglecting the specific aerosol type for which the DRE is calculated. Note that, as shown in the results section, non-linearities cause the individual type DREs to not add up to the total aerosol DRE. However, as also shown, this non-linear effect is small (<10% on a global level and generally <25% locally). Since in this work we present DRE on the net radiation fluxes (downwelling minus upwelling), positive aerosol DRE at TOA, surface or in the atmosphere, corresponds to a warming effect on the corresponding subsystem, while negative values to a cooling effect.
The 1-D spectral FORTH radiative transfer model [52] has evolved from a radiative-convective model developed by [53] and already applied to calculate radiation fluxes and DREs globally [33,52], regionally [64,65,66,67], and locally [68]. The outputs of RTM have been extensively evaluated against surface-based and satellite radiation fluxes (e.g., [69,70,71,72]) as well as against other SW RTMs [73]. The model works in the 0.2 to 10.0 μm spectral interval, which naturally defines the spectral range of the radiative effects presented in this work. We use the solar spectrum of [74] weighing it so that the solar constant is equal to 1367 Wm−2 [75]. The spectral region of interest is resolved into 118 wavelengths in the spectral subregion 0.2–1.0 μm and into 10 bands in the subregion 1.0–10.0 μm. The model solves the monochromatic equation of radiation transfer for a multiple scattering/absorbing atmosphere for each individual wavelength and band, following the delta-Eddington method [76]. We account for Rayleigh scattering, O3 absorption in the ultraviolet and visible, and H2O, CH4, CO2 absorptions in the near-infrared.

3. Results

In this section, we first briefly describe the global spatiotemporal patterns of the MERRA-2 aerosol optical depth, and in the following, we discuss in detail the modeled DREs.

3.1. Global Distribution of MERRA-2 AOD

Here, we discuss the geographical variation of MERRA-2 AOD, which is a major DRE driving factor [52]. Figure 1 shows the 40-year (1980–2019) mean annual spatial distribution of MERRA-2 AOD at 550 nm, per aerosol type (sulfate, dust, sea salt, organic carbon and black carbon), as well as for the total aerosol load. MERRA-2 successfully reproduces the well-known patterns of the global AOD distribution revealing a considerable diversity of the prevailing aerosol type from a region to another. More specifically, according to Figure 1, very high aerosol load, mainly consisting of desert dust, is observed across the dust belt, namely the arid and semi-arid regions of North Africa (AOD values up to 0.70 in Bodélé Depression; the highest value globally), the Arabian Peninsula and the central-south Asian deserts, in agreement with the literature [34,77,78]. Almost equally high AOD values (up to 0.65) are observed above east China, where according to MERRA-2 the aerosol load is dominated primarily by anthropogenic sulfate particles (Figure 1ii) and secondarily by carbonaceous (organic and black carbon) particles (Figure 1v,vi) and desert dust (Figure 1iii). Over the Indian subcontinent, the aerosol load (AOD up to 0.4) consists of both natural (desert dust) particles originating mainly from the Thar Desert and anthropogenic (carbonaceous and sulfate particles), especially over the highly polluted Indo-Gangetic Plain. The extensive biomass burning within the tropics results in high loads of carbonaceous particles over these regions, especially over the African and South American tropics [79], where organic carbon is the predominant aerosol type having maximum AODs (up to 0.28) over central Africa. MERRA-2 successfully reproduces the advection of carbonaceous aerosols originating from wildfires in the central and southern African source areas westward, to the subtropical South Atlantic Ocean and the Gulf of Guinea, reaching up the Ascension Island, as documented in literature based on satellite observations [79]. Yet, the most characteristic case of aerosol long-range transport, also reproduced by MERRA-2, is the Saharan dust outflow to the tropical and subtropical North Atlantic Ocean and the Gulf of Guinea, reaching as far as South America and the Caribbean, in agreement with previous studies [80,81]. High aerosol loads are also evident over the northern Indian Ocean (Arabian Sea and Bay of Bengal), due to both desert dust and carbonaceous particles transported from the adjacent regions of the Arabian Peninsula, the Indian sub-continent and South-East Asia, as well as over the western Pacific associated with outflow of dust particles originating from Asian deserts [77,78]. On the other hand, over remote oceanic regions, the AOD is low and consists mainly of sea salt particles (Figure 1iv). However, the presence of sea salt over all ocean regions of the planet makes it one of the most abundant aerosol types [82]. Indeed, according to MERRA-2, the mean annual, surface area-weighted, globally averaged sea salt AOD is 0.04, the highest among natural aerosols and second only to sulfate, which has a global mean AOD of 0.05. The corresponding value of desert dust AOD is lower, equal to 0.03, followed by organic and black carbon particles (0.02 and 0.005, respectively). A high relative contribution of sulfate particles to the total aerosol burden, and a larger sea salt than dust AOD, are also found by most models participating in the AEROCOM phase III control experiment [83]. Moreover, the MERRA-2 global dust AOD is close to that reported in previous studies [38,84] indicating a good representation of dust sources. Overall, the 40-year global mean annual MERRA-2 total AOD is found to be 0.14.
For brevity reasons, and because the present paper deals with DREs, emphasis is not given to the significant seasonal variation of MERRA-2 AODs, illustrated in the Supplement (Figure S1) both for total and the speciated AOD. In brief, MERRA-2 reproduces features such as the boreal winter to summer northward shift and intensification of subtropical areas with high AOD dominated by dust, as well as the spring and summer maximum AOD values over the Asian deserts (Figure S1i,iii), which have been reported in the literature based on observational studies [38,77,84]. Moreover, the seasonality of the biomass burning aerosols [78,79,85,86,87] is well-captured by MERRA-2 as indicated by the high organic and black carbon AOD over central and southern Africa during boreal winter and summer–autumn, respectively, as well as over South America and maritime Southeast Asia during boreal autumn (Figure S1v,vi, supplement).

3.2. Aerosol Direct Radiative Effects

3.2.1. Global Distribution of Aerosol DRE

The mean annual geographical distribution of the clear-sky aerosol effects on the net shortwave flux at the Earth’s surface (hereafter DREsurfnet), within the atmosphere (DREatm), and at TOA (DRETOA), averaged over the 40-year period 1980–2019 is presented in Figure 2. The results are provided for the total aerosol load and each aerosol type separately. Bluish-violet colors indicate a cooling effect, while reddish-yellowish colors indicate a warming effect. The long-term 40-year mean annual and seasonal total aerosol DREs and AOD, spatially averaged over the globe, the North and South Hemispheres, global land and global ocean areas are presented in Table 1. The same results are also given in Table 1 for five selected world regions (Sahara and Arabian Deserts, southern Africa, India, East Asia and the Mediterranean), shown in Figure 3, characterized by heavy aerosol loads of dominant aerosol types. Our results show that generally aerosols cool the surface and the whole planet and warm the atmosphere. However, the sign and magnitude of DREs depend strongly on AOD, the aerosol type and the underlying surface properties, exhibiting, therefore, a significant geographic and seasonal variation. Thus, in the following we discuss the computed DREs emphasizing the contribution of different aerosol types in relation to different radiative processes and effects, above different world area types hosting natural/anthropogenic aerosol sources and downwind regions as well.

Anthropogenic Polluted Areas

A very strong surface radiative cooling due to aerosols is observed over East and South Asia, especially in China, where DREsurfnet reaches −39 Wm−2 (the highest cooling effect globally) and the Indo-Gangetic Plain. This decrease in surface solar radiation, induced by aerosol scattering and absorption in the atmosphere, has a different cause for different aerosol species. Thus, BC and dust DREsurfnet are associated with atmospheric absorption, with values of DREatm, reaching up to 20 Wm−2 over the North China Plain (Figure 2biii–vi). In contrast, sulfate DREatm practically has zero values over both East and South Asia (Figure 2bii). Indeed, a strong TOA cooling effect is evident over East and South Asia, especially over China, attributed to the strong scattering by the predominant sulfate particles (Figure S1ii). This results in a large negative DRETOA (up to −16 Wm−2) associated with a much stronger surface cooling than atmospheric warming. All aerosol DREs (at the surface, within the atmosphere and at TOA) over South and East Asia are generally stronger during spring and summer than autumn and winter (regionally average values provided in Table 1), influenced by the seasonal variation of the aerosol load, and especially dust, since the locally predominant sulfate AOD does not exhibit a seasonal variation. This is more evident over China, where the spring maximum of the DREs is in line with the East-Asian dust season [77,88].
In other regions heavily affected by anthropogenic pollution, the aerosol load (AOD) and therefore the DREs are much smaller than in East and South Asia, although they are far from being negligible. Thus, over Europe and North America (especially the eastern United States), we observe an atmospheric warming due to aerosols DREatm up to 4 Wm−2 locally, attributed mostly to strongly absorbing black carbon particles. On the other hand, over these regions the TOA reflected solar radiation back to space is increased by −(3–9) Wm−2, mostly due to sulfate and secondarily to dust and OC aerosols, causing an anthropogenic planetary cooling. As a result, at the surface of Europe and North America, sulfate particles and to a smaller extent dust, organic and black carbon, cause a cooling effect. The total aerosol DREsurfnet reaches values as large in magnitude as −14 Wm−2 locally in South-Eastern Europe, with the surface solar radiation decreasing mostly due to strong scattering in the atmosphere above.

Natural Desert and Biomass Burning Areas

Over the Sahara and Arabian deserts, dust aerosol particles contribute overwhelmingly to a strong surface cooling and an almost equal atmospheric warming. These effects are particularly large over the southern and south-western parts of the Sahara, where DREsurfnet and DREatm reach values as high as −32 Wm−2 and 33.9 Wm−2, respectively (the highest atmospheric warming globally). As shown in Table 1 and in Figure S2, these effects are more pronounced during spring and summer, when the dust activity peaks over these regions [34,38,77,89]. The near-cancellation between the DREsurfnet and DREatm results in a small planetary cooling and even a planetary warming effect (up to 6.9 Wm−2) over some parts of the southern Sahara Desert. This can be explained by the effect of multiple scattering between the relatively absorbing dust particles and the underlying highly reflective surface (characterized by an albedo larger than 0.25 according to MERRA-2, results not shown here). The important role of the surface albedo on the aerosol effects is discussed with more details later. Strong DREs (all components) are evident over sub-Sahel, and especially over Nigeria, with dust and carbonaceous particles being their main contributors. In the broader sub-Sahel, during the dry season (winter), high loads of Saharan dust particles transported by the Harmattan winds, along with overlying organic and black carbon particles originating from extensive local biomass burning are present [86,90]. The winter aerosol DREs in the sub-Sahel are among the highest globally (Figure S2a, supplement). Generally, in regions affected by seasonal biomass burning, especially the tropical forests and grasslands of central and southern Africa and South America, the organic and black carbon particles contribute almost equally to a strong surface cooling, while within the atmosphere the main driver of the heating effect is black carbon (underlining the lower absorptive capacity of OC relative to BC). Overall, organic carbon particles result in a substantial TOA cooling effect above their source regions (annual total DREsurfnet values up to −33 Wm−2 in central-southern Africa).
Aerosol particles of continental origin, both natural and anthropogenic, cause a very strong surface cooling when transported over the oceans under the influence of the prevailing winds. This cooling effect can be comparable and, in some cases even larger than the DREsurfnet observed above the aerosols’ source regions, despite their lower AOD, indicating thus a strong forcing efficiency. More specifically, over the tropical North Atlantic Ocean and the Gulf of Guinea the advected aerosols (mainly dust and secondarily carbonaceous particles) cause surface cooling, locally exceeding 30 Wm−2 and higher than in many parts of North Africa. Aerosols of continental origin drive a cooling effect of similar magnitude over the Red Sea and the Persian Gulf (mainly desert dust), over the tropical south Atlantic Ocean (carbonaceous particles) and the northern Indian Ocean, especially the Arabian Sea (primarily dust and carbonaceous, and secondarily sulfate aerosols). On the other hand, the atmospheric heating effect of continental particles over the oceans, despite being quite strong (e.g., up to 15 Wm−2 due to dust over the tropical North Atlantic), is much smaller than above their source regions and approximately half of the DREsurfnet (in terms of absolute values). Therefore, a strong TOA cooling effect (large negative DRETOA) is observed over these oceanic regions, exceeding 15 Wm−2, which is in contrast with either a weak cooling or a warming planetary effect over the adjacent continents (deserts), highlighting the role of surface albedo for the sign of DRETOA. Over regions characterized by high surface albedo the available radiative energy is lower on the Earth’s surface and higher within the atmosphere than over dark surfaces (e.g., oceans). The result is a lower net surface cooling and a higher atmospheric warming potential there [33]. The increased multiple scattering between the Earth’s surface and the overlying aerosol layer further amplifies the atmospheric warming and reduces the surface cooling above surfaces with high albedo such as snow- and ice-covered areas of the globe [33,91].

Areas with Mixed Natural and Anthropogenic Aerosols

The Mediterranean basin is a region of particular interest, because it is a crossroad of particles of different origins, both natural and anthropogenic, and also because of its climatic sensitivity [92,93]. As with other marine regions with high aerosol load (Mediterranean AOD equal to 0.2, Table 1), the combination of the aerosol effects on the surface (cooling up to 19 Wm−2) and within the atmosphere (warming up to 8 Wm−2) results in a relatively strong TOA cooling (up to −13 Wm−2 near the north African shores). According to our results, the surface cooling effect over the Mediterranean is attributed to the advected Saharan and Arabian dust particles, followed by anthropogenic sulfate particles transported from Europe. The atmospheric warming effect is driven mainly by dust and, to a quite smaller extent, by black carbon particles originating from both summer wildfires in the Mediterranean Basin (Figure S7c-ii) and anthropogenic pollution (mainly from Europe) and natural sea salt particles. This atmospheric heating effect of the almost purely scattering sea salt is discussed with more details later. Mineral particles contribute more to the total aerosol effect in the southern parts, while the role of sulfate and black carbon particles is much more pronounced over the northern parts of the Mediterranean. Though these results are barely visible in the displayed global maps they are clearly shown on a Mediterranean scale map (not shown here). In general, the aerosol DREs over the broader Mediterranean basin are found to be stronger during spring and summer compared to the autumn and winter (Table 1).

Remote Clean Areas

Over “clean” remote oceanic regions, where strongly scattering sea salt particles dominate the total aerosol burden (Figure 1), a radiative cooling effect is caused at both TOA and surface, of about similar magnitude due to the almost negligible DREatm. These cooling effects are weak, ranging mostly between −1 and −5 Wm−2. The aerosol DREs are also relatively low over the high latitudes, although being of great interest due to the climatic sensitivity of these regions [94].
Extensive biomass burning occurs over Siberia and Canada, mainly during summer and less in spring, emitting carbonaceous (mainly OC, Figure S1v) particles, which eventually contribute to a local atmospheric heating and surface/TOA cooling effect (the latter two effects being however dominated by sulfate aerosols). These particles, along with primarily sulfate and secondarily black carbon particles originating from urban/industrial sources of the Northern Hemisphere, are also transported northward, significantly enhancing the aerosol load over the Arctic (Arctic haze) [95]. Sulfate particles are found to be the major contributor to a surface cooling effect (up to −8.5 Wm−2) observed over the Arctic, followed by dust and organic carbon. The observed atmospheric warming is driven mainly by black carbon particles despite their weak loading there, showing their strong absorbing ability. Dust particles also contribute to the arctic atmospheric warming, while it is interesting that sulfate particles exert an atmospheric cooling effect by up to −0.3 Wm−2 (the strongest atmospheric cooling due to sulfate globally), partly counterbalancing the heating effect of black carbon and dust particles. At TOA, a planetary cooling effect is evident over the Arctic, except for Greenland where we observe a small warming effect (less than 0.5 Wm−2 mean annually). This warming is attributed mainly to the multiple scattering between the absorbing black carbon particles and the highly reflective underlying snow- and ice-covered surface, occurring during spring and summer (Figure S2c-iii, supplement). During spring, a planetary heating effect is also observed in parts of the Arctic ocean and Hudson Bay.

Discussion of the Climatic Role of Aerosol Speciated DREs

The aerosol DREs have significant impacts on climate at both local and global scales. The aerosol-induced surface cooling can reduce the evaporation rates, leading eventually to a slowdown of the water cycle [52,96]. The enhancement of the atmospheric absorption caused by aerosols, in combination with the surface cooling effect, induces changes in the atmospheric lapse rates, eventually resulting in the stabilization of the troposphere and therefore in the suppression of cloud formation [15,20,97], enhancing desertification processes in climatic sensitive regions, such as the Sahel and the Mediterranean basin [91]. It is also known that aerosol types can inhibit or invigorate convection [98].
The long-term (1980–2019) globally averaged AODs and DREs (all components) per particle type are presented in Table 2, aiming to provide an overall picture of their contribution to the total aerosol effects. In the same table, we also provide the respective aerosol radiative forcing efficiencies (ARFE, i.e., the aerosol effects per unit optical depth, in Wm−2) which quantify the warming/cooling potential of each aerosol type. According to Table 2, the light-absorbing particles (i.e., black carbon and dust) are characterized by stronger forcing efficiencies compared to the scattering ones (sea salt and sulfate), either on the surface or in the atmosphere of the Earth. The strongest ARFEs are observed for black carbon particles, followed by desert dust and the lowest for sulfate and sea salt. The dependence of the ARFEs’ magnitude on the particle absorptivity is much more pronounced within the atmosphere compared to the surface. Characteristically, on the Earth’s surface, the ARFE of black carbon particles (the most light-absorbing type) is approximately three to four times larger than of sea salt and sulfate, while within the atmosphere they differ by two to three orders of magnitude. Since the atmospheric heating is directly proportional to the particle absorptivity, the effects of almost purely scattering particles are very small. On the other hand, scattering particles are largely forward-scattering, which reduces their surface cooling potential and results in a smaller ARFE compared to absorbing particles. These results depict very well the importance of the accurate determination of the aerosol absorptivity (i.e., the Single Scattering Albedo or SSA), especially for high AODs [97]. However, this parameter is one of the most difficult to retrieve using satellite remote sensing [99], inducing therefore significant uncertainties on the determination of the aerosol effects.
The relatively large dust AOD, combined with the strong surface and atmospheric ARFEs of these particles, result in very pronounced global mean dust DREsurfnet and DREatm (−1.98 and 1.15 Wm−2, respectively) exerting the largest surface cooling and atmospheric warming effect among all particle types. Despite their quite weaker (about half) surface ARFE, the strongly scattering sulfate and sea salt particles cause a comparable strong cooling on a mean global and annual basis, due to their high (higher than dust) loads. A smaller, but still substantial, surface cooling is caused by organic and black carbon particles. Within the atmosphere, the second most important driver of the observed atmospheric warming is black carbon. The DREatm of the remaining aerosol types is much smaller in magnitude. The obtained results highlight the strong diversity of the effects exerted by different types of aerosols on the surface and atmospheric solar radiation budgets.
It is important to note that the almost purely scattering particles (sea salt and sulfate, atmospheric ARFEs equal 2.9 and −0.4, respectively) have non-negligible contrasting effects on the atmospheric absorption. The sign of these effects (i.e., atmospheric warming or cooling) is mainly determined by the altitude of the scattering aerosol layer and is heavily influenced by the presence of other aerosol types within the atmospheric column. More specifically, due to backscattering of the incoming solar radiation, strongly scattering particles increase the available energy above them. This results in an increase in absorption of solar radiation by the overlying atmospheric gases and aerosol particles and a subsequent heating of these layers (e.g., sea-salt induced atmospheric warming over oceans). This heating effect is significantly enhanced when strongly absorbing particles are located above strongly scattering particles. On the other hand, scattering particles decrease the available solar energy below them. Therefore, when the scattering aerosol layer is located higher, the heating effect in the atmospheric layers above them is compensated by a cooling effect below them, especially when a near-surface absorbing aerosol layer is present. In this case, the DREatm may take negative values (i.e., cooling of the atmospheric column such as in the case of elevated sulfate aerosols). These results highlight the importance of the use of height-resolved aerosol optical properties data in radiative transfer modeling studies. In this context, since scattering sea salt particles are located in low altitudes, mainly within the planetary boundary layer, they cause a small heating of the atmospheric column almost everywhere (DREatm equals 0.12 Wm−2 on a mean annual global level). On the other hand, because sulfate particles may occupy either low altitudes (especially near source-regions, such as eastern China) or higher ones (in the case of long-range transport, such as over the high latitudes of the N. Hemisphere), their DREatm ranges between a small warming to a small cooling effect (Figure 2b-ii), yielding a near-zero global annual mean DREatm.
At the TOA, sulfate, dust, sea salt and carbonaceous particles are characterized by similar relatively high ARFEs, ranging between −30.7 Wm−2 (dust) and −41.2 Wm−2 (sea salt). However, as shown in the previous discussion of the geographic variation of the aerosol DREs, surface albedo plays a crucial role in the determination of the magnitude and the sign of DRETOA thus inducing large differences between the radiative effects of the same aerosol type from region to region (Figure 2c). Moreover, because of the significantly different loads of the five aerosol types, the associated DRETOA values vary between them, ranging from −1.9 to 0.2 Wm−2. Generally, due to their small atmospheric warming and their pronounced surface cooling effects, sulfate particles followed by sea salt cause stronger planetary (TOA) cooling on a global annual scale (−1.88 and −1.62 Wm−2, respectively). Dust and organic carbon particles are also found to cause a substantial TOA cooling effect (−0.83 and −0.73 Wm−2, respectively). On the other hand, strongly absorbing black carbon is the only particle type causing a planetary warming effect, equal to 0.19 Wm−2, which in association with the relatively high (and close to those of the remaining aerosol types) TOA ARFE highlights the important climatic role of this particle type.

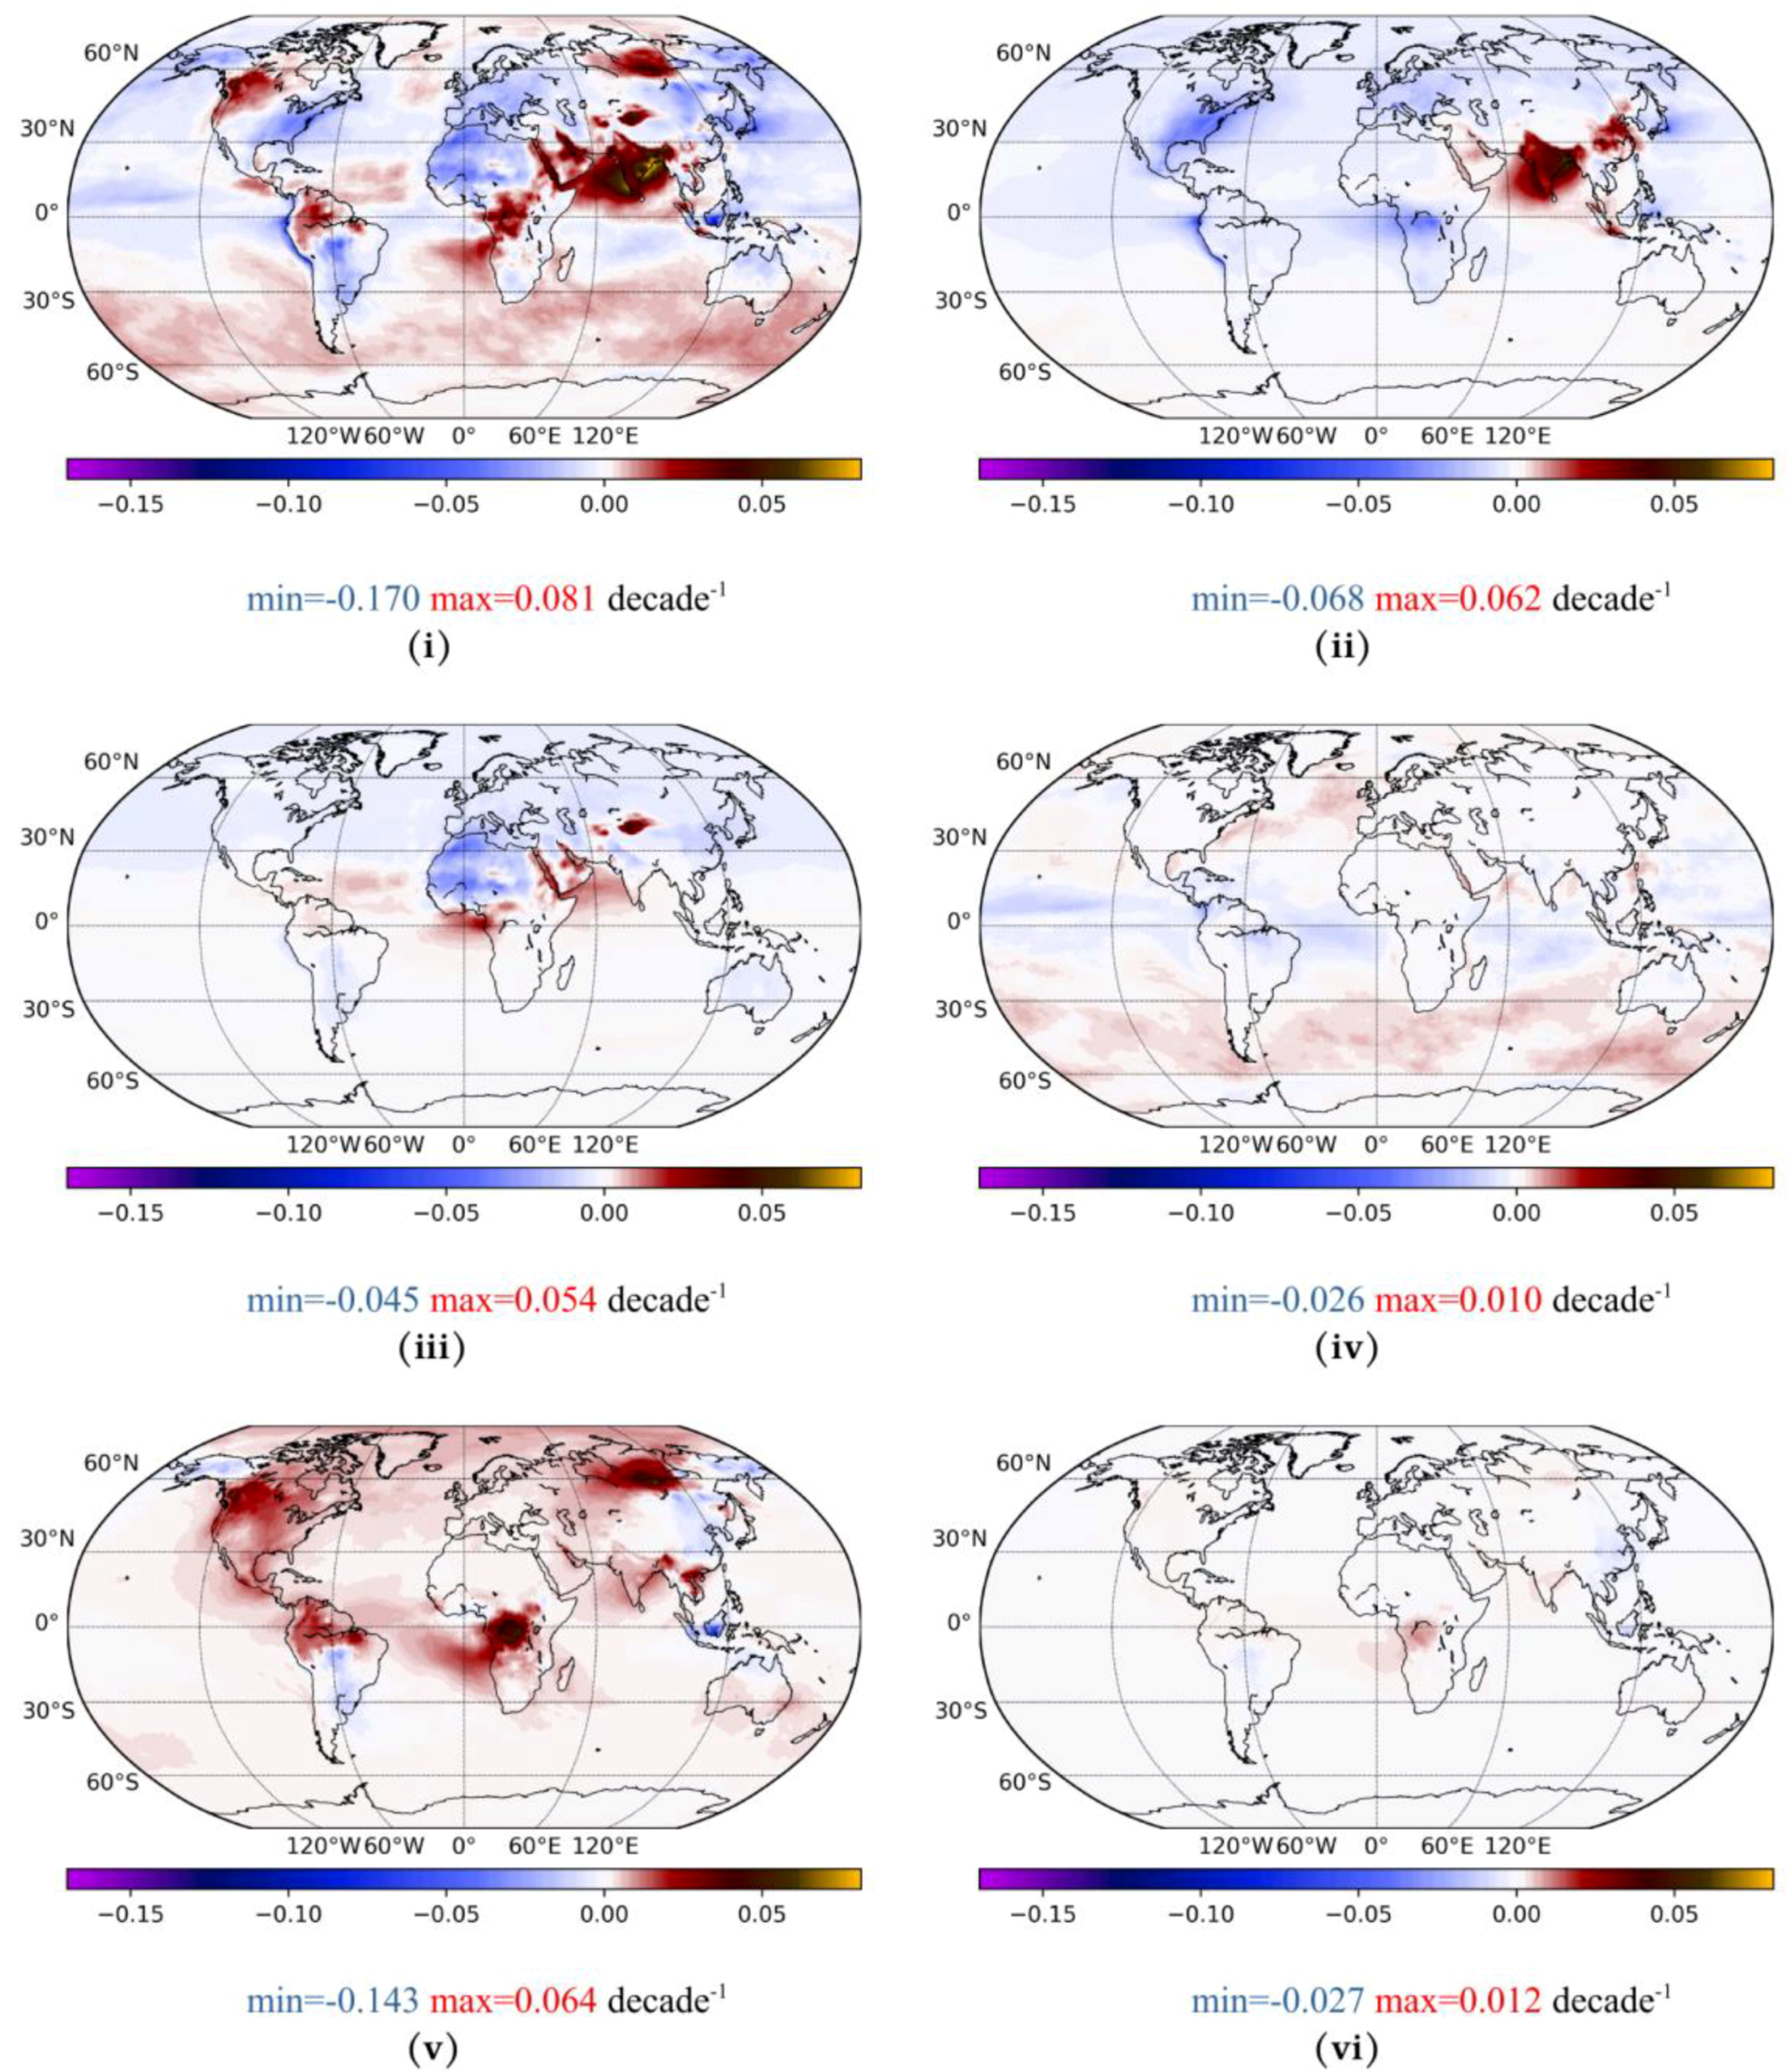
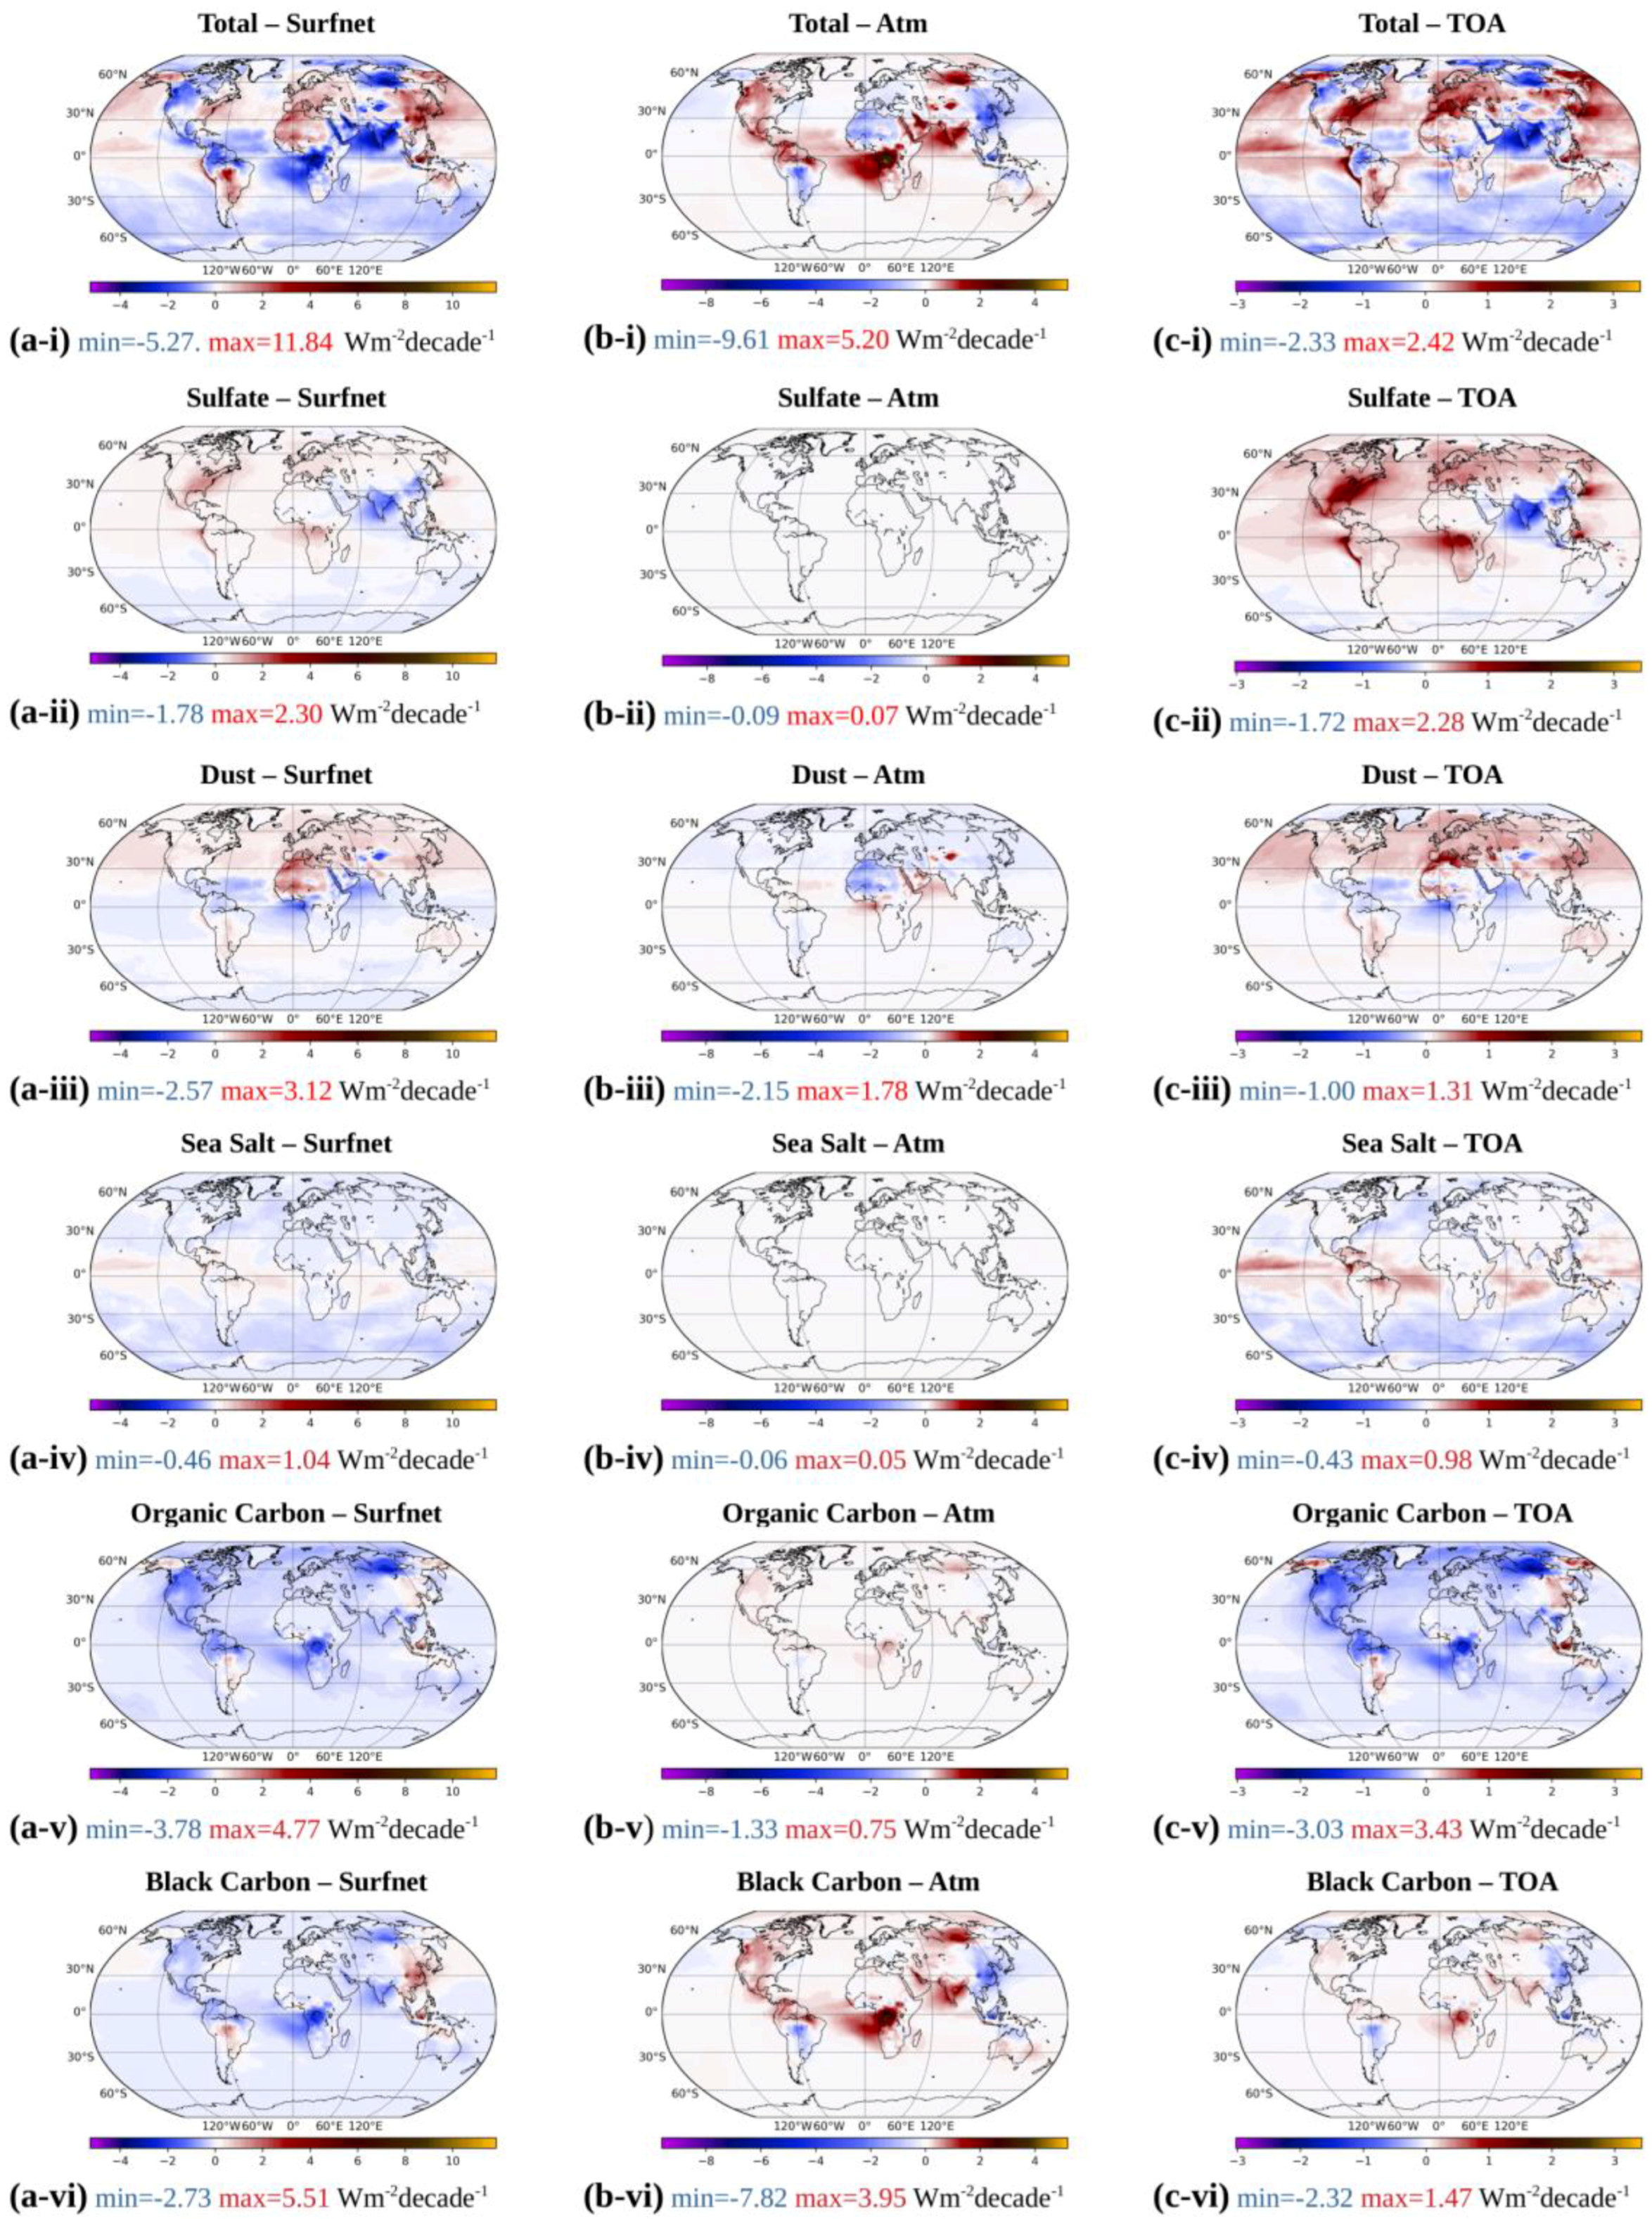
3.2.2. Inter-Annual Variability of Aerosol DRE

The study of the inter-annual variation of AOD and the obtained DREs per aerosol type enables the identification of changes in both the natural and anthropogenic aerosol load and DREs, with significant climatic consequences. Multi-year databases, such as MERRA-2 spanning the period 1980–2019, provide the unique opportunity to perform such a study. We will initially discuss the interannual variability of aerosol loads and DREs during the whole period. However, the AOD and DRE trends can be spuriously affected by changes in the observing system, data availability and coverage, and changes in emissions inventories [51]. Therefore, we will investigate separately the inter-annual variation during the 2001–2019 period, the 19 complete years for which the NASA Earth Observing System (EOS) satellite data (MODIS-Terra and Aqua, MISR) were implemented in the MERRA-2 Observing System, resulting in more homogeneous time-series.

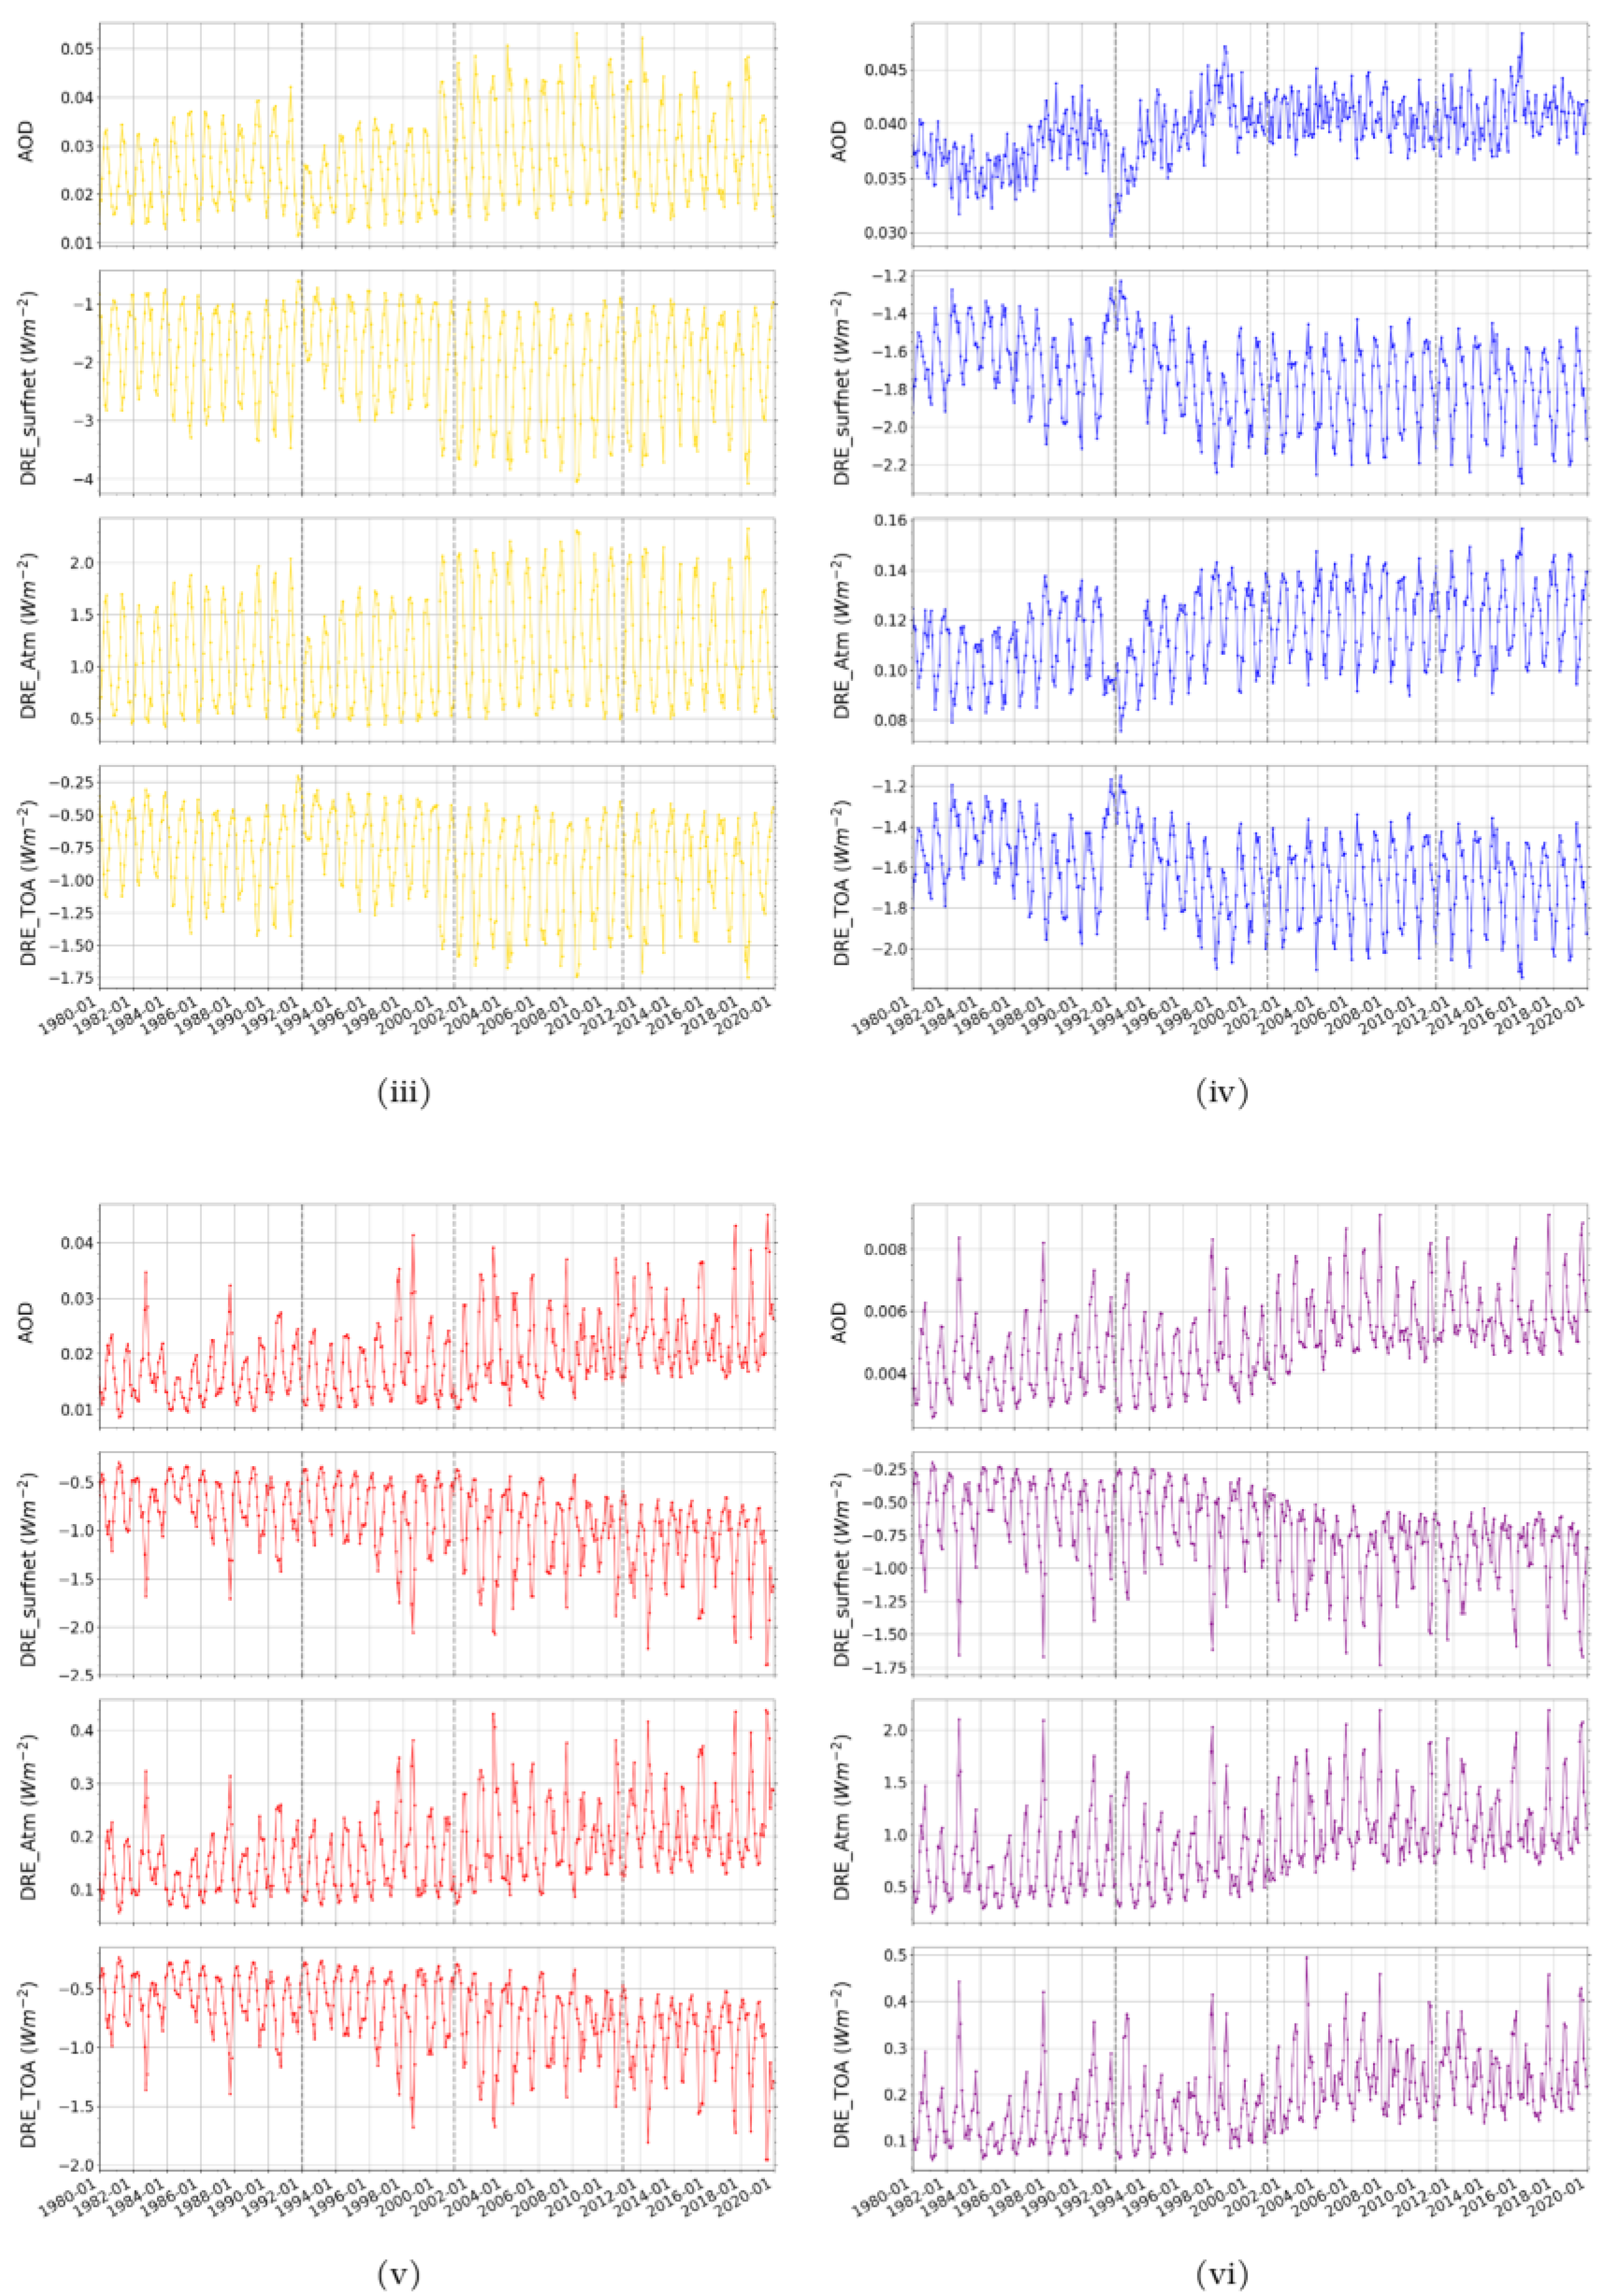
3.2.2.1. Inter-Annual Variability of Aerosol AOD and DREs

The time series (1980–2019) of monthly globally averaged MERRA-2 AOD and DREs at the Earth’s surface, within the atmosphere and at ΤOA, for sulfate, dust, sea salt, organic and black carbon particles, as well as for the total aerosol load, are presented in Figure 4 (note the different y-axis scales used in the different plots). The dashed vertical lines denote the transition dates between the four separate MERRA-2 production streams [50]. The results reveal that there are no discontinuities in AOD and DREs time-series across consecutive streams. Moreover, in Table S1 (Supplement) we provide the decadal annual mean aerosol DREs and AOD, spatially averaged over the globe, the North and South Hemispheres, global land and global ocean areas, as well as over the five selected world regions shown in Figure 3, which are representative of the various aerosol types and regimes, in order to provide some insight about their temporal variability.
The most characteristic feature of the interannual variation of the MERRA-2 total AOD and DREs is the distinct and relatively long-lasting impact of large-scale volcanic eruptions on the global aerosol load, namely the eruptions of El Chichón and Pinatubo. Indeed, until the mid-90s the interannual variation of the total aerosol AOD and DREs is mostly influenced by the changes in volcanic sulfate aerosol load (Figure 4i,ii). More specifically, the El Chichón eruption in Mexico (1982) resulted in an approximately fourfold increase in sulfate AOD compared to the beginning of the 1980s, reaching 0.12 during July 1982 (Figure 4ii), which is projected in an equivalent increase in total AOD (from 0.11 to 0.21). According to our model results, sulfate particles associated with the El Chichón eruption cause a substantial decrease in net surface solar radiation (SSR) in the early 1980s (globally averaged sulfate DREsurfnet up to −6 Wm−2, Figure 4ii, second row) also reflected in an overall decrease in net SSR (up to −12 Wm−2, Figure 4i, second row). Due to the fact that the layer of ejected volcanic sulfate particles is mostly elevated (located in the upper troposphere and lower stratosphere; [100]), sulfate aerosols decreased the available radiative energy underneath, radiatively cooling the atmosphere, inducing a DREatm up to about −0.3 Wm−2 in July 1982 (Figure 4ii, third row), partly counterbalancing the atmospheric heating effects of other particle types (see Figure 4iii–vi, third rows) and resulting in a total DREatm equal to 2 Wm−2. The enhanced presence of sulfate aerosols resulted in a large increase in planetary albedo with total DRETOA reaching values as high as −9.5 Wm−2 after the El Chichón eruption, of which approximately the 6.5 Wm−2 are attributed to sulfate particles (Figure 4i,ii, fourth rows). The impact of the Pinatubo eruption in the Philippines (1991) on the aerosol load and DREs is found to be even stronger. The sulfate aerosol load increased nearly 10-fold compared to the previous years, reaching 0.22 at the end of 1991, inducing thus a strong surface cooling as large as −10 Wm−2, decreasing the atmospheric absorption by 0.7 Wm−2 and overall increasing the planetary albedo by 10.5 Wm−2. The globally averaged total aerosol clear-sky effects after the Pinatubo eruption are strongly dominated by the effects of sulfate aerosols, having values up to −13 Wm−2 at TOA and −14.5 Wm−2 at the Earth’s surface, resulting in significant climatic consequences [101], such as a remarkable slowing of the hydrological cycle [102]. As shown by our results, the large reduction in sulfur emissions mainly in Europe and North America due to the implementation of air pollution mitigation strategies [103,104,105] is largely counterbalanced by an increase in sulfate loading over the Indian Sub-continent and East Asia [106,107]. Therefore, changes in the anthropogenic sulfate aerosol load and the sulfate DREs between 1980 and 2019 are not evident in Figure 4.
The Pinatubo eruption has a spurious decreasing effect on the MERRA-2 dust and sea salt AODs and DREs (Figure 4iii,iv). This artifact is induced by the large negative AOD increments applied in MERRA-2, which affect all aerosol species [51]. The reason was identified as the overestimation of sulfate AOD directly after the Pinatubo eruption, caused by MERRA-2 parameterization errors, such as the overestimation of Pinatubo injection altitude [108]. Apart from this abrupt decrease in the sea salt and dust load after the Pinatubo eruption, it is evident that the respective AODs are more pronounced during the second half of our study period compared to the first half. These changes are however much smaller than those of sulfate AOD. More specifically, the dust AOD ranged generally between 0.01–0.04 before 2000 while afterwards it increased to 0.015–0.050, also exhibiting a larger month-to-month variability. The sea salt AOD generally ranged between 0.030–0.044 and 0.037–0.048 during the same time periods. The changes in the dust load resulted in an increase in both dust surface cooling and atmospheric warming after 2000, with DREsurfnet and DREatm reaching in some cases values as high as −4.0 and 2.4 Wm−2, respectively. At TOA, desert dust induced a planetary cooling of 0.25–1.50 Wm−2 before 2000 and 0.50–1.75 Wm−2 afterwards. On the other hand, sea salt particles induced a similar surface and TOA cooling, which was slightly larger during the 2000s and 2010s (up to 2.0–2.3 Wm−2) compared to the 1980s and 1990s (surface and TOA cooling less than 2.0 Wm−2). The sea salt effect within the atmosphere also exhibited a small increase over these years; however, due to the non-absorbing nature of these particles, the induced atmospheric warming is small (Section 3.1). It should be noted that these results must be treated with caution because, besides the spurious post-Pinatubo dust and sea salt decrease, there are some other suspicious AOD “jumps”, e.g., between the late 90s and early 2000s, which can be possibly attributed to MERRA-2 observing system changes. As already discussed, MERRA-2 aerosol data are more reliable and consistent after 2000, when EOS data are assimilated.
On the other hand, during the same period, a relatively pronounced global increase in carbonaceous (organic and black carbon) aerosols load is evident (Figure 4v,vi). More specifically, the globally averaged organic carbon AOD ranged between 0.01 and 0.035 during the 80s, while after approximately 2000 they exhibit an increasing trend, resulting eventually in an AOD of 0.015–0.045 during the 2010s. A similar increasing trend is also evident for black carbon AOD (from 0.0030–0.0080 during the 1980s to 0.0045–0.0085 in the 2010s). This global increase in carbonaceous aerosol load and consequently DREs is probably driven by an increase in wildfire occurrences, affected by climate change [109,110]. More specifically, the organic carbon DREsurfnet increased from approximately—0.25–1.75) Wm−2 during the 1980s up to –(0.75–2.5) Wm−2 during the 2010s (Figure 4v, second row). An increase in the surface cooling of similar magnitude is induced by the increase in black carbon AOD, with DREsurfnet reaching as high as −1.7 Wm−2 in the late 2010s (Figure 4vi, second row). Within the atmosphere, the warming effect due to the carbonaceous aerosols and especially the strongly light-absorbing black carbon increased, with BC DREatm being larger than 0.7 Wm−2, year-round, after approximately the mid-2010s (Figure 4vi, third row). At TOA the enhanced presence of organic carbon resulted in an increase in planetary cooling, from –(0.3–1.4) Wm−2 during the 1980s, to –(0.5–2.0) Wm−2 during the 2010s (Figure 4v, fourth row). On the other hand, black carbon, as already discussed in Section 3.1, is the only aerosol type causing a TOA warming effect, which increases during the 2000s and 2010s compared to the 1980s (0.10–0.50 Wm−2 versus 0.06–0.44 Wm−2; Figure 4vi, fourth row).
The change in aerosol load composition during the MERRA-2 period, namely the decrease in the strongly scattering volcanic sulfate aerosol loads, tends to increase the atmospheric absorption after the mid-1990s (Figure 4i, third row), when according to MERRA-2 the effect of Pinatubo vanishes. The globally averaged DREatm increased by 40% from approximately 2 Wm−2 during the 1980s and 1990s to ~2.7 Wm−2 during the 2000s and 2010s, despite the relatively small changes in total AOD (it has the same value during the 1980s, 2000s and 2010s, and approximately 10% higher during the 1990s due to Pinatubo effect).
As shown in Table S1, the decadal mean AODs and DREs are more pronounced over the Northern Hemisphere compared to the Southern and over global land compared to the ocean. However, at the TOA, the land-ocean differences are small due to the strong radiative cooling of the continental aerosols advected over the ocean, which counterbalances the lower aerosol load compared to over land. Furthermore, during the 1990s the DRETOA is even slightly larger above the global ocean compared to land. Concerning the inter-decadal changes, the increase in AOD (strongly affected by the Pinatubo eruption), and DREs from the 1980s to 1990s is more pronounced over the Southern Hemisphere compared to the Northern and above ocean compared to land, except for DREatm.
On a regional basis, as documented by the results of Table S1 (for the five selected world areas of Figure 3) and Figure S10, the decadal and interannual changes of aerosol AOD and DREs are much more pronounced. For example, over India, the AOD increased substantially (by up to about 70%) during our study period, mostly due to anthropogenic activities, attributed primarily to sulfate and secondarily to organic carbon aerosols (Figure S10) as well as natural desert dust. This increasing AOD led to a doubling of DREatm, from 5.3 Wm−2 during the 1980s to 11.7 Wm−2 during the 2010s. As shown in Figure S11, this increase in DREatm is attributed to black carbon particles, despite their load increasing less than the sulfate and organic carbon loads. This shows the strong sensitivity of atmospheric absorption of solar radiation to black carbon particles, which are the primer absorbers. At the surface of India, carbonaceous and sulfate particles contributed to a magnification of DREsurfnet, from −13.0 Wm−2 the (1980s) to −22.8 Wm−2 (2010s). The increase in the aerosol-induced surface radiatively cooling is larger than the increase in the atmospheric warming due to the enhanced absorption, resulting in a strengthening of planetary cooling over India, with stronger DRETOA during the 2010s compared to the 1980s (−11.1 Wm−2 versus −7.7 Wm−2, respectively). Similar results are found over East Asia, however, in this region, there is a slight decrease in DREsurfnet and DREatm during the 2010s due to the implementation of air pollution mitigation policies [111].

3.2.2.2. Interannual Variability and Changes during the Post 2000 Period

For the Earth Observing System period (2001–2019, during which MERRA-2 time-series are more consistent), we computed the deseasonalized AOD and DREs anomalies per aerosol type, by subtracting from each monthly AOD and DRE value the corresponding long-term (19 years) monthly mean. We then applied linear regression to the time series of calculated anomalies and computed the slopes presented in Figure 5 (AOD) and Figure 6 (DREs). The increasing (decreasing) aerosol DRE trends indicate a warming (cooling) tendency. For example, positive DREsurfnet trends are equivalent to a decreasing tendency of the aerosol-induced surface cooling, while positive DREatm is equivalent to an enhancement of the atmospheric warming. At the TOA, positive DRE trends are also indicative of warming, being associated with either a decrease in the planetary cooling or an increase in planetary warming due to aerosols (including a switching from planetary cooling to warming). According to Figure 5, both the magnitude and the sign of AOD trends vary between the different aerosol types and from one region to another, subsequently resulting in a similarly large variability of the corresponding DRE tendencies of the five aerosol types (Figure 6). Thus, we will address the four different global areas that are representative of different aerosol regimes. The statistical significance of the trends is assessed using the Mann–Kendall test [112,113]. The respective results, (i.e., the spatial distribution of statistically significant AOD and DRE trends at the confidence level of 95%) are provided in the supplement.

3.2.2.3. Anthropogenic Polluted Areas

The strongest increasing AOD trends over the globe (up to 0.08 decade−1) are observed above the heavily polluted Indian sub-continent and the adjacent northern Indian ocean. They are attributed primarily to a strong increase in the anthropogenic sulfate load and to a smaller extent to an increase in carbonaceous (mainly organic carbon) AOD. These changes result in a very strong increase in both surface cooling (negative DREsurfnet slope, up to −4.2 Wm−2decade−1) and atmospheric warming (positive DREatm slope, up to 2.0 Wm−2decade−1 locally) due to aerosols, as shown in Figure 6a-i,b-i, respectively. Although the changes (increases) of the organic carbon AOD are relatively large, they have a much smaller effect on the DREsurfnet trends compared to the effect of black carbon particles, due to their much lower forcing efficiency (attributed to their weaker absorbing ability; [44]). The light-absorbing black carbon particles are also the major contributor to the enhancement of the atmospheric warming effect over the Indian Sub-continent. The increase in the aerosol surface cooling is found to be larger (in terms of absolute values) than the increase in the atmospheric warming, especially over sea regions, where aerosols originating from the Indian subcontinent are advected. This results in an increase in the aerosol-induced planetary cooling, as indicated by a pronounced negative DRETOA trend, up to −2.2 Wm−2 locally in the Bay of Bengal and the eastern Arabian Sea (Figure 6c-i).
The reversal of the increasing anthropogenic aerosol load trend over the last decade of our study period (Section 3.2.2.1) results in relatively small and not statistically significant AOD tendencies above the heavily affected by urban/industrial pollution in East Asia and especially East China. However, according to MERRA-2, despite this reversal, the sulfate AOD slope during 2001–2019 remains positive. On the other hand, during the same period, the carbonaceous and dust AOD decreased slightly above Eastern Asia (negative slope, light bluish colors). The decrease in the black carbon AOD (Figure 5vi) is found to be the primary contributor of a strong and statistically significant reduction in the aerosol radiative surface cooling (DREsurfnet up to 3.1 Wm−2decade−1, locally) and atmospheric warming (strong negative total DREatm slope up to −3.8 Wm−2decade−1), followed by the decrease in dust and organic carbon loading, while on the Earth’s surface it is partly counterbalanced by the slight increase in the sulfate AOD. At the TOA, via the combination of the surface and atmospheric DREs variations, small and not statistically significant trends are recorded.
Over Europe and the eastern USA, the total aerosol load experienced a mostly statistically significant decrease from 2001 to 2019, up to −0.04 decade−1, driven mainly by the reduction in the anthropogenic sulfate particles associated with environmental regulations undertaken within the frameworks of the Clean Air Act and Convention on Long-range Transboundary Air Pollution [114]. The decrease in sulfate AOD is larger above the eastern USA compared to Europe (slopes up to −0.045 and −0.035 decade−1, respectively, Figure 5ii). However, above the eastern USA, the reduction in sulfate AOD is partly counterbalanced by an increase in carbonaceous particles (Figure 5v,vi) originating from a sharp increase in wildfires occurrences and burned areas over high boreal latitudes affected by climate change [115,116]. On the other hand, over Europe, there is a small decrease in dust load, especially in the southern parts of the continent, in line with the reported decrease in the Saharan dust in the Mediterranean Basin [117]. These changes of the aerosol load over Europe and East USA result in a statistically significant decrease in both the surface and the TOA aerosol cooling (reddish colors in Figure 6a-i,c-i, respectively), with slopes reaching values up to 2.0 and 1.5 Wm−2decade−1, respectively. Within the atmosphere, the aerosol-induced heating effect mostly increased over the western USA, while it decreased over Europe. These DREatm trends are statistically significant, even though their absolute slopes are smaller than 1 Wm−2decade−1.

3.2.2.4. Natural Desert and Biomass Burning Areas

As shown in Figure 5v,vi, during 2001–2019, above most parts of the globe, biomass burning aerosols (organic and black carbon) experience increasing trends. These trends are particularly pronounced in central Africa, resulting in a total AOD slope as high as 0.036 decade−1, locally. Increasing, albeit weaker, carbonaceous aerosol trends are also observed in other tropical and sub-tropical regions characterized by extensive biomass burning, such as southern Africa and mainland Southeast Asia, as well as over ocean regions, where these particles are advected, such as the tropical South Atlantic. On the other hand, the carbonaceous aerosol load strongly decreased over parts of maritime Southeast Asia and especially Indonesia (−0.15 decade−1), while increasing and decreasing trends are evident over both South America and East Asia. Similar results, revealing an increasing frequency of occurrence of carbonaceous aerosol particles in many parts of the globe characterized by extensive biomass burning, such as southern Africa, south Atlantic and mainland Southeast Asia, are also reported by [79] for a slightly different time period (2005–2019). Carbonaceous aerosols also experience strong increasing trends in boreal regions of North America (Canada) and Asia, resulting in an increase in the total AOD up to 0.055 decade−1, locally. Most AOD trends associated with biomass burning are found to be statistically significant (except for parts of south-eastern Asia).
Over central-southern Africa, the aerosol-induced surface cooling and atmospheric warming increased by up to −4.2 and 4.5 Wm−2decade−1, respectively. Since the trends of DREatm and DREsurfnet largely negate each other, changes in DRETOA over central-southern Africa are relatively small, with slopes ranging between −0.7 and 0.5 Wm−2decade−1. On the other hand, over boreal Asia and Canada, where the black carbon load is lower, the increasing aerosol surface cooling exceeds the corresponding increasing atmospheric warming, resulting in an overall increase in the planetary (TOA) cooling effect of aerosols, by up to 2.1 Wm−2decade−1.
According to MERRA-2, during 2001–2019 dust AOD demonstrates both increasing and decreasing trends (Figure 5iii). More specifically, strong and most statistically significant increasing trends, up to 0.040 decade−1, are evident above parts of the Arabian Peninsula, the Red Sea and the Persian Gulf, in agreement with previous studies suggesting an increase in dust activity in the Arabian Desert in recent years (e.g., [77,117,118,119]). Dust trends dominate the increasing AOD trends over these areas except for the eastern Arabian Sea, where they come after the sulfate trends from particles advected from the Indian Subcontinent. Dust AOD also increased over the Taklamakan Desert (up to 0.050 decade−1, Figure 5iii), in agreement with satellite-based studies [77], where it drives the observed very strong AOD trends (up to 0.055 decade−1). On the other hand, dust AOD decreased above most of the Sahara Desert (up to −0.045 decade−1 in the north-west), with increasing trends found only in a few cells in the central Sahara and near the Red Sea. These results agree with other recent studies using different datasets [117,120] in terms of the decreasing AOD trends over the north-eastern parts of the Sahara Desert (Libyan Desert), although these studies report more prominent increasing trends above North Africa, especially over the western Sahara. The encountered differences in AOD trends with these studies should be attributed to the use of different aerosol databases. For example, according to [120] the trends based on MERRA-2 data are closer to those derived from MODIS-Terra than MODIS-Aqua data. Given that satellite (MODIS, MISR) data are assimilated in MERRA for the period after 2000, it is possible that they can affect the MERRA based AOD trends presented in this study. It is important to mention that MERRA-2 assimilated MISR data until June 2014 above regions characterized by high surface albedo [51]. However, MISR data are overestimated compared to both MODIS-Terra and Aqua in North Africa [121,122], which may produce discontinuity and affect the AOD there. To examine this, we compared the total AOD derived from MODIS-Terra, MODIS-Aqua and MISR and we found that after the cessation of the MISR assimilation, MERRA-2 AOD approached that of MODIS-Terra and Aqua (results not shown here). Based on these findings, concerns arise regarding a possible introduction of an erroneous negative AOD trend in MERRA-2 AOD time-series above North Africa, but a more detailed investigation is needed, which is beyond the scope of this study.
According to our model results, the increasing AOD over the Arabian Peninsula results in an increase in both aerosol radiative surface cooling and atmospheric warming by up to 2 Wm−2decade−1, locally. Larger trends are evident over the Taklamakan desert, where DREsurfnet and DREatm slopes reach values as high as −2.9 and 2.1 Wm−2decade−1, respectively. Over the western parts of Sahara and the Atlas Mountains, the surface cooling and atmospheric warming decreased, locally, by up to 3.0 Wm−2decade−1 (positive slope) and 2.2 Wm−2decade−1 (negative slope), respectively. On the other hand, DREsurfnet and DREatm exhibit slight increasing trends in some parts of the central and eastern Saharan Desert. Above most dust-dominated land regions of the planet, the DRETOA trends are relatively small (generally less than 0.5 Wm−2decade−1). Larger trends are only observed over the Atlas Mountains, where the TOA cooling decreased by 1.2 Wm−2decade−1 (positive slope in Figure 5i) and over the Taklamakan Desert, where the TOA cooling increased by up to 1.0 Wm−2decade−1 (negative slope in Figure 5i). On the other hand, changes in the aerosol load have a more pronounced impact on both DRETOA and DREsurfnet above the sea compared to their source regions. Characteristically, over the Persian Gulf and the Red Sea, the aerosol-induced surface and TOA cooling increased by up to 4.0 and 1.5 Wm−2decade−1, respectively. Over the same regions, the DREatm slopes are lower than those of DREsurfnet, and not exceeding 2 Wm−2decade−1. These results can be explained by the fact that, as discussed in Section 3.1, the aerosol surface cooling potential is much larger above low-albedo dark oceans than over high-albedo deserts, contrary to a lower atmospheric warming potential, resulting eventually in a particularly large planetary cooling potential. Therefore, above low albedo ocean regions, a similar change in the aerosol load results in a larger change of DREsurfnet and DRETOA, and a smaller change on DREatm, compared to what happens above bright surfaces, as documented by our results.

3.2.2.5. Areas with Combined Natural and Anthropogenic Aerosols

Over the Mediterranean basin, the dust load decreased during 2001–2019, especially in its southern and western parts, in agreement with the results presented in previous studies (e.g., [93,117]). The sulfate load also experienced decreasing trends (albeit of lower magnitude than desert dust), affected by the reduction in anthropogenic emissions in Europe [104]. The decreasing tendencies of dust and sulfate AOD are partly counterbalanced by a small increase in sea salt and a larger increase in carbonaceous AOD, associated possibly with both locally produced and long-range transported biomass burning aerosols [123]. Overall, the total aerosol load over the Mediterranean decreased by up to 0.25 decade−1, with the stronger trends observed in its western and southern parts. According to our model results, in the broader Mediterranean Basin, the aerosol-induced surface radiative cooling (DREsurfnet) decreased by up to 2.0 Wm−2decade−1 offshore northwestern Africa, mostly driven by the decrease in dust and secondarily sulfate AOD, and slightly counterbalanced by the increase in the load of the carbonaceous particles. Similarly, in accordance with the changes of the load of these specific aerosol types, the aerosol atmospheric absorption DREatm decreased by up to 0.7 Wm−2decade−1. However, the changes of DREatm are much lower than those of DREsurfnet, and therefore the aerosol-induced planetary cooling over the Mediterranean decreased relatively strongly, with slopes reaching values as high as 1.3 Wm−2decade−1. The AOD and DRE trends over most of the Mediterranean Basin are found to be statistically significant.

3.2.2.6. Remote Clean Areas

Above remote clean areas, the AOD and DRE trends after 2000 are generally small. However, relatively larger and statistically significant increasing trends are observed over mid- to high-latitude ocean regions of the Southern Hemisphere, namely the Southern Ocean (slope values up to 0.014 decade−1). These trends are driven by an increase in the wind-blown sea salt particles AOD, possibly associated with an increased wind speed [124]. The enhanced presence of almost-purely scattering sea salt particles over this region, results in an increase in the magnitude of the surface and TOA aerosol cooling effects, by up to 0.65 and 0.60 Wm−2decade−1, respectively.
Although the trends over the Arctic are not statistically significant, they deserve to be briefly addressed, due to the strong climatic sensitivity of this word region. According to MERRA-2, the AOD trends are characterized by mostly increasing tendencies, albeit small (slope less than 0.01 decade−1) due to an increase in carbonaceous load, which is however partly counterbalanced by a decrease in the other particle types, in particular sulfate and dust. These AOD changes result in an increase in both the aerosol-induced radiative surface cooling (by up to 1.3 Wm−2decade−1) and atmospheric warming (up to 0.3 Wm−2) above most parts of the Arctic, yielding overall a TOA cooling tendency over the Arctic, with DRETOA slopes reaching −1.3 Wm−2decade−1. Ref. [95] reported an arctic TOA warming tendency between 1980 and 2018, driven mainly by a decrease in sulfate aerosol loads due to the reduction in emissions from Europe, Russia and local Arctic sources. Based on MERRA-2 data, we found a similar warming for the whole study period (1980–2019; Figures S10 and S11). The results for the 2001–2019 period are strongly affected by the extensive biomass burning in boreal regions in recent years [125,126] and indicate a reversal of the previously decreasing tendencies of AOD and DREs.

4. Summary and Conclusions

In the present study, a detailed estimation of aerosol speciated (sulfate, dust, sea salt, organic carbon and black carbon aerosols), as well as total aerosol DREs within the Earth-Atmosphere system, is performed at global scale and on a climatological basis (40 years; 1980–2019), using a detailed spectral radiation transfer model (FORTH) and the MERRA-2 aerosol reanalysis. The detailed spatiotemporal resolution and the long-term coverage enable the derivation of useful conclusions about the climatic role of aerosols, which are summarized below.
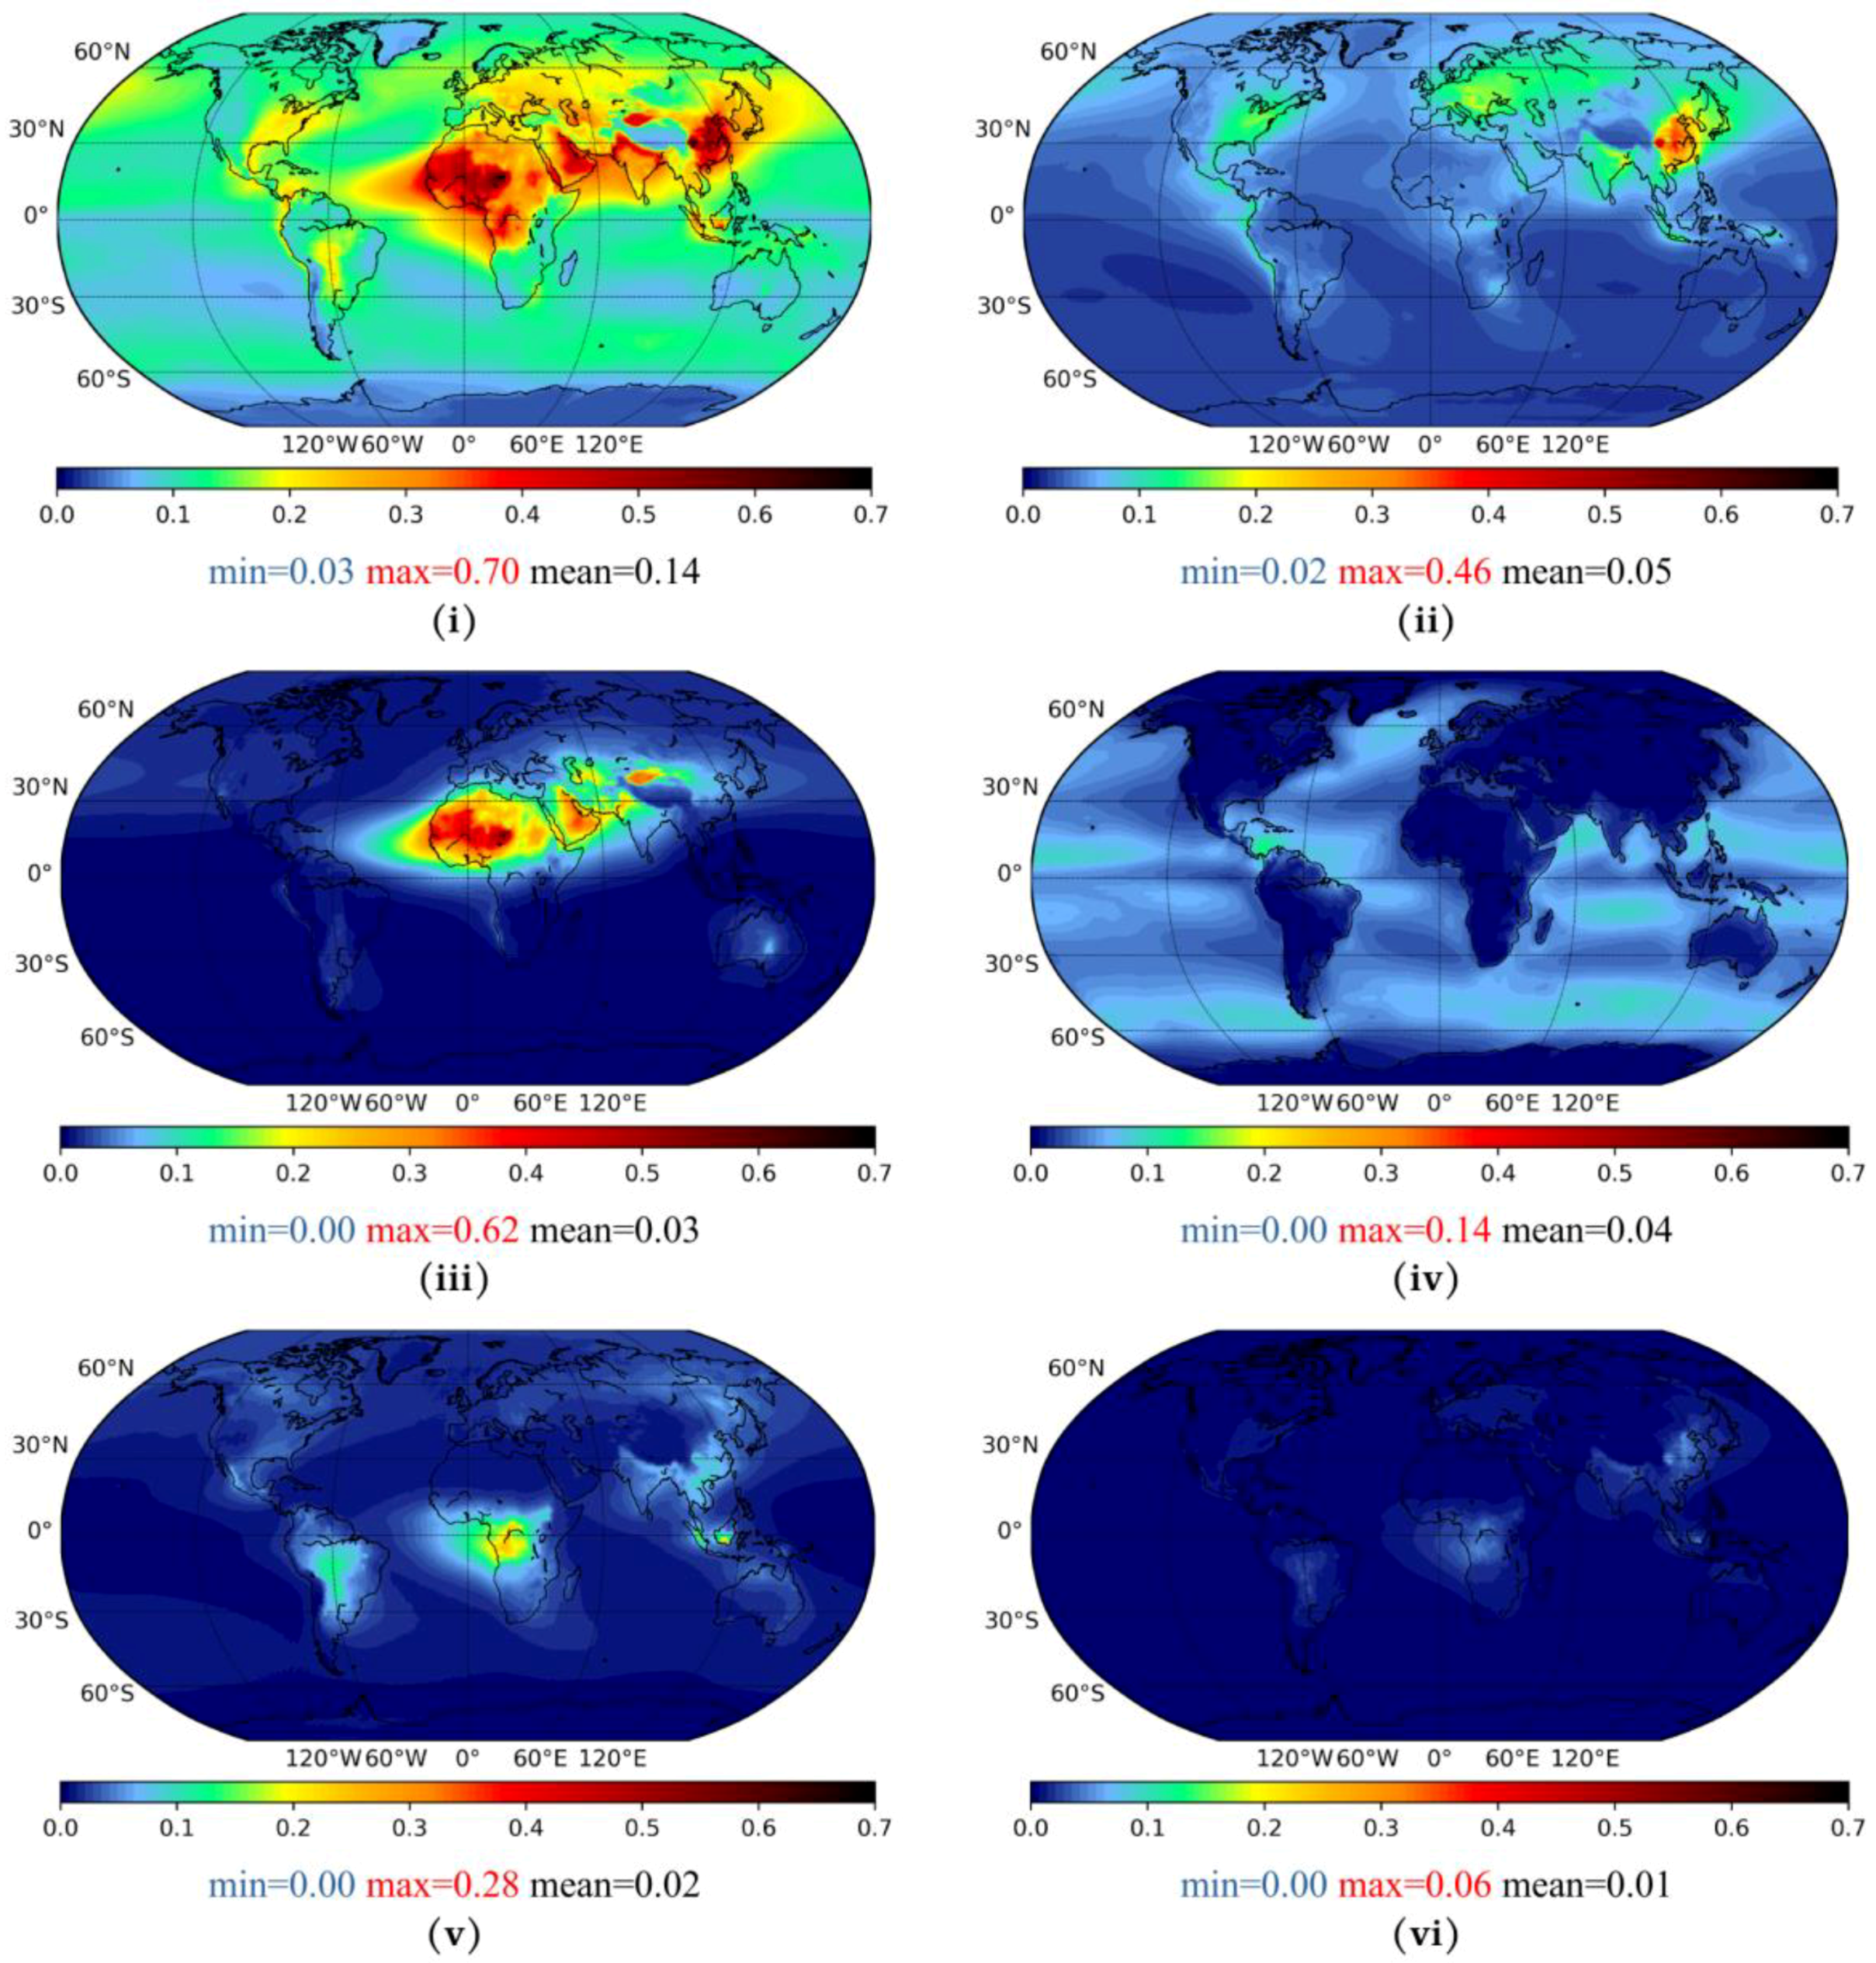
  • MERRA-2 successfully reproduces well-known spatiotemporal patterns of globally distributed AOD, for all aerosol types considered in the current study, over source, nearby and downwind areas.
  • The global 40-year mean AOD is equal to 0.14, with monthly values mainly ranging from 0.1 to 0.15, rising up to about 0.3 during the great volcanic eruptions of El Chichón and Pinatubo in the 1980s and 1990s, respectively.
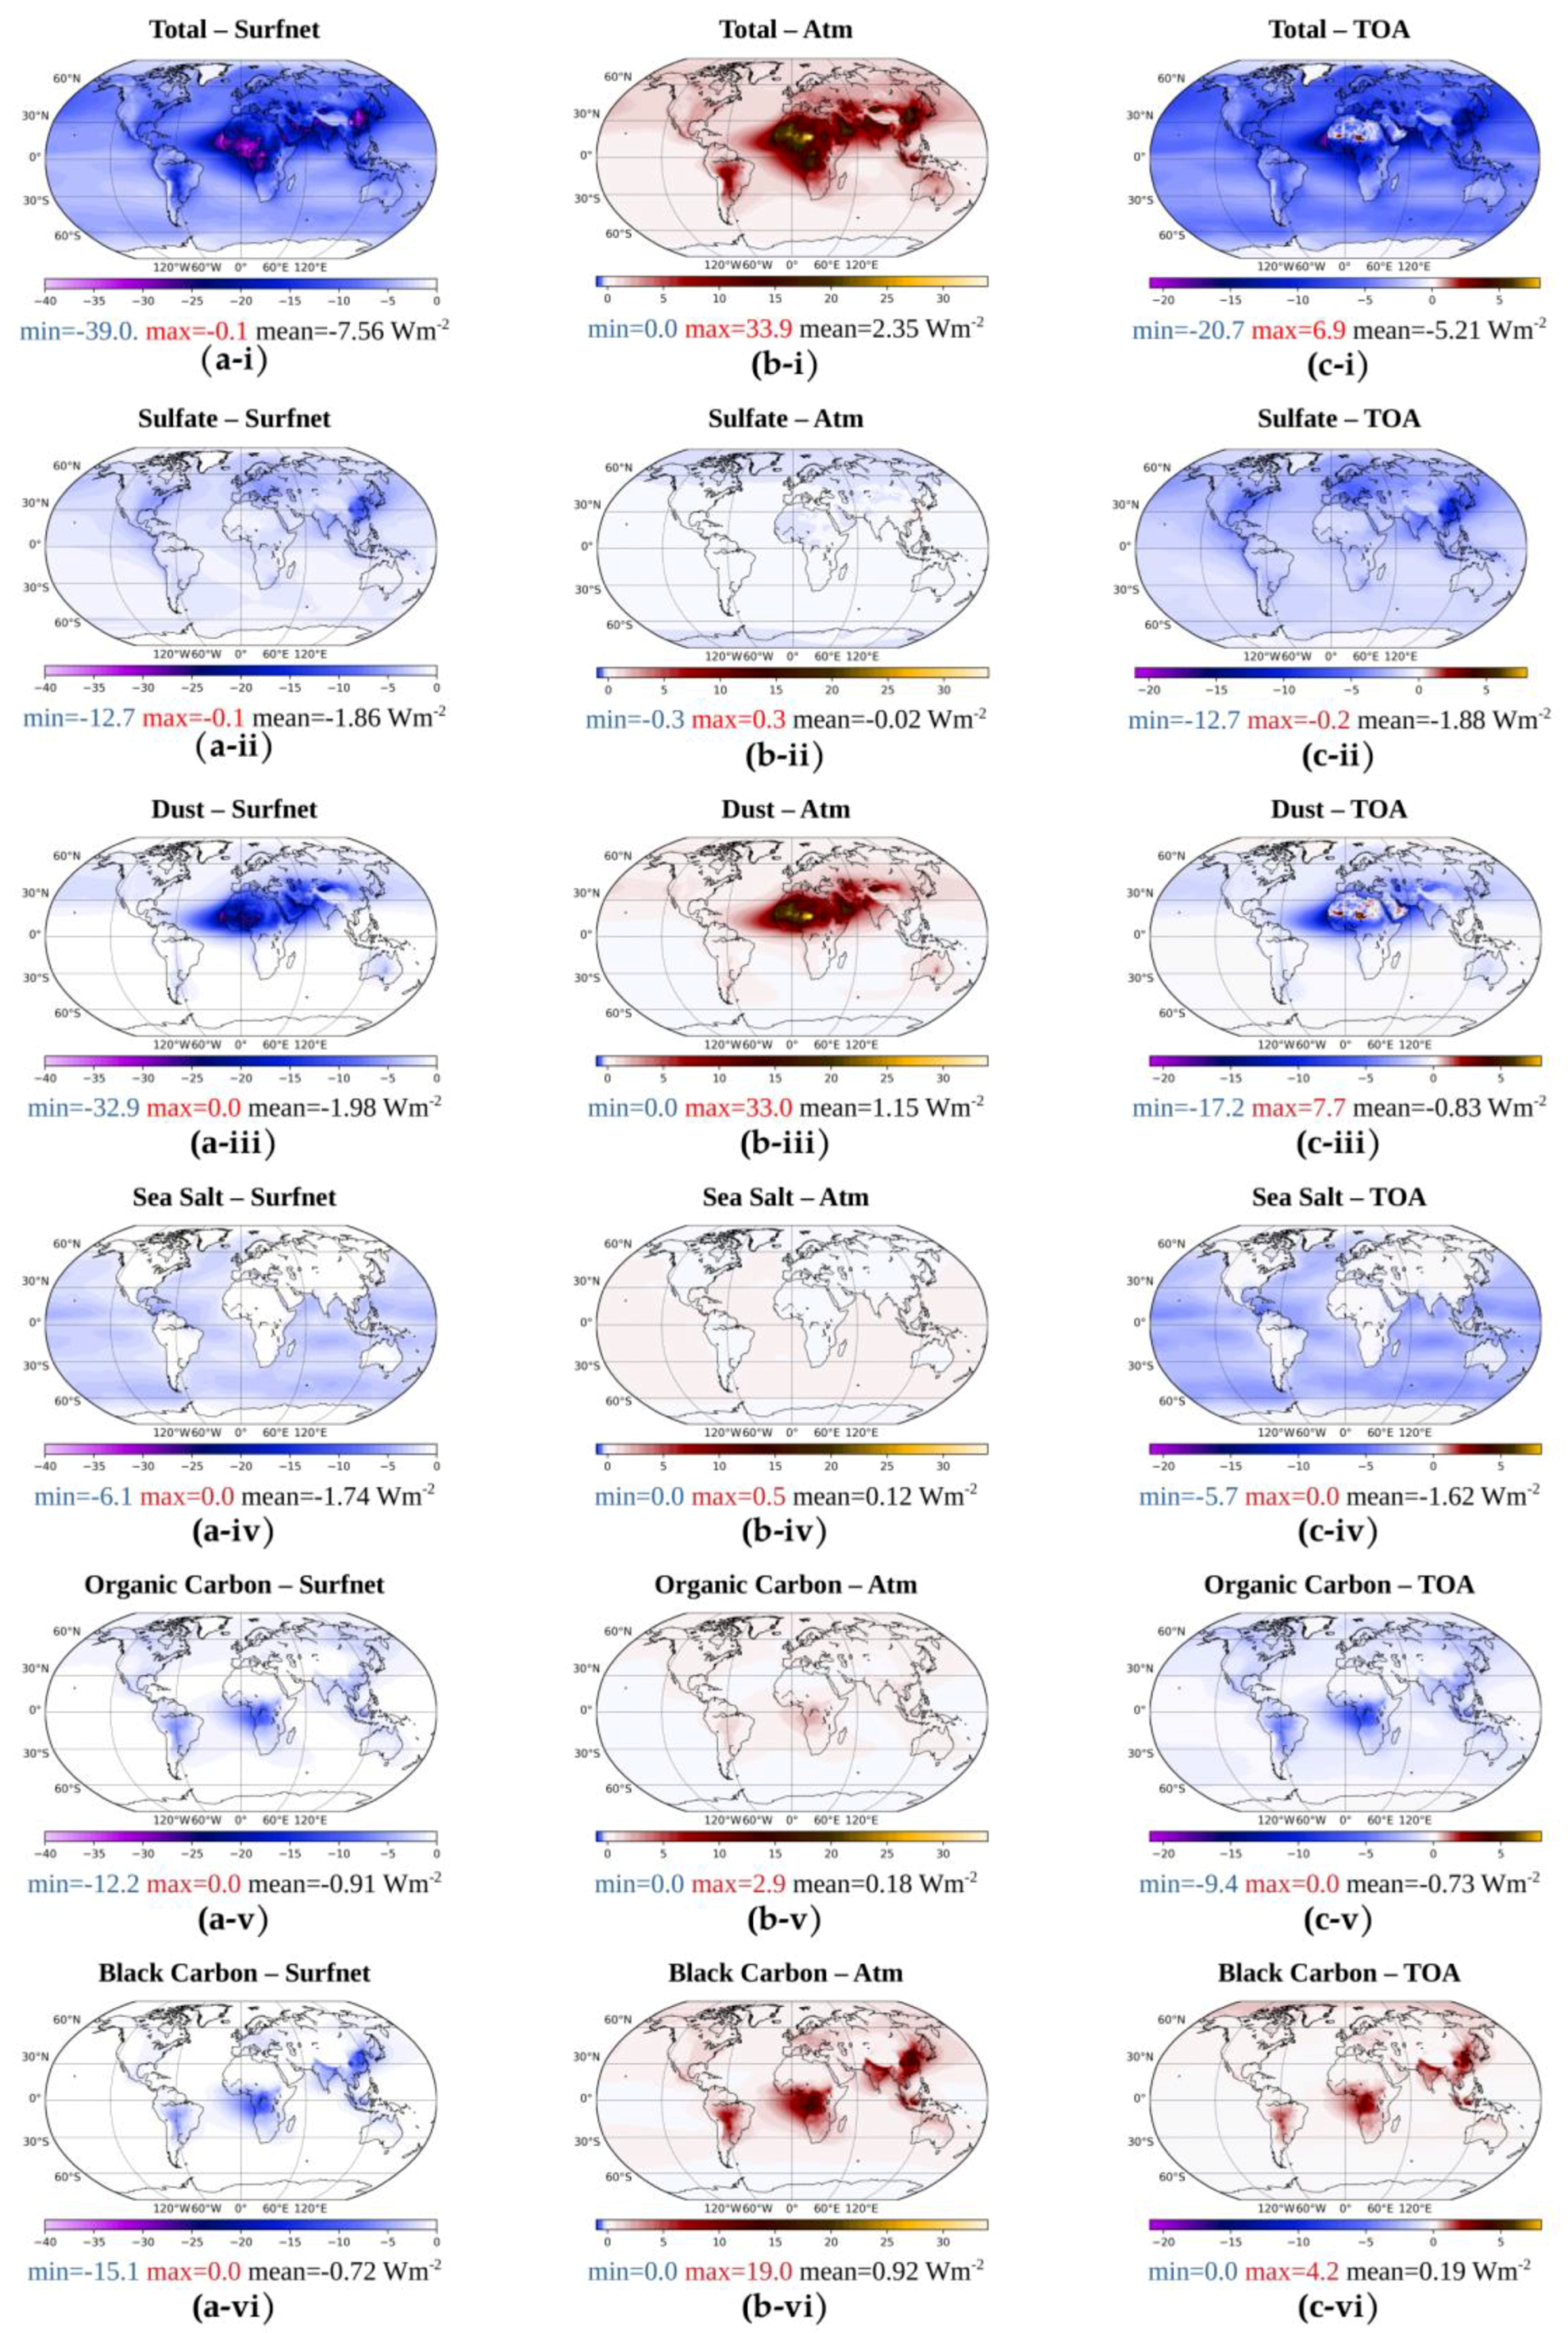
  • In general, aerosols cause a radiative cooling at the Earth’s surface and at TOA, equivalent to −7.6 and −5.2 Wm−2, respectively, and an atmospheric warming of 2.4 Wm−2. However, the DREs strongly depend on AOD, the aerosol type, and the underlying surface properties, mainly the albedo, thus exhibiting a significant geographic and seasonal variation.
  • The worldwide highest surface radiative cooling effect, equal to −39 Wm−2 locally, is found over East and South Asia, and specifically over China, and is attributed primarily to the anthropogenic sulfate particles and black carbon, followed by desert dust.
  • Strong surface cooling is also produced by dust aerosols over the Sahara and Arabian deserts, as well as over adjacent ocean regions where dust and carbonaceous aerosols are transported.
  • The largest atmospheric warming effect globally, equal to 33.9 Wm−2, is found over the southern and south-western parts of the Sahara, induced by dust. In general, the aerosol surface cooling effect is larger than the corresponding atmospheric warming, yielding an overall planetary cooling, as large as −20.7 Wm−2, but near-cancellation between the DREsurfnet and DREatm can result in a small planetary cooling or even a planetary warming (up to 6.9 Wm−2 locally, over the bright surfaces of the southern Sahara).
  • The light-absorbing aerosols, primarily black carbon and secondarily dust, have the strongest radiative forcing efficiency both in the atmosphere and the surface of the Earth.
  • The quite large dust AOD, combined with its strong ARFE, result in very pronounced global mean surface and atmospheric radiative effects (DREsurfnet and DREatm equal to −1.98 and 1.15 Wm−2, respectively) which are the largest among all aerosol types.
  • Due to their small atmospheric warming and their pronounced surface cooling effects, the scattering sulfate and sea salt aerosols cause the strongest planetary cooling (DRETOA −1.88 and −1.62 Wm−2, respectively).
  • The strongly absorbing black carbon is the only aerosol type inducing a planetary warming effect, equal to 0.19 Wm−2.
  • The almost purely scattering sea salt and sulfate aerosols have non-negligible atmospheric warming and cooling global effects (DREatm equal to 0.12 and −0.02 Wm−2, respectively), the sign of which is determined by the altitude of the scattering aerosol layer and the presence of other aerosol types.
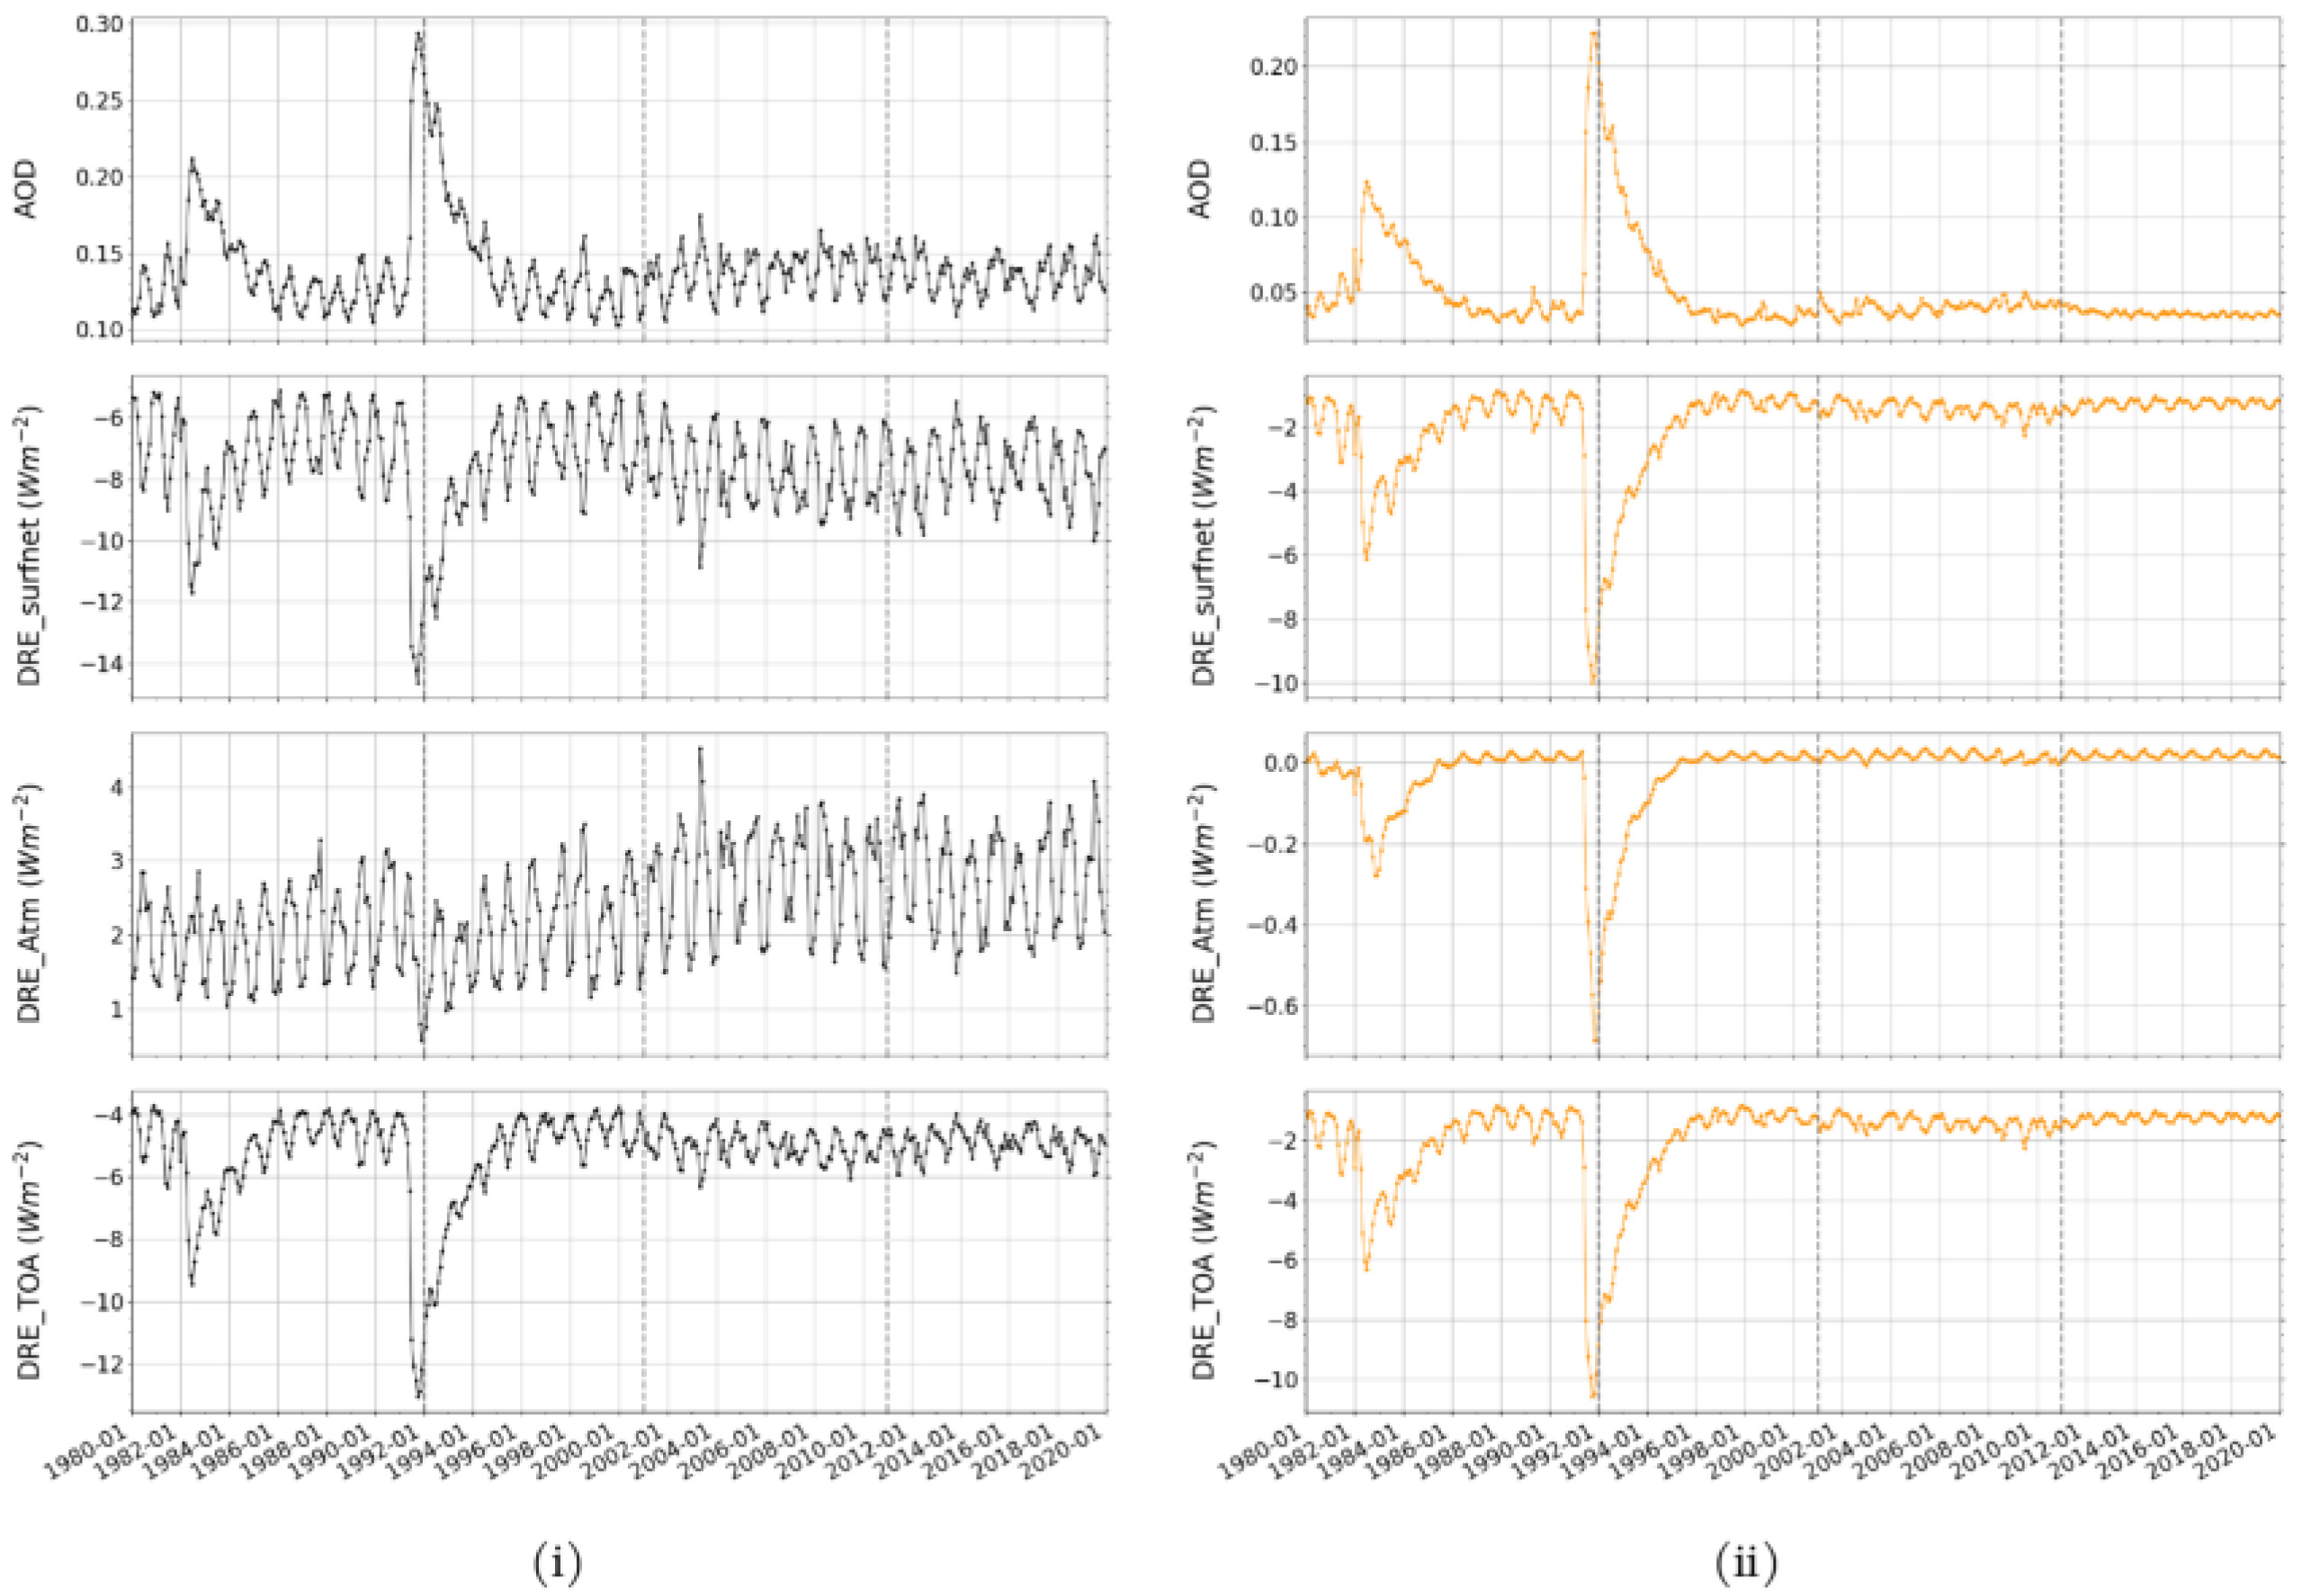
  • The most remarkable feature of the inter-annual variability of MERRA-2 total AOD and DREs is the distinct and relatively long-lasting impact of large-scale volcanic eruptions (El Chichón and Pinatubo in the early 1980s and early 1990s, respectively) through the emitted sulfate particles.
  • The decrease in the strongly scattering sulfate aerosols (by the El Chichón and Pinatubo eruptions) after the mid-1990s, led to an increase in the solar atmospheric absorption. In parallel, our results show increasing absorption from dust, organic and black carbon aerosols.
  • The volcanic sulfate aerosols associated with the El Chichón and Pinatubo volcanic eruptions substantially decreased the mean global net surface solar radiation in the early 1980s (by up to 6 Wm−2) and the early 1990s (by up to 10 Wm−2). During these eruptions the mean global net SSR decreased due to all aerosols by up to 12 and 14.5 Wm−2, respectively, while the aerosol planetary cooling effect reached values up to about 9.5 and 13 Wm−2.
  • The large reduction in sulfur emissions mainly in Europe and North America has been largely counterbalanced by an increase in sulfate aerosol load over India and East Asia, resulting in unchanging sulfate aerosol DREs over the 40-year period (1980–2019).
  • A pronounced increase in carbonaceous aerosols was found during the study period, associated with increasing wildfires, which increased the magnitudes of the associated DREs.
  • The decadal and inter-annual changes of aerosol AOD and DREs are much more pronounced on a regional basis. Thus, over India the AOD increased by up to 70% from 1980 to 2019, due to enhanced anthropogenic activities (primarily sulfate and secondarily carbonaceous aerosols), leading to a doubling of DREatm (from 5.3 Wm−2 in the 1980s to 11.7 Wm−2 in the 2010s), primarily attributed to black carbon particles.
Our apportionment of the total aerosol DREs to every aerosol type, highlights their different radiative impacts in terms of not only the magnitude, but also the sign, quantifying the strong spatial and temporal variability of aerosol speciated DREs. The obtained results highlight the strong radiative effect and climatic role of the absorbing aerosols, underlining the need for accurate estimations. Such estimations strongly depend on the aerosol particle absorptivity (namely the single scattering albedo), which needs to be more accurately derived from satellite observations, enabling global and multi-year coverage.
Finally, we reveal some probably unexpected radiative effects, like the increased columnar atmospheric absorption caused by sulfate and sea salt scattering aerosols, which depends on the elevation of the aerosol layer. This dependence emphasizes the need for consideration of the vertical distribution of aerosol optical properties and the presence of clouds (all-sky DREs), even more so for all-sky aerosol DREs, an analysis that is under preparation.

Supplementary Materials

The following are available online at https://www.mdpi.com/article/10.3390/atmos12101254/s1, Figure S1(i): Mean seasonal (1980–2019) global distribution of MERRA-2 Optical Depth at the wavelength of 550 nm for the total aerosol load. (a) winter, (b) spring, (c) summer, (d) autumn, Figure S1(ii): Mean seasonal (1980–2019) global distribution of MERRA-2 Optical Depth at the wavelength of 550 nm for sulfate particles. (a) winter, (b) spring, (c) summer, (d) autumn, Figure S1(iii): Mean seasonal (1980–2019) global distribution of MERRA-2 Optical Depth at the wavelength of 550 nm for dust particles. (a) winter, (b) spring, (c) summer, (d) autumn, Figure S1(iv): Mean seasonal (1980–2019) global distribution of MERRA-2 Optical Depth at the wavelength of 550 nm for sea salt particles. (a) winter, (b) spring, (c) summer, (d) autumn, Figure S1(v): Mean seasonal (1980–2019) global distribution of MERRA-2 Optical Depth at the wavelength of 550 nm for organic carbon particles. (a) winter, (b) spring, (c) summer, (d) autumn, Figure S1(vi): Mean seasonal (1980–2019) global distribution of MERRA-2 Optical Depth at the wavelength of 550 nm for black carbon particles. (a) winter, (b) spring, (c) summer, (d) autumn, Figure S2: Mean (1980–2019) global distribution of total aerosol Direct Radiative Effects (i) at the Earth’s surface, (ii) within the Atmosphere and (iii) at the Top Of the Atmosphere, during (a) winter, (b) spring, (c) summer and (d) autumn, Figure S3: Mean (1980–2019) global distribution of sulfate aerosol Direct Radiative Effects (i) at the Earth’s surface, (ii) within the Atmosphere and (iii) at the Top Of the Atmosphere, during (a) winter, (b) spring, (c) summer and (d) autumn, Figure S4: Mean (1980–2019) global distribution of dust aerosol Direct Radiative Effects (i) at the Earth’s surface, (ii) within the Atmosphere and (iii) at the Top Of the Atmosphere, during (a) winter, (b) spring, (c) summer and (d) autumn, Figure S5: Mean (1980–2019) global distribution of sea salt aerosol Direct Radiative Effects (i) at the Earth’s surface, (ii) within the Atmosphere and (iii) at the Top Of the Atmosphere, during (a) winter, (b) spring, (c) summer and (d) autumn, Figure S6: Mean (1980–2019) global distribution of organic carbon aerosol Direct Radiative Effects (i) at the Earth’s surface, (ii) within the Atmosphere and (iii) at the Top Of the Atmosphere, during (a) winter, (b) spring, (c) summer and (d) autumn, Figure S7: Mean (1980–2019) global distribution of black carbon aerosol Direct Radiative Effects (i) at the Earth’s surface, (ii) within the Atmosphere and (iii) at the Top Of the Atmosphere, during (a) winter, (b) spring, (c) summer and (d) autumn, Figure S8: Slopes of deseasonalized MERRA-2 Optical Depth anomalies at the wavelength of 550 nm, over the period 2001–2019, for: (i) total aerosol load, (ii) sulfate, (iii) dust, (iv) sea salt, (v) organic carbon and (vi) black carbon particles. Only 0.5° × 0.625° cells where trends are statistically significant at a 95% confidence level are shown (units are decade−1), Figure S9: Slopes of deseasonalized Direct Radiative Effects anomalies over the period 2001–2019: (a) at the Earth’s surface, (b) within the Atmosphere and (c) at the Top Of the Atmosphere. (i) total aerosol load, (ii) sulfate, (iii) dust, (iv) sea salt, (v) organic carbon and (vi) black carbon particles. Only 0.5° × 0.625° cells where trends are statistically significant at a 95% confidence level are shown (units are Wm−2decade−1), Figure S10: Slopes of deseasonalized MERRA-2 Optical Depth anomalies at the wavelength of 550 nm, over the period 1980-2019, for: (i) total aerosol load, (ii) sulfate, (iii) dust, (iv) sea salt, (v) organic carbon and (vi) black carbon particles (units are decade−1), Figure S11: Slopes of deseasonalized Direct Radiative Effects anomalies over the period 1980–2019: (a) at the Earth’s surface, (b) within the Atmosphere and (c) at the Top Of the Atmosphere. (i) total aerosol load, (ii) sulfate, (iii) dust, (iv) sea salt, (v) organic carbon and (vi) black carbon particles. (units are Wm−2decade−1). Table S1: Decadal total aerosol AOD and DREs (in Wm−2) over: the globe, the North and South Hemispheres, global land and global ocean areas and five selected world regions (Saharan and Arabian Deserts, Southern Africa, India, East Asia and Mediterranean).

Author Contributions

Conceptualization, N.H. and A.G.; methodology, N.H., C.M., A.G. and M.-B.K.-C.; software, N.H., C.M. and M.-B.K.-C.; validation, N.H., C.M., A.G. and M.-B.K.-C.; formal analysis, A.G. and M.-B.K.-C.; investigation, A.G. and M.-B.K.-C.; resources, N.H.; data curation, A.G. and M.-B.K.-C.; writing—original draft preparation, N.H., C.M., A.G. and M.-B.K.-C.; writing—review and editing, N.H., C.M., A.G. and M.-B.K.-C.; visualization, A.G. and M.-B.K.-C.; supervision, N.H. and C.M.; project administration, N.H.; funding acquisition, N.H. All authors have read and agreed to the published version of the manuscript.

Funding

This research has been co-financed by the Operational Program “Human Resources Development, Education and Lifelong Learning” and is co-financed by the European Union (European Social Fund) and Greek national funds.

Institutional Review Board Statement

Not applicable.

Informed Consent Statement

Not applicable.

Data Availability Statement

The data presented in this study are available on request from the corresponding author.

Acknowledgments

This research is implemented through the Operational Program “Human Resources Development, Education and Lifelong Learning”.

Conflicts of Interest

The authors declare no conflict of interest.

References

  1. Stocker, T. Climate Change 2013: The Physical Science Basis: Working Group I Contribution to the Fifth Assessment Report of the Intergovernmental Panel on Climate Change; Cambridge University Press: Cambridge, UK, 2014; ISBN 1-107-05799-X. [Google Scholar]
  2. Bellouin, N.; Quaas, J.; Gryspeerdt, E.; Kinne, S.; Stier, P.; Watson-Parris, D.; Boucher, O.; Carslaw, K.S.; Christensen, M.; Daniau, A.-L. Bounding Global Aerosol Radiative Forcing of Climate Change. Rev. Geophys. 2020, 58, e2019RG000660. [Google Scholar] [CrossRef]
  3. Hoesly, R.M.; Smith, S.J.; Feng, L.; Klimont, Z.; Janssens-Maenhout, G.; Pitkanen, T.; Seibert, J.J.; Vu, L.; Andres, R.J.; Bolt, R.M. Historical (1750–2014) Anthropogenic Emissions of Reactive Gases and Aerosols from the Community Emissions Data System (CEDS). Geosci. Model Dev. 2018, 11, 369–408. [Google Scholar] [CrossRef]
  4. Kristiansen, N.I.; Stohl, A.; Wotawa, G. Atmospheric Removal Times of the Aerosol-Bound Radionuclides 137 Cs and 131 I Measured after the Fukushima Dai-Ichi Nuclear Accident–a Constraint for Air Quality and Climate Models. Atmos. Chem. Phys. 2012, 12, 10759–10769. [Google Scholar] [CrossRef]
  5. Solomon, S.; Manning, M.; Marquis, M.; Qin, D. Climate Change 2007-the Physical Science Basis: Working Group I Contribution to the Fourth Assessment Report of the IPCC; Cambridge University Press: Cambridge, UK, 2007; Volume 4, ISBN 0-521-70596-7. [Google Scholar]
  6. Myhre, G.; Samset, B.H.; Schulz, M.; Balkanski, Y.; Bauer, S.; Berntsen, T.K.; Bian, H.; Bellouin, N.; Chin, M.; Diehl, T. Radiative Forcing of the Direct Aerosol Effect from AeroCom Phase II Simulations. Atmos. Chem. Phys. 2013, 13, 1853–1877. [Google Scholar] [CrossRef]
  7. Aitken, J. Dust, Fogs, and Clouds. Nature 1881, 23, 384–385. [Google Scholar] [CrossRef]
  8. Köhler, H. The Nucleus in and the Growth of Hygroscopic Droplets. Trans. Faraday Soc. 1936, 32, 1152–1161. [Google Scholar] [CrossRef]
  9. Twomey, S. Pollution and the Planetary Albedo. Atmos. Environ. 1974, 8, 1251–1256. [Google Scholar] [CrossRef]
  10. Coopman, Q.; Riedi, J.; Finch, D.P.; Garrett, T.J. Evidence for Changes in Arctic Cloud Phase Due to Long-range Pollution Transport. Geophys. Res. Lett. 2018, 45, 10709–10718. [Google Scholar] [CrossRef]
  11. Norgren, M.S.; de Boer, G.; Shupe, M.D. Observed Aerosol Suppression of Cloud Ice in Low-Level Arctic Mixed-Phase Clouds. Atmos. Chem. Phys. 2018, 18, 13345–13361. [Google Scholar] [CrossRef]
  12. Richardson, T.B.; Forster, P.M.; Andrews, T.; Parker, D.J. Understanding the Rapid Precipitation Response to CO2 and Aerosol Forcing on a Regional Scale. J. Clim. 2016, 29, 583–594. [Google Scholar] [CrossRef]
  13. Hansen, J.; Sato, M.K.I.; Ruedy, R.; Nazarenko, L.; Lacis, A.; Schmidt, G.A.; Russell, G.; Aleinov, I.; Bauer, M.; Bauer, S. Efficacy of Climate Forcings. J. Geophys. Res. Atmos. 2005, 110, D18. [Google Scholar] [CrossRef]
  14. Shine, K.P.; Cook, J.; Highwood, E.J.; Joshi, M.M. An Alternative to Radiative Forcing for Estimating the Relative Importance of Climate Change Mechanisms. Geophys. Res. Lett. 2003, 30. [Google Scholar] [CrossRef]
  15. Hansen, J.; Sato, M.; Ruedy, R. Radiative Forcing and Climate Response. J. Geophys. Res. Atmos. 1997, 102, 6831–6864. [Google Scholar] [CrossRef]
  16. Ackerman, A.S.; Toon, O.B.; Taylor, J.P.; Johnson, D.W.; Hobbs, P.V.; Ferek, R.J. Effects of Aerosols on Cloud Albedo: Evaluation of Twomey’s Parameterization of Cloud Susceptibility Using Measurements of Ship Tracks. J. Atmos. Sci. 2000, 57, 2684–2695. [Google Scholar] [CrossRef]
  17. Stjern, C.W.; Samset, B.H.; Myhre, G.; Forster, P.M.; Hodnebrog, Ø.; Andrews, T.; Boucher, O.; Faluvegi, G.; Iversen, T.; Kasoar, M. Rapid Adjustments Cause Weak Surface Temperature Response to Increased Black Carbon Concentrations. J. Geophys. Res. Atmos. 2017, 122, 11462–11481. [Google Scholar] [CrossRef]
  18. Christopher, S.A.; Jones, T. Satellite-based Assessment of Cloud-free Net Radiative Effect of Dust Aerosols over the Atlantic Ocean. Geophys. Res. Lett. 2007, 34. [Google Scholar] [CrossRef]
  19. Pérez, C.; Nickovic, S.; Pejanovic, G.; Baldasano, J.M.; Özsoy, E. Interactive Dust-radiation Modeling: A Step to Improve Weather Forecasts. J. Geophys. Res. Atmos. 2006, 111. [Google Scholar] [CrossRef]
  20. Gkikas, A.; Obiso, V.; Perez Garcia-Pando, C.; Jorba, O.; Hatzianastassiou, N.; Vendrell, L.; Basart, S.; Solomos, S.; Gassó, S.; Baldasano, J.M. Direct Radiative Effects during Intense Mediterranean Desert Dust Outbreaks. Atmos. Chem. Phys. 2018, 18, 8757–8787. [Google Scholar] [CrossRef]
  21. Gkikas, A.; Giannaros, T.M.; Kotroni, V.; Lagouvardos, K. Assessing the Radiative Impacts of an Extreme Desert Dust Outbreak and the Potential Improvements on Short-Term Weather Forecasts: The Case of February 2015. Atmos. Res. 2019, 226, 152–170. [Google Scholar] [CrossRef]
  22. Nabat, P.; Somot, S.; Mallet, M.; Michou, M.; Sevault, F.; Driouech, F.; Meloni, D.; Di Sarra, A.; Di Biagio, C.; Formenti, P. Dust Aerosol Radiative Effects during Summer 2012 Simulated with a Coupled Regional Aerosol–Atmosphere–Ocean Model over the Mediterranean. Atmos. Chem. Phys. 2015, 15, 3303–3326. [Google Scholar] [CrossRef]
  23. Haywood, J.M.; Ramaswamy, V.; Soden, B.J. Tropospheric Aerosol Climate Forcing in Clear-Sky Satellite Observations over the Oceans. Science 1999, 283, 1299–1303. [Google Scholar] [CrossRef]
  24. Haywood, J.M.; Allan, R.P.; Culverwell, I.; Slingo, T.; Milton, S.; Edwards, J.; Clerbaux, N. Can Desert Dust Explain the Outgoing Longwave Radiation Anomaly over the Sahara during July 2003? J. Geophys. Res. Atmos. 2005, 110. [Google Scholar] [CrossRef]
  25. Kinne, S.; Schulz, M.; Textor, C.; Guibert, S.; Balkanski, Y.; Bauer, S.E.; Berntsen, T.; Berglen, T.F.; Boucher, O.; Chin, M. An AeroCom Initial Assessment–Optical Properties in Aerosol Component Modules of Global Models. Atmos. Chem. Phys. 2006, 6, 1815–1834. [Google Scholar] [CrossRef]
  26. Schulz, M.; Textor, C.; Kinne, S.; Balkanski, Y.; Bauer, S.; Berntsen, T.; Berglen, T.; Boucher, O.; Dentener, F.; Guibert, S. Radiative Forcing by Aerosols as Derived from the AeroCom Present-Day and Pre-Industrial Simulations. Atmos. Chem. Phys. 2006, 6, 5225–5246. [Google Scholar] [CrossRef]
  27. Textor, C.; Schulz, M.; Guibert, S.; Kinne, S.; Balkanski, Y.; Bauer, S.; Berntsen, T.; Berglen, T.; Boucher, O.; Chin, M. Analysis and Quantification of the Diversities of Aerosol Life Cycles within AeroCom. Atmos. Chem. Phys. 2006, 6, 1777–1813. [Google Scholar] [CrossRef]
  28. Kacenelenbogen, M.S.; Vaughan, M.A.; Redemann, J.; Young, S.A.; Liu, Z.; Hu, Y.; Omar, A.H.; LeBlanc, S.; Shinozuka, Y.; Livingston, J. Estimations of Global Shortwave Direct Aerosol Radiative Effects above Opaque Water Clouds Using a Combination of A-Train Satellite Sensors. Atmos. Chem. Phys. 2019, 19, 4933–4962. [Google Scholar] [CrossRef]
  29. Oikawa, E.; Nakajima, T.; Winker, D. An Evaluation of the Shortwave Direct Aerosol Radiative Forcing Using CALIOP and MODIS Observations. J. Geophys. Res. Atmos. 2018, 123, 1211–1233. [Google Scholar] [CrossRef]
  30. Yorks, J.E.; McGill, M.; Rodier, S.; Vaughan, M.; Hu, Y.; Hlavka, D. Radiative Effects of African Dust and Smoke Observed from Clouds and the Earth’s Radiant Energy System (CERES) and Cloud-Aerosol Lidar with Orthogonal Polarization (CALIOP) Data. J. Geophys. Res. Atmos. 2009, 114. [Google Scholar] [CrossRef]
  31. De Graaf, M.; Bellouin, N.; Tilstra, L.G.; Haywood, J.; Stammes, P. Aerosol Direct Radiative Effect of Smoke over Clouds over the Southeast Atlantic Ocean from 2006 to 2009. Geophys. Res. Lett. 2014, 41, 7723–7730. [Google Scholar] [CrossRef]
  32. Peers, F.; Waquet, F.; Cornet, C.; Dubuisson, P.; Ducos, F.; Goloub, P.; Szczap, F.; Tanré, D.; Thieuleux, F. Absorption of Aerosols above Clouds from POLDER/PARASOL Measurements and Estimation of Their Direct Radiative Effect. Atmos. Chem. Phys. 2015, 15, 4179–4196. [Google Scholar] [CrossRef]
  33. Korras-Carraca, M.B.; Pappas, V.; Hatzianastassiou, N.; Vardavas, I.; Matsoukas, C. Global Vertically Resolved Aerosol Direct Radiation Effect from Three Years of CALIOP Data Using the FORTH Radiation Transfer Model. Atmos. Res. 2019, 224, 138–156. [Google Scholar] [CrossRef]
  34. Prospero, J.M.; Ginoux, P.; Torres, O.; Nicholson, S.E.; Gill, T.E. Environmental Characterization of Global Sources of Atmospheric Soil Dust Identified with the Nimbus 7 Total Ozone Mapping Spectrometer (TOMS) Absorbing Aerosol Product. Rev. Geophys. 2002, 40, 2-1–2-31. [Google Scholar] [CrossRef]
  35. Ginoux, P.; Prospero, J.M.; Gill, T.E.; Hsu, N.C.; Zhao, M. Global-scale Attribution of Anthropogenic and Natural Dust Sources and Their Emission Rates Based on MODIS Deep Blue Aerosol Products. Rev. Geophys. 2012, 50. [Google Scholar] [CrossRef]
  36. Ge, J.M.; Huang, J.P.; Xu, C.P.; Qi, Y.L.; Liu, H.Y. Characteristics of Taklimakan Dust Emission and Distribution: A Satellite and Reanalysis Field Perspective. J. Geophys. Res. Atmos. 2014, 119, 11772–11783. [Google Scholar] [CrossRef]
  37. Yu, Y.; Kalashnikova, O.V.; Garay, M.J.; Notaro, M. Climatology of Asian Dust Activation and Transport Potential Based on MISR Satellite Observations and Trajectory Analysis. Atmos. Chem. Phys. 2019, 19, 363–378. [Google Scholar] [CrossRef]
  38. Gkikas, A.; Proestakis, E.; Amiridis, V.; Kazadzis, S.; Di Tomaso, E.; Tsekeri, A.; Marinou, E.; Hatzianastassiou, N.; Pérez García-Pando, C. ModIs Dust AeroSol (MIDAS): A Global Fine-Resolution Dust Optical Depth Data Set. Atmos. Meas. Tech. 2021, 14, 309–334. [Google Scholar] [CrossRef]
  39. Ma, X.; von Salzen, K.; Li, J. Modelling Sea Salt Aerosol and Its Direct and Indirect Effects on Climate. Atmos. Chem. Phys. 2008, 8, 1311–1327. [Google Scholar] [CrossRef]
  40. Grini, A.; Myhre, G.; Sundet, J.K.; Isaksen, I.S. Modeling the Annual Cycle of Sea Salt in the Global 3D Model Oslo CTM2: Concentrations, Fluxes, and Radiative Impact. J. Clim. 2002, 15, 1717–1730. [Google Scholar] [CrossRef]
  41. Takemura, T.; Nakajima, T.; Dubovik, O.; Holben, B.N.; Kinne, S. Single-Scattering Albedo and Radiative Forcing of Various Aerosol Species with a Global Three-Dimensional Model. J. Clim. 2002, 15, 333–352. [Google Scholar] [CrossRef]
  42. Dobbie, S.; Li, J.; Harvey, R.; Chýlek, P. Sea-Salt Optical Properties and GCM Forcing at Solar Wavelengths. Atmos. Res. 2003, 65, 211–233. [Google Scholar] [CrossRef]
  43. Chung, C.E.; Ramanathan, V.; Decremer, D. Observationally Constrained Estimates of Carbonaceous Aerosol Radiative Forcing. Proc. Natl. Acad. Sci. USA 2012, 109, 11624–11629. [Google Scholar] [CrossRef]
  44. Bond, T.C.; Doherty, S.J.; Fahey, D.W.; Forster, P.M.; Berntsen, T.; DeAngelo, B.J.; Flanner, M.G.; Ghan, S.; Kärcher, B.; Koch, D. Bounding the Role of Black Carbon in the Climate System: A Scientific Assessment. J. Geophys. Res. Atmos. 2013, 118, 5380–5552. [Google Scholar] [CrossRef]
  45. Van der Werf, G.R.; Randerson, J.T.; Giglio, L.; Collatz, G.J.; Kasibhatla, P.S.; Arellano Jr, A.F. Interannual Variability in Global Biomass Burning Emissions from 1997 to 2004. Atmos. Chem. Phys. 2006, 6, 3423–3441. [Google Scholar] [CrossRef]
  46. Giglio, L.; Randerson, J.T.; Van Der Werf, G.R. Analysis of Daily, Monthly, and Annual Burned Area Using the Fourth-generation Global Fire Emissions Database (GFED4). J. Geophys. Res. Biogeosciences 2013, 118, 317–328. [Google Scholar] [CrossRef]
  47. Randerson, J.T.; Chen, Y.; Van Der Werf, G.R.; Rogers, B.M.; Morton, D.C. Global Burned Area and Biomass Burning Emissions from Small Fires. J. Geophys. Res. Biogeosciences 2012, 117. [Google Scholar] [CrossRef]
  48. Kinne, S. Aerosol Radiative Effects with MACv2. Atmos. Chem. Phys. 2019, 19, 10919–10959. [Google Scholar] [CrossRef]
  49. Buchard, V.; Randles, C.A.; Da Silva, A.M.; Darmenov, A.; Colarco, P.R.; Govindaraju, R.; Ferrare, R.; Hair, J.; Beyersdorf, A.J.; Ziemba, L.D. The MERRA-2 Aerosol Reanalysis, 1980 Onward. Part II: Evaluation and Case Studies. J. Clim. 2017, 30, 6851–6872. [Google Scholar] [CrossRef]
  50. Gelaro, R.; McCarty, W.; Suárez, M.J.; Todling, R.; Molod, A.; Takacs, L.; Randles, C.A.; Darmenov, A.; Bosilovich, M.G.; Reichle, R. The Modern-Era Retrospective Analysis for Research and Applications, Version 2 (MERRA-2). J. Clim. 2017, 30, 5419–5454. [Google Scholar] [CrossRef]
  51. Randles, C.A.; Da Silva, A.M.; Buchard, V.; Colarco, P.R.; Darmenov, A.; Govindaraju, R.; Smirnov, A.; Holben, B.; Ferrare, R.; Hair, J. The MERRA-2 Aerosol Reanalysis, 1980 Onward. Part I: System Description and Data Assimilation Evaluation. J. Clim. 2017, 30, 6823–6850. [Google Scholar] [CrossRef]
  52. Hatzianastassiou, N.; Matsoukas, C.; Drakakis, E.; Stackhouse Jr, P.W.; Koepke, P.; Fotiadi, A.; Pavlakis, K.G.; Vardavas, I. The Direct Effect of Aerosols on Solar Radiation Based on Satellite Observations, Reanalysis Datasets, and Spectral Aerosol Optical Properties from Global Aerosol Data Set (GADS). Atmos. Chem. Phys. 2007, 7, 2585–2599. [Google Scholar] [CrossRef]
  53. Vardavas, I.M.; Carver, J.H. Solar and Terrestrial Parameterizations for Radiative-Convective Models. Planet. Space Sci. 1984, 32, 1307–1325. [Google Scholar] [CrossRef]
  54. Thorsen, T.J.; Ferrare, R.A.; Kato, S.; Winker, D.M. Aerosol Direct Radiative Effect Sensitivity Analysis. J. Clim. 2020, 33, 6119–6139. [Google Scholar] [CrossRef]
  55. Matus, A.V.; L’Ecuyer, T.S.; Kay, J.E.; Hannay, C.; Lamarque, J.-F. The Role of Clouds in Modulating Global Aerosol Direct Radiative Effects in Spaceborne Active Observations and the Community Earth System Model. J. Clim. 2015, 28, 2986–3003. [Google Scholar] [CrossRef]
  56. Chin, M.; Ginoux, P.; Kinne, S.; Torres, O.; Holben, B.N.; Duncan, B.N.; Martin, R.V.; Logan, J.A.; Higurashi, A.; Nakajima, T. Tropospheric Aerosol Optical Thickness from the GOCART Model and Comparisons with Satellite and Sun Photometer Measurements. J. Atmos. Sci. 2002, 59, 461–483. [Google Scholar] [CrossRef]
  57. Colarco, P.; da Silva, A.; Chin, M.; Diehl, T. Online Simulations of Global Aerosol Distributions in the NASA GEOS-4 Model and Comparisons to Satellite and Ground-based Aerosol Optical Depth. J. Geophys. Res. Atmos. 2010, 115. [Google Scholar] [CrossRef]
  58. Hess, M.; Koepke, P.; Schult, I. Optical Properties of Aerosols and Clouds: The Software Package OPAC. Bull. Am. Meteorol. Soc. 1998, 79, 831–844. [Google Scholar] [CrossRef]
  59. Marticorena, B.; Bergametti, G. Modeling the Atmospheric Dust Cycle: 1. Design of a Soil-derived Dust Emission Scheme. J. Geophys. Res. Atmos. 1995, 100, 16415–16430. [Google Scholar] [CrossRef]
  60. Gong, S.L. A Parameterization of Sea-salt Aerosol Source Function for Sub-and Super-micron Particles. Glob. Biogeochem. Cycles 2003, 17. [Google Scholar] [CrossRef]
  61. Diehl, T.; Heil, A.; Chin, M.; Pan, X.; Streets, D.; Schultz, M.; Kinne, S. Anthropogenic, Biomass Burning, and Volcanic Emissions of Black Carbon, Organic Carbon, and SO 2 from 1980 to 2010 for Hindcast Model Experiments. Atmos. Chem. Phys. Discuss. 2012, 12, 24895–24954. [Google Scholar]
  62. Meng, Z.; Yang, P.; Kattawar, G.W.; Bi, L.; Liou, K.N.; Laszlo, I. Single-Scattering Properties of Tri-Axial Ellipsoidal Mineral Dust Aerosols: A Database for Application to Radiative Transfer Calculations. J. Aerosol Sci. 2010, 41, 501–512. [Google Scholar] [CrossRef]
  63. Colarco, P.R.; Nowottnick, E.P.; Randles, C.A.; Yi, B.; Yang, P.; Kim, K.-M.; Smith, J.A.; Bardeen, C.G. Impact of Radiatively Interactive Dust Aerosols in the NASA GEOS-5 Climate Model: Sensitivity to Dust Particle Shape and Refractive Index. J. Geophys. Res. Atmos. 2014, 119, 753–786. [Google Scholar] [CrossRef]
  64. Matsoukas, C.; Hatzianastassiou, N.; Fotiadi, A.; Pavlakis, K.G.; Vardavas, I. The Effect of Arctic Sea-Ice Extent on the Absorbed (Net) Solar Flux at the Surface, Based on ISCCP-D2 Cloud Data for 1983–2007. Atmos. Chem. Phys. 2010, 10, 777–787. [Google Scholar] [CrossRef]
  65. Matsoukas, C.; Benas, N.; Hatzianastassiou, N.; Pavlakis, K.G.; Kanakidou, M.; Vardavas, I. Potential Evaporation Trends over Land between 1983–2008: Driven by Radiative Fluxes or Vapour-Pressure Deficit? Atmos. Chem. Phys. 2011, 11, 7601–7616. [Google Scholar] [CrossRef]
  66. Papadimas, C.D.; Hatzianastassiou, N.; Matsoukas, C.; Kanakidou, M.; Mihalopoulos, N.; Vardavas, I. The Direct Effect of Aerosols on Solar Radiation over the Broader Mediterranean Basin. Atmos. Chem. Phys. 2012, 12, 7165–7185. [Google Scholar] [CrossRef]
  67. Pyrina, M.; Hatzianastassiou, N.; Matsoukas, C.; Fotiadi, A.; Papadimas, C.D.; Pavlakis, K.G.; Vardavas, I. Cloud Effects on the Solar and Thermal Radiation Budgets of the Mediterranean Basin. Atmos. Res. 2015, 152, 14–28. [Google Scholar] [CrossRef]
  68. Benas, N.; Hatzianastassiou, N.; Matsoukas, C.; Fotiadi, A.; Mihalopoulos, N.; Vardavas, I. Aerosol Shortwave Direct Radiative Effect and Forcing Based on MODIS Level 2 Data in the Eastern Mediterranean (Crete). Atmos. Chem. Phys. 2011, 11, 12647–12662. [Google Scholar] [CrossRef]
  69. Hatzianastassiou, N.; Fotiadi, A.; Matsoukas, C.; Pavlakis, K.G.; Drakakis, E.; Hatzidimitriou, D.; Vardavas, I. Long-Term Global Distribution of Earth’s Shortwave Radiation Budget at the Top of Atmosphere. Atmos. Chem. Phys. 2004, 4, 1217–1235. [Google Scholar] [CrossRef]
  70. Hatzianastassiou, N.; Matsoukas, C.; Fotiadi, A.; Pavlakis, K.G.; Drakakis, E.; Hatzidimitriou, D.; Vardavas, I. Global Distribution of Earth’s Surface Shortwave Radiation Budget. Atmos. Chem. Phys. 2005, 5, 2847–2867. [Google Scholar] [CrossRef]
  71. Hatzianastassiou, N.; Papadimas, C.D.; Matsoukas, C.; Pavlakis, K.; Fotiadi, A.; Wild, M.; Vardavas, I. Recent Regional Surface Solar Radiation Dimming and Brightening Patterns: Inter-Hemispherical Asymmetry and a Dimming in the Southern Hemisphere. Atmos. Sci. Lett. 2012, 13, 43–48. [Google Scholar] [CrossRef]
  72. Hatzianastassiou, N.; Ioannidis, E.; Korras-Carraca, M.-B.; Gavrouzou, M.; Papadimas, C.D.; Matsoukas, C.; Benas, N.; Fotiadi, A.; Wild, M.; Vardavas, I. Global Dimming and Brightening Features during the First Decade of the 21st Cntury. Atmosphere 2020, 11, 308. [Google Scholar] [CrossRef]
  73. Randles, C.A.; Kinne, S.; Myhre, G.; Schulz, M.; Stier, P.; Fischer, J.; Doppler, L.; Highwood, E.; Ryder, C.; Harris, B. Intercomparison of Shortwave Radiative Transfer Schemes in Global Aerosol Modeling: Results from the AeroCom Radiative Transfer Experiment. Atmos. Chem. Phys. 2013, 13, 2347–2379. [Google Scholar] [CrossRef]
  74. Gueymard, C.A. The Sun’s Total and Spectral Irradiance for Solar Energy Applications and Solar Radiation Models. Sol. Energy 2004, 76, 423–453. [Google Scholar] [CrossRef]
  75. Willson, R.C. Total Solar Irradiance Trend during Solar Cycles 21 and 22. Science 1997, 277, 1963–1965. [Google Scholar] [CrossRef]
  76. Joseph, J.H.; Wiscombe, W.J.; Weinman, J.A. The Delta-Eddington Approximation for Radiative Flux Transfer. J. Atmos. Sci. 1976, 33, 2452–2459. [Google Scholar] [CrossRef]
  77. Gavrouzou, M.; Hatzianastassiou, N.; Gkikas, A.; Korras-Carraca, M.-B.; Mihalopoulos, N. A Global Climatology of Dust Aerosols Based on Satellite Data: Spatial, Seasonal and Inter-Annual Patterns over the Period 2005–2019. Remote Sens. 2021, 13, 359. [Google Scholar] [CrossRef]
  78. Winker, D.M.; Tackett, J.L.; Getzewich, B.J.; Liu, Z.; Vaughan, M.A.; Rogers, R.R. The Global 3-D Distribution of Tropospheric Aerosols as Characterized by CALIOP. Atmos. Chem. Phys. 2013, 13, 3345–3361. [Google Scholar] [CrossRef]
  79. Hatzianastassiou, N.; Kalaitzi, N.; Gavrouzou, M.; Gkikas, A.; Korras-Carraca, M.-B.; Mihalopoulos, N. A Climatological Satellite Assessment of Absorbing Carbonaceous Aerosols on a Global Scale. Atmosphere 2019, 10, 671. [Google Scholar] [CrossRef]
  80. Prospero, J.M.; Mayol-Bracero, O.L. Understanding the Transport and Impact of African Dust on the Caribbean Basin. Bull. Am. Meteorol. Soc. 2013, 94, 1329–1337. [Google Scholar] [CrossRef]
  81. Velasco-Merino, C.; Mateos, D.; Toledano, C.; Prospero, J.M.; Molinie, J.; Euphrasie-Clotilde, L.; González, R.; Cachorro, V.E.; Calle, A.; Frutos, A.M. de Impact of Long-Range Transport over the Atlantic Ocean on Saharan Dust Optical and Microphysical Properties Based on AERONET Data. Atmos. Chem. Phys. 2018, 18, 9411–9424. [Google Scholar] [CrossRef]
  82. Murphy, D.M.; Froyd, K.D.; Bian, H.; Brock, C.A.; Dibb, J.E.; DiGangi, J.P.; Diskin, G.; Dollner, M.; Kupc, A.; Scheuer, E.M. The Distribution of Sea-Salt Aerosol in the Global Troposphere. Atmos. Chem. Phys. 2019, 19, 4093–4104. [Google Scholar] [CrossRef]
  83. Gliß, J.; Mortier, A.; Schulz, M.; Andrews, E.; Balkanski, Y.; Bauer, S.E.; Benedictow, A.M.; Bian, H.; Checa-Garcia, R.; Chin, M. AeroCom Phase III Multi-Model Evaluation of the Aerosol Life Cycle and Optical Properties Using Ground-and Space-Based Remote Sensing as Well as Surface in Situ Observations. Atmos. Chem. Phys. 2021, 21, 87–128. [Google Scholar] [CrossRef]
  84. Ridley, D.A.; Heald, C.L.; Kok, J.F.; Zhao, C. An Observationally Constrained Estimate of Global Dust Aerosol Optical Depth. Atmos. Chem. Phys. 2016, 16, 15097–15117. [Google Scholar] [CrossRef]
  85. Videla, F.C.; Barnaba, F.; Angelini, F.; Cremades, P.; Gobbi, G.P. The Relative Role of Amazonian and Non-Amazonian Fires in Building up the Aerosol Optical Depth in South America: A Five Year Study (2005–2009). Atmos. Res. 2013, 122, 298–309. [Google Scholar] [CrossRef]
  86. De Graaf, M.; Tilstra, L.G.; Aben, I.; Stammes, P. Satellite Observations of the Seasonal Cycles of Absorbing Aerosols in Africa Related to the Monsoon Rainfall, 1995–2008. Atmos. Environ. 2010, 44, 1274–1283. [Google Scholar] [CrossRef]
  87. Edwards, D.P.; Emmons, L.K.; Gille, J.C.; Chu, A.; Attié, J.-L.; Giglio, L.; Wood, S.W.; Haywood, J.; Deeter, M.N.; Massie, S.T. Satellite-observed Pollution from Southern Hemisphere Biomass Burning. J. Geophys. Res. Atmos. 2006, 111. [Google Scholar] [CrossRef]
  88. Proestakis, E.; Amiridis, V.; Marinou, E.; Georgoulias, A.K.; Solomos, S.; Kazadzis, S.; Chimot, J.; Che, H.; Alexandri, G.; Binietoglou, I. Nine-Year Spatial and Temporal Evolution of Desert Dust Aerosols over South and East Asia as Revealed by CALIOP. Atmos. Chem. Phys. 2018, 18, 1337–1362. [Google Scholar] [CrossRef]
  89. Marinou, E.; Amiridis, V.; Binietoglou, I.; Tsikerdekis, A.; Solomos, S.; Proestakis, E.; Konsta, D.; Papagiannopoulos, N.; Tsekeri, A.; Vlastou, G.; et al. Three-Dimensional Evolution of Saharan Dust Transport towards Europe Based on a 9-Year EARLINET-Optimized CALIPSO Dataset. Atmos. Chem. Phys. 2017, 17, 5893–5919. [Google Scholar] [CrossRef]
  90. Haywood, J.M.; Pelon, J.; Formenti, P.; Bharmal, N.; Brooks, M.; Capes, G.; Chazette, P.; Chou, C.; Christopher, S.; Coe, H. Overview of the Dust and Biomass-burning Experiment and African Monsoon Multidisciplinary Analysis Special Observing Period-0. J. Geophys. Res. Atmos. 2008, 113. [Google Scholar] [CrossRef]
  91. Hatzianastassiou, N.; Katsoulis, B.; Vardavas, I. Sensitivity Analysis of Aerosol Direct Radiative Forcing in Ultraviolet—Visible Wavelengths and Consequences for the Heat Budget. Tellus B Chem. Phys. Meteorol. 2004, 56, 368–381. [Google Scholar]
  92. Lelieveld, J.; Berresheim, H.; Borrmann, S.; Crutzen, P.J.; Dentener, F.J.; Fischer, H.; Feichter, J.; Flatau, P.J.; Heland, J.; Holzinger, R. Global Air Pollution Crossroads over the Mediterranean. Science 2002, 298, 794–799. [Google Scholar] [CrossRef]
  93. Floutsi, A.A.; Korras-Carraca, M.B.; Matsoukas, C.; Hatzianastassiou, N.; Biskos, G. Climatology and Trends of Aerosol Optical Depth over the Mediterranean Basin during the Last 12 Years (2002–2014) Based on Collection 006 MODIS-Aqua Data. Sci. Total Environ. 2016, 551, 292–303. [Google Scholar] [CrossRef]
  94. Schmale, J.; Zieger, P.; Ekman, A.M. Aerosols in Current and Future Arctic Climate. Nat. Clim. Chang. 2021, 11, 95–105. [Google Scholar] [CrossRef]
  95. Ren, L.; Yang, Y.; Wang, H.; Zhang, R.; Wang, P.; Liao, H. Source Attribution of Arctic Black Carbon and Sulfate Aerosols and Associated Arctic Surface Warming during 1980–2018. Atmos. Chem. Phys. 2020, 20, 9067–9085. [Google Scholar] [CrossRef]
  96. Wild, M. Enlightening Global Dimming and Brightening. Bull. Am. Meteorol. Soc. 2012, 93, 27–37. [Google Scholar] [CrossRef]
  97. Fan, J.; Zhang, R.; Tao, W.-K.; Mohr, K.I. Effects of Aerosol Optical Properties on Deep Convective Clouds and Radiative Forcing. J. Geophys. Res. Atmos. 2008, 113. [Google Scholar] [CrossRef]
  98. Jiang, J.H.; Su, H.; Huang, L.; Wang, Y.; Massie, S.; Zhao, B.; Omar, A.; Wang, Z. Contrasting Effects on Deep Convective Clouds by Different Types of Aerosols. Nat. Commun. 2018, 9, 3874. [Google Scholar] [CrossRef]
  99. Drakoussis, P.; Korras-Carraca, M.-B.; Jethva, H.; Torres, O.; Hatzianastassiou, N. Climatology and Trends of Global Single Scattering Albedo Based on Ozone Monitor System (OMI) Ultraviolet Retrievals, Ioannina, Greece, 2021.
  100. Pitari, G.; Cionni, I.; Di Genova, G.; Visioni, D.; Gandolfi, I.; Mancini, E. Impact of Stratospheric Volcanic Aerosols on Age-of-Air and Transport of Long-Lived Species. Atmosphere 2016, 7, 149. [Google Scholar] [CrossRef]
  101. McCormick, M.P.; Thomason, L.W.; Trepte, C.R. Atmospheric Effects of the Mt Pinatubo Eruption. Nature 1995, 373, 399–404. [Google Scholar] [CrossRef]
  102. Trenberth, K.E.; Dai, A. Effects of Mount Pinatubo Volcanic Eruption on the Hydrological Cycle as an Analog of Geoengineering. Geophys. Res. Lett. 2007, 34. [Google Scholar] [CrossRef]
  103. Provençal, S.; Kishcha, P.; da Silva, A.M.; Elhacham, E.; Alpert, P. AOD Distributions and Trends of Major Aerosol Species over a Selection of the World’s Most Populated Cities Based on the 1st Version of NASA’s MERRA Aerosol Reanalysis. Urban Clim. 2017, 20, 168–191. [Google Scholar] [CrossRef]
  104. Nabat, P.; Somot, S.; Mallet, M.; Sanchez-Lorenzo, A.; Wild, M. Contribution of Anthropogenic Sulfate Aerosols to the Changing Euro-Mediterranean Climate since 1980. Geophys. Res. Lett. 2014, 41, 5605–5611. [Google Scholar] [CrossRef]
  105. Hand, J.L.; Schichtel, B.A.; Malm, W.C.; Pitchford, M.L. Particulate Sulfate Ion Concentration and SO2 Emission Trends in the United States from the Early 1990s through 2010. Atmos. Chem. Phys. 2012, 12, 10353–10365. [Google Scholar] [CrossRef]
  106. Chin, M.; Diehl, T.; Tan, Q.; Prospero, J.M.; Kahn, R.A.; Remer, L.A.; Yu, H.; Sayer, A.M.; Bian, H.; Geogdzhayev, I.V.; et al. Multi-Decadal Aerosol Variations from 1980 to 2009: A Perspective from Observations and a Global Model. Atmos. Chem. Phys. 2014, 14, 3657–3690. [Google Scholar] [CrossRef]
  107. Streets, D.G.; Yu, C.; Wu, Y.; Chin, M.; Zhao, Z.; Hayasaka, T.; Shi, G. Aerosol Trends over China, 1980–2000. Atmos. Res. 2008, 88, 174–182. [Google Scholar] [CrossRef]
  108. Randles, C.A.; da Silva, A.M.; Buchard, V.; Darmenov, A.; Colarco, P.R.; Aquila, V.; Bian, H.; Nowottnick, E.P.; Pan, X.; Smirnov, A. The MERRA-2 Aerosol Assimilation. NASA Tech. Rep. Ser. Glob. Model. Data Assim. 2016, 45. [Google Scholar]
  109. Griffin, D.; McLinden, C.A.; Dammers, E.; Adams, C.; Stockwell, C.; Warneke, C.; Bourgeois, I.; Peischl, J.; Ryerson, T.B.; Zarzana, K.J.; et al. Biomass Burning Nitrogen Dioxide Emissions Derived from Space with TROPOMI: Methodology and Validation. Atmos. Meas. Tech. Discuss. 2021, 2021, 1–44. [Google Scholar] [CrossRef]
  110. Romero-Lankao, P.; Smith, J.B.; Davidson, D.J.; Diffenbaugh, N.S.; Kinney, P.L.; Kirshen, P.; Kovacs, P.; Villers Ruiz, L. North America. Climate Change 2014: Impacts, Adaptation, and Vulnerability Part B: Regional Aspects Contribution of Working Group II to the Fifth Assessment Report of the Intergovernmental Panel of Climate Change; Cambridge University Press: Cambridge, UK, 2014. [Google Scholar]
  111. Liu, M.; Matsui, H. Aerosol Radiative Forcings Induced by Substantial Changes in Anthropogenic Emissions in China from 2008 to 2016. Atmos. Chem. Phys. 2021, 21, 5965–5982. [Google Scholar] [CrossRef]
  112. Mann, H.B. Nonparametric Tests against Trend. Econom. J. Econom. Soc. 1945, 245–259. [Google Scholar] [CrossRef]
  113. Kendall, M.G.; Gibbons, J.D. Rank Correlation Methods, 1970; Griffin: London, UK, 1975. [Google Scholar]
  114. Zhao, B.; Jiang, J.H.; Gu, Y.; Diner, D.; Worden, J.; Liou, K.-N.; Su, H.; Xing, J.; Garay, M.; Huang, L. Decadal-Scale Trends in Regional Aerosol Particle Properties and Their Linkage to Emission Changes. Environ. Res. Lett. 2017, 12, 054021. [Google Scholar] [CrossRef]
  115. Zhao, B.; Zhuang, Q.; Shurpali, N.; Köster, K.; Berninger, F.; Pumpanen, J. North American Boreal Forests Are a Large Carbon Source Due to Wildfires from 1986 to 2016. Sci. Rep. 2021, 11, 7723. [Google Scholar] [CrossRef]
  116. Randerson, J.T.; Liu, H.; Flanner, M.G.; Chambers, S.D.; Jin, Y.; Hess, P.G.; Pfister, G.; Mack, M.C.; Treseder, K.K.; Welp, L.R. The Impact of Boreal Forest Fire on Climate Warming. Science 2006, 314, 1130–1132. [Google Scholar] [CrossRef] [PubMed]
  117. Logothetis, S.-A.; Salamalikis, V.; Gkikas, A.; Kazadzis, S.; Amiridis, V.; Kazantzidis, A. 15-Year Variability of Desert Dust Optical Depth on Global and Regional Scales. Atmos. Chem. Phys. Discuss. 2021, 1–40. [Google Scholar] [CrossRef]
  118. Sabetghadam, S.; Alizadeh, O.; Khoshsima, M.; Pierleoni, A. Aerosol Properties, Trends and Classification of Key Types over the Middle East from Satellite-Derived Atmospheric Optical Data. Atmos. Environ. 2021, 246. [Google Scholar] [CrossRef]
  119. Klingmüller, K.; Pozzer, A.; Metzger, S.; Stenchikov, G.L.; Lelieveld, J. Aerosol Optical Depth Trend over the Middle East. Atmos. Chem. Phys. 2016, 16, 5063–5073. [Google Scholar] [CrossRef]
  120. Voss, K.K.; Evan, A.T. A New Satellite-Based Global Climatology of Dust Aerosol Optical Depth. J. Appl. Meteorol. Climatol. 2020, 59, 83–102. [Google Scholar] [CrossRef]
  121. Banks, J.R.; Brindley, H.E.; Flamant, C.; Garay, M.J.; Hsu, N.C.; Kalashnikova, O.V.; Klüser, L.; Sayer, A.M. Intercomparison of Satellite Dust Retrieval Products over the West African Sahara during the Fennec Campaign in June 2011. Remote Sens. Environ. 2013, 136, 99–116. [Google Scholar] [CrossRef]
  122. Ridley, D.A.; Heald, C.L.; Ford, B. North African Dust Export and Deposition: A Satellite and Model Perspective. J. Geophys. Res. Atmos. 2012, 117. [Google Scholar] [CrossRef]
  123. Kakouri, A.; Korras-Carraca, M.-B.; Hatzianastassiou, N.; Matsoukas, C.; Gkikas, A.; Kontos, T. Estimation of the Spatio–Temporal Distribution of Wildfires in the Mediterranean Basin with the Use of Remote Sensing Data and Correlation with Biomass Burning Aerosol Load. In Proceedings of the 15th International Conference on Meteorology, Climatology and Atmospheric Physics (COMECAP 2021), Ioannina, Greece, 16–19 May 2021. [Google Scholar]
  124. Ahn, D.H.; Choi, T.; Kim, J.; Park, S.S.; Lee, Y.G.; Kim, S.-J.; Koo, J.-H. Southern Hemisphere Mid-and High-Latitudinal AOD, CO, NO 2, and HCHO: Spatiotemporal Patterns Revealed by Satellite Observations. Prog. Earth Planet. Sci. 2019, 6, 34. [Google Scholar] [CrossRef]
  125. Zielinski, T.; Bolzacchini, E.; Cataldi, M.; Ferrero, L.; Graßl, S.; Hansen, G.; Mateos, D.; Mazzola, M.; Neuber, R.; Pakszys, P. Study of Chemical and Optical Properties of Biomass Burning Aerosols during Long-Range Transport Events toward the Arctic in Summer 2017. Atmosphere 2020, 11, 84. [Google Scholar] [CrossRef]
  126. Markowicz, K.M.; Lisok, J.; Xian, P. Simulations of the Effect of Intensive Biomass Burning in July 2015 on Arctic Radiative Budget. Atmos. Environ. 2017, 171, 248–260. [Google Scholar] [CrossRef]
Figure 1. Mean annual (1980–2019) global distribution of MERRA-2 Optical Depth at the wavelength of 550 nm for: (i) total aerosol load, (ii) sulfate, (iii) dust, (iv) sea salt, (v) organic carbon and (vi) black carbon particles.
Atmosphere 12 01254 g001
Figure 2. Mean annual (1980–2019) global distribution of aerosol Direct Radiative Effects: (a) at the Earth’s surface, (b) within the Atmosphere and (c) at the Top of the Atmosphere. (i) total aerosol load, (ii) sulfate, (iii) dust, (iv) sea salt, (v) organic carbon and (vi) black carbon particles.
Atmosphere 12 01254 g002
Figure 3. Geographical boundaries of five selected world regions (Sahara and Arabian Deserts, Southern Africa, India, East Asia and the Mediterranean) characterized by heavy aerosol loads of different nature, over which the AOD and DREs are averaged (Table 1 and Table S1).
Atmosphere 12 01254 g003
Figure 4. Timeseries of globally averaged AOD (1st row) and Direct Radiative Effects: at the Earth’s surface 2nd row), within the Atmosphere (3rd row) and at the Top of the Atmosphere (4th row). The results are provided for the total aerosol load (i) and for sulfate (ii), desert dust (iii), sea salt (iv), organic carbon (v) and black carbon (vi) particles.
Atmosphere 12 01254 g004aAtmosphere 12 01254 g004b
Figure 5. Slopes of deseasonalized MERRA-2 Optical Depth anomalies at the wavelength of 550 nm, over the period 2001–2019, for: (i) total aerosol load, (ii) sulfate, (iii) dust, (iv) sea salt, (v) organic carbon and (vi) black carbon particles. Units are decade−1.
Atmosphere 12 01254 g005
Figure 6. Slopes of deseasonalized Direct Radiative Effects’ anomalies over the period 2001–2019: (a) at the Earth’s surface, (b) within the Atmosphere and (c) at the Top of the Atmosphere. (i) total aerosol load, (ii) sulfate, (iii) dust, (iv) sea salt, (v) organic carbon and (vi) black carbon particles. Units are Wm−2decade−1.
Atmosphere 12 01254 g006
Table 1. Long-term (1980–2019) annually and seasonally averaged total aerosol AOD and DREs (in Wm−2) over: the globe, the North and South Hemispheres, global land and global ocean areas and five selected world regions (Sahara and Arabian Deserts, Southern Africa, India, East Asia and the Mediterranean) shown in Figure 3. Seasons refer to the North Hemisphere (boreal). Different background colors correspond to different parameters (AOD and DREs) displayed on the Table.
AnnualWinterSpringSummerAutumn
GlobalDRE surface−7.563−6.430−7.698−8.769−7.360
DRE atmosphere2.3531.6302.5392.9342.307
DRE TOA−5.210−4.800−5.159−5.835−5.053
AOD0.1400.1280.1410.1530.138
Northern HemisphereDRE surface−9.900−7.587−11.853−12.341−7.530
DRE atmosphere3.5162.5614.6754.3872.313
DRE TOA−6.384−5.025−7.177−7.954−5.216
AOD0.1780.1630.1990.1950.154
Southern HemisphereDRE surface−5.242−5.397−3.453−4.826−7.197
DRE atmosphere1.1990.7980.3571.3292.302
DRE TOA−4.043−4.599−3.096−3.497−4.895
AOD0.1020.0950.0840.1090.121
Global LandDRE surface−10.083−7.380−10.733−13.174−9.053
DRE atmosphere4.8043.3375.2826.2854.308
DRE TOA−5.279−4.044−5.451−6.889−4.745
AOD0.1770.1520.1860.2040.167
Global OceanDRE surface−6.430−6.014−6.329−6.802−6.580
DRE atmosphere1.2520.8811.3021.4371.385
DRE TOA−5.178−5.132−5.027−5.365−5.195
AOD0.1230.1170.1210.1300.124
Sahara—Arabian DesertsDRE surface−18.295−10.939−21.197−25.834−15.208
DRE atmosphere13.3766.92316.40419.74610.430
DRE TOA−4.919−4.015−4.793−6.088−4.778
AOD0.3350.2180.3670.4560.297
Southern AfricaDRE surface−11.476−9.113−5.233−16.677−14.878
DRE atmosphere6.2473.7111.70810.7198.851
DRE TOA−5.228−5.402−3.525−5.958−6.027
AOD0.1640.1440.0990.2200.194
IndiaDRE surface−17.743−14.735−22.323−19.789−14.123
DRE atmosphere8.4307.70511.3478.2086.461
DRE TOA−9.313−7.031−10.976−11.582−7.662
AOD0.2770.2280.3110.3310.238
East AsiaDRE surface−19.811−15.662−26.990−20.725−15.868
DRE atmosphere8.7296.94612.7398.6286.604
DRE TOA−11.082−8.716−14.251−12.098−9.264
AOD0.3360.3120.4050.3330.293
MediterraneanDRE surface−11.881−6.034−15.804−16.281−9.406
DRE atmosphere4.5031.6066.4576.7993.148
DRE TOA−7.379−4.428−9.347−9.482−6.258
AOD0.2030.1470.2400.2410.182
Table 2. Long-term (1980–2019) annually-averaged AOD, DREs (in Wm−2) and ARFEs (also in Wm−2) per particle type. The results are spatially averaged over the globe. Different background colors correspond to results for different aerosol types displayed on the Table
AODDirect Radiative Effects (DRE)Aerosol Radiative Forcing Efficiency (ARFE)
Aerosol Type SurfaceAtmosphereTOASurfaceAtmosphereTOA
Sulfate0.049−1.86−0.02−1.88−38.00−0.40−38.39
Dust0.027−1.981.15−0.83−72.9342.21−30.72
Sea Salt0.039−1.740.12−1.62−44.112.94−41.17
Organic Carbon0.019−0.910.18−0.73−47.119.17−37.94
Black Carbon0.005−0.720.920.19−143.05181.2438.19
Total0.1407.562.355.2154.0416.8237.22
Publisher’s Note: MDPI stays neutral with regard to jurisdictional claims in published maps and institutional affiliations.

