Article

Comparison of CFD and Multizone Modeling from Contaminant Migration from a Household Gas Furnace

by
Nina Szczepanik-Scislo
1 and
Lukasz Scislo
2,*
1
Faculty of Environmental and Power Engineering, Cracow University of Technology, 31-155 Cracow, Poland
2
Faculty of Electrical and Computer Engineering, Cracow University of Technology, 31-155 Cracow, Poland
*
Author to whom correspondence should be addressed.
Atmosphere 2021, 12(1), 79; https://doi.org/10.3390/atmos12010079
Submission received: 3 December 2020 / Revised: 23 December 2020 / Accepted: 31 December 2020 / Published: 7 January 2021
(This article belongs to the Special Issue Indoor Air Quality—What Is Known and What Needs to Be Done)

Abstract

:
In Central and Eastern Europe, a growing popularity of gas heaters as the main source of heat and domestic hot water can be observed. This is the result of new laws and strategies for funding that have been put in place to encourage households to stop using coal and replace it with cleaner energy sources. However, there is a growing concern that gas furnaces are prone to malfunction and can be a threat to occupants through CO (carbon monoxide) generation. To see how a faulty gas furnace with a clogged exhaust may affect a household, a series of multizone and computational fluid dynamics (CFD) simulations were carried out using the CONTAM software and CFD0 editor created by the National Institute of Standards and Technology (NIST). The simulations presented different placements of the furnace and ventilation outlet in an attached garage. The results showed how the placement influenced contaminant migration and occupant exposure to CO. It changed the amount of CO that infiltrated to the attached house and influenced occupant exposure. The results may be used by future users to minimize the risk of CO poisoning by using the proper natural ventilation methods together with optimal placement of the header in the household.

1. Introduction

Coal consumption secures more than 50% of needs of the Polish economy for primary energy carriers, and the consumption of hard coal alone amounts to 70–80 million tons [1]. Additionally, in Poland, coal consumption makes up an exceptionally high level of economy energy security. In 2013, coal (both hard and brown) accounted for approximately 54% of the primary energy consumption and almost 90% of electricity production [2]. In the same year, approximately 11 million tons of hard coal was used in households [2].
To counteract coal consumption, there has been a growing trend for replacing coal furnaces for gas ones to improve air quality. Thanks to government funding and the growing social awareness, the replacement of coal furnaces to gas ones have increased. The aim is to limit emission from households and, in consequence, improve the air quality [3]. However, in Poland it is common that furnaces are located in an attached garage if there is no special boiler room, which can contribute to contaminant migration into an attached house.
In a house, an attached garage can be a significant contaminant contributor to the indoor environment without a furnace, let alone with one [4,5,6,7,8,9,10,11,12]. The contaminants from a starting car or chemicals alone can influence the air quality within an attached household. If the gas furnace were to malfunction and the fume exhaust not work properly, there is a risk of CO (carbon monoxide) poisoning. Carbon monoxide is an odorless, tasteless, poisonous byproduct of partial combustion of fossil fuels that is a leading cause of brain injury and death due to suicidal attempts or accidental exposure [13,14]. Its high mortality is associated with impaired functioning of the red blood cells to transport oxygen to the tissues in the body [15,16,17].
To study how the location of a furnace, compared to the location of the airways, influences the contaminant migration, a series of multizone and computational fluid dynamics (CFD) simulations were carried out using the CONTAM with the CFD0 application.
CONTAM is a multizone indoor air quality and ventilation analysis computer program designed to determine airflows, contaminant concentrations, and migration, as well as personal exposure. It has the ability to calculate building airflow rates and relative pressures between zones as well as determining the variation in ventilation rates, for determining the distribution of ventilation air within a building [18]. It calculates contaminant concentrations that can be used to determine the indoor air quality (IAQ) performance of buildings before they are constructed and/or occupied, to investigate the impacts of different design decisions/methods concerning ventilation systems [19]. Predicted contaminant concentrations can also be used to estimate personal exposure based on occupancy patterns [18]. CONTAM has been used for multiple analysis, including infiltration calculations [20,21,22,23] and contaminant transport [24,25,26,27,28], as well as occupant exposure and comfort [29]. It is a valid tool for the assessment of a chosen ventilation system and can help to counteract the risks of poor IAQ. One limitation of CONTAM as a multizone program is that each zone is assumed to be at a uniform contaminant concentration [18].
On the other hand, CFD simulation programs are a powerful tool for estimating the airflow patterns and thermal environment of various heating, ventilation, and air conditioning (HVAC) systems in a very detailed way. They have been used for the estimation and control of the indoor environment and space ventilation when using different ventilation systems [30,31,32,33]. Furthermore, they have been used to analyse the influence of structures on airflow [34,35,36,37] and contaminant migration [26,38,39]. The limitation of CFD programs is that they are usually limited to a closed zone and it is not possible to provide results for an entire structure.
Because both multizone and CFD programs are well-researched instruments to predict contaminant migration as well as occupant exposure, in this study, it was decided to couple the multizone capabilities of CONTAM with the CFD methods of the CFD0 editor to estimate the contaminant infiltration of CO from a faulty gas furnace in a garage into an attached house.

2. Simulations

The aim of the research was to see how the location of a gas furnace, with respect to the ventilation system, changes the contaminant migration from an attached garage. The furnace was assumed to be faulty, with a blocked furnace exhaust vent. To achieve this, the programs CONTAM and CFD0 software created by NIST were used.
Carbon monoxide was taken under consideration as it is the most lethal of the exhaust gases from a gas furnace. According to the World Health Organization (WHO), the limit of CO a person should be subjected to is less than 30 ppm in 1 h, or 50 ppm during the period of 8 h [40].The effects of high carbon monoxide concentration are shown in Table 1.
Multizone simulation programs such as CONTAM have a series of limitations and assumptions [41]:
  • The concentration of contaminants, room pressures, and temperatures are uniform in each zone.
  • Transport of contaminants along each flow path between zones is instantaneous.
  • The air is still in each zone, so the airflow through zones does not impact zone pressures.
  • Wind pressures on a building’s surface are uniform.
Despite these disadvantages, multizone modelling has the advantage to simulate large buildings with many different ventilation zones [42]. It also allows the modeling of infiltration as well as occupant exposure while the occupant is active and moves in and out of the zones [25].
When using CONTAM, the air that flows from zone 1 to zone 2 is calculated based on the pressure drop between zones, as is shown in Equation (1) [20]
F 1 2 = f ( P 1 P 2 )
where F is the mass flow (kg/s); P1 and P2 are the pressures in the zones (Pa).
The mass of air in a zone is given by the ideal gas law
m = ρ V = P V R T
where V is the zone volume (m3), P is the pressure in the zone; V is the flow (kg/s), T is the zone temperature, and R is the gas constant for air.
The same assumptions are used when the contaminant analysis is activated. The air is treated as a mixture of several different species. The inward airflow rate through one or more paths are calculated as:
2 F 1 2 ( 1 η 2 α ) C 2 α
where F is the mass flow rate between zones (kg/s) 1 and 2, η 2 α is the filter efficiency in the path, and C 2 α is the contaminant generation rate.
The above equations show that the program treats the airflow in a well-mixed way that influences the contaminant migration.
The layout in CONTAM of the house taken into consideration in this study is shown in Figure 1.
Each zone has a dedicated name and flow paths. The infiltration and weather conditions were constant for all the simulations, as the aim was to see the influence of the furnace and exhaust vent placement. Changes in air infiltration are individual for every building and location; the aim was to make a generic model where only the placement of the furnace would influence the results. The outside temperature was assumed to be −10 °C, to simulate winter conditions. Contaminants were only generated in the garage to reflect the faulty furnace. The contaminant taken into consideration was carbon monoxide, as it is the deadliest out of the contaminants. The CO generation rate was assumed to be 1 × 10⁻⁵ kg/s [43] at the temperature 800 °C [43], the indoor temperature was assumed to be 20 °C, while the outdoor −10 °C. The dimensions of the garage were 4 m × 5 m × 3 m. The same generation rate and dimensions were used for the CONTAM as well as the CFD0 simulations. Each zone represented in Figure 1 has multiple flow paths; the area of flow paths is shown in Table 2. The doors and windows, as well as natural ventilation, where all set as power-law models, meaning that the airflow was calculated according to the differential pressure across the flow path and the flow coefficient [18]. The same dimensions for the flow paths were used on the CFD0 simulations.
CONTAM and CFD0 solve different sets of conservation equations. As shown above, CONTAM only solves air mass and contaminant conservation equations, while CFD0 solves the Reynolds-averaged Navier–Stokes equations.
CFD0 couples with CONTAM to generate a CFD simulation of a dedicated zone. The multizone model provides average characteristics of airflow and contaminants, while the CFD method predicts the three-dimensional distribution of these parameters. Incorporation of CFD0 into CONTAM allows the linking of information about the exterior wind pressures and outdoor contaminant concentrations to CONTAM’s indoor simulations, as well as embedding detailed CFD zones into the CONTAM airflow and contaminant transport network.
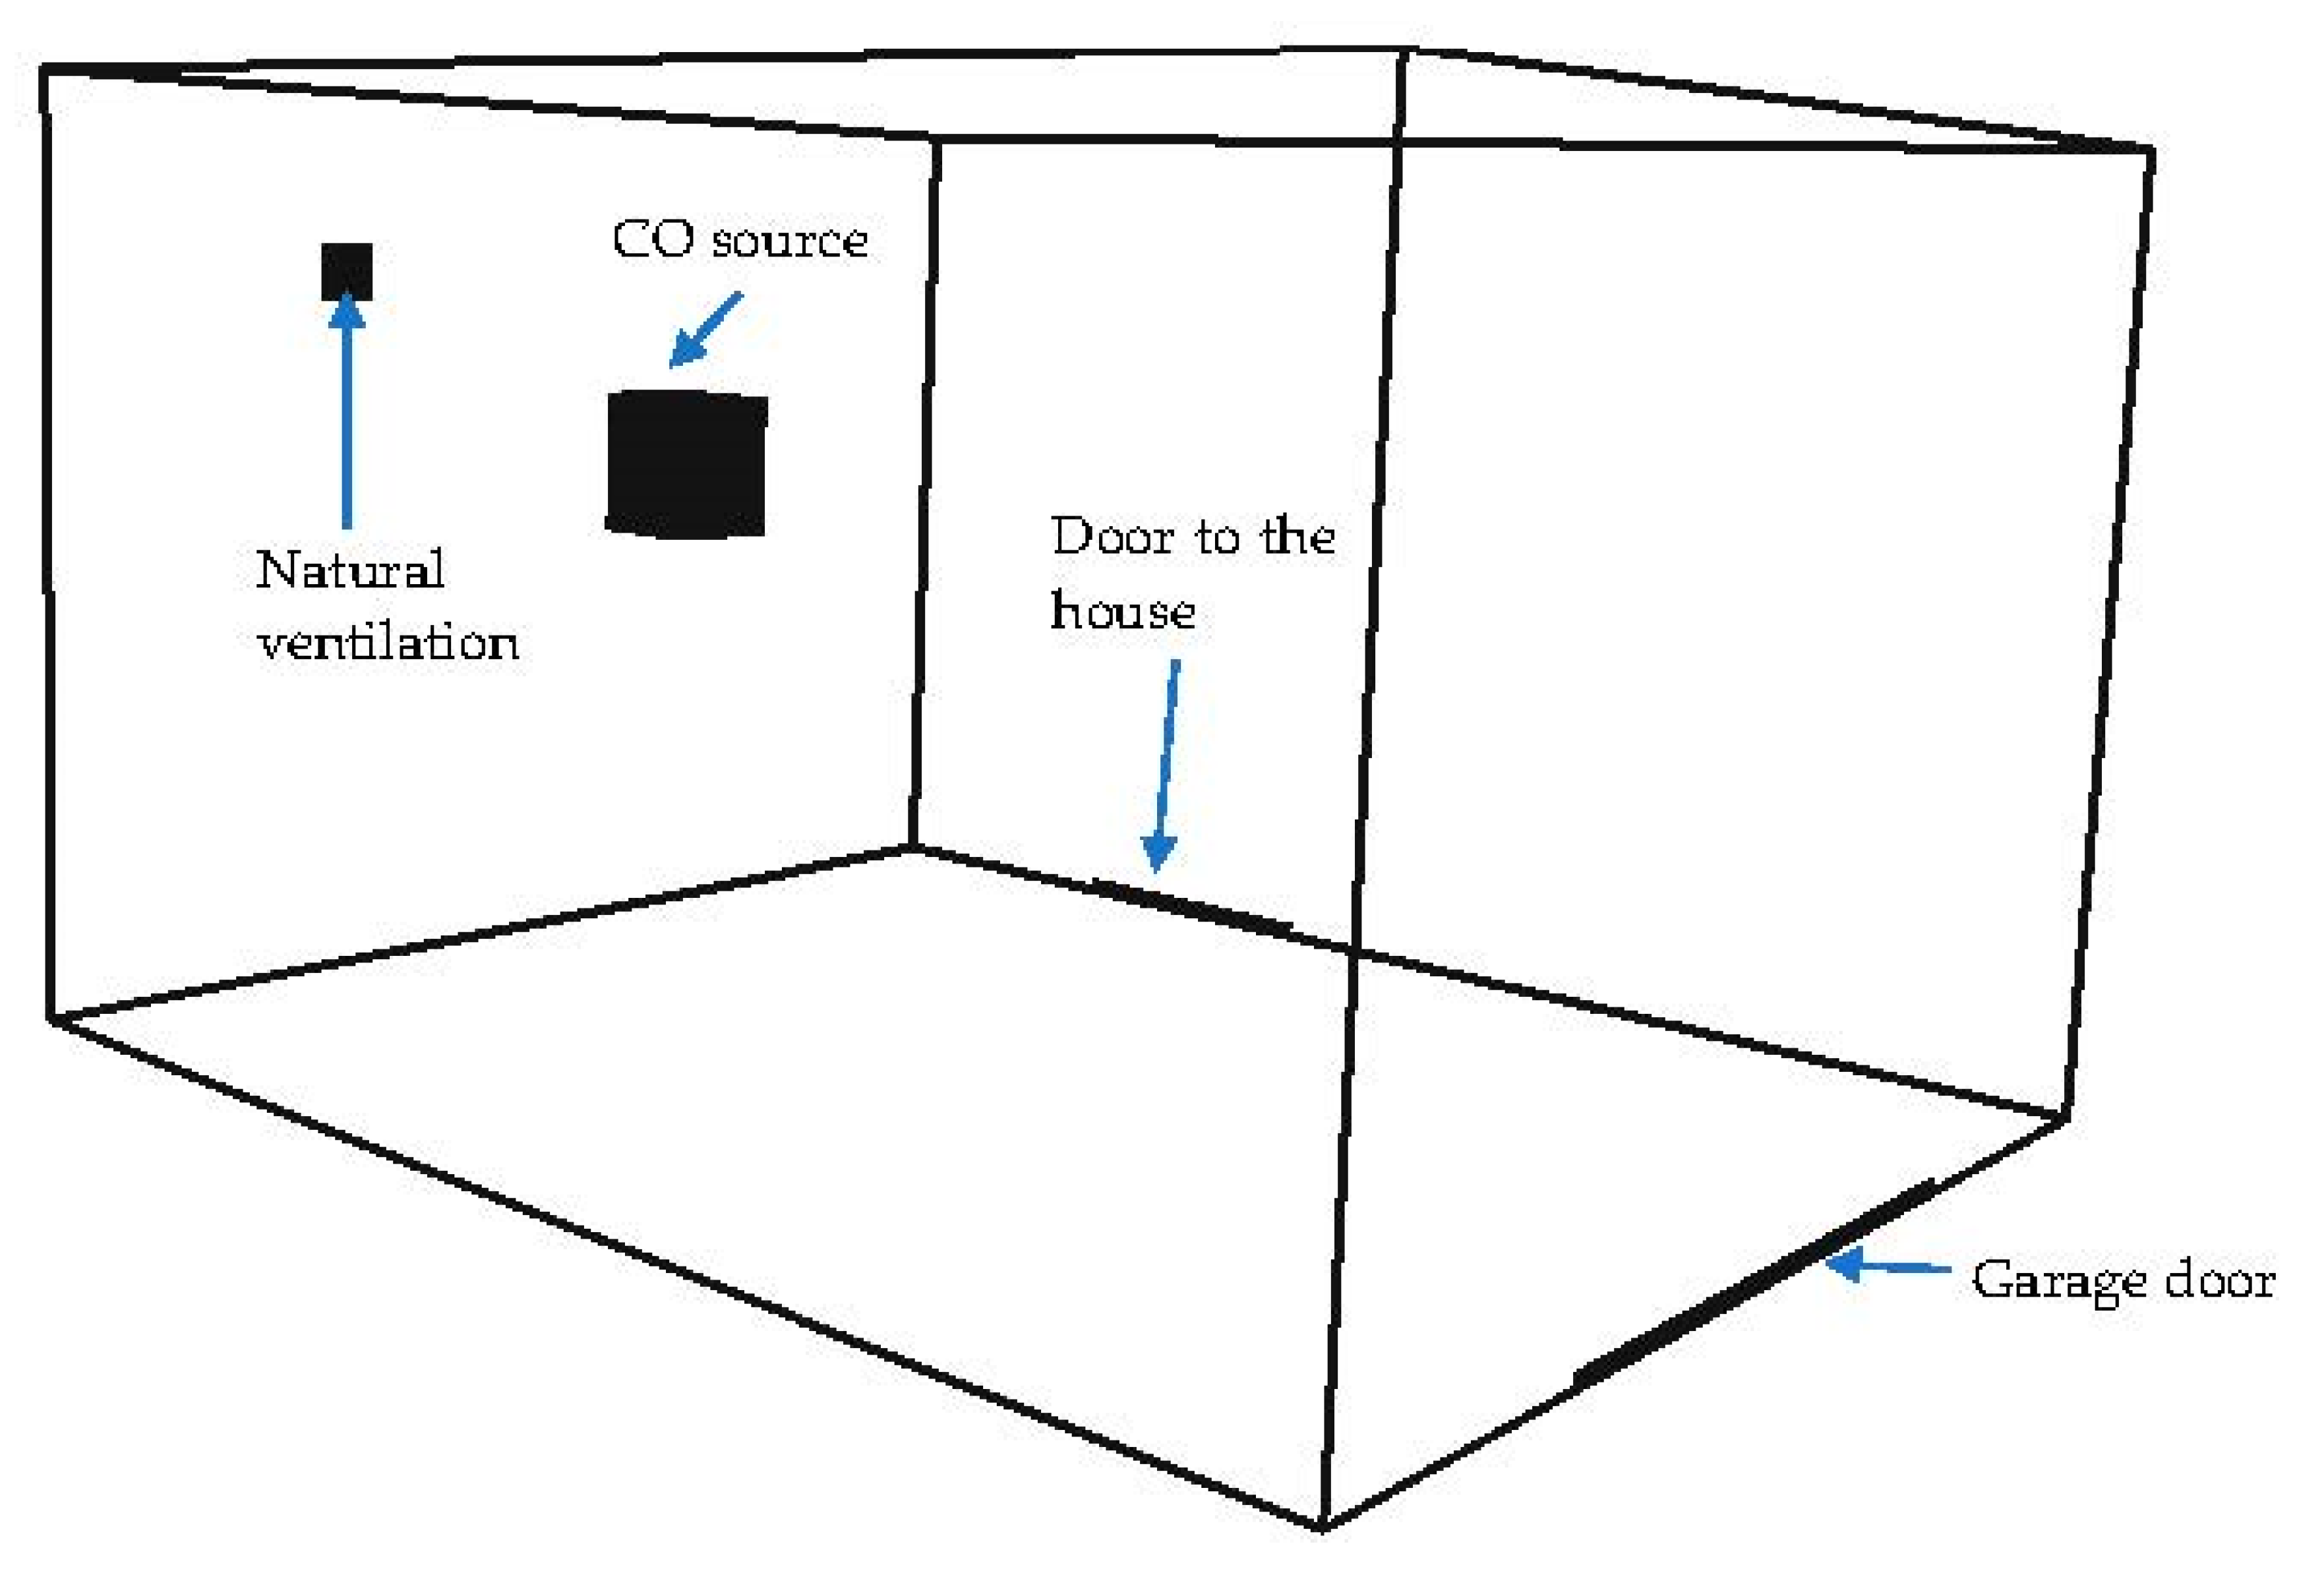
In this study, the chosen CFD zone was the garage, and its layout on the CFD0 software can be seen in Figure 2.
CFD0 code is based on the finite volume method. In this method, the domain is divided into a set of small control cells, defined by a mesh. For the CFD0 code, only zero-equation and standard k-ε are available as turbulence models. For this study, the simulation was solved with the k-ε turbulence model and wall functions. The power-law option was selected, since it has been proven to produce useful results in flow simulations [44]. Boundary conditions were imposed by the CONTAM software for the coupled simulation (CONTAM → CFD → CONTAM). In this coupling method, CONTAM provides a pressure and contaminant boundary condition to CFD0, and the results from the zone are returned to CONTAM. It was selected for this research as it provides a stable and convergent coupling solution [44].
In this study, equation residuals were used to assess convergence. The solutions were considered converged when the scaled residuals were less than 10−6 for the momentum, turbulence dissipation, energy, and species [45,46].
The CFD0 editor only allows one type of mesh: the hexahedral mesh, which was used in this study. The mesh used for the study had an element count of 1,000,000 elements. A mesh independence test was done using the mean velocity of the outlet vent in the garage, and is shown in Table 3.
Four different scenarios were taken into consideration while conducting the study:
  • Case 1: The furnace was on the same wall as the door to the house.
  • Case 2: The furnace was on the perpendicular wall in relation to the door to the house (opposite the garage door).
  • Case 3: The furnace was on the opposite wall than the door to the house.
  • Case 4: The furnace was on the opposite wall than the door to the house, but the outlet vent was on the same wall as the door.
For all cases in both the multizone and CFD simulations, the input parameters were identical; the only changes were in the location of the furnace and/or the ventilation grill. The timeframe for each simulation was 24 h.

3. Results

To determine if the placement of a faulty gas furnace, with respect to the natural ventilation system, influenced the contaminant migration into an attached house, a series of the simulation were carried out. The simulations were carried out for a period of 24 h to eliminate the influence of boundary conditions on the results.
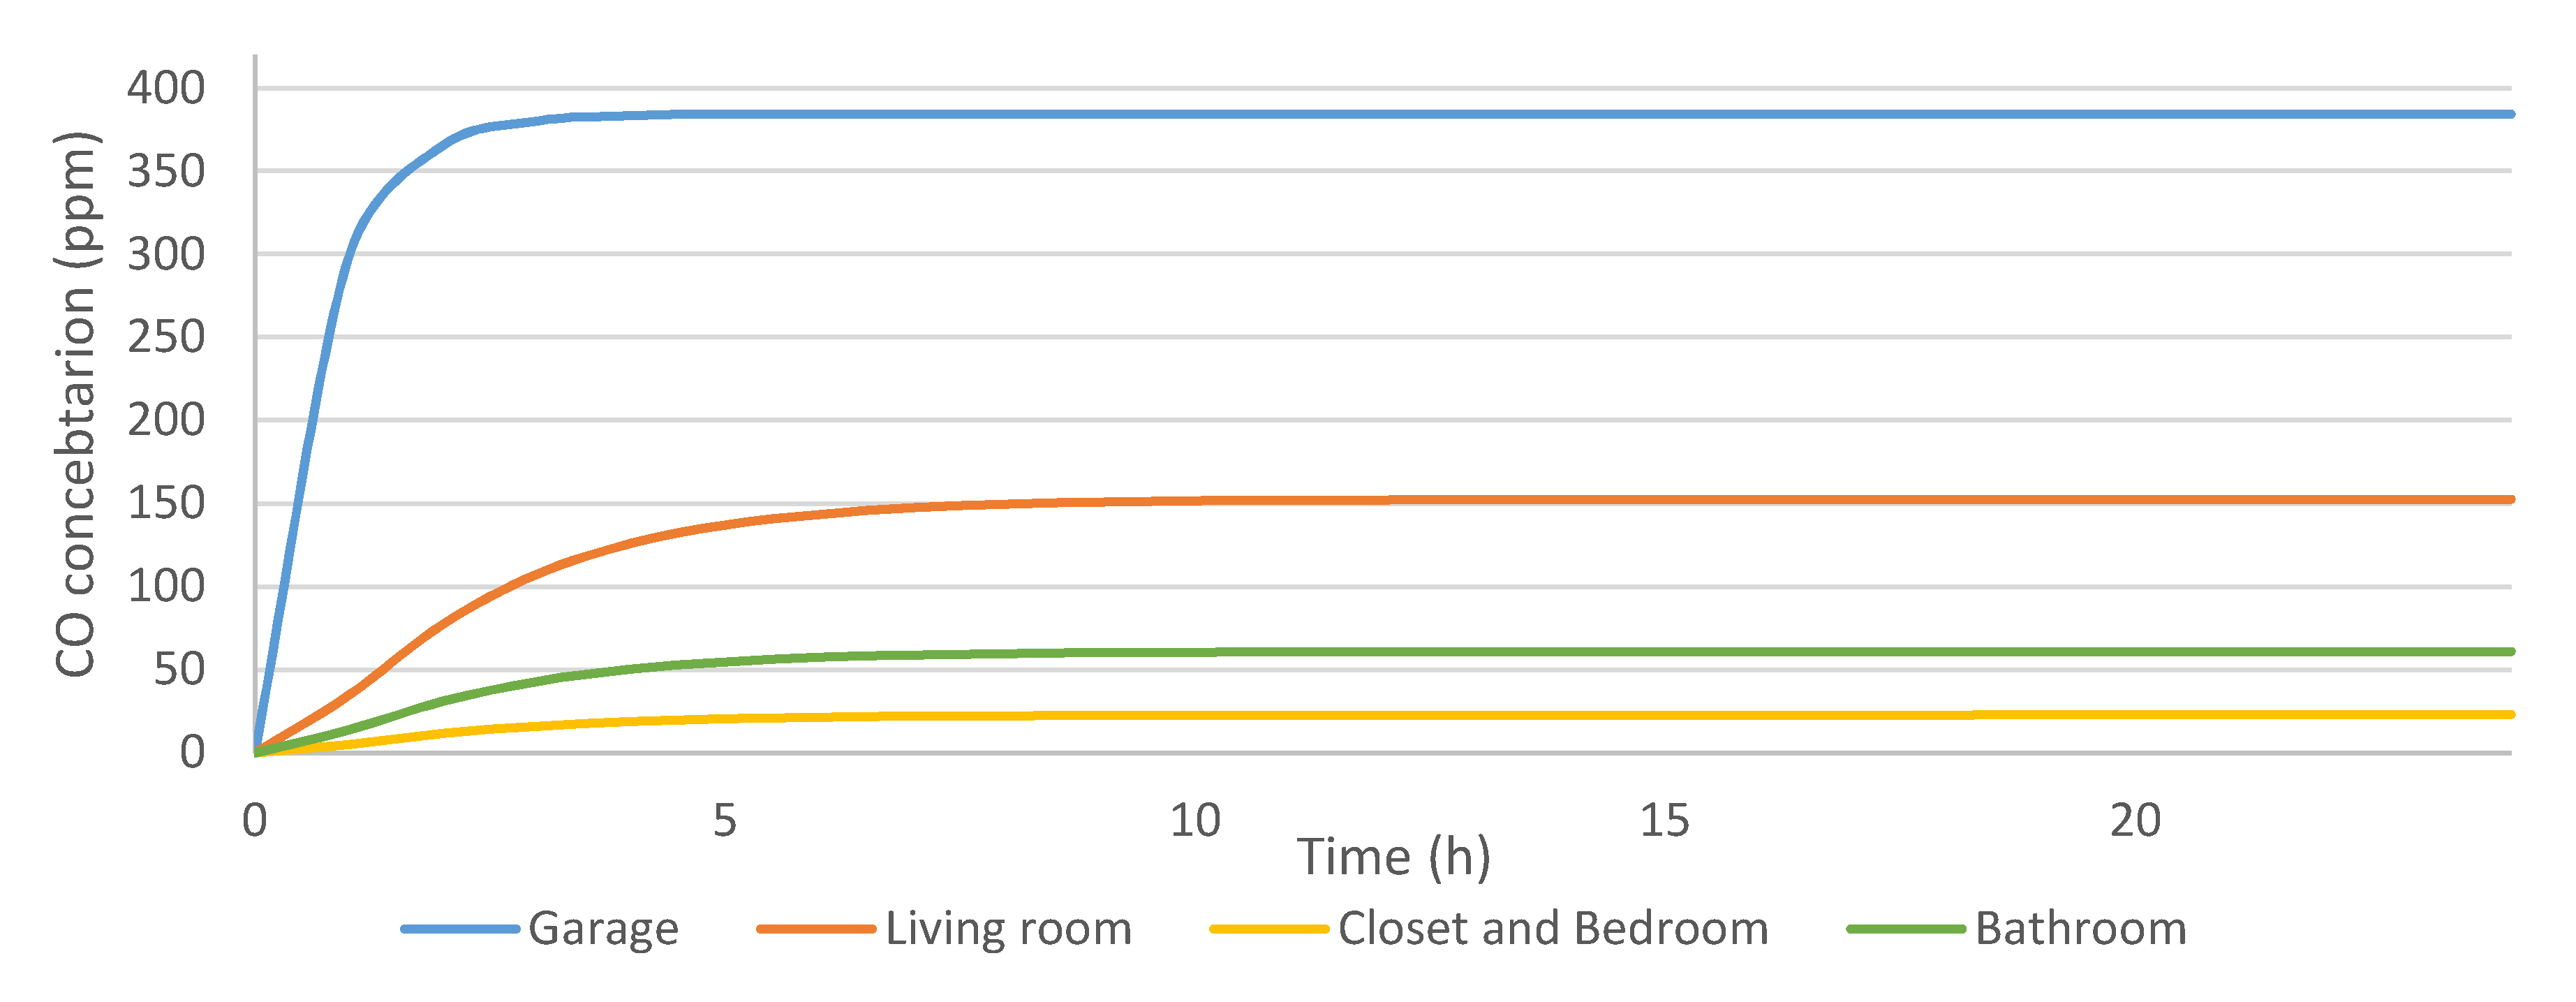
First, the simulations were done primarily in CONTAM to see how the contaminant migrates from the garage into the living room. The results are shown in Figure 3. It shows that with the depleted air exhaust from the furnace, the contaminant concentration rises rapidly in the garage in a period of under 1 h. In the living room, the concentration rises to the level of 100 ppm. Both these levels are hazardous for occupants, and above the recommended safety levels. In the bedroom, as well as the closet, the concentrations are 55 ppm and 15 ppm, respectively, which is much lower than the first two rooms, but is still not an acceptable level. The closet and the bedroom had a similar concentration as they had the same flow paths and similar dimensions.
After obtaining the results from the CONTAM simulations, a series of CFD simulations were carried out using the CFD0 application. The garage was chosen as the CFD zone and four cases were taken under consideration, as stated in the previous chapter
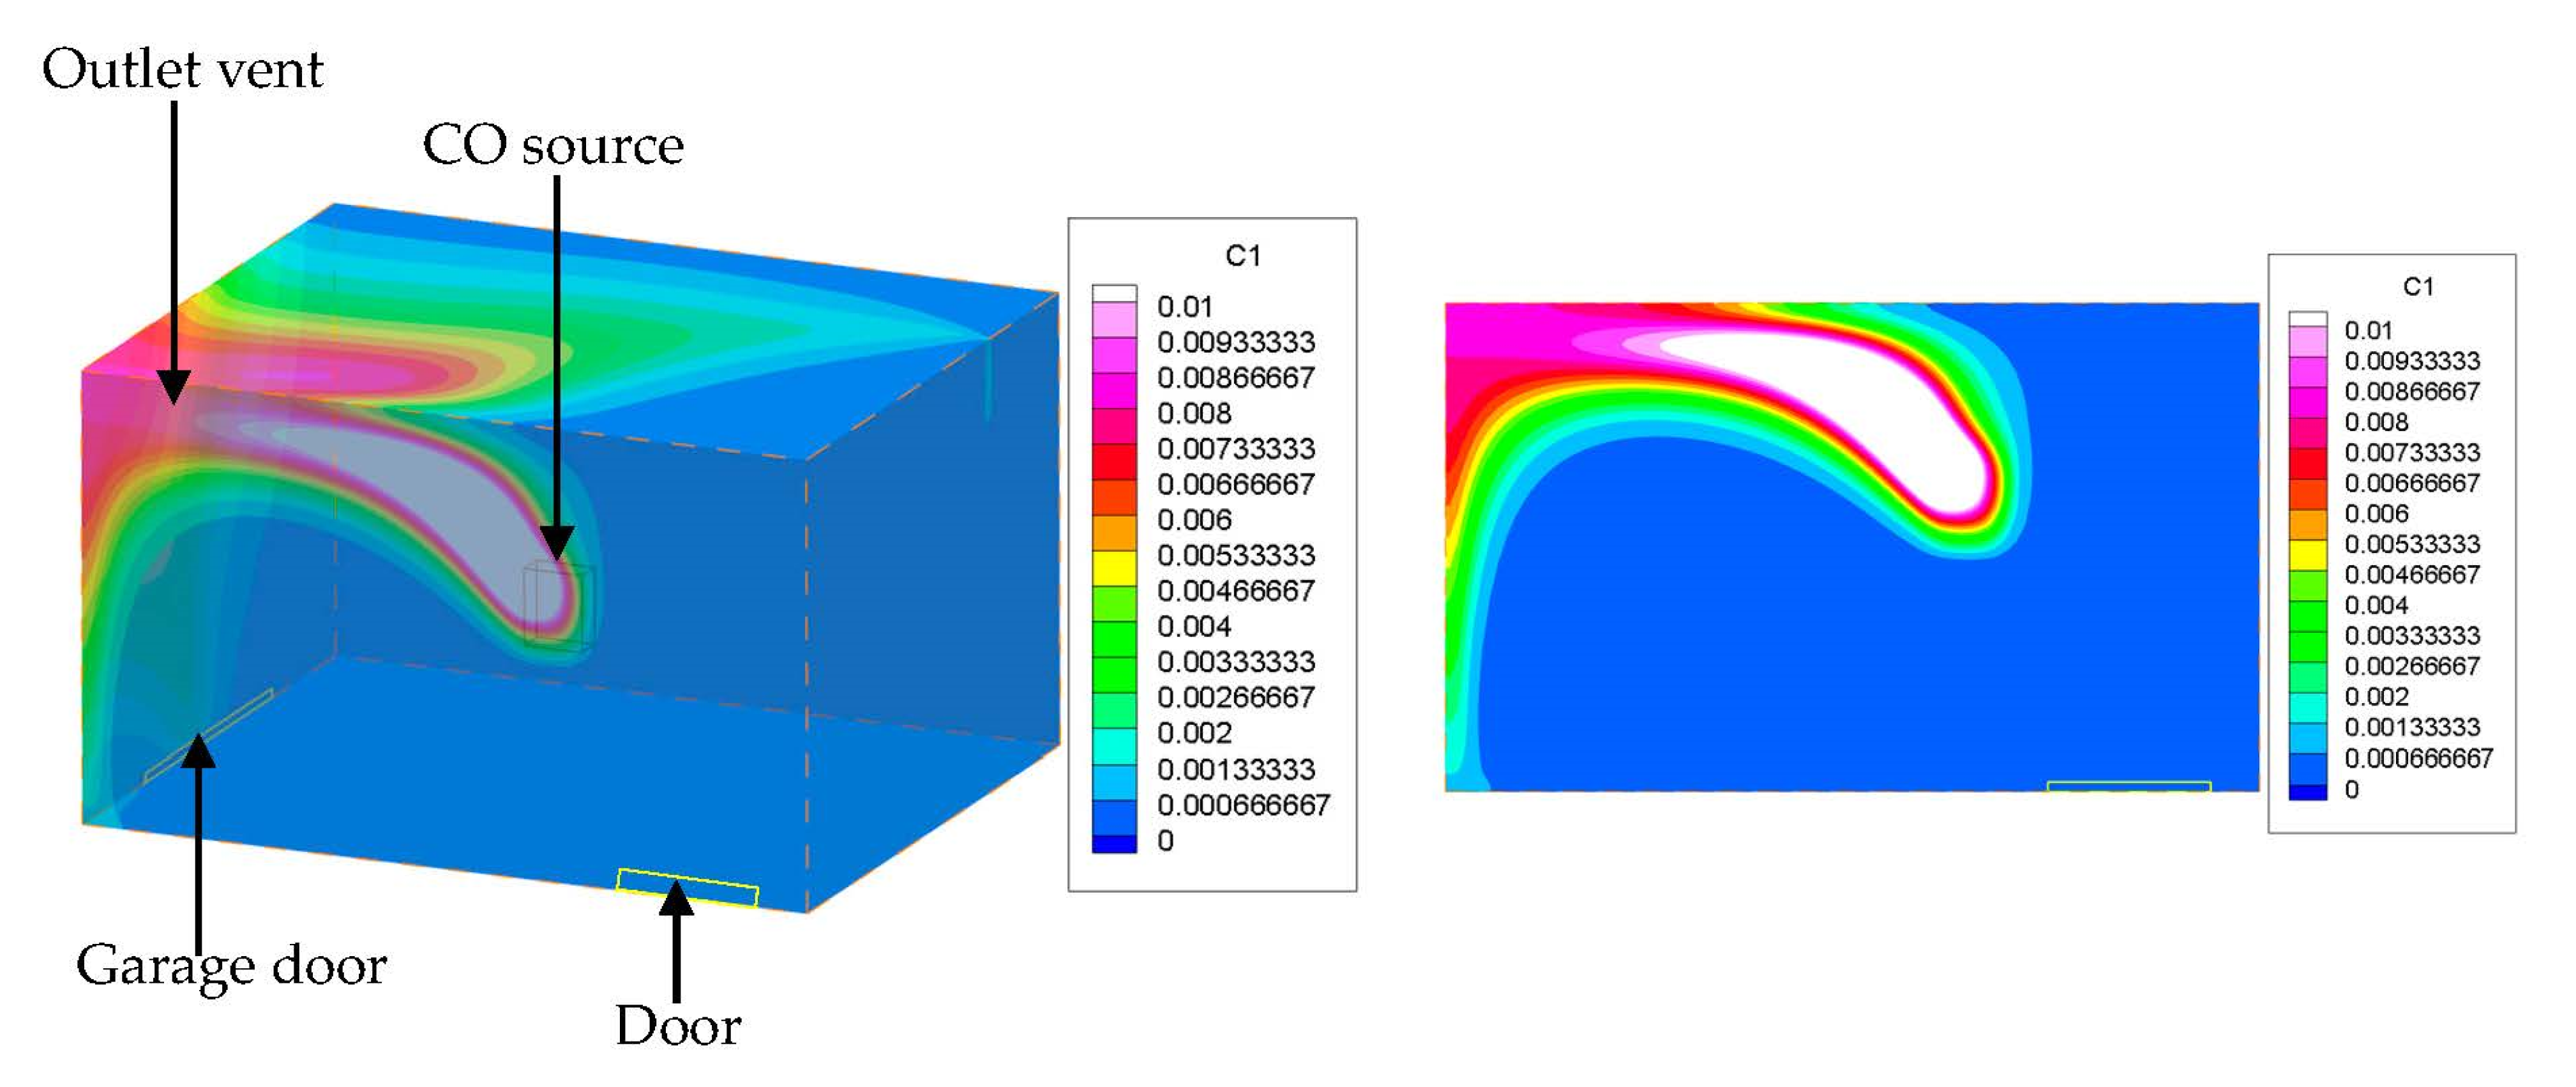
In the first case, the furnace was on the same wall as the door to the attached house. The results are shown in Figure 4. It shows that the majority of the contaminant accumulate in the garage before exiting through the ventilation system. This is hazardous for occupants that would use the garage, as it can even lead to their death.
In the second case, the furnace was on the same wall exhaust vent—perpendicular in relation to the door to the house (opposite the garage door). The results are presented in Figure 5. Contaminants still flow into the house, but the majority flow directly into the outlet vent. Additionally, the majority of contaminants remain in one area of the garage and do not fill the room.
Figure 6 presents case 3, where the furnace was on the opposite wall than the door to the house. In this case, the contaminant accumulation is the lowest. The least amount of contaminants flow into the house, and the majority of carbon monoxide goes directly to the outlet vent.
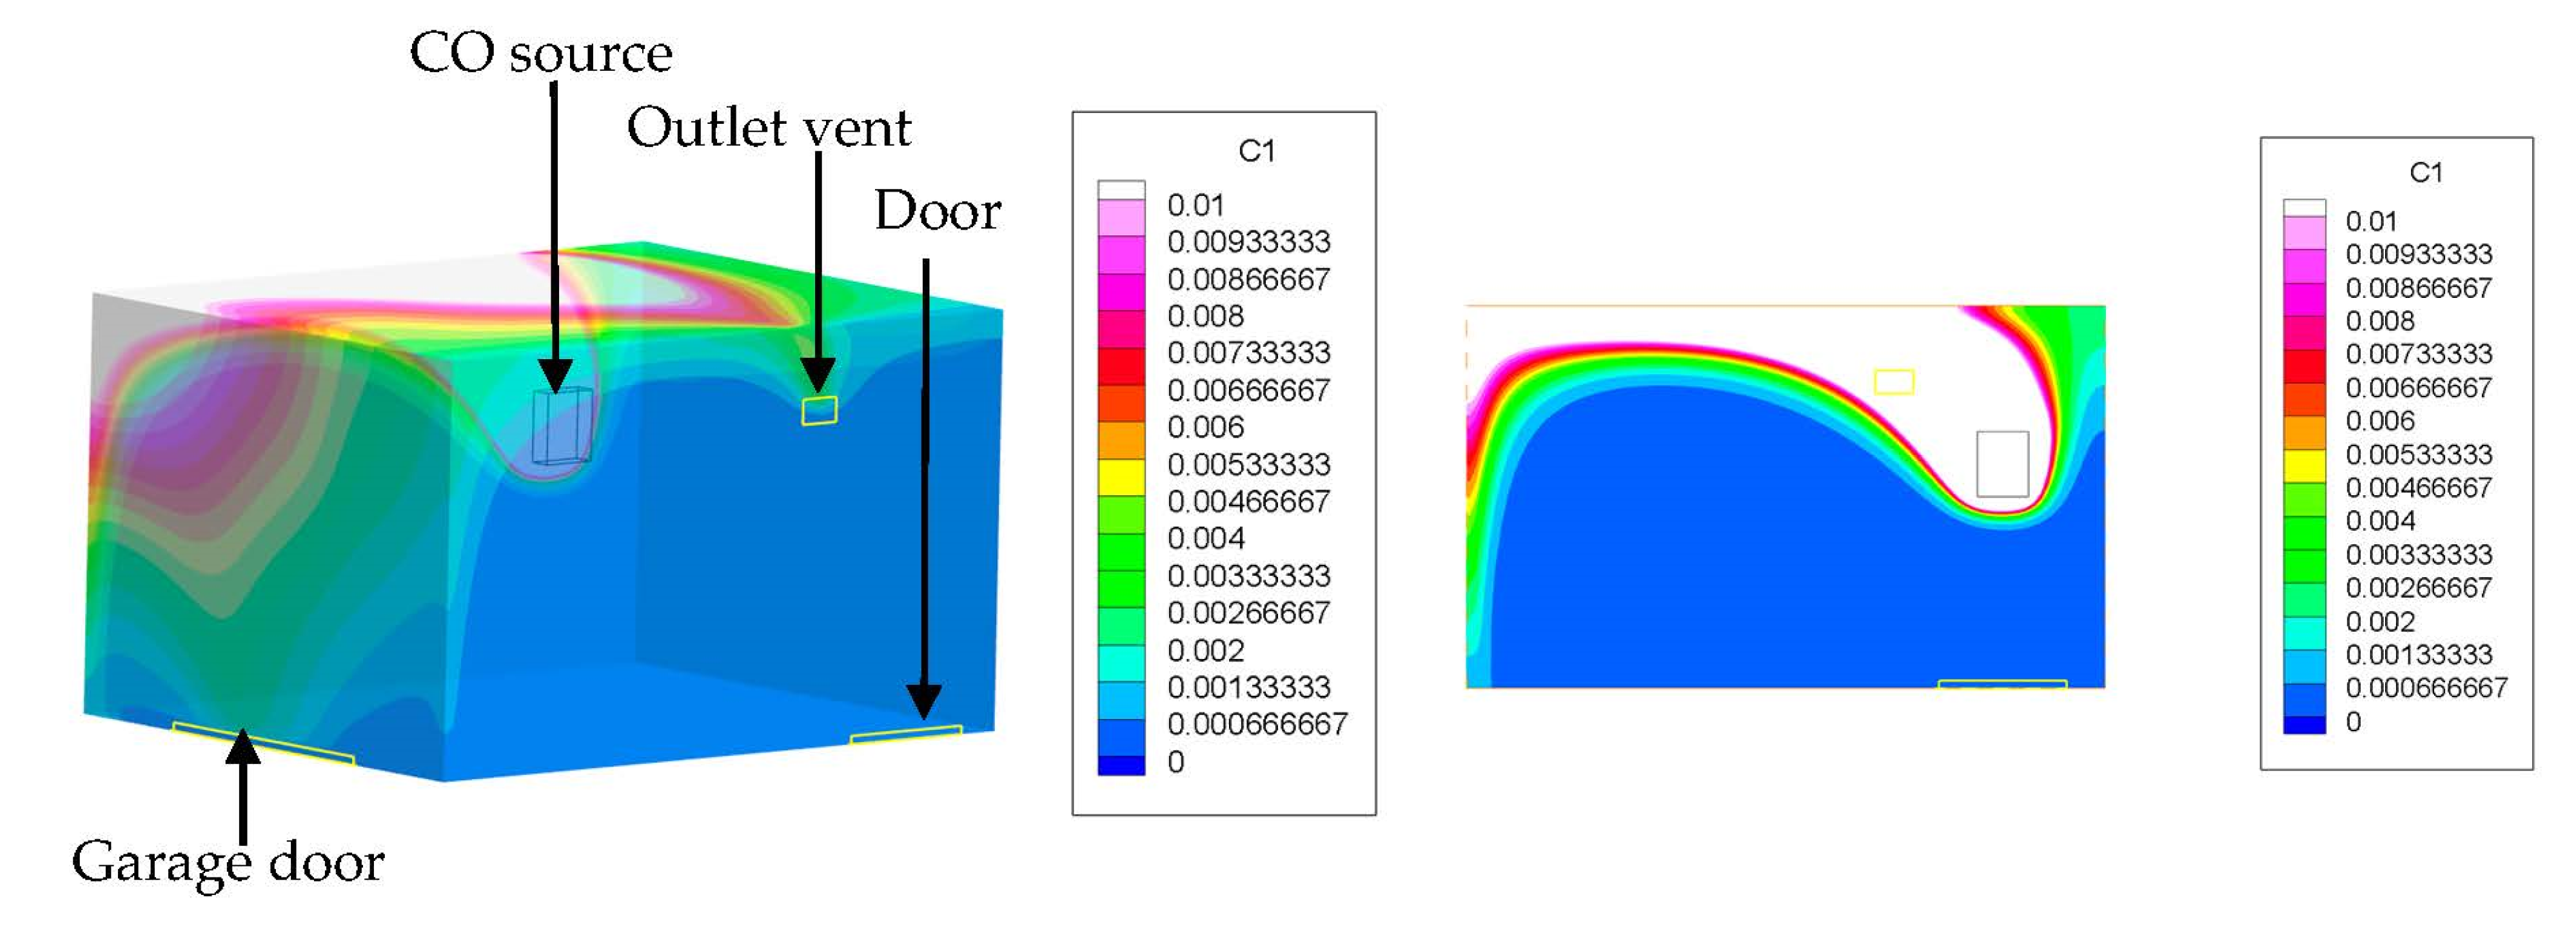
In case 4, the furnace was on the opposite wall than the door to the house, but the ventilation grill was on the same wall as the door. The results are presented in Figure 7. The contaminant accumulation, in this case, is the highest, as the carbon monoxide has to travel to the opposite wall to be extracted. This leads to high CO levels.
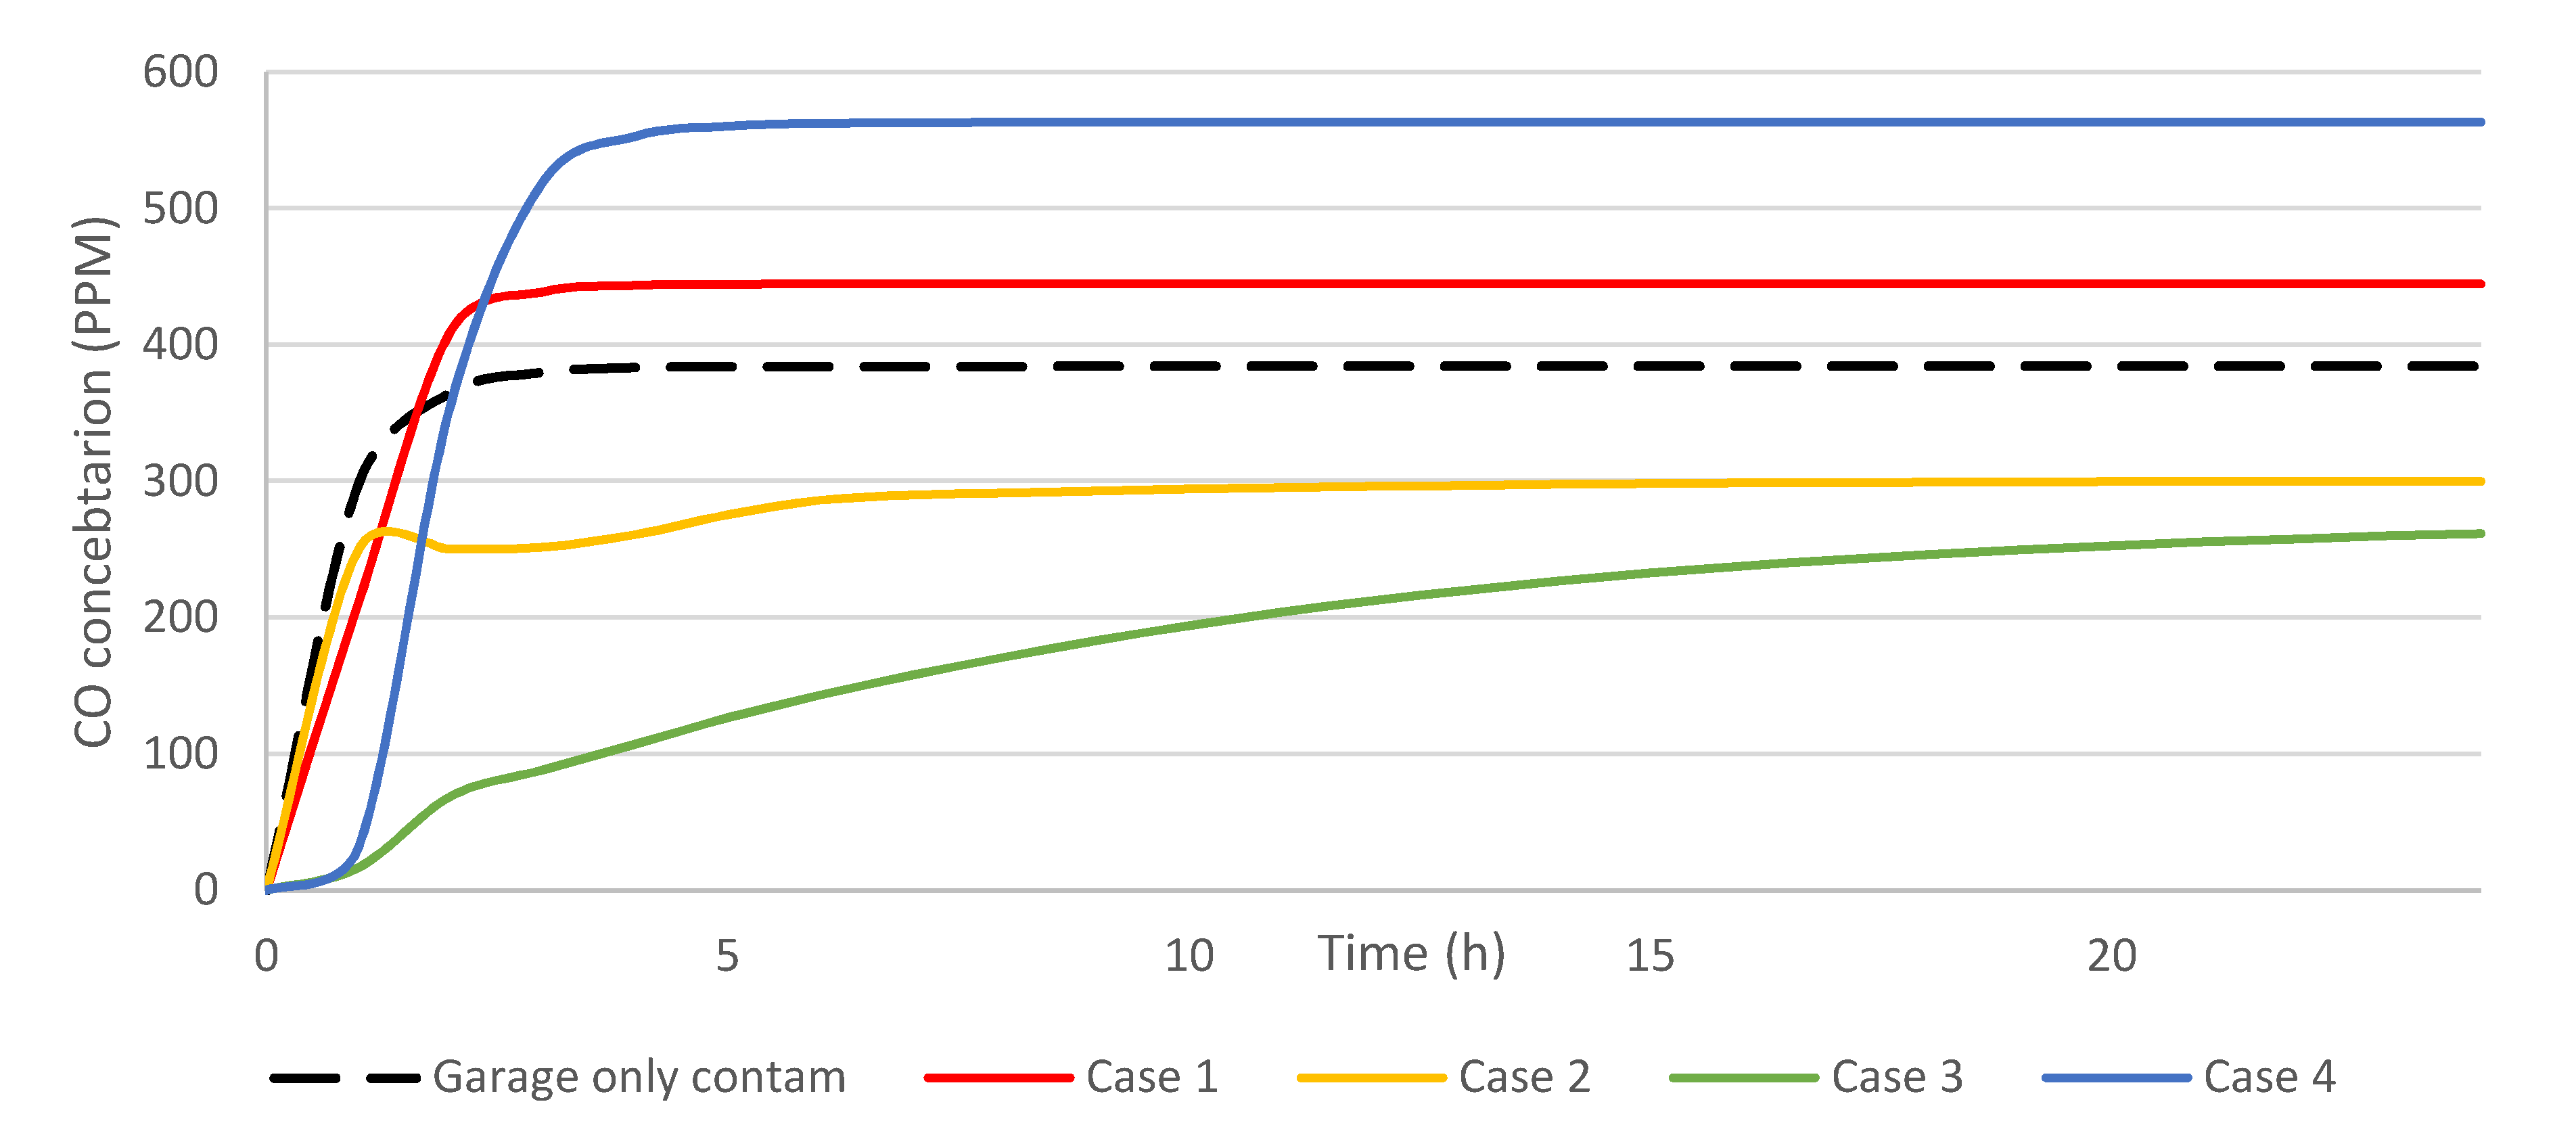
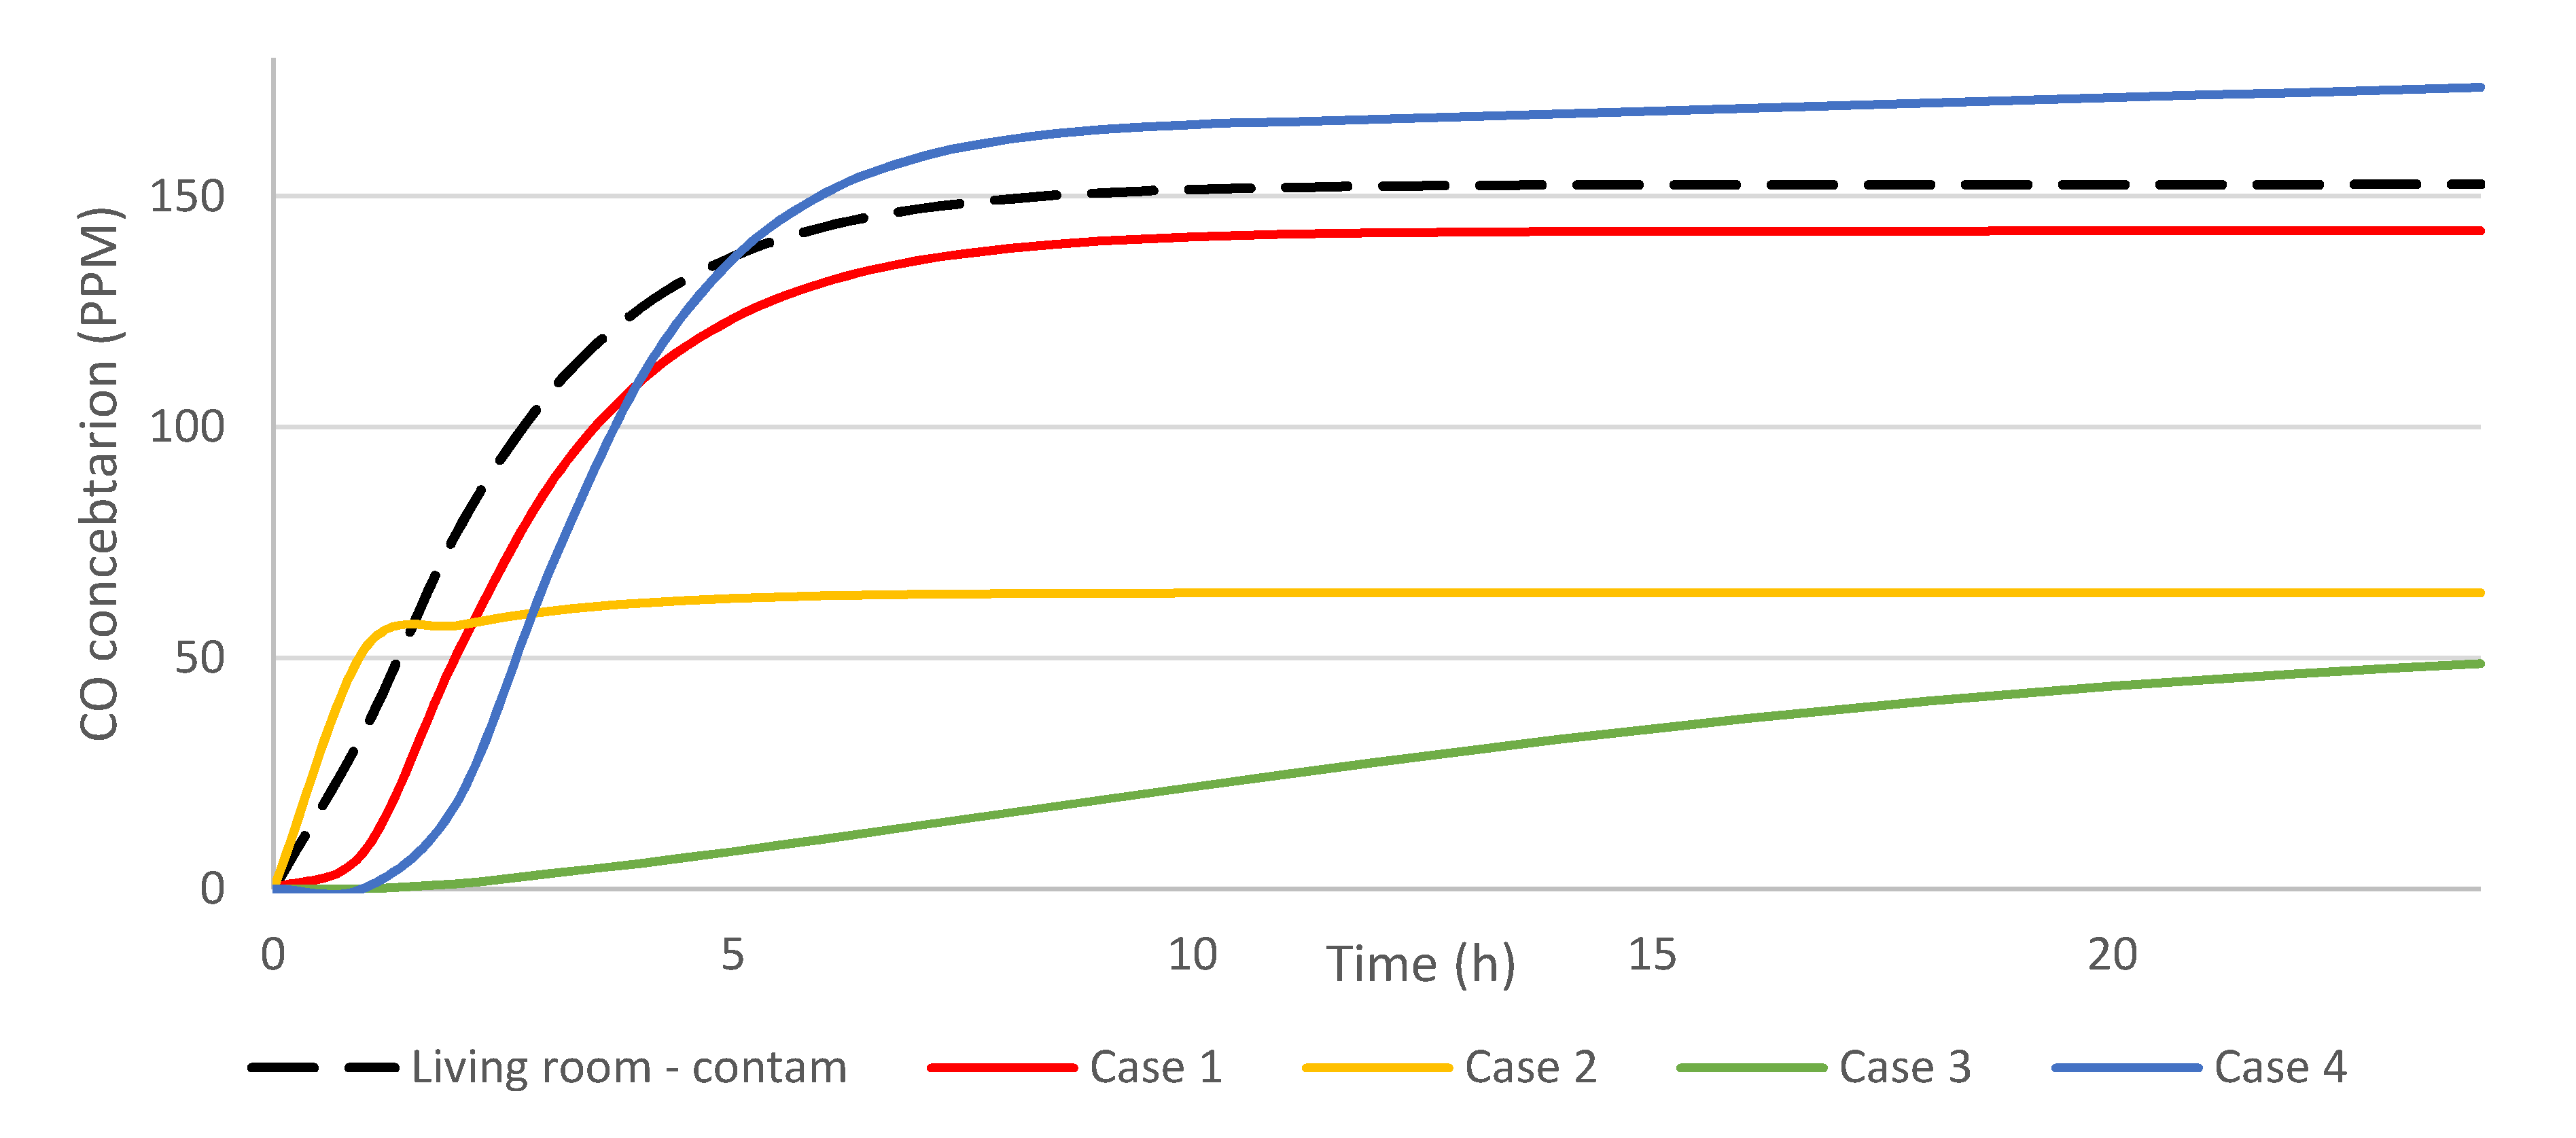
The coupled results between CONTAM and CFD0 are shown in Figure 8 and Figure 9. The results of the CFD simulations are directed to CONTAM, which uses the information for the multizone simulation of the house. Both in Figure 8 and Figure 9, the black dashed line represents the simulation done only in CONTAM without the CFD0 application as a basis for comparison. As is shown in these figures, the connection with the CFD program, as well as the change of placement of the furnace, alters the concentration on CO, not only in the garage, but also the amount of the contaminant that flows into the house.
For the garage, as well as for the rest of the building, the worst case was case 4, where the furnace was on the opposite wall than the door to the house and the ventilation grill was on the same wall as the door to the house. The concentration in the garage grew up to 565 ppm and 165 ppm in the living room.
The case in which the least contaminants were transported into the house was case 3, where the furnace was on the opposite wall than the door to the house without changing the placement of the outlet vent. The concentration in the garage was just below 260 ppm, while in the living room it was around 75 ppm. All of these concentrations are still above the maximum safety levels, but for case 3, they are much lower than in the worst-case scenario, improving the safety of occupants as well as allowing them more time to notice the faulty furnace before permanently damaging the occupants’ health.
As carbon monoxide is one of the most dangerous contaminants, it is important to create strategies to minimize its influence on occupants. The results prove that the placement of the furnace is vital and can influence contaminant migration. Such studies can be an important step before designing a house to improve ventilation strategies.
The results also show how the combination of the multizone program with a CFD application can impact contaminant concentration. While multizone programs can be helpful to estimate contaminant concentration, it is clear that CFD applications are more advanced and can predict the influence of small changes.

4. Conclusions

Research on the effects of furnace placement was conducted to see if it influenced the migration of carbon monoxide from a garage into an attached house, as well as its accumulation in the garage itself. The furnace and the outlet vent were moved for each case. Both multizone and CFD simulations for a period of 24 h were conducted.
The furnace was assumed to be faulty—lack of contaminant removal—to reflect a hazardous environment. Not only did CO accumulate in the garage, but it also leaked into the house, causing dangerous conditions for occupants. Four scenarios were taken into consideration. The best results were achieved when the furnace was on the opposite wall than the door to the attached house and the ventilation was not moved. The worst results were achieved when the furnace was on the opposite wall than the door to the attached house and the outlet vent was moved to the same wall as the door to the house. In this case, not only was the contaminant accumulation in the garage the highest, but the infiltration of CO into the living room was also the highest as well.
The results prove that the location of the furnace influences contaminant accumulation and migration. Such simulations can be an important tool when designing a ventilation system with respect to the furnace to improve the removal of dangerous substances.
The coupling of the multizone program with the CFD application allowed the analysis of the contaminant migration, as well as influenced the rest of the zones in the CONTAM model. The results show that the connection of the two programs allows better results, reflecting the real conditions, and can be a valid tool for airflow and contaminant analysis.

Author Contributions

Conceptualization: N.S.-S. and L.S.; methodology: N.S.-S.; software: N.S.-S.; validation: N.S.-S. and L.S.; formal analysis: L.S.; investigation: N.S.-S. and L.S.; data curation: N.S.-S. and L.S.; writing—original draft preparation: N.S.-S.; writing—review and editing: N.S.-S.; visualization: N.S.-S.; supervision: L.S.; project administration: L.S. All authors have read and agreed to the published version of the manuscript.

Funding

This research received no external funding.

Institutional Review Board Statement

Not applicable.

Informed Consent Statement

Not applicable.

Data Availability Statement

Data is contained within the article.

Conflicts of Interest

The authors declare no conflict of interest.

References

  1. Pyka, I.; Wierzchowski, K. Estimated mercury emissions from coal combustion in the households sector in Poland. J. Sustain. Min. 2016, 15, 66–72. [Google Scholar] [CrossRef] [Green Version]
  2. Central Statistical Office. Energy Consumption in Households. Statistical Information and Elaborations; Central Statistical Office: Warsaw, Poland, 2015.
  3. Delegature in katowice. Elimination of Boiler with Low Emission Household and Commune in the Silesia Province—Eliminacja Niskiej Emisji z Kotłowni Przydomowych i Gminnych w Województwie Śląskim; LKA.410.007.2016 Nr ewid. 191/2016/P/16/065/LKA; Supreme Audit Office: Warsaw, Poland, 2017.
  4. Batterman, S.; Jia, C.; Hatzivasilis, G. Migration of volatile organic compounds from attached garages to residences: A major exposure source. Environ. Res. 2007, 104, 224–240. [Google Scholar] [CrossRef] [PubMed]
  5. Dodson, R.E.; Levy, J.I.; Spengler, J.D.; Shine, J.P.; Bennett, D.H. Influence of basements, garages, and common hallways on indoor residential volatile organic compound concentrations. Atmos. Environ. 2008, 42, 1569–1581. [Google Scholar] [CrossRef]
  6. Gładyszewska-Fiedoruk, K.; Nieciecki, M. Indoor Air Quality in a Multi-car Garage. Energy Procedia 2016, 95, 132–139. [Google Scholar] [CrossRef] [Green Version]
  7. Mallach, G.; St-Jean, M.; MacNeill, M.; Aubin, D.; Wallace, L.; Shin, T.; Van Ryswyk, K.; Kulka, R.; You, H.; Fugler, D.; et al. Exhaust ventilation in attached garages improves residential indoor air quality. Indoor Air 2017, 27, 487–499. [Google Scholar] [CrossRef] [Green Version]
  8. Zhao, Y.; Song, X.; Wang, Y.; Zhao, J.; Zhu, K. Seasonal patterns of PM10, PM2.5, and PM1.0 concentrations in a naturally ventilated residential underground garage. Build. Environ. 2017, 124, 294–314. [Google Scholar] [CrossRef]
  9. Debia, M.; Trachy-Bourget, M.-C.; Beaudry, C.; Neesham-Grenon, E.; Perron, S.; Lapointe, C. Characterization of indoor diesel exhaust emissions from the parking garage of a school. Environ. Sci. Pollut. Res. 2017, 24, 4655–4665. [Google Scholar] [CrossRef] [Green Version]
  10. Fontaras, G.; Zacharof, N.G.; Ciuffo, B. Fuel consumption and CO2 emissions from passenger cars in Europe—Laboratory versus real-world emissions. Prog. Energy Combust. Sci. 2017, 60, 97–131. [Google Scholar] [CrossRef]
  11. Szczepanik-Ścisło, N.; Ścisło, Ł. Air leakage modelling and its influence on the air quality inside a garage. In Proceedings of the E3S Web of Conferences, EDP Sciences, Polanica-Zdrój, Poland, 16–18 April 2018; Volume 44. [Google Scholar]
  12. Badania, C. Badanie pilotażowe parametrów powietrza w garażu. Ciepłownictwo Ogrzew. Went. 2012, 8, 347–350. [Google Scholar]
  13. Byard, R.W. Carbon monoxide—The silent killer. Forensic Sci. Med. Pathol. 2019, 15, 1–2. [Google Scholar] [CrossRef] [Green Version]
  14. Can, G.; Saylll, U.; Aksu Sayman, Ö.; Kuyumcu, Ö.F.; Yllmaz, D.; Esen, E.; Yurtseven, E.; Erginöz, E. Mapping of carbon monoxide related death risk in Turkey: A ten-year analysis based on news agency records. BMC Public Health 2019, 19. [Google Scholar] [CrossRef] [PubMed] [Green Version]
  15. Mazo, J.; Mukhtar, E.; Mazo, Y.; Nagaraj, A.; Mantello, M.T. Delayed brain injury post carbon monoxide poisoning. Radiol. Case Rep. 2020, 15, 1845–1848. [Google Scholar] [CrossRef] [PubMed]
  16. Hurley, R.A.; Hopkins, R.O.; Bigler, E.D.; Taber, K.H. Applications of functional imaging to carbon monoxide poisoning. J. Neuropsychiatry Clin. Neurosci. 2001, 13, 157–160. [Google Scholar] [CrossRef] [PubMed]
  17. Veiraiah, A. Carbon monoxide poisoning. Medicine (UK) 2020, 48, 197–198. [Google Scholar] [CrossRef] [Green Version]
  18. Dols, W.S.; Polidoro, B.J. CONTAM User Guide and Program; Documentation Version 3.4; National Institute of Standards and Technology: Gaithersburg, MD, USA, 2020.
  19. National Institute of Standards and Technology|NIST. Available online: https://www.nist.gov/ (accessed on 16 November 2020).
  20. Emmerich, S.J.; Zimmerman, S.M.; Nabinger, S.J.; Brookman, M.J.; Zimmerman, S.M. Carbon Monoxide Concentrations and Carboxyhemoglobin Profiles from Portable Generators with a CO Safety Shutoff Operating in a Test House; US Department of Commerce: Washington, DC, USA, 2019.
  21. Ng, L.C.; Ojeda Quiles, N.; Dols, W.S.; Emmerich, S.J. Weather correlations to calculate infiltration rates for U.S. commercial building energy models. Build. Environ. 2018, 127, 47–57. [Google Scholar] [CrossRef]
  22. Fine, J.P.; Gray, J.; Tian, X.; Touchie, M.F. An investigation of alternative methods for determining envelope airtightness from suite-based testing in multi-unit residential buildings. Energy Build. 2020, 214, 109845. [Google Scholar] [CrossRef]
  23. Lin, W.; Li, L.; Liu, X.; Zhang, T. On-site measurement and numerical investigation of the airflow characteristics in an aquatics center. J. Build. Eng. 2020, 101968. [Google Scholar] [CrossRef]
  24. Andrew, K.; Brian, J.; Steven, J. Residential Carbon Monoxide Exposure due to Indoor Generator Operation: Effects of Source Location and Emission Rate; US Department of Commerce: Washington, DC, USA, 2013.
  25. Barbosa, B.P.P.; de Carvalho Lobo Brum, N. Validation and assessment of the CFD-0 module of CONTAM software for airborne contaminant transport simulation in laboratory and hospital applications. Build. Environ. 2018, 142, 139–152. [Google Scholar] [CrossRef]
  26. Liu, W.; Liu, D.; Gao, N. CFD study on gaseous pollutant transmission characteristics under different ventilation strategies in a typical chemical laboratory. Build. Environ. 2017, 126, 238–251. [Google Scholar] [CrossRef]
  27. Jose, R.S.; Pérez, J.L.; Gonzalez-Barras, R.M. Multizone airflow and pollution simulations of indoor emission sources. Sci. Total Environ. 2020, 142593. [Google Scholar] [CrossRef]
  28. Argyropoulos, C.D.; Hassan, H.; Kumar, P.; Kakosimos, K.E. Measurements and modelling of particulate matter building ingress during a severe dust storm event. Build. Environ. 2020, 167, 106441. [Google Scholar] [CrossRef]
  29. Hurnik, M.; Specjal, A.; Popiolek, Z. On-site diagnosis of hybrid ventilation system in a renovated single-family house. Energy Build. 2017, 149, 123–132. [Google Scholar] [CrossRef]
  30. Sun, Z.; Wang, S. A CFD-based test method for control of indoor environment and space ventilation. Build. Environ. 2010, 45, 1441–1447. [Google Scholar] [CrossRef]
  31. Du, Z.; Xu, P.; Jin, X.; Liu, Q. Temperature sensor placement optimization for VAV control using CFD–BES co-simulation strategy. Build. Environ. 2015, 85, 104–113. [Google Scholar] [CrossRef]
  32. Gangisetti, K.; Claridge, D.E.; Srebric, J.; Paulus, M.T. Influence of reduced VAV flow settings on indoor thermal comfort in an office space. Build. Simul. 2016, 9, 101–111. [Google Scholar] [CrossRef]
  33. Nada, S.A.; El-Batsh, H.M.; Elattar, H.F.; Ali, N.M. CFD investigation of airflow pattern, temperature distribution and thermal comfort of UFAD system for theater buildings applications. J. Build. Eng. 2016, 6, 274–300. [Google Scholar] [CrossRef]
  34. Mu, Y.; Liu, M.; Ma, Z.; Zhang, J. Resistance characteristic analysis based study on a novel damper torque airflow sensor for VAV terminals. Build. Environ. 2020, 175, 106813. [Google Scholar] [CrossRef]
  35. Hurnik, M. Novel cylindrical induction controller and its application in VAV air conditioning system in an office building. Energy Build. 2016, 130, 341–349. [Google Scholar] [CrossRef]
  36. Liu, R.; Wen, J.; Waring, M.S. Improving airflow measurement accuracy in VAV terminal units using flow conditioners. Build. Environ. 2014, 71, 81–94. [Google Scholar] [CrossRef]
  37. Pasut, W.; Bauman, F.; De Carli, M. The use of ducts to improve the control of supply air temperature rise in UFAD systems: CFD and lab study. Appl. Energy 2014, 134, 490–498. [Google Scholar] [CrossRef]
  38. Methodology for Optimization of Laboratory Hood Containment—Volumes I and II. Available online: https://www.orf.od.nih.gov/TechnicalResources/Bioenvironmental/Pages/labhoodcontainm.aspx (accessed on 19 November 2020).
  39. Memarzadeh, F. Effect of reducing ventilation rate on indoor air quality and energy cost in laboratories. J. Chem. Health Saf. 2019, 16, 20–26. [Google Scholar] [CrossRef]
  40. WHO. WHO|Environmental Health Criteria 213: Carbon Monoxide; World Health Organization: Geneva, Switzerland, 2013. [Google Scholar]
  41. Liangzhu, W. Coupling of Multizone and CFD Programs for Building Airflow and Contaminant Transport Simulations. Ph.D. Thesis, Purdue University, West Lafayette, IN, USA, 2007. [Google Scholar]
  42. Wang, L.L.; Dols, W.S.; Chen, Q. Using CFD Capabilities of CONTAM 3.0 for Simulating Airflow and Contaminant Transport in and around Buildings. HVAC R Res. 2010, 16, 749–763. [Google Scholar] [CrossRef]
  43. Brown, C. Furnace Co Emissions Under Normal and Compromised Vent Conditions; United States Consumer Product Safety Commission: Washington, DC, USA, 2000; pp. 1–39.
  44. Versteeg, H.K.; Malalasekera, W. An Introduction to Computational Fluid Dynamits, 2nd ed.; Pearson Prentice Hall: Upper Saddle River, NJ, USA, 2007. [Google Scholar]
  45. Geng, L.; Liu, H.; Wei, X. CFD analysis of the fl ashing fl ow characteristics of subcritical refrigerant R134a through converging-diverging nozzles. Int. J. Therm. Sci. 2019, 137, 438–445. [Google Scholar] [CrossRef]
  46. Shan, X.; Luo, N.; Sun, K.; Hong, T.; Lee, Y.; Lu, W.; Engineering, C.; Kong, H.; Administrative, S. Coupling CFD and building energy modelling to optimize the operation of a large open office space for occupant comfort. Sustain. Cities Soc. 2020, 60, 102257. [Google Scholar] [CrossRef]
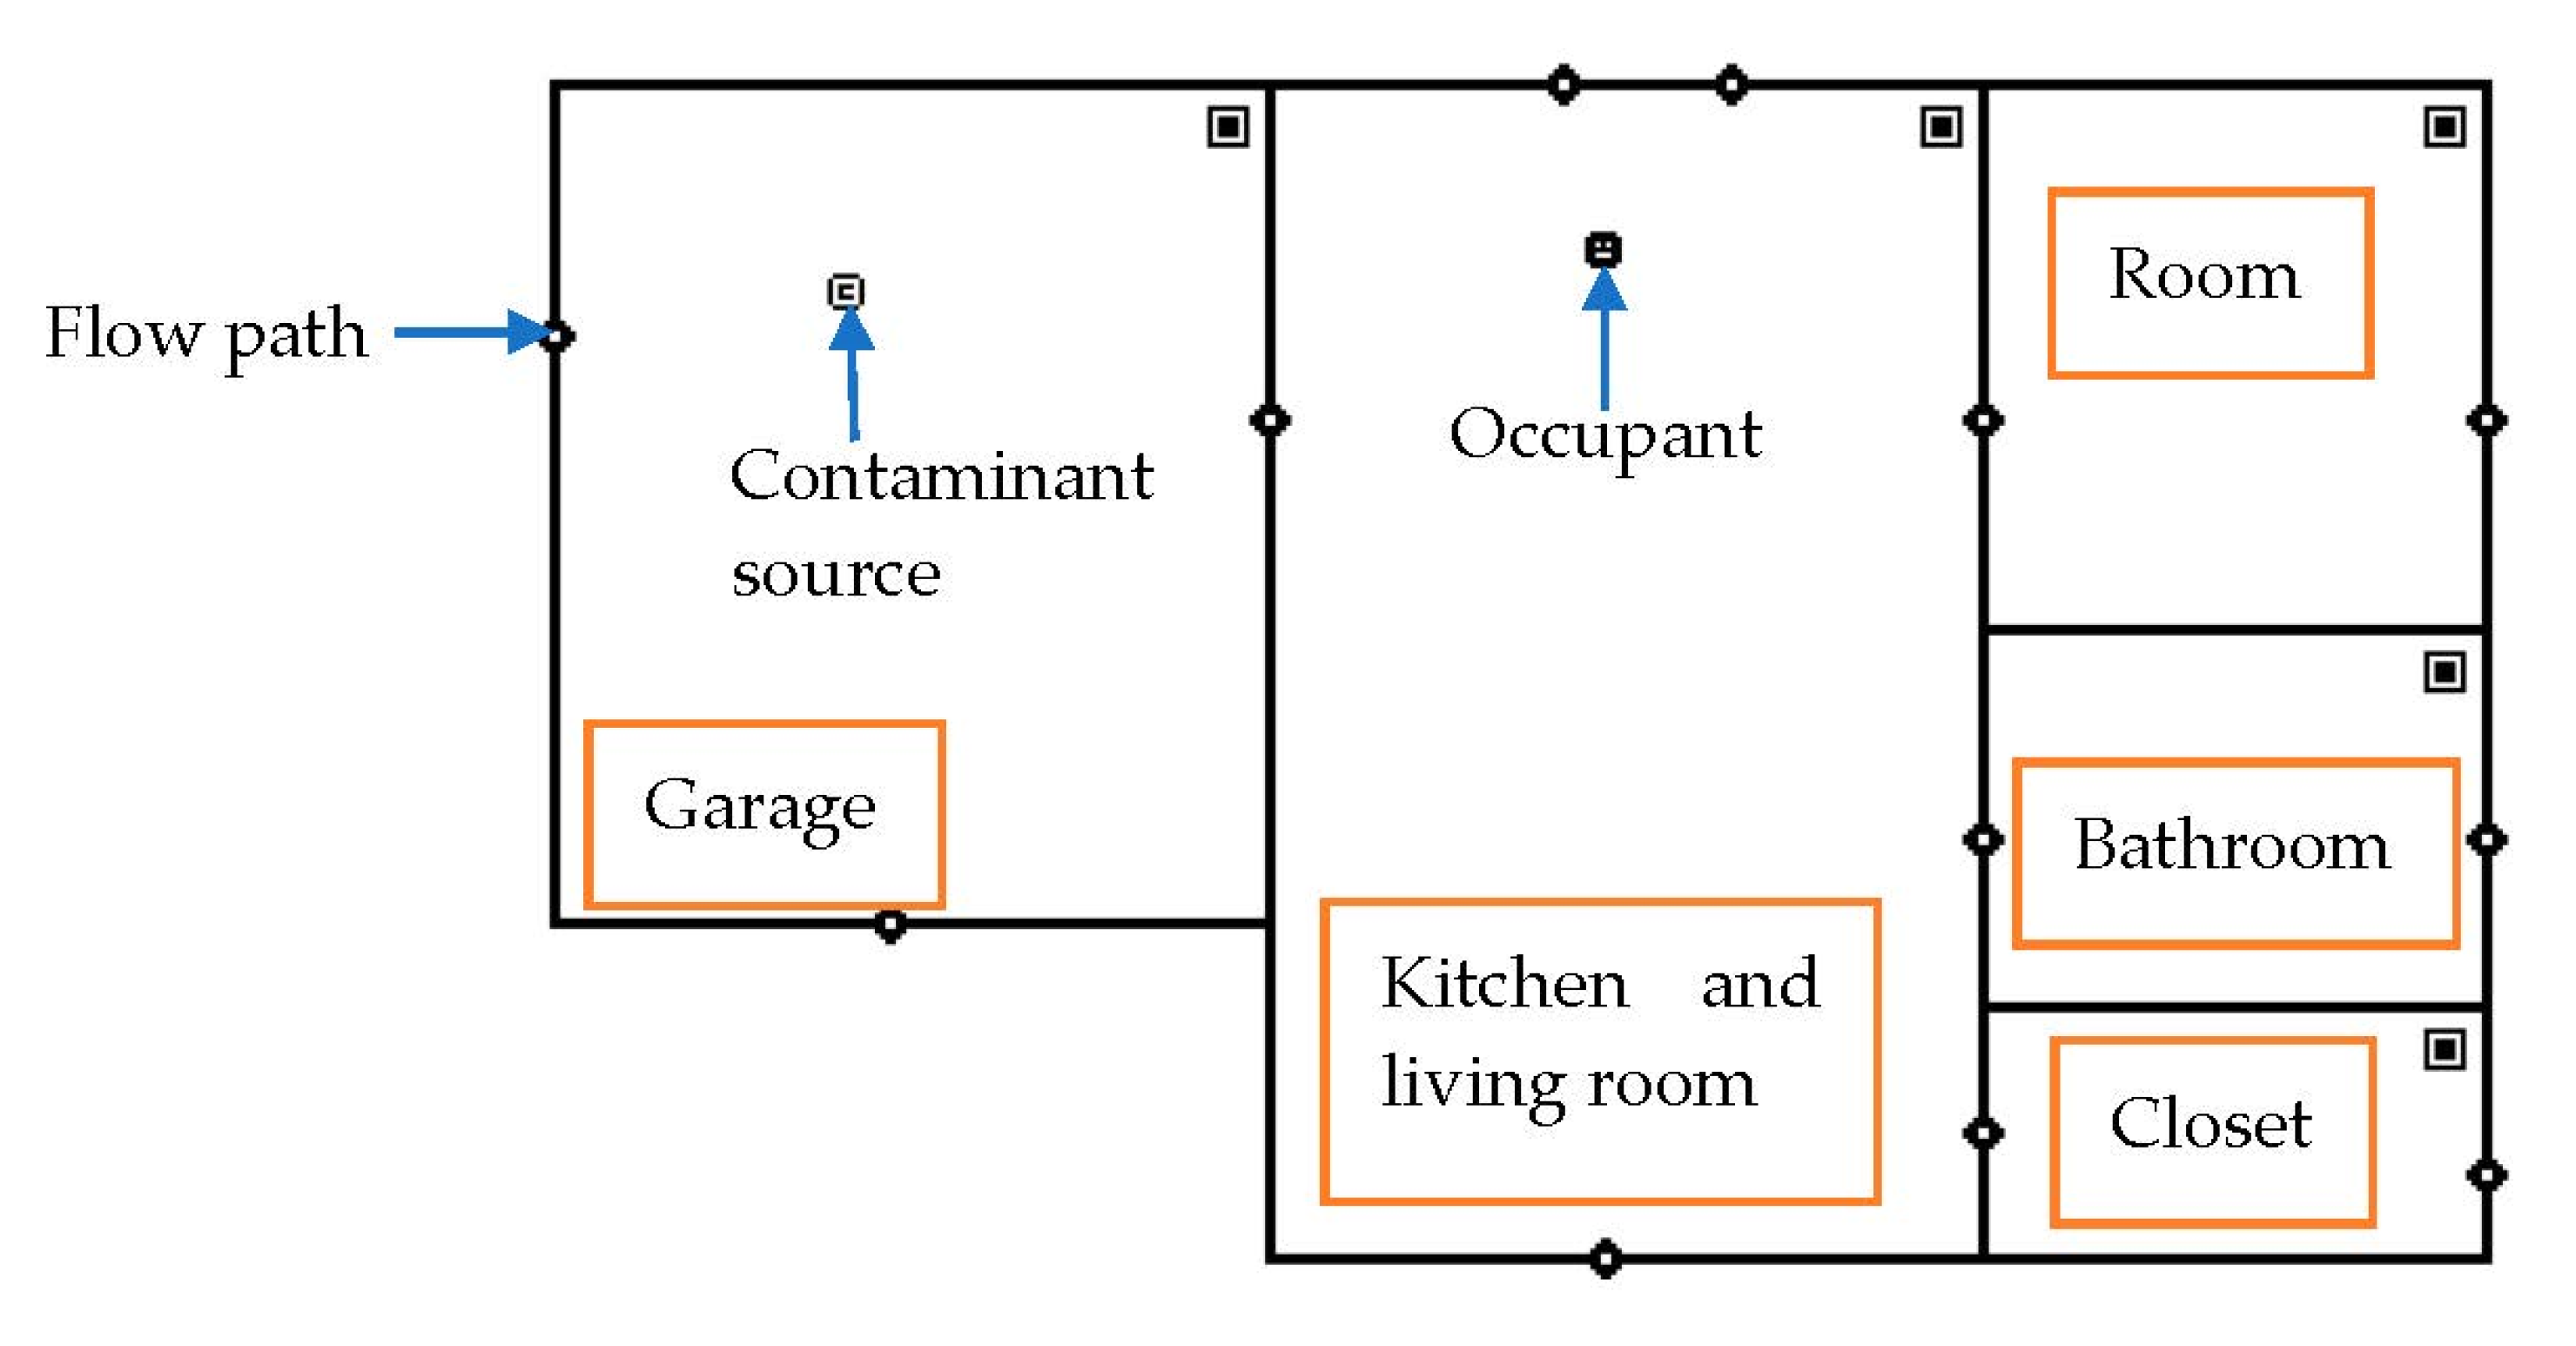
Figure 1. The layout of the house from the CONTAM application.
Atmosphere 12 00079 g001
Figure 2. Computational fluid dynamics 0 (CFD0) wall frame of the garage.
Atmosphere 12 00079 g002
Figure 3. Results of the CONTAM simulation.
Atmosphere 12 00079 g003
Figure 4. CO distribution in the garage—case 1 (concentration of CO in kg/kg).
Atmosphere 12 00079 g004
Figure 5. CO distribution in the garage—case 2 (concentration of CO in kg/kg).
Atmosphere 12 00079 g005
Figure 6. CO distribution in the garage—case 3 (concentration of CO in kg/kg).
Atmosphere 12 00079 g006
Figure 7. CO distribution in the garage—case 4 (concentration of CO in kg/kg).
Atmosphere 12 00079 g007
Figure 8. Coupled CONTAM and CFD0 results for the garage.
Atmosphere 12 00079 g008
Figure 9. Coupled CONTAM and CFD0 results for the living room.
Atmosphere 12 00079 g009
Table 1. CO concentrations and their effect on the human body.
CO Concentration (ppm)Effect on the Human Body
9Maximum allowable concentration in living areas
50Maximum allowable concentration for a continuous 8 h period
200Headache, nausea, and dizziness after 2 h
400Headache, nausea, and dizziness—life-threatening after 3 h of exposure
800Dizziness, nausea, and convulsions within 45 min, death within 2 h
1600Dizziness, nausea, and convulsions within 20 min, death within 1 h
3200Dizziness, nausea, and convulsions within 5–10 min, death within 30 min
6400Dizziness, nausea, and convulsions within 1–2 min, death within 10–15 min
12,800Death within 1–3 min
Table 2. Zone and flow path characteristics.
ZoneRoom Volume (m3)Flow Path Flow Path Area (m2)Exchange Rate (m3/h)
Garage60Garage door0.02
Door to the house 0.00990
Natural ventilation0.04
Kitchen and Living Room Window0.005
60Natural ventilation0.0470
Door0.009
Room18Door0.0130
Window0.005
Bathroom18Door0.0150
Natural ventilation0.04
Closet18Door0.00930
Window0.005
Table 3. Grid independence test.
Number of ElementsAverage Air Velocity V (m/s)Convergence Rate (%)
CalculatedNumerical
500,0000.6250.72413.67
1,000,0000.6341.42
1,500,0000.6382.03
Publisher’s Note: MDPI stays neutral with regard to jurisdictional claims in published maps and institutional affiliations.