Article

Electret Filters—From the Influence of Discharging Methods to Optimization Potential

1
Institute of Particle Process Engineering, Technische Universität Kaiserslautern, Gottlieb-Daimler-Straße 44, 67663 Kaiserslautern, Germany
2
IT for Engineering (it4e) GmbH, Morlauterer Straße 21, 67657 Kaiserslautern, Germany
3
Institute of Energy and Environmental Technology e.V. (IUTA), Bliersheimer Straße 58-60, 47229 Duisburg, Germany
*
Author to whom correspondence should be addressed.
Atmosphere 2021, 12(1), 65; https://doi.org/10.3390/atmos12010065
Submission received: 24 November 2020 / Revised: 23 December 2020 / Accepted: 29 December 2020 / Published: 4 January 2021
(This article belongs to the Special Issue Advancements in the Reduction of Submicron Particle Concentrations)

Abstract

:
Electret filters are electrostatically charged nonwovens which are commonly used in aerosol filtration to remove fine particles from gases. It is known that the charge and thus also the filtration efficiency can degrade over time. Thus, many testing standards require to remove the charge by treatment with liquid isopropanol (IPA) or IPA-saturated air. However, the parameters influencing this discharge have not been completely clarified yet. The aim of this work was, on the one hand, to experimentally investigate the influence of the IPA treatment on different electret filters and, on the other hand, to show the optimization potential of electret filters with respect to efficiency and long-term stability by numerical simulations. The experiments revealed that the air permeability is a central influencing parameter. Small pores lead to a reduced discharge efficiency using liquid IPA, while both treatment methods are suitable for larger pores. The simulations showed that a homogeneous charge distribution within the filter depth is advantageous for the initial performance. In contrast, charge penetrating deeper in the filter medium delays the charge decay and thus increases the operating time, with the trade-off of a lower initial performance.

1. Introduction

In aerosol filtration, nonwovens are often used to remove fine particles from gases. While the particles flow with the gas through the fibrous structure of the nonwovens, they are mechanically deposited by impaction, interception, and diffusion. These effects are size-dependent, with particles in the size range of around 0.3 µm being at least affected and the penetration being correspondingly high. This is called the most penetrating particle size (MPPS).
Electret filters with electrostatically charged fibers are advantageous for increasing the particle deposition, especially around the MPPS, while maintaining a constant flow resistance. The experimental investigations of the particle deposition in electret filters have been intensified since the first works of Lathrache [1,2,3] and Baumgartner [4,5]. Together with more recent studies focusing on pristine electret filters, it was found that particles are deposited by the Coulomb effect and dielectrophoresis in addition to the mechanical deposition, which shifts the MPPS to a size range of 0.03 to 0.06 µm and to a higher level [6,7,8,9].
However, it is also known that the initially high filtration efficiencies of these new electret filters can decrease significantly over operating time due to exposure to particles [7,10,11,12,13,14,15], organic solvents [16,17], or high temperatures and/or humidity [18,19]. During this filter ageing process, the original charge decays and the filter becomes less effective in filtering particles. For classification of electret filters regarding the later application, several testing standards thus prescribe treatment with isopropanol (IPA) for defined charge removal. So, EN 779 [20] required an immersion of the filter media in liquid IPA for two min. Its replacement ISO 16890-4 [21] prescribes conditioning of the assembled filters in IPA-saturated air for 24 h.
According to Choi et al. [17], the aggregate state of the solvent can have a significant influence. It was shown that the extent of discharge by immersing in liquid solvent can depend on the immersion duration [17], potentially leading to an incomplete discharge [16,22,23,24]. It was further speculated that the evaporation of the liquid solvent during drying may induce charges again [23,25]. Furthermore, immersion in a liquid solvent can lead to irreversible changes in the fiber structure of filter media. This is caused by swelling of the fibers [26] or dissolution of binders [27]. This may be especially relevant for filter media containing nanofibers [27]. However, for filter media made of polypropylene fibers, changes in the structure could not be detected [16,17,22,28]. In this context, it could be demonstrated that different fiber structures have an influence on the wettability and formation of the liquid film of the same fiber material and thus potentially the same properties [19].
If solvent vapor is used for discharging, a liquid film may form on the fibers for supersaturated conditions. If no supersaturation is reached, the solvent molecules are just adsorbed by the fiber surface. In the latter case, Choi et al. [17] and Jasper et al. [16] could not detect a discharge through solvent vapor. In line with that, Tang et al. [23] claimed that the formation of the liquid film is essential for discharging, but this is not yet finally proven.
In summary, the parameters influencing charge removal in electret filters are partly understood, but the overall picture is not consistent. Therefore, the aim of this work is to investigate the influence of the two mentioned discharging methods on the filtration efficiency by deposition experiments with focus on different electret filters (materials and fibrous structure parameters) and different operation conditions. Particular attention is paid to possible structural change and the investigation of different fiber structures on the extent of the discharge.
The next logical step after the actual description of influencing parameters is the prediction of the particle deposition in electret filters, with the aim to optimize them regarding their filtration efficiency and long-term stability. 3D simulations are suitable for this purpose, since the variation of parameters can be time-optimized and the micro mechanisms can be investigated in detail. In the case of electret filters, various simulation setups have recently been presented to investigate the filtration efficiency [9,13,29,30,31,32].
Starting from a single fiber, Oh [30] computed the particle deposition, which is influenced by the electrostatic effects resulting from the fiber charge. Extending to several fibers, Rief [31] presented 3D simulations of the particle deposition in a fibrous structure. The electric field in the pore volume was calculated as gradients of the electric potential resulting from the homogeneously charged fiber surfaces. Schober [32] also used this approach, focusing on the electrostatic interaction between individual particles. However, this approach only considered the Coulomb effect, which consequently led to a deviation between simulations and experiments.
Taking this into account, the influence of both the Coulomb effect and dielectrophoresis on the particle deposition was implemented in the simulation setup used in our previous work [9]. The electric field is calculated by explicit integration of the charges over the fiber surfaces. Compared to the approach used from Rief [31] and Schober [32], less assumptions are required for the boundary conditions.
This approach was already validated for the initial filtration efficiency at different operating conditions [13] and then extended to the abovementioned effect of filter ageing due to particle deposition [29]. The aim of this work is, therefore, also to estimate potential parameters for electret filter optimization, with respect to the charge and charge decay, by a numerical study of the particle deposition.

2. Experiments

In the following sections, the performed experiments are described. This includes a detailed description and characterization of the used electret filter media and an explanation of the experimental setup. Finally, the obtained results are analyzed.

2.1. Electret Filter Media
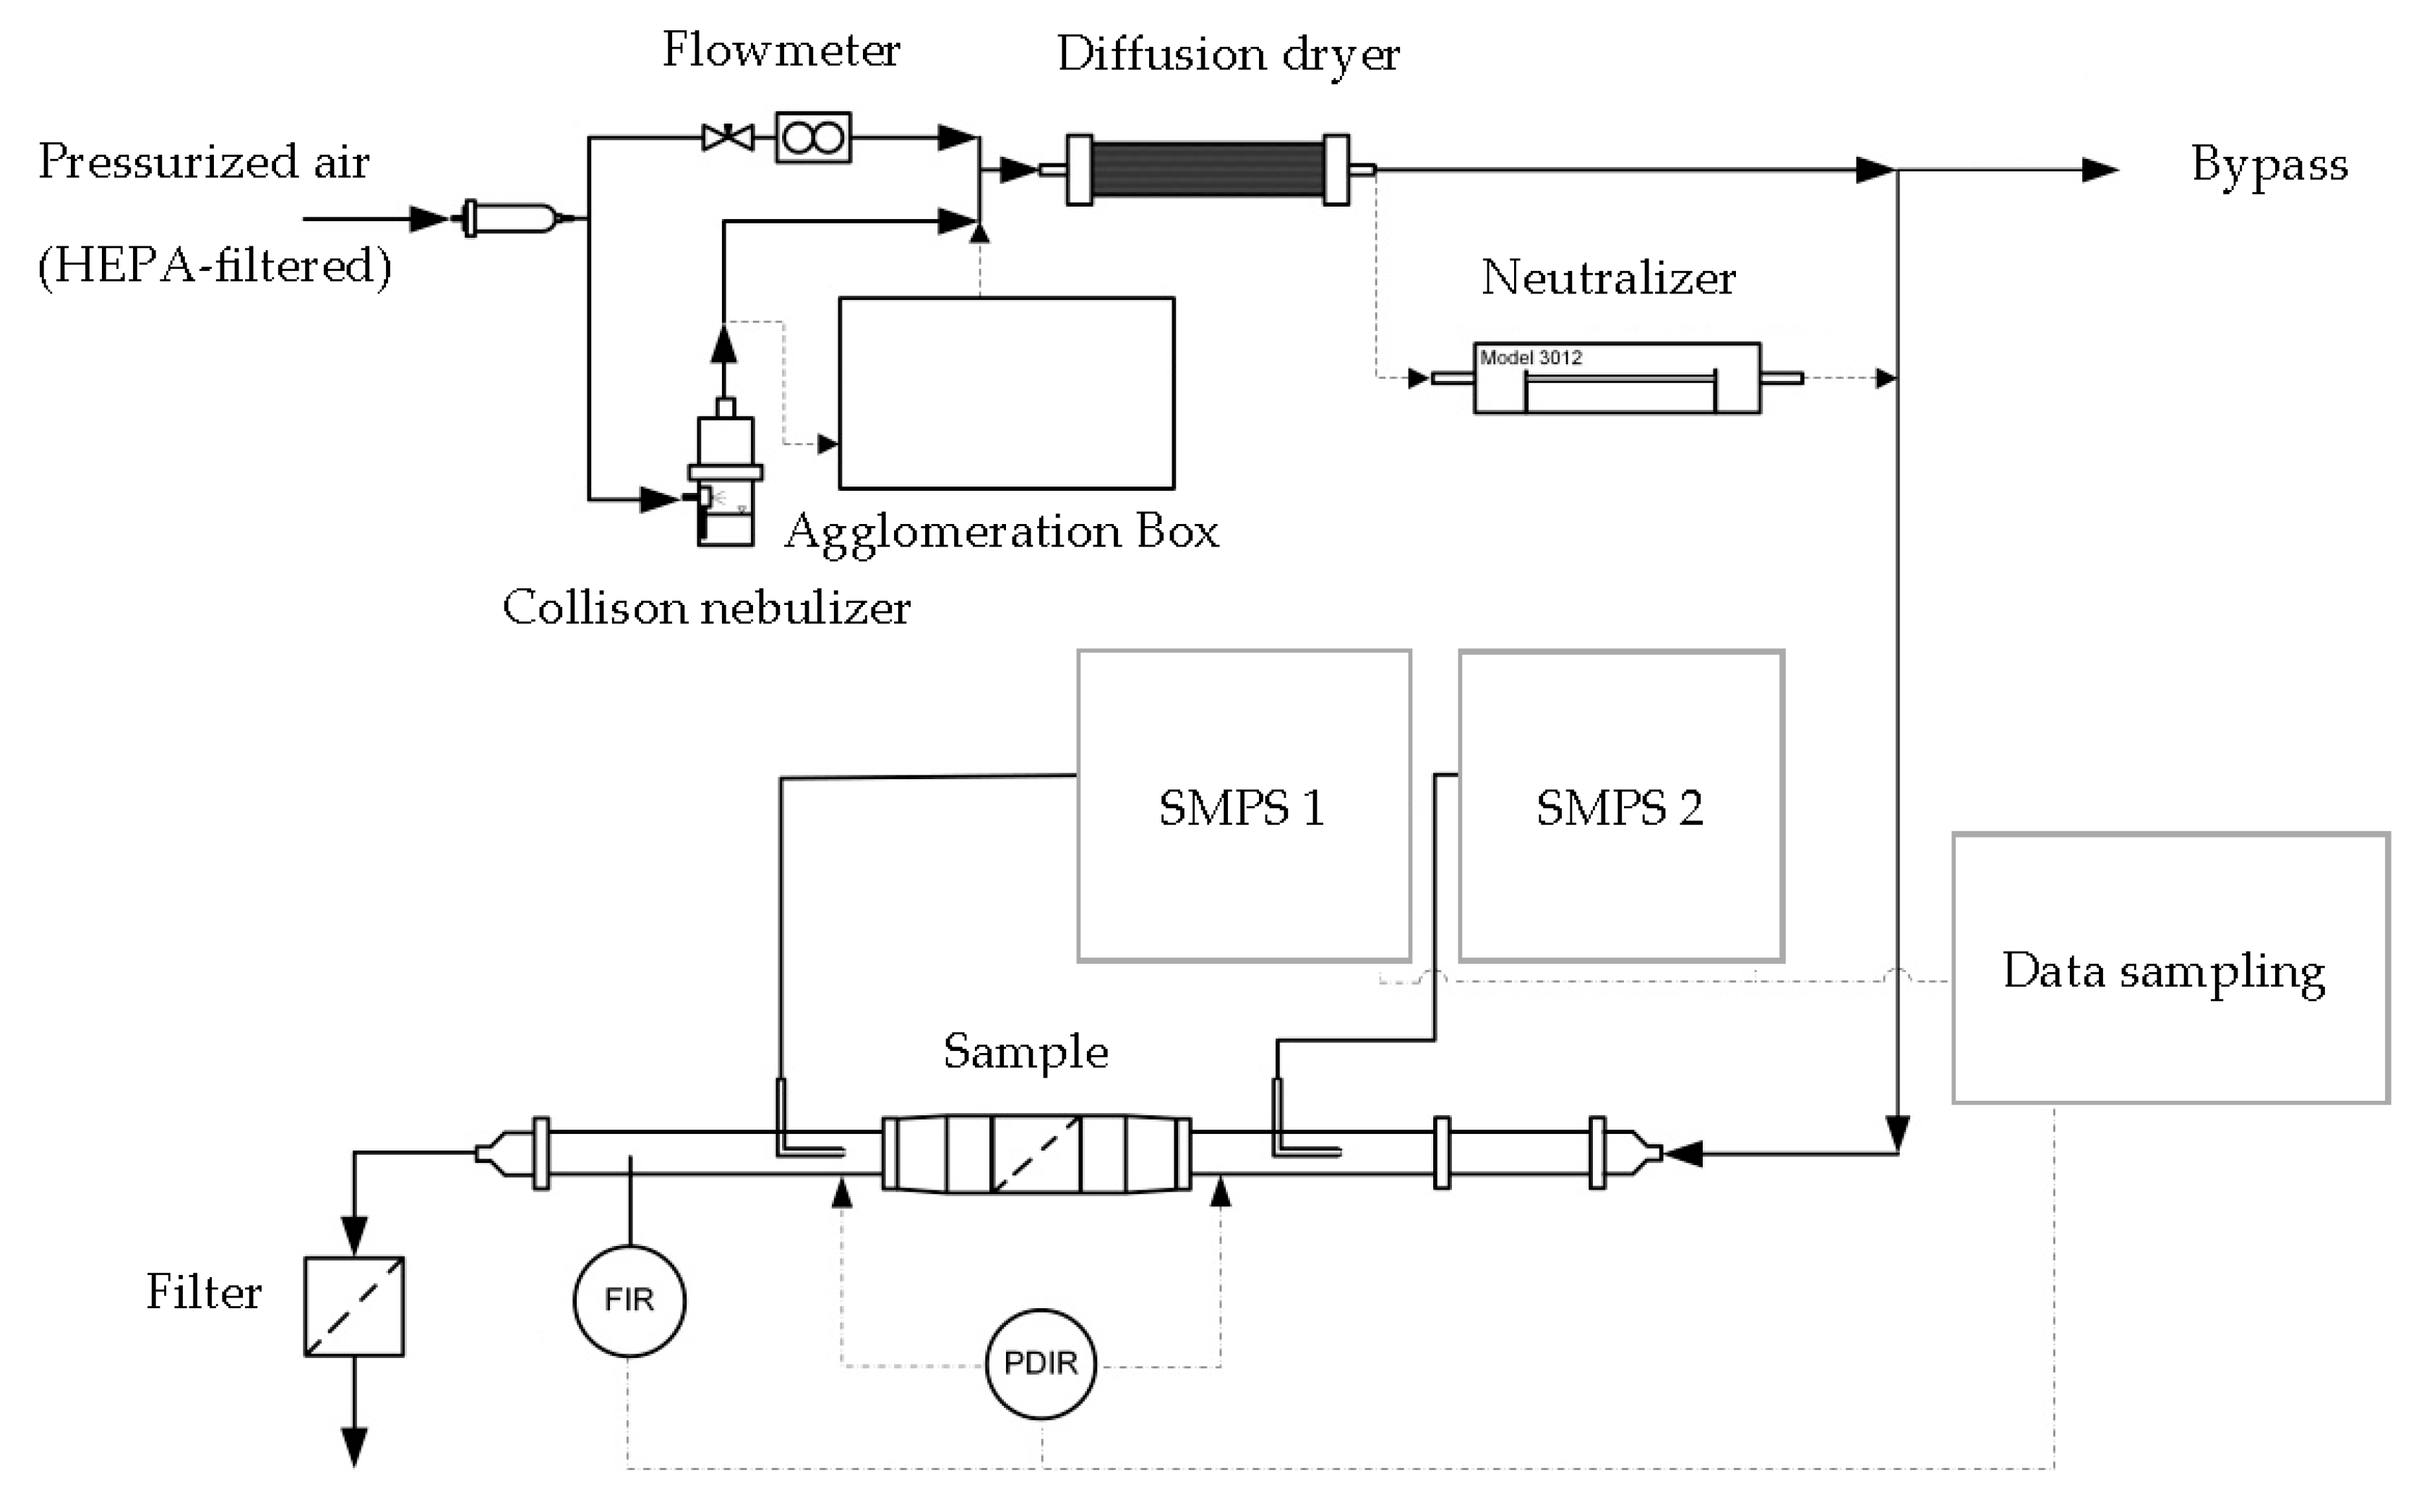
Ten different electret filter media were investigated as flat sheets. Table 1 lists the filter media with the corresponding information provided by the manufacturers. With regard to handling, the filter media 1 to 5 are distinguished by a high mechanical stability of the fibrous structures. In comparison, the fibrous structures of the filter media 6 to 10 are significantly more flexible.
Scanning electron microscopy (SEM) images of the upstream and downstream sides of the fibrous structures were obtained using a Hitachi SU8000 SEM. Based on the SEM images, the arithmetic mean and the modal value of the fiber diameter distribution in the fibrous structures were determined using the Carl Zeiss AxioVision software, evaluating the fiber cross-sections. For this purpose, at least five SEM images of the upstream and downstream side of the fibrous structures were evaluated.
In addition, samples of the filter media were weighed to determine the basis weight (model JL-180, Chyo Balance Corporation, Kyoto, Japan), and the pressure drop was measured to evaluate the air permeability. Furthermore, the porosity was determined with a helium pycnometer (model Ultrapycnometer 1000 T, Quantachrome), and the thickness of the fibrous structures was measured using a microscope and a texture analyzer (model TA.XTplus, Stable Micro Systems). Table 2 summarizes the parameters for the ten different filter media. At least three different samples of each filter medium were characterized as described above.
The fibrous structures of the filter media 1 to 3 are characterized by a homogeneous fiber diameter, while the two-layer structures of filter media 4 and 5 (see Table 2) have different fiber diameters on the upstream and downstream sides. Filter medium 4 contains a nanofiber layer which appears similar to a spider web on the supporting layer of microfibers. Filter medium 5 has a layer of fibers with a diameter of a few microns, while the supporting layer consists of larger fibers with a wide diameter distribution. The fibrous structure of filter medium 6 is also characterized by a wide fiber diameter distribution.
The triboelectrically charged filter media 7 to 10 differ only in the height and, accordingly, also in the basis weight and the resulting air permeability. Triboelectrically charged filter media have a very high porosity with a correspondingly low pressure drop or high air permeability [33]. This also corresponds to the above description that the filter media 7 to 10 are significantly more flexible in their fibrous structures compared to the other filter media (except filter medium 6).

2.2. Test Setup

The used test setup is shown in Figure 1. The setup is supplied with pressurized air, which is filtered by a high efficiency particulate air (HEPA) filter from particles. The air flow is split, and a partial air flow is fed to a Collison nebulizer to generate the aerosol using a sodium chloride (NaCl) solution. The generated aerosol is mixed with the other partial air flow to set a defined flow rate. For the experimental investigations, constant flow velocities of 0.02 m·s−1 and 0.08 m·s−1 were used.
The aerosol is then desiccated and passed through an aerosol neutralizer (Model 3012 A, TSI GmbH) to obtain a bipolar charge equilibrium. The conditioned aerosol is fed into the measuring duct. The measuring duct consists of the probe sampling for the particle size distribution measurement and the sample mount with a circular sample of the investigated filter medium.
The sample has a diameter of 90 mm and is arranged perpendicular to the flow direction. The particle size distribution is measured with a scanning mobility particle sizer (SMPS) (Model 3934, TSI GmbH) on the up- and downstream side of the filter medium sample to determine the filtration efficiency.
The particle size and charge distribution (on the upstream side of the filter medium sample) are shown in Figure 2. The total particle concentration was set to 106 particles per cm3, while the modal value of the particle size distribution was 0.03 µm to cover the size range around the MPPS.
The probability for higher charges increases with increasing particle size, while in the particle size range around the modal value, uncharged and singly charged (either positively or negatively) particles dominate. The probability of multiply charged particles is negligible.

2.3. Discharging Methods
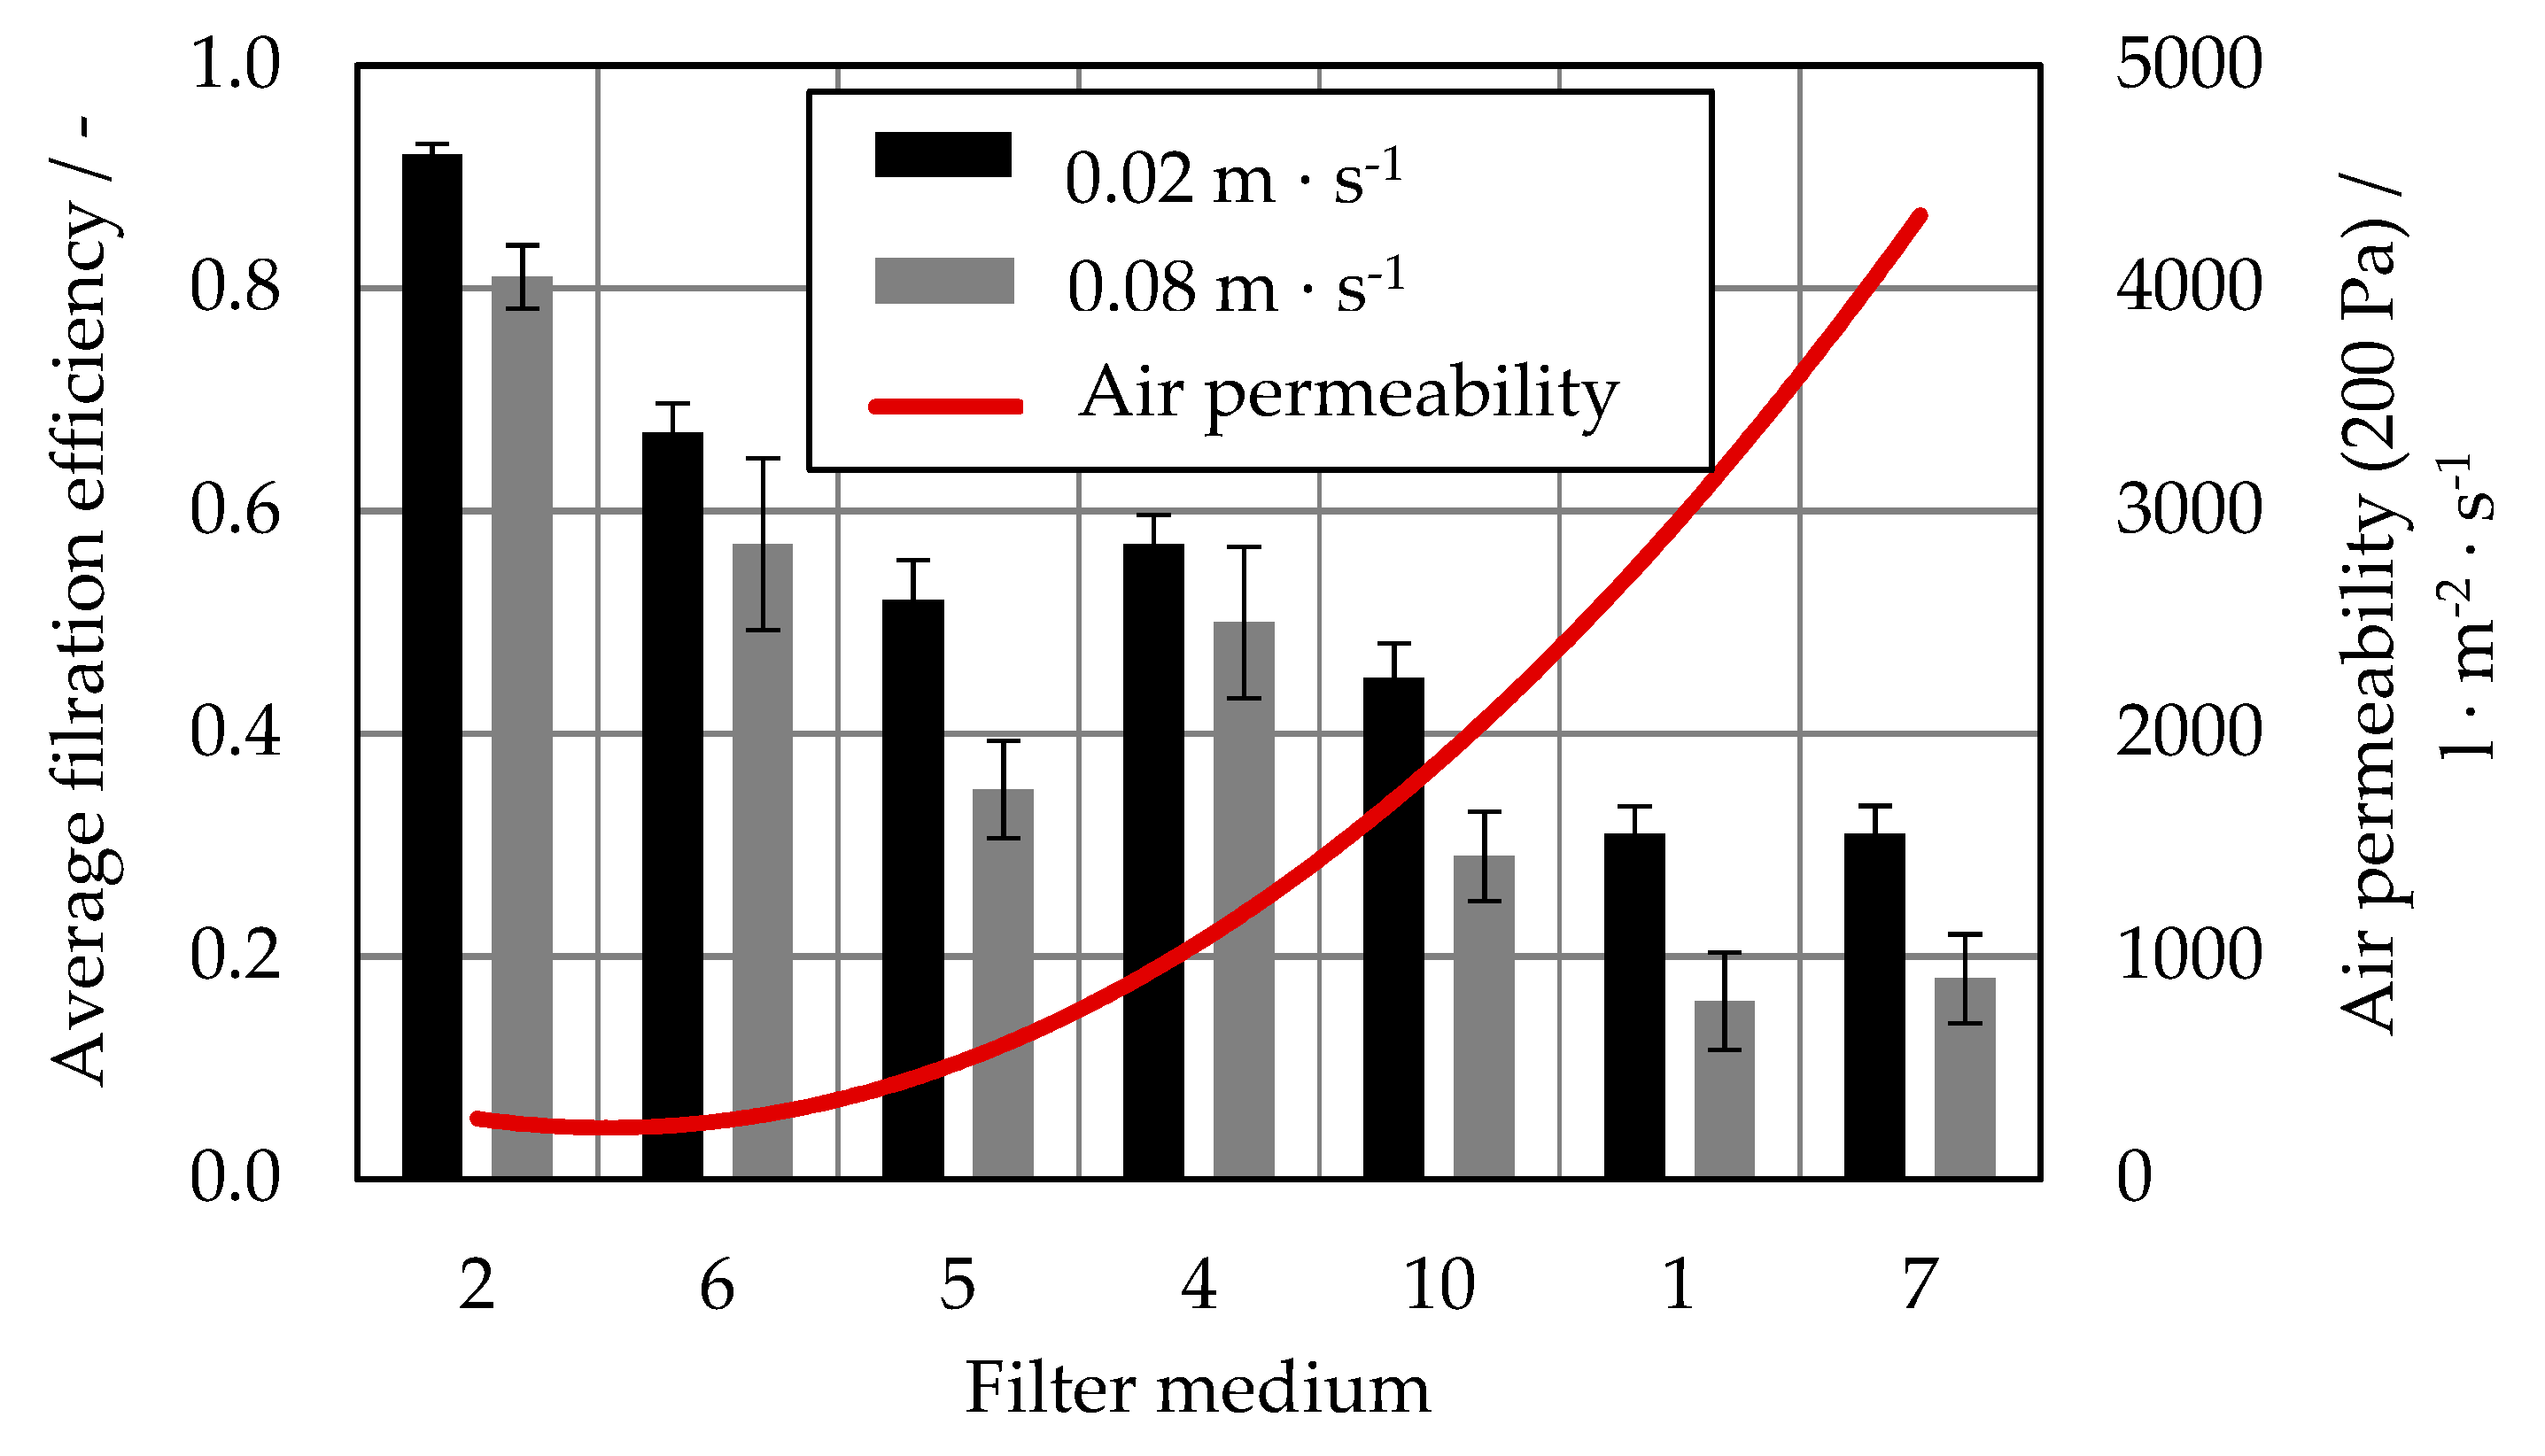
The particle deposition in all filter media was examined before and after discharging according to EN 779 [20] and for selected filter media after discharging in the style of ISO 16890-4 [21]. To comply with EN 779, the circular samples were immersed in liquid IPA (>99.7% purity) in a Petri dish for 5 min (the standard specifies at least 2 min) and then completely dried on an inert surface.
In contrast, ISO 16890-4 requires conditioning with IPA-saturated air for 24 h and subsequent storage in ambient air for 30 min. Experimentally, the conditioning was carried out with a discharge cabinet as described in [23]. A filled Petri dish with liquid IPA with a grid on top was placed inside the cabinet. The circular sample was laid on the grid. The evaporation of the liquid IPA saturates the air in the cabinet with IPA, to which the circular sample was exposed for 24 h.
It is obvious that the two discharging methods mentioned differ not only in the aggregate states of the IPA, but also in the duration of the IPA treatment. To investigate this influence, selected filter media were also discharged by immersing them in liquid IPA in a Petri dish for 24 h. Accordingly, the actual discharging method according to EN 779 [20] was extended to the prescribed treatment duration according to ISO 16890-4 [21].
No structural change of the fibrous structures after discharging could be detected in most cases. Only for filter medium 4 was there a clear difference in air permeability after the liquid IPA treatment. Whether a structural change of the nanofiber layer was responsible for this, as suggested in other studies [27], could not be determined by SEM.

2.4. Results

The filtration efficiencies at a flow velocity of 0.02 m·s−1 are shown in Figure 3 for filter medium 1 on the top (a), for filter medium 5 in the middle (b), and for filter medium 7 on the bottom (c) after their discharge. The filtration efficiency was determined at least three times for each filter medium treated in identical way. The data shown are the arithmetic mean values, while the error bars represent the standard deviation. Those filter media were exemplarily chosen to show the different behaviors depending on the discharging methods. In all cases, the filtration efficiency decreased with increasing particle size, showing that diffusion dominated the deposition mechanisms in the considered size range.
However, the extent of the charge reduction is clearly dependent on the discharging method and the filter medium. The charge reduction by conditioning with IPA-saturated air for 24 h seems to be more pronounced compared to immersion in liquid IPA for 5 min. For the two filter media 1 and 5, this indicates a residual charge and thus a residual effect of the electrostatic forces after the immersion in liquid IPA for 5 min.
By extending the immersion duration of the liquid IPA to 24 h, a further charge reduction could be achieved. However, for filter medium 5, there is still a deviation between the filtration efficiencies and thus a remaining residual charge. For filter medium 7, the filtration efficiencies are comparable, regardless of the discharging method, so that apparently no residual charge remained after the IPA treatments.
The resulting filtration efficiencies at a flow velocity of 0.08 m·s−1 basically show the same shape for the filter media, but on a lower level. In our previous work [13], it was already found that both electrostatic and mechanical deposition are reduced with increasing velocity. Correspondingly, the above determined dependence on the discharging method is almost negligible. In relation to the increased flow velocity, the residual charge remaining on the fibers does no longer seem to be sufficient to influence the particle movement.
Whether the charge has actually been completely reduced after conditioning with IPA-saturated air for 24 h cannot be determined. However, it seems questionable whether investigations are necessary at all to determine a complete charge reduction. For the classification of electret filters according to the test standards mentioned above, only the supposed complete discharge in relation to a defined flow velocity is relevant.
A comparable dependence, more or less pronounced, on the discharging method and the flow velocity was determined for all investigated filter media. For detailed comparison and assessment of the extent of the charge reduction, the filtration efficiencies for a particle size of 0.3 µm were selected and are summarized in Table 3. The values are highlighted in green, yellow, orange, and red, according to the color code explained below. The filtration efficiencies of the untreated filter media were also included in the table, excluding filter medium 4 due to the abovementioned difference in air permeability caused by immersing in liquid IPA. For filter media 3, 7, and 8 no immersion for 24 h and no conditioning with IPA-saturated air was applied.
Filter media with low air permeability (filter medium 2 and 5) are discharged more efficiently by conditioning in IPA-saturated air for 24 h compared to filter media with high air permeability (filter medium 1 and 7). When immersing the filter medium, the air has to be displaced by the liquid IPA from the pores inside the fibrous structure. In this respect, low or high air permeability can be interpreted as the presence of mainly small or large pores. However, the passive immersing process itself is then not sufficient to displace the air from the (small) pores of the filter media with low air permeability. In the case of IPA-saturated air, this phase boundary is not existing when it penetrates into the fibrous structure.
At the flow velocity of 0.02 m·s−1 the further charge reduction, due to an extension of the immersing duration to 24 h, is then possibly caused by molecular diffusion of the IPA molecules across the described phase boundary. For the molecular diffusion as a statistically distinct process and, consequently, for the mass transfer, the increased duration is advantageous.
Thus, for filter medium 1, the filtration efficiency after conditioning with IPA-saturated air for 24 h can be achieved. This is not the case for filter media with lower air permeability (filter media 2, 5, 6, and 10). It is possible that the immersing duration (in combination with the correspondingly small pores) is still too short to allow an adequate diffusion across the phase boundary to previously unwetted surfaces and a comparable discharge. This also shows that the required minimum exposure time of two min for the corresponding filter media is apparently not sufficient or too unspecific.
The differences in the filtration efficiencies are almost negligible at the increased flow velocity of 0.08 m·s−1. As described before, the remaining residual charge no longer seems sufficient to influence the movement and thus the deposition of the particles at this flow velocity. Following on from the above description, for filter medium 2 with the lowest air permeability or the smallest pores, immersion in liquid IPA, even for 24 h, does not seem sufficient to achieve a full charge reduction.
However, the explanation of the dependence of the discharging method on the air permeability is based on the wetting properties and the porosity. It should also be noted that with lower air permeability and correspondingly smaller pores, the particles move closer to the fibers inside the filter media. Due to the pronounced proximity effect of the electrostatic forces, a comparable residual charge can have a stronger effect on particle deposition than in filter media with high air permeability. In the numerical investigations (see Section 4), this is further evaluated by mathematical generation of models with different structural properties.
In order to prove whether the filtration efficiency is still influenced by a residual charge remaining after conditioning in IPA-saturated air for 24 h, a correlation with the air permeability was carried out. This is shown in Figure 4 for the average filtration efficiency. Low air permeability results in high particle deposition and vice versa. It can therefore be assumed that conditioning with IPA-saturated air does not result in any residual effect of the electric charge in particle deposition.
With regard to filter medium 4, the filtration efficiency is more pronounced than the air permeability would suggest (compared to the other filter media). This could be due to the influence of the nanofiber layer on particle deposition. Thus, even without additional electric charge, a high filtration efficiency is possible with comparatively high air permeability (compared to the air permeability of filter medium 2 and 6).

3. Direct Numerical Simulations

In this chapter, numerical simulations using the software DNSlab are described. This includes detailed description of the 3D model generation with fibrous structure and electric charge of the fibers, and the setup for computing the particle deposition with details of the simulation parameters. Finally, the results are analyzed.

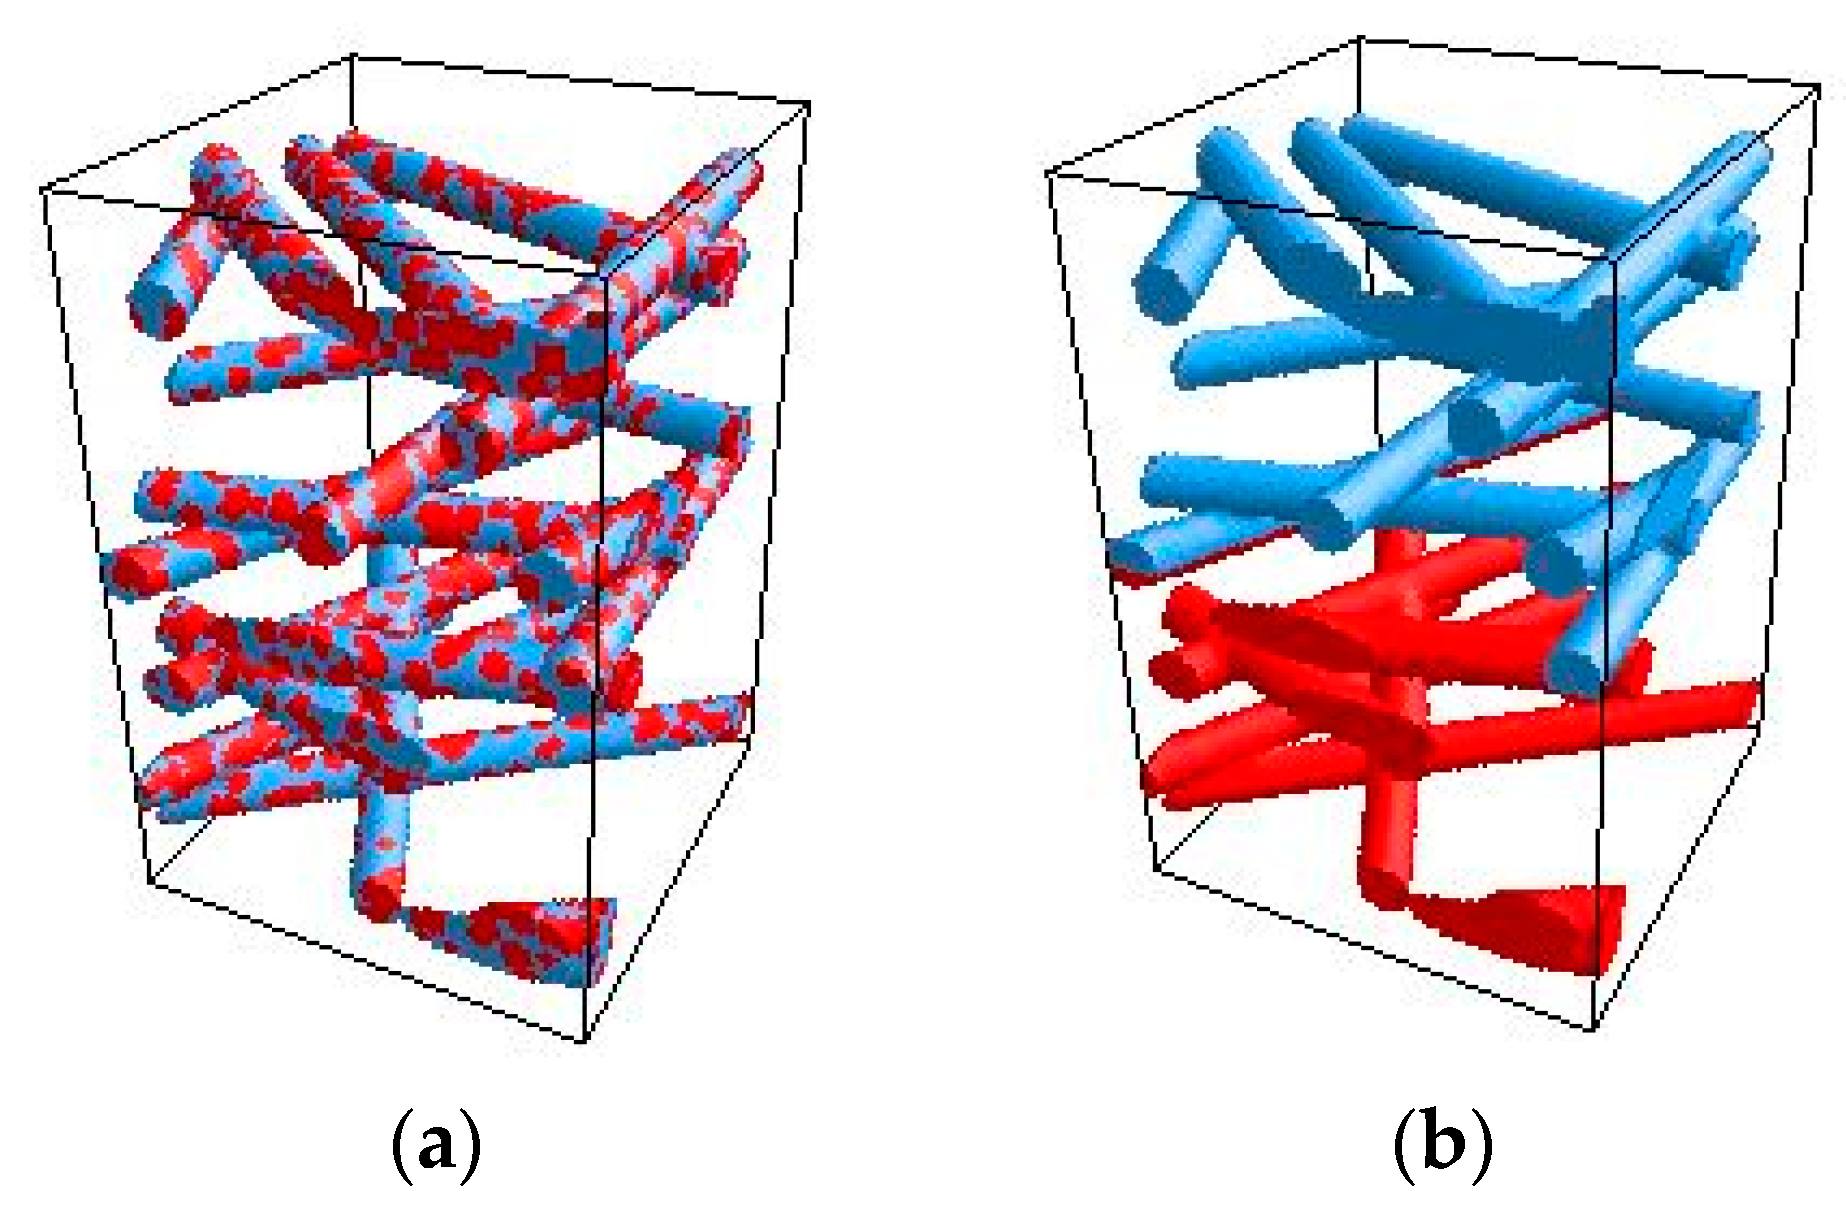
3.1. 3D Model Generation

The 3D model generation of the fibrous structures is based on a mathematical algorithm described in our previous work [9]. Cylindrical fibers with defined diameter (distribution) are randomly created in a closed volume perpendicular to the flow direction until the desired porosity is reached. Adjusting the height of the closed volume allows to reproduce the thickness of the fibrous structure accordingly.
For investigation of the fiber charge properties, a thickness of 675 µm, a porosity of 79%, and a fiber diameter of 32 µm were chosen as the standard case for the generation. The voxel edge length was set to 1.5 µm, which leads to a discretization of the fibers with a diameter of 32 µm within the minimum required number of 10 voxels [35]. The size of the resulting 3D model of the fibrous structure for the subsequent computation of the gas flow, electric field, and particle movement is 300 voxels each in x- and in y-direction and 450 voxels in z-direction, with additional up- and downstream buffer volumes.
The above values were varied separately during generation in the range of the experimentally investigated filter media (see Section 2.1) for identification of the main influencing parameters. All values are summarized in Table 4, highlighting the standard values in grey. The voxel number in x-direction and y-direction, as well as the fiber orientation, remain the same for all 3D models; only the heights of the models are adapted to the corresponding thicknesses.
To take the electrostatic fiber charge into account, areas of each individual fiber surface were defined as positively and/or negatively charged. It has already been shown that triboelectrically charged filter media can be modeled by placing spherical spots on the fiber surfaces, whereas for corona charged filter media, the entire fibrous structure is divided into two parts, one part being defined as negatively charged, and the other part as positively charged [13]. Both cases of modeled charge distributions are shown in Figure 5, where blue areas represent negatively charged fiber surfaces and red areas represent positively charged fiber surfaces.
Furthermore, it was shown that both charging methods lead to an almost equivalent area ratio of positively charged and negatively charged surfaces [13]. For each 3D model generated, 50% of the fiber surfaces were defined as negatively charged, and 50% as positively charged. As in our previous work [9], for case (a), the spot size was chosen to be 10–20 µm for the fibers with a diameter of 32 µm, and the ratio of fiber diameter to spot size was maintained while varying the fiber diameter. The corresponding spot sizes are shown in Table 4. For case (b), the fibrous structures were consistently divided in the middle.
To separately investigate the influence of the spot size itself on the filtration efficiency, the different spot sizes were applied on the same 3D model with the standard values for thickness, porosity, and fiber diameter. To maintain an equivalent area ratio of positively and negatively charged surfaces, the spot and frequency were adjusted.
For corona charging, the penetration of the fibrous structure with charge carriers is limiting or decisive with regard to the electrostatic properties, since the actual charging process with generation of the charge carriers takes place close to the filter media surface. Therefore, a more pronounced charging of the near-surface fibrous structure with a decrease or reduction of the charge magnitude with increasing distance into the fibrous structure itself seems to be realistic, offering also the potential for optimization.
Based on the shown homogeneous charged parts in Figure 5b, different types of charge decrease (linear, quadratic, and exponential decrease) were modeled from the surface to the middle of the fibrous structure (symmetrical) with equal area ratio of positively and negatively charged partial structures. These are shown in Figure 6 in a normalized form of the surface charge density and the distance from the filter media surface into the fibrous structure, whereby the distance of 1 represents the middle of the structure.

3.2. Computation of Gas Flow, Electric Field, and Particle Movement

The gas flow through the fibrous structure of the generated 3D model is computed by direct numerical solution of the stationary Navier–Stokes Equations (1)–(3) with the lattice Boltzmann scheme, while the voxel grid of the 3D model is directly used to discretize these partial differential equations. The voxel centers are the corresponding nodes of the lattice Boltzmann discretization.
µ V ρ ( V · ) V = p   in   Ω   ( conservation of momentum )
· V = 0   in Ω   ( conservation of mass with constant density )
V = 0   on Ω   ( no - slip   boundary   condition )
with the air viscosity µ and the air density ρ , the pressure p , the flow velocity V , the void domain of the 3D model (pore volume and up- and downstream volumes) Ω , and the boundary of the void domain (fiber surfaces) Ω . The electric field E in the pore volume around the fibers with the surface charge density Q is computed by explicit integration of the surface charges [36]:
E ( X ) = 1 4 · π · ε 0 · Ω Q X S 3 · ( X S ) d S
with the spatial position X in the void domain, the surface integration variable S , and the electric constant ε 0 . For all simulations presented in this work, it was proven that a distance from the fiber surface into the pore volume of 30 voxels is sufficient for the calculation of the electric field. The particle movement through the pore volume is then computed with the resulting forces from the gas flow, the electric field the diffusive motion by a Euler–Lagrange approach [35]:
X P i + 1 = X P i + d t · V P i
V P i + 1 = V P i + d t · 1 m P · ( γ · ( V V P i ) + F C F D i ) + N ( 0 , K B · T m P )
with the time step dt , the particle velocity V P i , and the particle position X P i at the i-th timestep. In the subsequent (i + 1)-th time step, the particle velocity changed to V P i + 1 and the particle position to X P i + 1 . As mentioned above, the acceleration due to the Coulomb force F C and dielectrophoresis F D i is considered for the computation. The drag force on the particles resulting from the gas flow is described by Stokes law with the Cunningham correction Cu and taken into account in the particle–fluid friction coefficient γ . The forces mentioned are shown in detail below.
γ = 3   ·   π   ·   μ   ·   d P Cu
F C = q · E
F D i = π · ε 0 · d P 3 4 · ( ε P 1 ε P + 2 ) · | E | 2
with the particle charge q and the relative dielectric constant of the particle ε P . The particle charge was chosen to the bipolar charge equilibrium shown in Figure 2.
For the filter efficiencies of the fibrous structures, the movement of one million particles with diameters d P equally distributed from 0.01 to 0.5 μm was computed. The starting positions of the particles are randomly distributed in the upstream volumes. If the computation of the particle movements end on the fiber surface, the particles are considered to be deposited. The filtration efficiencies were then determined as the ratios of the number of deposited particles to total number of particles. The simulation parameters were set according to the experiments (see Section 2) and are summarized in Table 5.
The surface charge density was set according to the findings from [1,2,3,5,8,37,38,39,40,41]. In these studies, a magnitude of around 100 µC·m−2 was identified as an adequate value describing the electric charge of the fibers regarding manipulation of particle movement and deposition.

3.3. Results

The results obtained with the numerical simulations, using mathematically generated fibrous structure models to calculate particle deposition for different fiber charge and fibrous structure properties, are presented below.

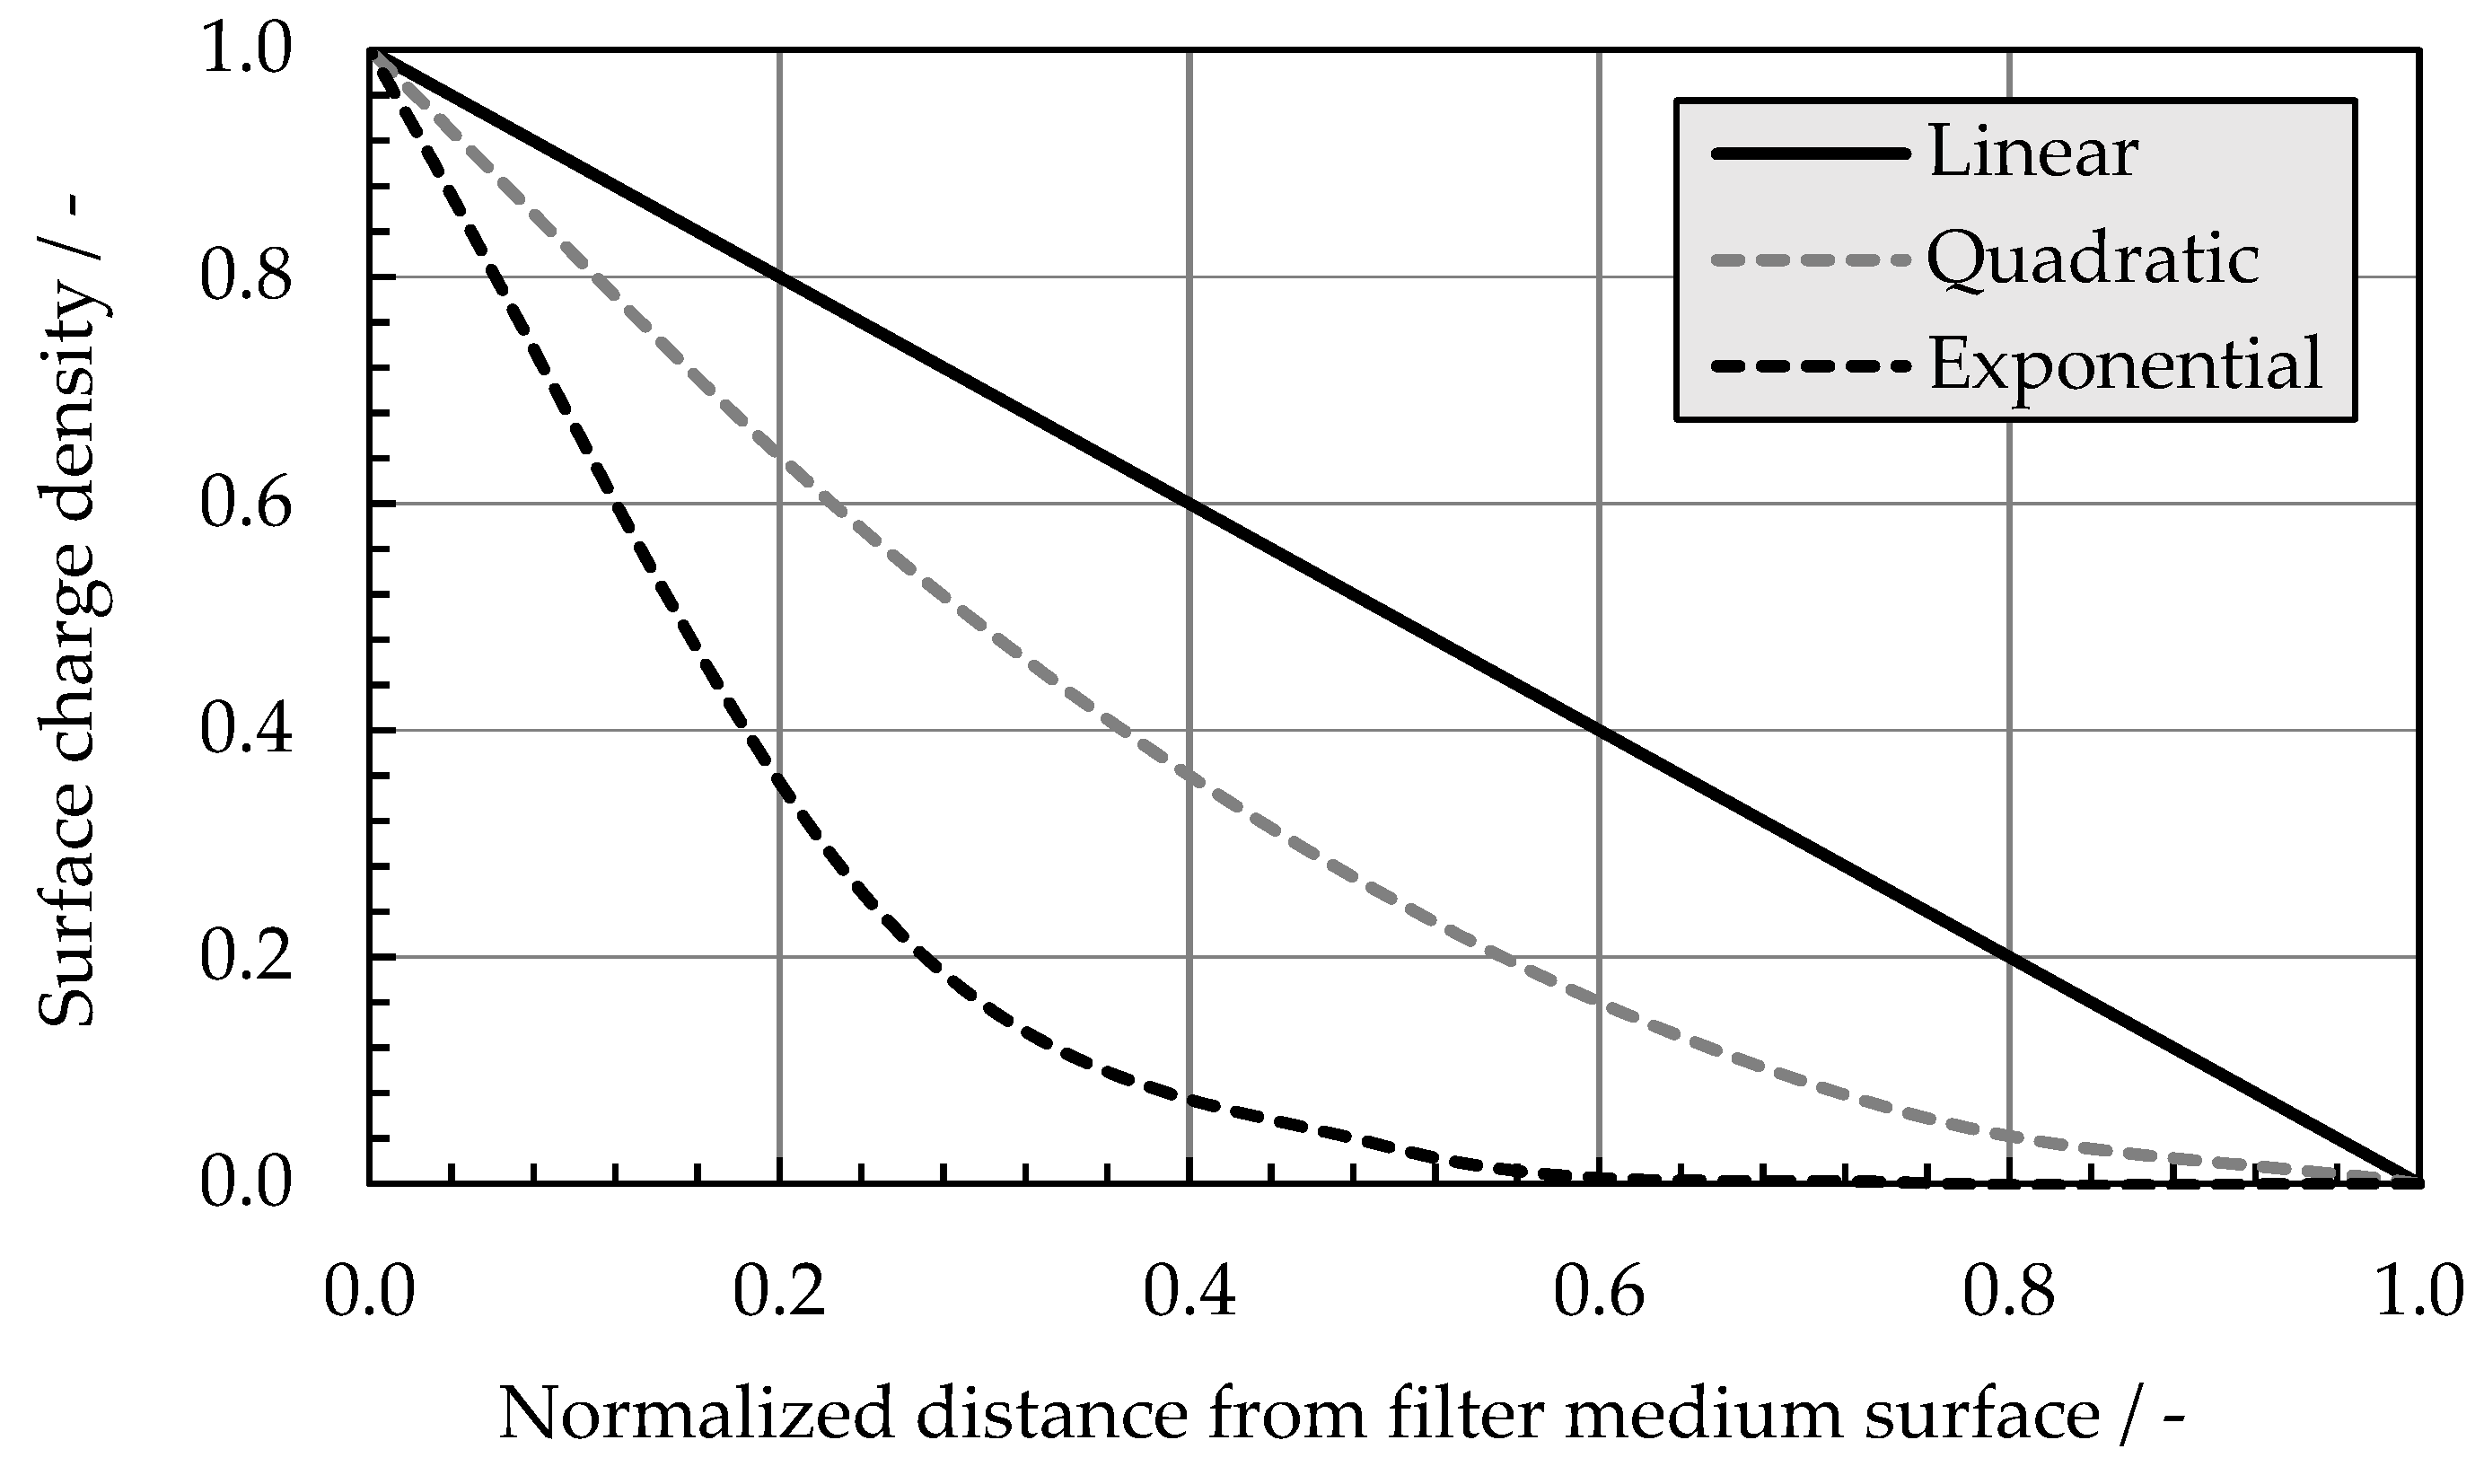
3.3.1. Fiber Charge Properties

The filtration efficiencies resulting from modeling different spot sizes on the same fibrous structure with the standard properties are shown in Figure 7. With increasing spot size, the continuous area of one charge polarity increases, while the size of the interface between areas of opposite polarities decreases. A larger continuous area leads, thereby, to a higher particle deposition.
With larger spot size, polarization and attraction by dielectrophoresis and also attraction by the Coulomb effect can have a stronger and/or longer effect on the particles flowing through the pore volume adjacent to the charged surfaces. This leads to the increase of particle deposition with increasing spot size. However, above a spot size of 10–20 µm, this seems to be negligible. Thus, a minimum for discretely charged areas on each fiber has to be achieved in order to provide adequate particle deposition.
The filtration efficiencies, depending on the type of charge, decrease with filter depth for dividing the entire fibrous structure in half are shown in Figure 8. For reference, the filtration efficiency resulting from a homogeneous surface charge density in the partial structures is also included.
The more significantly the charge is reduced from the filter media surface towards the center of the fibrous structure, the lower the particle deposition. This is due to the increased area in the center of the fibrous structure, where the electrostatic field is negligible. This is especially true for particle deposition by dielectrophoresis, since this effect depends disproportionally on the surface charge density or the electrostatic field, but is also relevant for the Coulomb effect.
With regard to the manufacturing method by corona charging, a homogeneous penetration of charge carrier over the depth of the fibrous structure (on both sides) should be aimed for, to achieve high initial particle deposition. It may be possible to transfer the findings to the other type of modeled charge distribution. With increasing particle deposition, however, it was also found that the electrostatic field, and thus the electric charge, is reduced or neutralized from the upstream to the downstream side of the fibrous structure [29].
In combination with the above findings, an increase in electric charge towards the middle of the fibrous structure (more distinctive charge in the filter middle) would then be advantageous with increasing operating time with regard to the deposited particles and the charge neutralization. Even if the upstream fiber charges were neutralized, sufficient charge would still remain in the depth of the filter medium to ensure consistent particle deposition, with the trade-off of a slightly lower initial particle deposition.

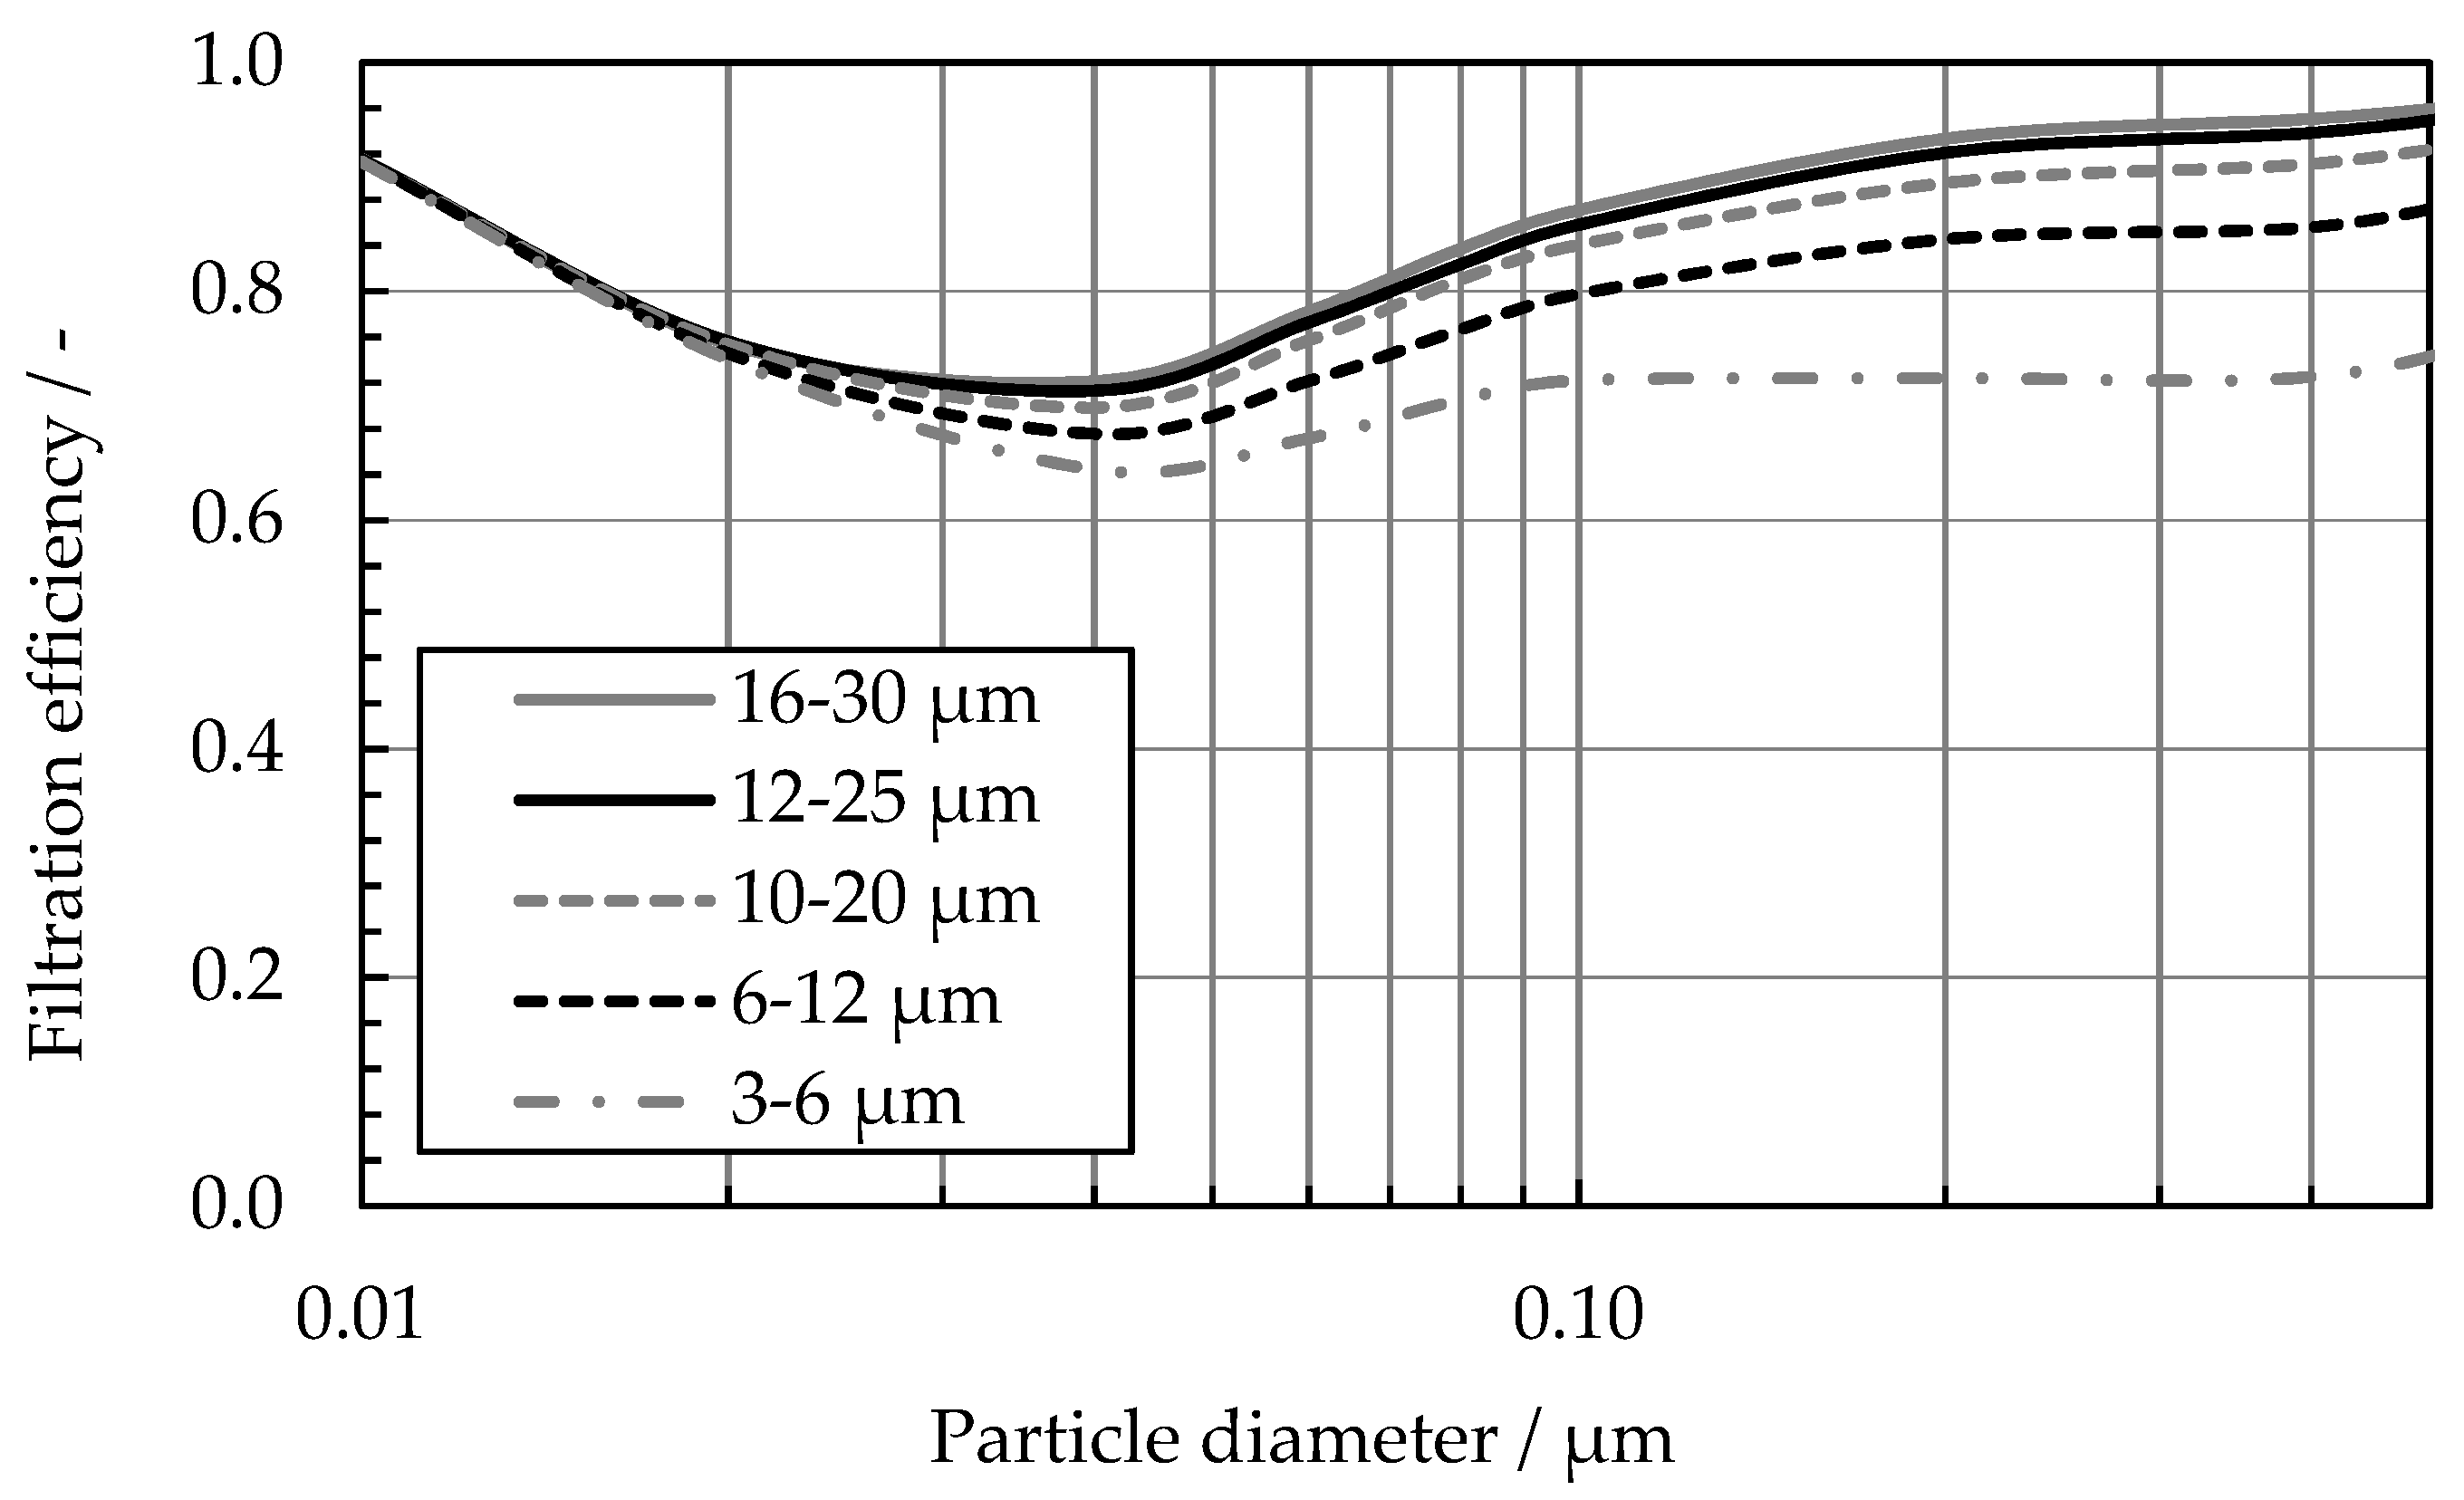
3.3.2. Fibrous Structure Properties

The resulting filtration efficiencies, depending on the thickness, porosity, and fiber diameter, have principally the same shape as the filtration efficiency curves shown in Figure 7 and Figure 8. By increasing the height, as well as decreasing the porosity or the fiber diameter (at constant porosity), the filtration efficiency is shifted to an overall higher level. However, the influence of the fiber diameter is most pronounced. All filtration efficiencies show the characteristic minimum in the particle size range from approximately 0.02 to 0.04 µm (on different levels). This shape only changes when the fiber diameter is reduced to 20 μm, or further to 10 μm, since all particles are deposited, and no minimum is remaining. Sensitivity regarding the type of charge distribution was not evident.
In order to differentiate the share of the electric charge and the share of the fiber structure in the resulting particle deposition, the average filtration efficiency of the fibrous structure without, and with, charge modeled was determined. These are compared in Table 6, whereby the additional effect of the electric charge is highlighted.
Taking into account the difference already determined due to the charge distribution itself [13], almost no dependence of the additional effect on height and porosity is discernible. The additional effect when modeling the electric charge by dividing the entire structure is about 60%, and about 50% when randomly distributed as spherical spots. When the electric charge is modeled by dividing the entire fibrous structure, however, the electrostatic deposition tends to be increased by increasing the porosity (highlighted in green).
This is possibly due to the increasing pore volume within the fibrous structure. With decreasing pore volume, the distance between the individual fibers is smaller. With reduction of the distance, the probability increases that not only electrostatic fields of adjacent fiber surfaces with opposite polarity interact, but also the influence of electrostatic fields of adjacent fibers with the same polarity must be explicitly considered. If the attracting effect on particles in the direction of a fiber is not sufficient to deposit them, the attraction in the direction of an adjacent fiber can occur. This keeps the particles in the pore volume and, as a result, the deposition is reduced.
On the other hand, a reduction of the fiber diameter results in a supposed reduction of the electrostatic deposition (orange background). However, the purely mechanical particle deposition is equally increased. The potential of additional deposition by the electrostatic effects is thus limited to the deposition of all particles. Consequently, the additional effect of the electric charge can only be reduced, so that at least with a fiber diameter of 10 μm, no representative statements about the actual additional effect of the electric charge can be made.
Furthermore, the results of the experimental investigations (Section 2) are substantiated to the effect that a (residual) charge on the fibers of a denser structure (increased mechanical deposition and pressure drop) has no clear effect on particle deposition. The effectiveness of the discharging methods described is, therefore, primarily based on the wetting properties resulting from the porosity and the diffusive mass transfer across the phase boundary as the treatment duration progresses.
Following on from this, filter media with an average value of the structural properties in the investigated range of variation should be the main focus in the manufacturing process. The height of the filter media is of negligible importance, since the decrease in mechanical deposition is negligible as well. In the case of porosity and fiber diameter, mechanical deposition can be increased by increasing porosity and simultaneously decreasing fiber diameter (with acceptable pressure drop as long as fiber diameter > 10 μm) without impairing the benefit of the additional effect of the electric charge. The combined mechanical and electrostatic deposition then leads to a deposition of almost all particles. Accordingly, this has also been realized for the triboelectrically charged filter media (see Section 2.1).
High porosities would also be advantageous in filter media manufacturing by corona charging in order to achieve a homogeneous penetration of the porous fiber structure (on both sides) with charge carriers (since the fibrous structure is also penetrated by particles due to the mechanical deposition).

4. Conclusions

In this work, the influence of the IPA treatment according to EN 779 and ISO 16890-4 was experimentally investigated for a wide range of different electret filter media. It was shown that the air permeability of the filter media is the influencing parameter, which leads to more-or-less sufficient discharging. Small pores reduce the discharge efficiency using liquid IPA (EN 779), while both treatment methods are suitable for larger pores. However, by increasing the immersion time of liquid IPA (EN 779), the discharge is almost comparable. Furthermore, from the correlation of the filter efficiency of the discharged filter media according to ISO 16890-4 with the air permeability, it can be assumed that no residual effect of the electric charge on particle deposition occurs.
In addition, the influence of the fiber charge and fibrous structure properties on particle deposition were numerically investigated to show the optimization potential regarding charge and charge gradient within the filter medium. A minimum for discrete charged areas on each fiber has to be achieved in order to provide adequate particle deposition. Furthermore, the simulations showed that a homogeneous charge distribution across the filter depth is advantageous for the initial performance. In contrast, a more distinctive charge in the filter media center delays charge decay and thus increases the operating time with the trade-off of a slightly lower initial performance. Both for triboelectric and corona charging, a high porosity (in combination with a small fiber diameter) has to be aimed for in order to provide sufficient formation of the electric charge itself.

Author Contributions

Conceptualization: M.K.; methodology: M.K., K.S., and S.S.; software: M.K. and K.S.; validation: S.S.; formal analysis: S.S.; investigation: M.K.; resources: C.A. and S.S.; data curation: M.K.; writing—original draft preparation: M.K.; writing—review and editing: M.K., K.S., S.S., C.A., and S.A.; visualization: M.K.; supervision: C.A. and S.A.; project administration: S.A.; funding acquisition: C.A. and S.A. All authors have read and agreed to the published version of the manuscript.

Funding

This research was funded by the German Federation of Industrial Research Association (AiF) by the German Federal Ministry for Economic Affairs and Energy (BMWi) grant number19145 N.

Institutional Review Board Statement

Not applicable.

Informed Consent Statement

Not applicable.

Data Availability Statement

Data sharing not applicable.

Acknowledgments

The authors gratefully acknowledge the Regionales Hochschulrechenzentrum Kaiserslautern (RHRK) for supporting the numerical calculations on the high-performance computer “Elwetritsch”. The used simulation software DNSlab was provided by IT for Engineering (it4e) GmbH.

Conflicts of Interest

The authors declare no conflict of interest. The funders had no role in the design of the study; in the collection, analyses, or interpretation of data; in the writing of the manuscript; or in the decision to publish the results.

References

  1. Lathrache, R.; Fissan, H.J. Enhancement of particle deposition in filters due to electrostatic effects. Filtr. Sep. 1987, 24, 418–422. [Google Scholar]
  2. Lathrache, R.; Fissan, H.J.; Neumann, S. Deposition of submicron particles on electrically charged fibers. J. Aerosol Sci. 1986, 17, 446–449. [Google Scholar] [CrossRef]
  3. Lathrache, R.; Fissan, H. Fractional Penetrations for Electrostatically Charged Fibrous Filters in the Submicron Particle Size Range. Part. Part. Syst. Charact. 1986, 3, 74–80. [Google Scholar] [CrossRef]
  4. Baumgartner, H.; Löffler, F. The collection perfomance of electret filters in the particle size range 10 nm-10µm. J. Aerosol Sci. 1986, 17, 438–445. [Google Scholar] [CrossRef]
  5. Baumgartner, H.; Löffler, F.; Umhauer, H. Deep-Bed Electret Filters: The Determination of Single Fiber Charge and Collection Efficiency. IEEE Trans. Electr. Insul. 1986, EI-21, 477–486. [Google Scholar] [CrossRef]
  6. Löffler, F. Staubabscheiden; Geor Thieme Verlag: Stuttgart, Germany; New York, NY, USA, 1988. [Google Scholar]
  7. Wang, C.-S. Electrostatic forces in fibrous filters—A review. Powder Technol. 2001, 118, 166–170. [Google Scholar] [CrossRef]
  8. Sanchez, A.L.; Hubbard, J.A.; Dellinger, J.G.; Servantes, B.L. Experimental Study of Electrostatic Aerosol Filtration at Moderate Filter Face Velocity. Aerosol Sci. Technol. 2013, 47, 606–615. [Google Scholar] [CrossRef]
  9. Kerner, M.; Schmidt, K.; Hellmann, A.; Schumacher, S.; Pitz, M.; Asbach, C.; Ripperger, S.; Antonyuk, S. Numerical and experimental study of submicron aerosol deposition in electret microfiber nonwovens. J. Aerosol Sci. 2018, 122, 32–44. [Google Scholar] [CrossRef]
  10. Walsh, D.C.; Stenhouse, J.I.T. The effect of particle size, charge and composition on the loading characteristics of an electrically active fibrous filter material. J. Aerosol Sci. 1997, 28, 307–321. [Google Scholar] [CrossRef]
  11. Otani, Y.; Emi, H.; Mori, J. Initial Collection Efficiency of Electret Filters and Its Durability for Solid and Liquid Particles. Kona Powder Part. J. 1993, 207–214. [Google Scholar] [CrossRef] [Green Version]
  12. Walsh, D.C.; Stenhouse, J.I.T. Parameters Affecting the Loading Behavior and Degradation of Electrically Active Filter Materials. Aerosol Sci. Technol. 1998, 29, 419–432. [Google Scholar] [CrossRef]
  13. Kerner, M.; Schmidt, K.; Schumacher, S.; Puderbach, V.; Asbach, C.; Antonyuk, S. Evaluation of electrostatic properties of electret filters for aerosol deposition. Sep. Purif. Technol. 2020, 116548. [Google Scholar] [CrossRef]
  14. Schumacher, S.; Spiegelhoff, D.; Schneiderwind, U.; Finger, H.; Asbach, C. Performance of New and Artificially Aged Electret Filters in Indoor Air Cleaners. Chem. Eng. Technol. 2018, 41, 27–34. [Google Scholar] [CrossRef]
  15. Ji, J.H.; Bae, G.N.; Kang, S.H.; Hwang, J. Effect of particle loading on the collection performance of an electret cabin air filter for submicron aerosols. J. Aerosol Sci. 2003, 34, 1493–1504. [Google Scholar] [CrossRef]
  16. Jasper, W.; Hinestroza, J.; Mohan, A.; Kim, J.; Shiels, B.; Gunay, M.; Thompson, D.; Barker, R. Effect of xylene exposure on the performance of electret filter media. J. Aerosol Sci. 2006, 37, 903–911. [Google Scholar] [CrossRef]
  17. Choi, H.-J.; Park, E.-S.; Kim, J.-U.; Kim, S.H.; Lee, M.-H. Experimental Study on Charge Decay of Electret Filter Due to Organic Solvent Exposure. Aerosol Sci. Technol. 2015, 49, 977–983. [Google Scholar] [CrossRef] [Green Version]
  18. Yang, S.; Lee, W.-M.G.; Huang, H.-L.; Huang, Y.-C.; Luo, C.-H.; Wu, C.-C.; Yu, K.-P. Aerosol penetration properties of an electret filter with submicron aerosols with various operating factors. J. Environ. Sci. Health A Tox. Hazard. Subst. Environ. Eng. 2007, 42, 51–57. [Google Scholar] [CrossRef]
  19. Motyl, E.; Lowkis, B. Effect of Air Humidity on Charge Decay and Lifetime of PP Electret Nonwovens. Fibres Text. East. Eur. 2006, 14, 39–42. [Google Scholar]
  20. DIN EN 779. Partikel-Luftfilter für die Allgemeine Raumlufttechnik—Bestimmung der Filterleistung. 2012. Available online: https://www.beuth.de/en/standard/din-en-779/136851927 (accessed on 3 January 2021).
  21. ISO 16890-4:2016. Air Filters for General Ventilation—Part 4: Conditioning Method to Determine the Minimum Fractional Test Efficiency. Available online: https://www.iso.org/standard/57867.html (accessed on 3 January 2021).
  22. Xiao, H.; Song, Y.; Chen, G. Correlation between charge decay and solvent effect for melt-blown polypropylene electret filter fabrics. J. Electrost. 2014, 72, 311–314. [Google Scholar] [CrossRef]
  23. Tang, M.; Thompson, D.; Chen, S.-C.; Liang, Y.; Pui, D.Y.H. Evaluation of different discharging methods on HVAC electret filter media. Build. Environ. 2018, 141, 206–214. [Google Scholar] [CrossRef]
  24. Biermann, A.H.; Lum, B.Y.; Bergman, W. Evaluation of permanently charged electrofibrous filters. In Proceedings of the 17th Doe Nucelar Air Cleaning Conference-Proccedings, Livemore, CA, USA, 1 August 1982. [Google Scholar]
  25. Tronvill, P.; Rivers, R. Looking for the minimum efficiency of fibrous air filters during their sercive life. In Proceedings of the 11th World Filtration Congress, Graz, Austria, 16–20 March 2012. [Google Scholar]
  26. Myers, D.L.; Arnold, B.D. Electret Media for HVAC Filtration Applications. INJ Winter 2003, 12, 43–54. [Google Scholar] [CrossRef] [Green Version]
  27. Sun, C. Implication of Discharging Condtitioning on Air Filter Media. In Proceedings of the International Nonwovens Technical Conference (INTC), Denver, CO, USA, 21–24 September 2009. [Google Scholar]
  28. Kim, J.; Hinestroza, J.P.; Jasper, W.; Barker, R.L. Effect of Solvent Exposure on the Filtration Performance of Electrostatically Charged Polypropylene Filter Media. Text. Res. J. 2009, 79, 343–350. [Google Scholar] [CrossRef]
  29. Kerner, M.; Schmidt, K.; Schumacher, S.; Asbach, C.; Antonyuk, S. Ageing of electret filter media due to deposition of submicron particles—Experimental and numerical investigations. Sep. Purif. Technol. 2020, 251, 117299. [Google Scholar] [CrossRef]
  30. Oh, Y.-W.; Jeon, K.-J.; Jung, A.-I.; Jung, Y.-W. A Simulation Study on the Collection of Submicron Particles in a Unipolar Charged Fiber. Aerosol Sci. Technol. 2002, 36, 573–582. [Google Scholar] [CrossRef]
  31. Rief, S.; Latz, A.; Wiegmann, A. Research note: Computer simulation of air filtration including electric surface charges in 3-dimensional fibrous microstructures. Filtr. Solut. 2006, 6, 169–172. [Google Scholar]
  32. Schober, C. Modeling and Simulation of Cabin Air Filtration with Focus on Electrostatic Effects. Ph.D. Thesis, Universität Stuttgart, Stuttgart, Germany, 2019. [Google Scholar]
  33. Mohan, A. Effect of Organic Solvent Exposure on Electret Filtration; Raleigh. 2005. Available online: http://www.lib.ncsu.edu/resolver/1840.16/2168 (accessed on 3 January 2021).
  34. Wiedensohler, A. An approximation of the bipolar charge distribution for particles in the submicron size range. J. Aerosol Sci. 1988, 19, 387–389. [Google Scholar] [CrossRef]
  35. Schmidt, K. Dreidimensionale Modellierung von Filtermedien und Simulation der Partikelabscheidung auf der Mikroskala. Ph.D. Thesis, University of Kaiserslautern, Kaiserslautern, Germany, 2011. [Google Scholar]
  36. Stratton, J.A. Electromagnetic Theory; McGraw-Hill: New York, NY, USA, 1941. [Google Scholar]
  37. Brown, R.C. Air Filtration—An Integrated Approach to the Theory and Applications of Fibrous Filters, 1st ed.; Pergamin Press: Oxford, UK, 1993. [Google Scholar]
  38. Kim, J.C.; Otani, Y.; Noto, D.; Namiki, N.; Kimura, K. Initial Collection Performance of Resin Wool Filters and Estimation of Charge Density. Aerosol Sci. Technol. 2005, 39, 501–508. [Google Scholar] [CrossRef] [Green Version]
  39. Chang, D.-Q.; Chen, S.-C.; Fox, A.R.; Viner, A.S.; Pui, D.Y.H. Penetration of Sub-50 nm Nanoparticles Through Electret HVAC Filters Used in Residence. Aerosol Sci. Technol. 2015, 49, 966–976. [Google Scholar] [CrossRef] [Green Version]
  40. Lee, M.; Otani, Y.; Namiki, N.; Emi, H. Prediction of Collection Efficiency of High-performance Electret Filters. J. Chem. Eng. Jpn. JCEJ 2002, 35, 57–62. [Google Scholar] [CrossRef]
  41. Chen, S.-C.; Wang, J.; Bahk, Y.K.; Fissan, H.; Pui, D.Y.H. Carbon Nanotube Penetration Through Fiberglass and Electret Respirator Filter and Nuclepore Filter Media: Experiments and Models. Aerosol Sci. Technol. 2014, 48, 997–1008. [Google Scholar] [CrossRef] [Green Version]
Figure 1. Experimental setup for evaluation of filtration behavior of electret filter media according to Kerner et al. [9].
Atmosphere 12 00065 g001
Figure 2. Charge probability of particles in bipolar charge equilibrium according to [34] and the raw gas particle size distribution measured with scanning mobility particle sizer (SMPS) (Model 3934, TSI GmbH).
Atmosphere 12 00065 g002
Figure 3. Filtration efficiency using sodium chloride particles in bipolar equilibrium charge distribution and a face velocity of 0.02 m·s−1: (a) filter medium 1; (b) filter medium 5; (c) filter medium 7.
Atmosphere 12 00065 g003aAtmosphere 12 00065 g003b
Figure 4. Averaged filtration efficiencies, depending on the flow velocity and filter medium, after conditioning the filter media in IPA-saturated air for 24 h, and the corresponding air permeability of the filter media.
Atmosphere 12 00065 g004
Figure 5. Applied cases of charge distribution on fibers: (a) random distribution of spherical charge spots on an oppositely charged background, (b) dividing the complete fibrous structure in two parts with opposite polarity (according to [13]).
Atmosphere 12 00065 g005
Figure 6. Decrease of electric charge magnitude from the filter medium surface to the middle of the fibrous structure.
Atmosphere 12 00065 g006
Figure 7. Filtration efficiency of a bipolar charged fibrous structure with equal area ratio of positively and negatively charged surfaces depending on the spot size for charge modeling.
Atmosphere 12 00065 g007
Figure 8. Filtration efficiency using sodium chloride particles in bipolar equilibrium charge distribution and a face velocity of 0.02 m·s−1 depending on the decrease of electric charge magnitude.
Atmosphere 12 00065 g008
Table 1. Investigated filter media. Specification of material, manufacturing process, and charging methods.
Filter MediumMaterialManufacturing ProcessCharging Method
1PolypropyleneN/ACorona charged
2N/AMeltblownN/A
3PolypropyleneMeltblownCorona charged
4Polyamide nanofiber layer, Polyethylene/Polypropylene supporting layer,Spunbond (supporting layer)Corona charged
5Polypropylene, Polyethylene terephthalate supporting layer,Meltblown (supportinglayer)Corona-charged
6PolypropyleneSpunbondN/A
7Polymer-BlendN/ATriboelectrically charged
8Polymer-BlendN/ATriboelectrically charged
9Polymer-BlendN/ATriboelectrically charged
10Polymer-BlendN/ATriboelectrically charged
Table 2. Air permeability and parameters of fibrous structure of the investigated filter media.
Filter MediumBasis WeightAir Permeability (200 Pa)PorosityThicknessArithmetic Mean Value of Fiber Diameter DistributionModal Value of Fiber Diameter Distribution
g∙m−2L∙m−2∙s−1%µmµmµm
UpstreamDownstreamUpstreamDownstream
1133 ± 72527 ± 22777.2 ± 0.2646.8 ± 37.031.8 ± 1.532.8 ± 1.532.532.5
251 ± 3101 ± 387.3 ± 0.1447.1 ± 97.71.9 ± 1.11.5 ± 0.71.11.1
3152 ± 8705 ± 1379.4 ± 0.1847.4 ± 74.714.4 ± 3.713.7 + 4.811.311.3
4108 ± 3895 ± 17786.7 ± 0.2934.2 ± 58.720.4 ± 3.8
0.1 (Nanofiber layer)
22.6 ± 1.521.323.8
5114 ± 4712 ± 4485.8 ± 0.1654.7 ± 92.03.4 ± 2.228.9 ± 12.01.516.3
41.3
6153 ± 6444 ± 5692.6 ± 0.12377.0 ± 214.315.6 ± 9.017.1 ± 1.612.516.3
756 ± 14473 ± 11196.2 ± 0.31739.0 ± 33.318.2 ± 2.419.2 ± 2.218.818.8
867 ± 14407 ± 22296.1 ± 0.21603.3 ± 95.518.8 ± 3.718.0 ± 2.118.818.8
999 ± 143105 ± 40895.8 ± 0.42467.7 ± 11.319.3 ± 3.918.0 ± 3.018.818.8
10149 ± 41889 ± 12195.3 ± 0.23261.0 ± 110.618.0 ± 4.118.2 ± 4.318.818.8
Table 3. Filtration efficiencies for a particle size of 300 nm depending on the flow velocity, discharging method, and filter medium.
Filter Medium1235678910
Face velocity of 0.02 m·s−1
Untreated0.771.000.970.970.850.930.900.970.99
5 min IPA liq.0.260.950.360.470.670.110.190.190.43
24 h IPA liq.0.130.87 0.350.550.09 0.35
24 h IPA vap.0.130.80 0.210.420.13 0.10
Face velocity of 0.08 m·s−1
Untreated0.481.000.770.810.510.600.600.780.91
5 min IPA liq.0.060.850.150.220.410.070.110.070.14
24 h IPA liq.0.080.85 0.050.410.09 0.05
24 h IPA vap.0.080.63 0.090.420.10 0.09
Green: Effect of immersion and vapor discharging comparable already after 5 min. Figure 3c. Orange: Effect of immersion and vapor discharging closer after 24 h than after 5 min, but still different. Figure 3a. Red: Effect of immersion and vapor discharging not comparable even after 24 h. Figure 3b. Yellow: Effect of immersion and vapor discharging comparable only after 24 h.
Table 4. Values for 3D model generation.
ThicknessPorosityFiber DiameterSpot Size
µm-µmµm
5000.7103–6
6000.75206–12
6750.793210–20
8000.854012–25
9000.95016–30
Table 5. Simulation parameters.
TemperatureK293.15
Pressurembar1013
Gas viscositykg·m−1·s−118.1 × 10⁻⁶
Gas densitykg·m−31.2
Particle densitykg·m−32160
Relative dielectric constant of particles-5.9
Air velocitym·s−10.02
Surface charge densityµC·m−2100
Table 6. Averaged filtration efficiencies, depending on the thickness, porosity, and fiber diameter of the fibrous structure, for both applied cases of charge distribution.
Thickness/µm500600675800900
No charge0.280.320.320.370.39
Divided0.870.910.910.930.94
0.590.590.590.570.56
Spherical spots0.800.840.840.880.89
0.520.520.520.510.51
Porosity/−0.700.750.790.850.90
No charge0.430.370.320.280.21
Divided0.960.940.910.880.80
0.530.560.590.610.60
Spherical spots0.920.880.840.790.68
0.500.510.520.520.48
Fiber Diameter/µm1020324050
No charge0.840.500.320.270.22
Divided1.000.980.910.880.80
0.160.480.590.600.58
Spherical Spots1.000.940.840.800.74
0.150.440.520.530.52
Publisher’s Note: MDPI stays neutral with regard to jurisdictional claims in published maps and institutional affiliations.

