Article

MultiStep Ahead Forecasting for Hourly PM10 and PM2.5 Based on Two-Stage Decomposition Embedded Sample Entropy and Group Teacher Optimization Algorithm

1
School of Statistics and Mathematics, Zhongnan University of Economics and Law, Wuhan 430073, China
2
Hubei Province Key Laboratory of Systems Science in Metallurgical Process, Wuhan University of Science and Technology, Wuhan 430081, China
3
School of Mathematical Science, Monash University, Melbourne Clayton 3800, Australia
*
Author to whom correspondence should be addressed.
Atmosphere 2021, 12(1), 64; https://doi.org/10.3390/atmos12010064
Submission received: 12 November 2020 / Revised: 16 December 2020 / Accepted: 30 December 2020 / Published: 3 January 2021
(This article belongs to the Special Issue Application of Machine Learning in Air Pollution)

Abstract

:
The randomness, nonstationarity and irregularity of air pollutant data bring difficulties to forecasting. To improve the forecast accuracy, we propose a novel hybrid approach based on two-stage decomposition embedded sample entropy, group teaching optimization algorithm (GTOA), and extreme learning machine (ELM) to forecast the concentration of particulate matter (PM10 and PM2.5). First, the improvement complementary ensemble empirical mode decomposition with adaptive noise (ICEEMDAN) is employed to decompose the concentration data of PM10 and PM2.5 into a set of intrinsic mode functions (IMFs) with different frequencies. In addition, wavelet transform (WT) is utilized to decompose the IMFs with high frequency based on sample entropy values. Then the GTOA algorithm is used to optimize ELM. Furthermore, the GTOA-ELM is utilized to predict all the subseries. The final forecast result is obtained by ensemble of the forecast results of all subseries. To further prove the predictable performance of the hybrid approach on air pollutants, the hourly concentration data of PM2.5 and PM10 are used to make one-step-, two-step- and three-step-ahead predictions. The empirical results demonstrate that the hybrid ICEEMDAN-WT-GTOA-ELM approach has superior forecasting performance and stability over other methods. This novel method also provides an effective and efficient approach to make predictions for nonlinear, nonstationary and irregular data.

1. Introduction

The prediction of future events from the noisy and nonstationary time series data is a challenging problem. This type of problem has been found in a wide range of research areas, including finance, biological sciences, environment, ecology, and engineering [1,2,3,4,5]. Although a number of statistical inference methods and machine learning algorithms have been proposed to make predictions, it is still a substantial challenge to make more accurate and reliable forecasting for time series data with high volatility.
The forecasting of atmospheric pollution is one of the important problems in the analysis of noise and nonstationary time series. In recent years, atmospheric pollution has become one of the most important issues all over the world [6,7]. The particulate matter of aerodynamic diameter less than or equal to 2.5 and 10 microns is the major air pollutant, which also causes significant influence on human health and daily activities [8]. Therefore, a precise short-term forecasting model should be developed to enhance the prediction performance of air-pollutant concentrations, which not only can give valuable support for decision-making of relevant departments, but also can provide helpful information for air-quality monitoring systems. That will have great significance on guiding daily activities of people for alleviating public health risks based on the real-time prediction. There is an increasing demand to develop data-driven algorithms based on hourly observations time series for making reliable short-term forecasting of particulate matter (PM) concentrations [9,10]. However, due to the nonstationary, nonlinear and complex characteristic of PM2.5 and PM10, it is difficult to make a precise forecasting for it.
In the previous study, the forecasting approach for PM10, PM2.5 and other air-pollutant concentration forecasting can be divided into traditional statistical approach, machine learning approach, and hybrid approach. The traditional statistical approaches, such as multiple linear regression (MLR) [11] and autoregressive moving integrated average (ARIMA) [12] are usually employed to predict the concentration of air pollutants. With the maturity and development of data mining technology, machine learning approaches such as artificial neural network (ANN) [13,14,15], support vector machine (SVM), and intelligent algorithm [16,17,18] have been widely used for forecasting. Park et al. [19] presented an ANN model to predict the PM10 concentration in six subway stations based the information of outdoor PM10 concentration, the number of subway trains, and ventilation rate; the forecasting accuracy was 67–80%.
In addition to the statistical and machine learning approach, the hybrid models based on data preprocessing have become more and more popular, especially for the time series with high volatility and nonlinearity characteristics. Mahajan et al. [20] introduced wavelet transform (WT) to decompose original PM2.5 concentration. The autoregressive integrated moving average (ARIMA) and neural network autoregression (NNAR) are utilized to forecast the subseries. Jiang et al. [21] proposed a novel hybrid approach that combines wavelet packet decomposition (WPD), improved pigeon-inspired optimization algorithm and extreme learning machine (ELM); for the forecasting of AQI, the prediction performance of a single model has been greatly improved. In addition, Wang et al. [22] developed a new hybrid approach based on secondary decomposition and the back propagation neural network (BPNN) model optimized by differential evolution (DE) algorithm. WT is first used to decompose the original time series of PM2.5 concentration into several subseries, and variational mode decomposition (VMD) is further utilized to decompose the subseries; the DE algorithm is employed to optimize the weights and thresholds of the BPNN. Yang et al. [23] applied the complementary ensemble empirical mode decomposition (CEEMD) to decompose the concentration data of PM2.5 and PM10; then the back propagation neural network BPNN, extreme learning machine (ELM) and double exponential smoothing (DES) are used to predict the subseries, respectively.
Using single decomposition algorithm can greatly enhance the forecasting performance. However, it still has some problems, such as it cannot completely extract the future of nonstationarity and irregular time series probably. There may be some complicated patterns hidden in the result of first decomposition. It is also not very efficient for the secondary decomposition in that all the subseries obtained from first decomposition are decomposed again. Consequently, this paper proposed a novel hybrid approach based on two-stage decomposition with sample entropy embedded in. Sample entropy is utilized to select the subseries with high frequency, and wavelet transform (WT) is employed to conduct the secondary decomposition of the selected subseries. The novel metaheuristic algorithm of group teaching optimization algorithm (GTOA) is introduced to optimize the original weights and thresholds of ELM. The improved ELM approach of GTOA-ELM is utilized to forecast all the subseries.
The remainder of this paper is organized as follows. Related methodologies used in this paper are detailed in Section 2. Section 3 shows the empirical outcomes and the comparative results of the hybrid forecasting approach. Horizontal precision, directional precision, and stability are also examined by using statistical indicators and statistical tests. Finally, the corresponding conclusion of this paper is given in Section 4.

2. Methods

2.1. ICEEMDAN

Empirical mode decomposition (EMD) is a kind of adaptive data analysis method utilized for the nonlinear and nonstationary signal that was proposed by Huang et al. [24], and it can decompose a complex signal into several intrinsic mode functions that contain the local characteristics of the original signals at different time scales. Based on EMD, ensemble empirical mode decomposition (EEMD) [25] is extended from EMD by adding white Gaussian noise to solve the problem of mode mixture in EMD. The intrinsic mode functions are obtained by EMD decomposition of a signal added with Gaussian white noise. However, the reconstruction error cannot be eliminated absolutely with limited times of iterations. In order to overcome the drawback of EEMD, the complete ensemble empirical mode decomposition with adaptive noise (CEEMDAN) [26] was developed. Compared with EEMD, CEEMDAN is able to reduce the reconstruction error under the low computational cost. Nevertheless, the modes of CEEMDAN still have some residual noise. The improved CEEMDAN (ICEEMDAN) was developed by Colominas et al. [27] to achieve the perfect reconstruction and avoid spurious modes, which can provide more physical meaning to the IMF and have better convergence and stability [28]. The ICEEMDAN technique is used to decompose the time series G(t) into a number of IMFs and one residual component as follows:
  • The EMD algorithm is utilized to calculate the local means of n realizations G i ( t ) :
    G i ( t ) = G ( t ) + A 0 I 1 ( κ i ( t ) )
    where the operator I j is the j th mode of the time series G(t) decomposed by the EMD, κ i represents Gaussian white noise with variance ranging from 0 to 1. A   =   ϕ 0 s t d ( G ( t ) ) / std ( I 1 ( κ i ( t ) ) ) , which is utilized to remove the fraction of noise energy action at the stage of algorithm begins. std represents the standard deviation.
  • Calculate the first residue r 1 ( t ) , and the first mode can be obtained based on it. The operator E( ) produces the local mean.
    r 1 ( t ) = E ( G i ( t ) )
    IMF 1 ( t ) = G ( t ) r 1 ( t )
  • r 2 ( t ) can be estimated by Equation (4), and then compute the second mode IMF 2 ( t ) .
    r 2 ( t ) = E ( r 1 ( t ) + A 1 I 2 ( κ i ( t ) ) )
    IMF 2 ( t ) = r 1 ( t ) r 2 ( t )
  • IMF l ( t ) and r l ( t ) for l = 3 , 4 , , L can be calculated as follows:
    r l ( t ) = E ( r l 1 ( t ) + A l 1 I l ( κ i ( t ) ) )
    IMF l ( t ) = r l 1 ( t ) r l ( t )
  • Step 4 is repeated until obtain all the IMFs.

2.2. Wavelet Transform (WT)

Wavelet transform (WT) is a kind of powerful signal processing technique. WT can be utilized to decompose a nonlinear and nonstationary signal into several components at different resolution levels, including a low-frequency approximation subset and several high-frequency subseries. The low-frequency approximation subset that can reflect the tendency of the original signal and those high-frequency subseries represent the components of turbulence and noise [29]. As an effective data preprocessing method, it can reduce the difficulty of feature learning and enhance the prediction performance. Thus, WT has been widely used in many fields [30].

2.3. Sample Entropy

Sample entropy (SE) is an algorithm to measure the complexity of time series, which was proposed by Richman and Moorman [31]. The greater the value of sample entropy, the higher the complexity of time series. As an improvement of approximate entropy, SE is independent of data length and has better consistency. The value of sample entropy can be represented as S E ( m , r , N ) , r is the similarity tolerance and the value of it was set to r = 0.2 standard deviations, the reconstruction dimension m was set as 2 in this paper. The steps to calculate the sample entropy are shown below.
Step 1: For a given time series, and m-dimensional vectors is comprised based on it.
Y i = [ y i , y i + 1 , , y i + m 1 ] , i = 1 , 2 , , N m + 1
Step 2: The absolute distance of corresponding elements between vectors is calculated, and define distance between Y i and Y j .
D m ( Y i , Y j ) = m a x { | y i + l , y j + l | } , l = 1 , 2 , , m + 1
Step 3: For a given threshold r, count the total number of D m ( Y i , Y j ) < r , calculate the ratio B i m ( r ) and the mean value of B i m ( r )
B i m ( r ) = 1 N m n u m { D m ( Y i , Y j ) < r }
B m ( r ) = 1 N m + 1 i = 1 N m + 1 B i m ( r )
Step 4: Set m to m+1, repeat steps1-3, and then obtain the mean value of B m + 1 ( r ) .
B m + 1 ( r ) = 1 N m i = 1 N m B i m + 1 ( r )
Step 5: Calculate SE value.
S E ( m , r ) = lim N { ln ( B m + 1 ( r ) B m ( r ) ) }
Step 6: For a finite time series, the result of SE value can be estimated through Equation (14).
S E ( m , r , N ) = ln ( B m + 1 ( r ) B m ( r ) )

2.4. Group Teaching Optimization Algorithm (GTOA)

The group teaching optimization algorithm (GTOA) proposed by Zhang and Jin [32] in 2020 is a novel metaheuristic optimization algorithm that was inspired by the group teaching mechanism. Less control of parameters is the best advantage of the GTOA algorithm. In addition to the basic parameter of population size and termination criteria, it does not need any extra control parameters. Furthermore, the GTOA algorithm has the advantages of fast convergence speed and strong global optimal searching ability. The GTOA algorithm mainly contains four phases, including ability grouping phase, teacher phase, student phase and teacher allocation phase. The detailed description of four phases is given as follows [32].
In the phase of ability grouping, the knowledge of whole class is following the normal distribution. Equation (15) shows the knowledge distribution of students. Here x is the knowledge of the students, μ is the mean value of the whole class, and σ is standard deviation of knowledge among students. In the GTOA algorithm, all the students can be divided into two groups based on the ability to accept knowledge: outstanding group and average group.
p o p ( x ) = 1 2 π σ exp ( ( x μ ) 2 2 σ 2 )
In the teacher phase, students acquire knowledge from the teacher. And the students of the outstanding group and the average group update their knowledge by Equations (16) and (17), respectively.
X t , j l + 1 = X j l + α × ( T l F × ( β × M l + γ × X j l ) )
X t , j l + 1 = X j l + 2 × r × ( T l X j l )
where X t , j l   +   1 represents the knowledge of student j learned from the teacher at time l + 1, X j l is the knowledge of student j at time l, T l is the knowledge of teacher at time l, and the M l is the average knowledge of the group at tome l. α , β , γ and λ are the random numbers between 0 and 1. Then, based on following equation, the student should decide whether to accept the knowledge learned from the teacher.
X t , j l + 1 = { X t , j l + 1 , f ( X t , j l + 1 ) < f ( X j l ) X j l , f ( X t , j l + 1 ) f ( X j l )
In the student phase, students are able to gain the new knowledge through self-learning and cooperation with other students. The updated knowledge is expressed as follows.
X s , j l + 1 = { X t , j l + 1 + a × ( X t , j l + 1 X t , i l + 1 ) + b × ( X t , j l + 1 X j l ) , f ( X t , j l + 1 ) < f ( X t , i l + 1 ) X t , j l + 1 a × ( X t , j l + 1 X t , i l + 1 ) + b × ( X t , j l + 1 X j l ) , f ( X t , j l + 1 ) f ( X t , i l + 1 )
where X s , j l   +   1 is the knowledge of student j at time l + 1 through learning from the student phase, a and b are the random numbers between 0 and 1. Similar to the teacher phase, the student should decide whether to accept the knowledge gained through the student phase according to the Equation (20).
X j l + 1 = { X t , j l + 1 < f ( X t , j l + 1 ) < f ( X s , j l + 1 ) X s , j l + 1 , f ( X t , j l + 1 ) f ( X s , j l + 1 )
In the teacher allocation phase, the teacher allocation can be expressed by the following equation for accelerating the convergence as well as avoiding local minimum.
T l = { X 1 l , f ( X 1 l ) < f ( X 1 l + X 2 l + X 3 l ) X 1 l + X 2 l + X 3 l , f ( X 1 l ) f ( X 1 l + X 2 l + X 3 l )
where X 1 l , X 2 l and X 3 l denote the first, second, and third best students.

2.5. Modified Extreme Learning Machine

The extreme learning machine (ELM), proposed by Huang et al. [33] is a single-hidden layer feedforward neural network (SLFN) with an effective learning algorithm. The ELM is able to choose the weights and thresholds randomly and determine the output weights analytically, and thus has the advantage of fast training speed. Furthermore, it has better nonlinear mapping capability and is widely used in the field of prediction. However, due to the random selection of weights and thresholds, the generalization ability and stability may be influenced. In this paper, the ELM is modified by using the GTOA algorithm to optimize the initial weights and thresholds. The mean absolute error (MAE) of ELM is set as the objective function of the GTOA algorithm. And the GTOA-ELM is utilized to enhance the forecasting performance, stability, and generalization ability of the ELM.
MAE = 1 T t = 1 T | g ^ ( t ) g ( t ) |

2.6. Multistep Prediction

The PM10 and PM2.5 concentrations are no doubt affected by the concentrations of previous several days greatly. Thus, many forecasting models utilized the data of previous several days as input and predicted the latter one [22]. Consequently, in this paper, the n-step ahead forecasting formula is presented as Equation (23).
y ^ l + n = f ( y l h , y l h + 1 , , y l 1 , y l ) , l = 1 , 2 , , L
where y ^ l   +   n is the forecasting result of original time series at time l + n , it is the result of n-step forecasting; y l h represents the actual value of time series at time l h , we will use the data of previous seven days to predict one-step-, two-step-, and three-step-ahead concentrations of PM10 and PM2.5.

2.7. Framework of the Proposed Hybrid Approach

In order to enhance the forecasting performance of PM2.5 and PM10 concentrations, a novel hybrid approach is developed based on a data-preprocessing technique that embedded sample entropy into two-stage decomposition and the modified ELM with GTOA. The structure of the proposed approach is shown as Figure 1, which contains three main steps:
Step 1: Data preprocessing. In order to reduce the prediction difficulty and errors, the ICEEMDAN algorithm is first used to decompose the original time series of PM10 and PM2.5 concentration into several IMFs. There are still complex subseries in IMFs. Sample entropy was adopted to measure the complexity of IMFs. For fully extracting the complex features of data, the WT algorithm is further utilized to decompose IMFs with higher sample entropy value.
Step 2: Individual forecasting. In order to improve the forecasting performance, stability and generalization ability of ELM, a new metaheuristic optimization algorithm GTOA is used to optimize the initial weights and thresholds of ELM. Then, the modified ELM of GTOA-ELM is employed to predict all the subseries.
Step 3: Prediction result aggregating. the prediction outcomes of IMFs is obtained via summarizing the forecasting results of subseries decomposed by WT, and then we further summarize the results of IMFs to get the final prediction results.

3. Empirical Results and Analysis

In this section, we will use the hybrid ICEEMDAN-WT-GTAO-ELM model to make one-step-, two-step-, and three-step-ahead predictions for hour PM2.5 and PM10 concentrations of Beijing.

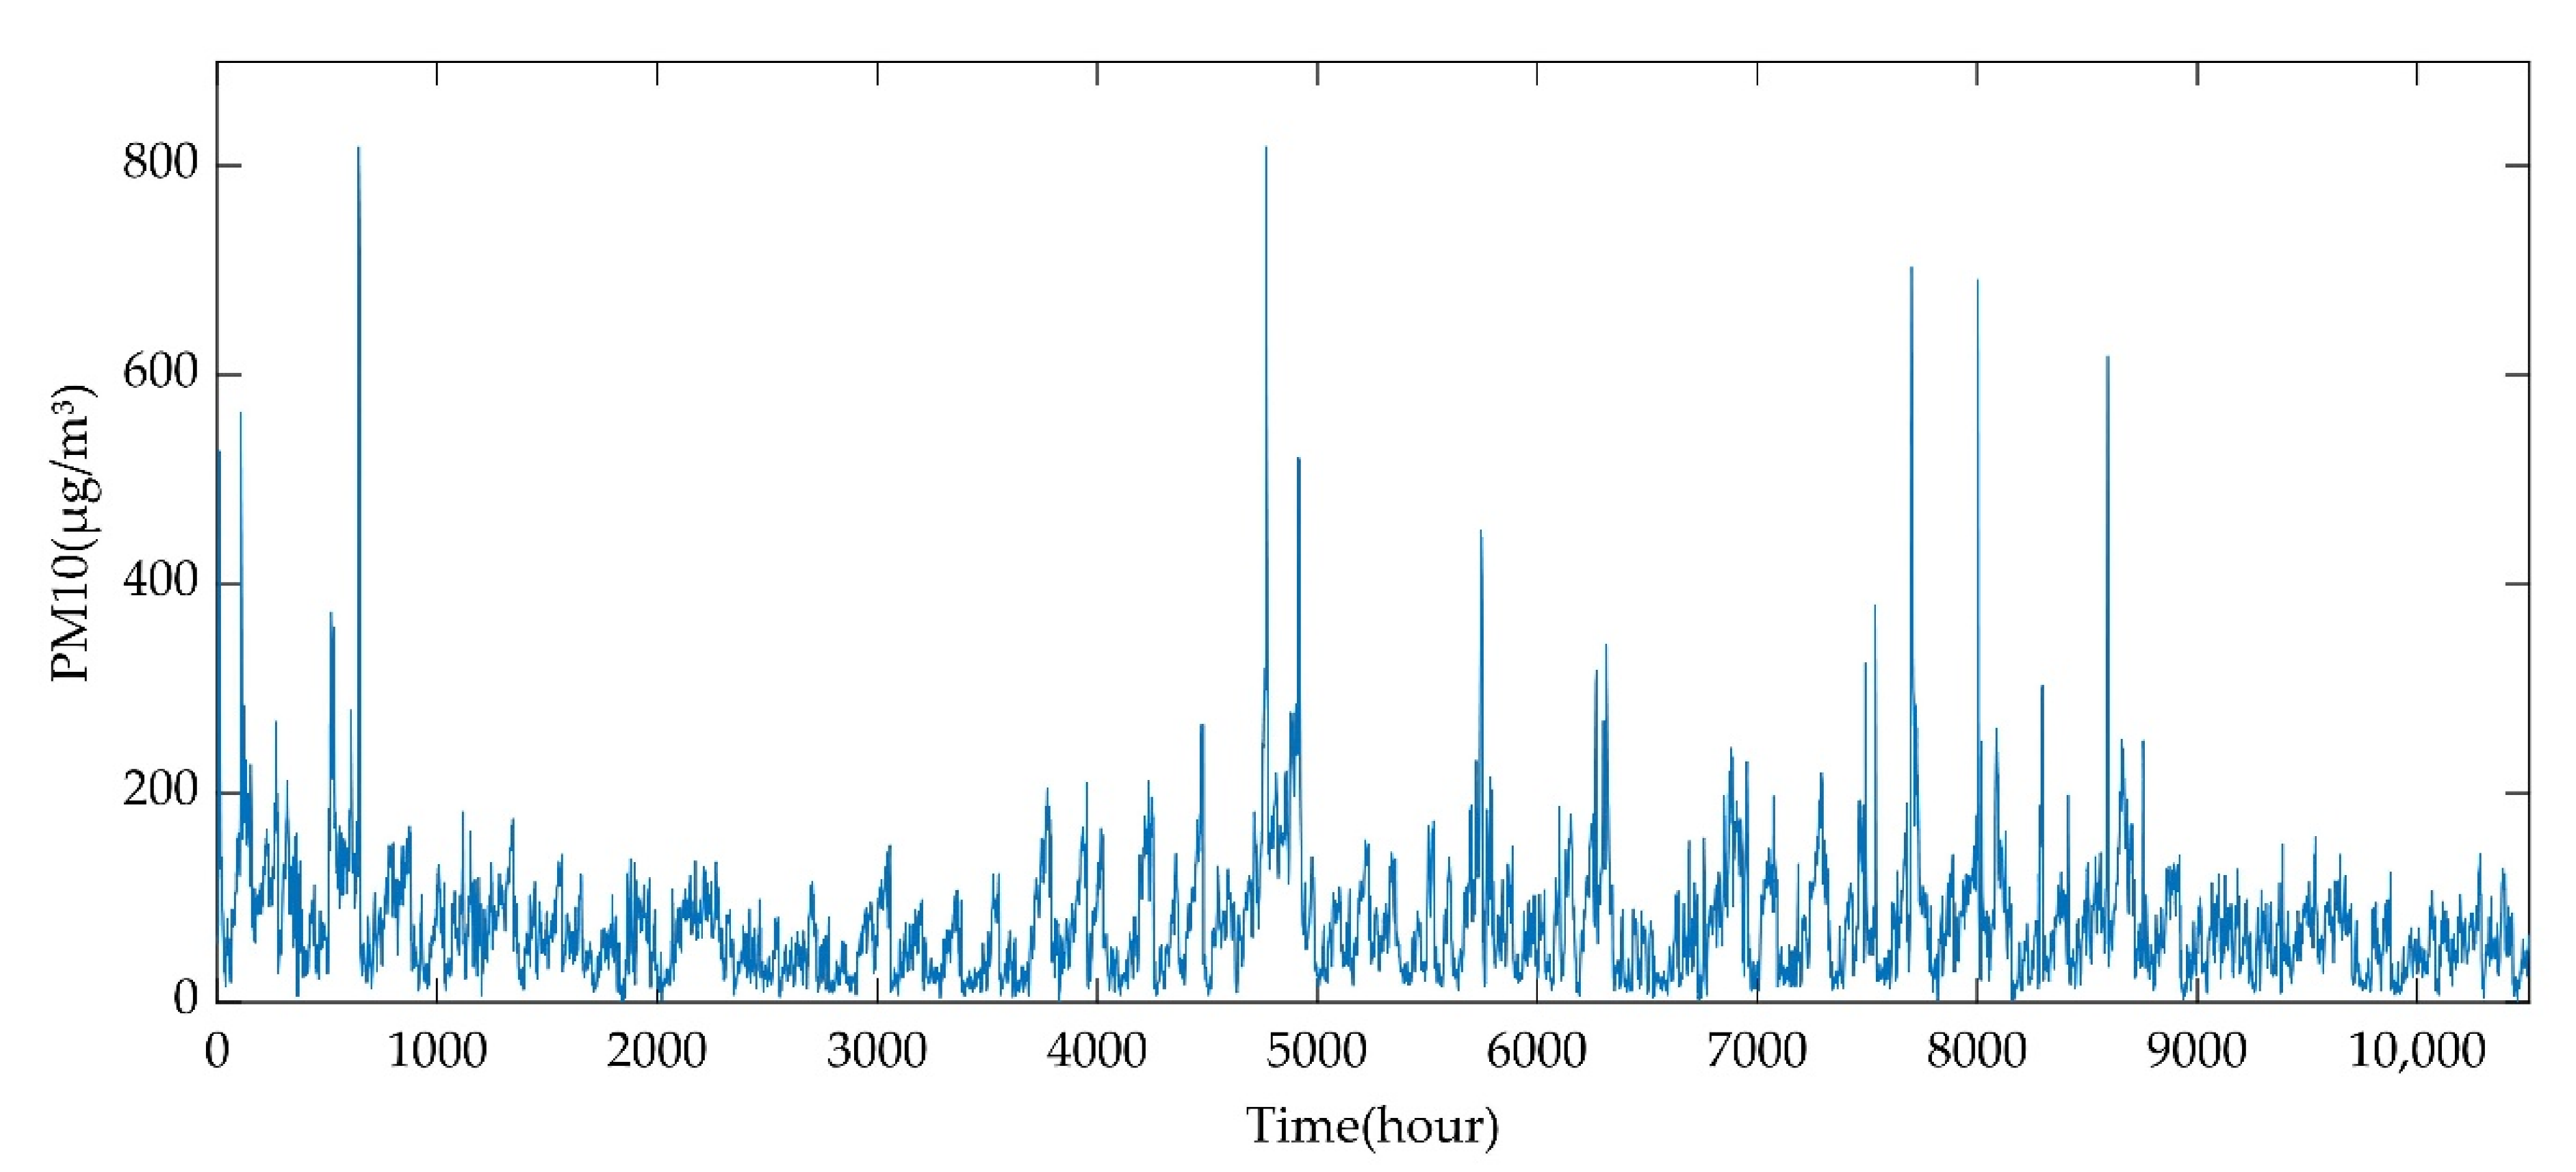
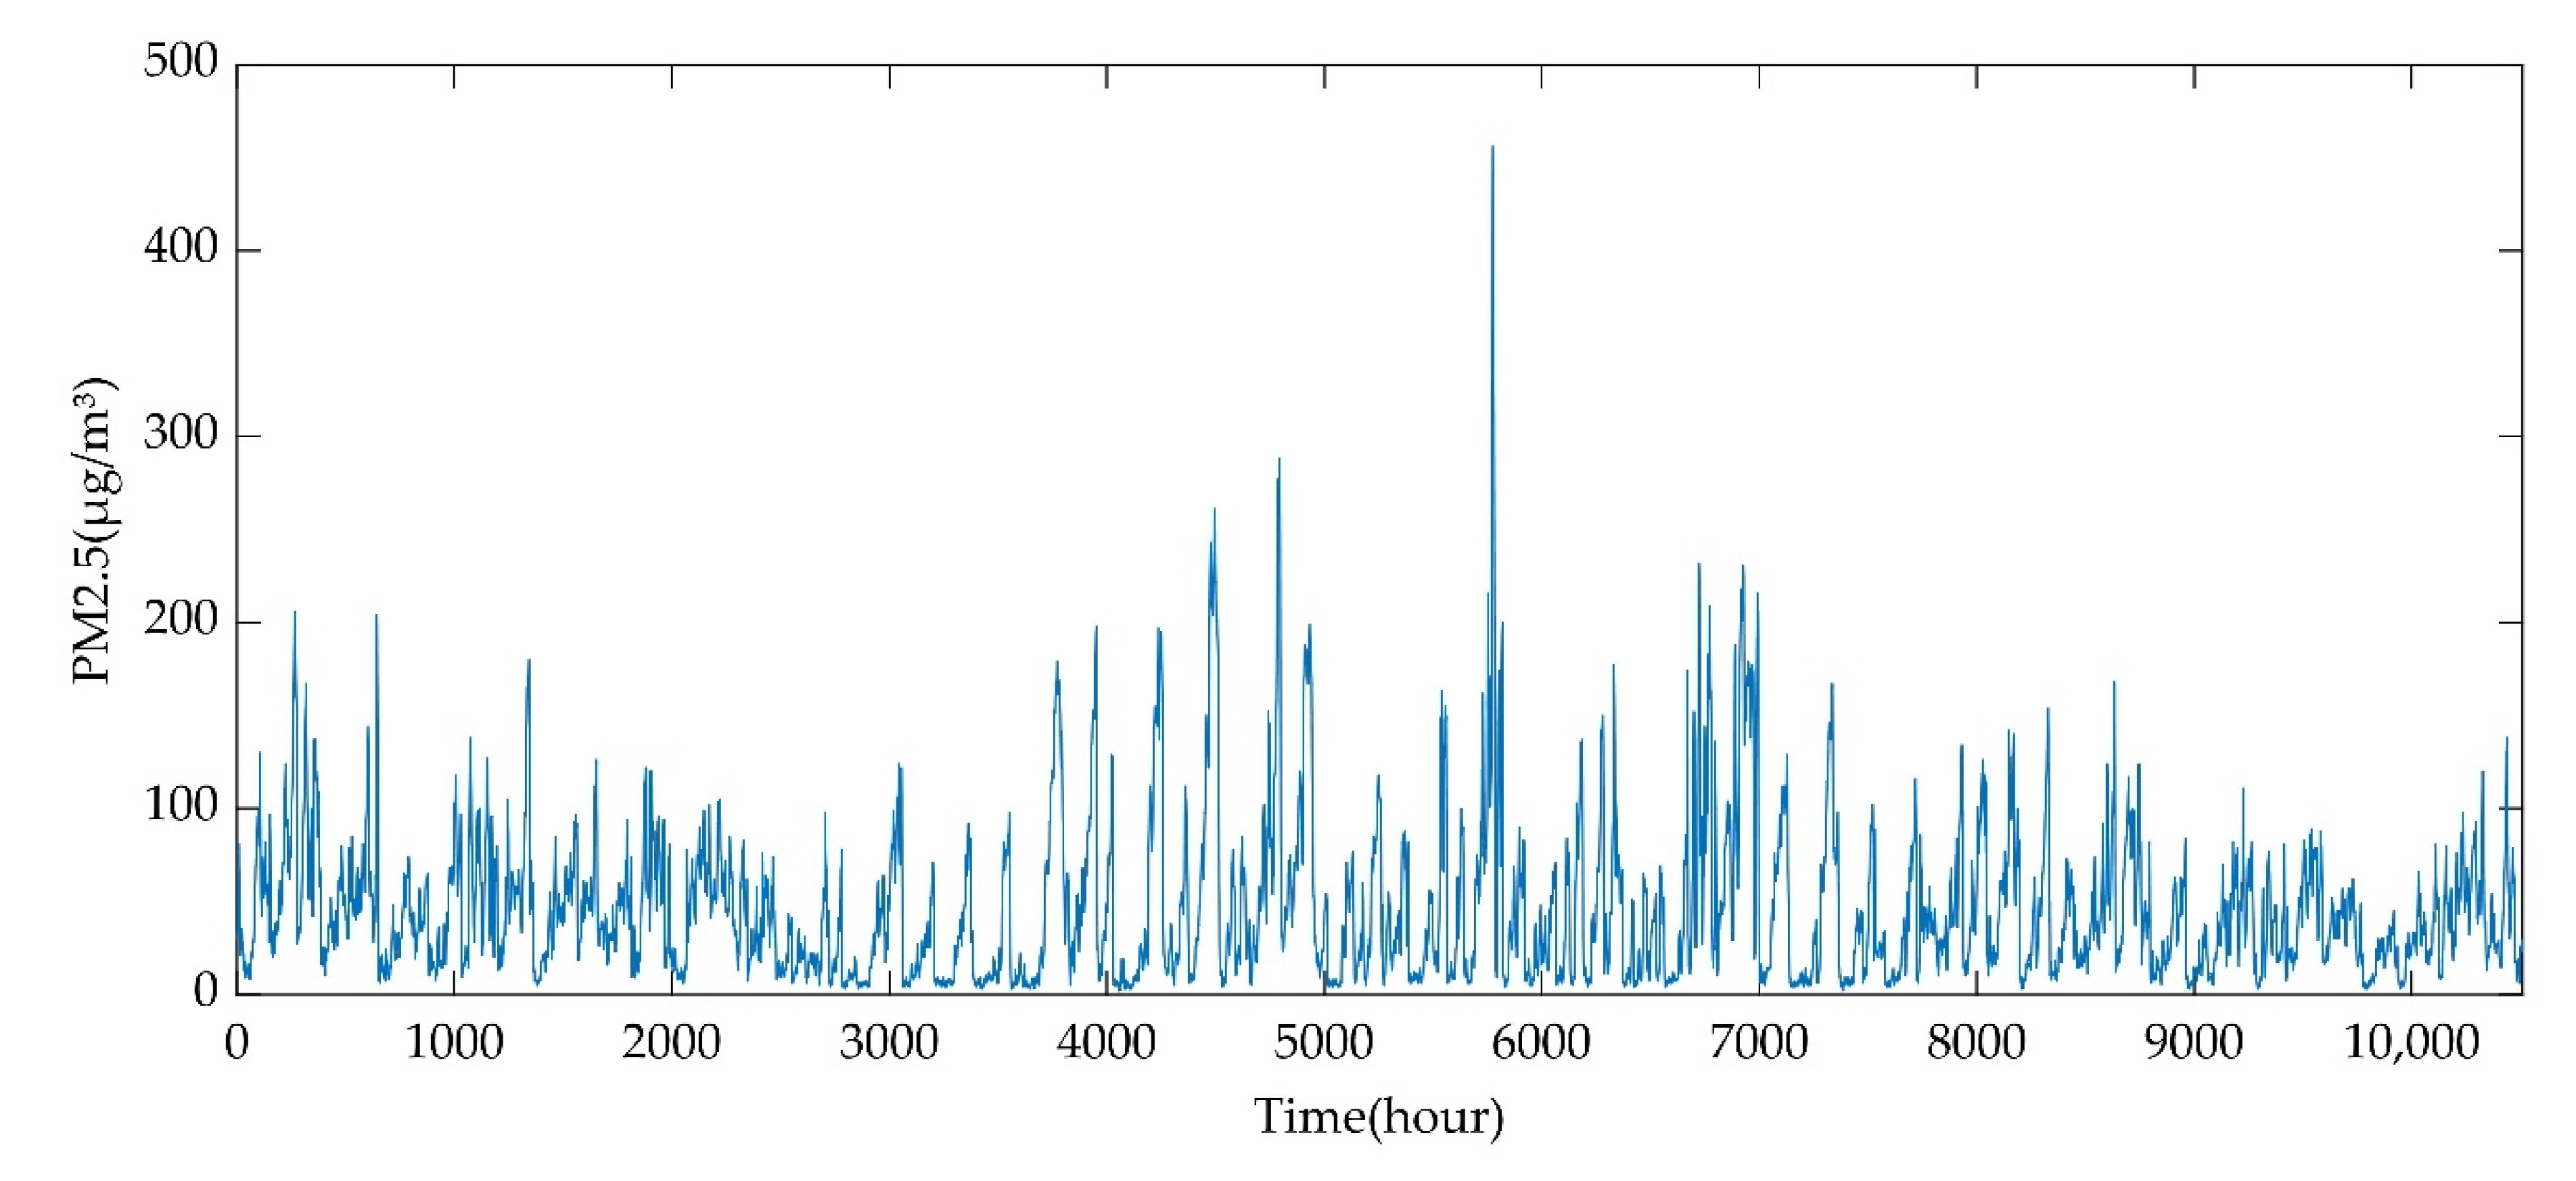
3.1. Data Set and Evaluation Criteria

In this study, the data comprises hour concentrations of fine particulate matter (PM10 and PM2.5) of Beijing, the time series includes 10,510 observations from 10 May 2018 to 1 August 2019. The concentrations of PM10 and PM2.5 are shown in Figure 2 and Figure 3. In addition, in the PM2.5 concentration series and PM10 concentration series, the data of the last three months are set as a testing set, and the rest of the data are a corresponding training set.
In order to evaluate the performance of the proposed model, several statistical indicators and statistical tests are used to make reasonable comparison. Statistical indicators of mean absolute error (MAE), mean absolute percentage error (MAPE), root mean square error (RMSE), normalized root mean square error (NRMSE), Theil’s coefficient (TIC), and direction statistics (Ds) are utilized to evaluate forecasting error of different models. Especially, the statistical indicators of MAE, MAPE, NRMSE and TIC are employed to quantify the horizontal errors, which can be used to assess the horizontal deviation between the predicted result and the actual value [34]. Ds is utilized to measure the capability of forecasting direction. The calculation method of those statistical indicators are explained as follows:
MAE = 1 T t = 1 T | G ( t ) G ^ ( t ) |
MAPE = 1 T t = 1 T | G ( t ) G ^ ( t ) G ( t ) | × 100 %
NRMSE = 100 G ¯ ( t ) 1 T t = 1 T ( G ( t ) G ^ ( t ) ) 2 × 100 %
TIC = 1 T t = 1 T ( G ( t ) G ^ ( t ) ) 2 1 T t = 1 T G 2 ( t ) 1 T t = 1 T G ^ 2 ( t )
Ds = 1 T t = 2 T w ( t ) × 100 %   , w ( t ) = { 1 ,   ( G ( t ) G ( t 1 ) ) ( G ^ ( t ) G ( t 1 ) )   0 0   ,   otherwise  
where T is the total number of observations in the testing set, G ( t ) represents the original PM10 or PM2.5 concentration series, G ^ (t) indicates the predicted value of PM10 or PM2.5 concentration. G ¯ ( t ) is the mean value of actual concentrations.
In order to further evaluate the forecasting performance of different models, the Diebold-Mariano (DM) test [35] is utilized to analyze the statistically significant differences between the proposed model and other benchmark models. In this paper, mean square error is taken as the loss function of the DM test. The null hypothesis is that the performance of the benchmark model and the tested model is not significant; the alternative hypothesis is that the forecasting performance of the test model is better than the benchmark models.

3.2. Result and Analysis

In this section, the concentrations of fine particulate matter PM2.5 and PM10 are used to verify the superiority of the proposed model. For a comparison purpose, ELM, DE-ELM, GTOA-ELM, WT-ELM, WT-GTOA-ELM, ICEEMDAN-ELM, and ICEEMDAN-GTOA-ELM models are employed for comparison from different points. Multi-step forecasting results and comparative analysis for PM10 and PM2.5 are shown in the following subsections.

3.2.1. Subsubsection

Figure 4, Figure 5, Figure 6, Figure 7 and Figure 8 show the MAPE, MAE, NRMSE, TIC, and Ds values of the eight forecast models of one-step-, two-step-, and three-step-ahead predictions. The DM test of multistep predictions is given in Table 1, Table 2 and Table 3. From Figure 4, Figure 5, Figure 6, Figure 7 and Figure 8, we can conclude that: (1) The proposed model based on sample entropy and two types of data decomposition technology achieve the highest forecast performance on the horizontal and directional forecasting—the MAE, MAPE, NRMSE, and TIC of it are all the smallest in one-step-, two-step-, and three-step-ahead forecasting. The values for the directional forecasting of the ICEEMDAN-WT-GTOA-ELM are 97.02%, 90.09%, and 88.53%, which are higher than other benchmark models. (2) The models that embedded with sample entropy selection and two-stage decomposition technology display better performance than those models that only include one type of decomposition technology or not. For example, the MAPE of ICEEMDAN-WT-GTOA-ELM is 3.11% in one-step-ahead forecasting and 4.06%, 6.79%, respectively, in ICEEMDAN-GTOA-ELM and WT-GTOA-ELM; the same conclusion can be draw in two-step and three-step forecasting. (3) The forecasting error of models with decomposition technology are all lower than those models without decomposition, which demonstrates that the decomposition technology can effectively extract the feature of nonstationary PM10 concentration time series, further improving the forecasting performance of the single model. (4) The forecasting errors of GTOA-ELM are less than DE-ELM and ELM. The forecasting performance of DE-ELM is also better than ELM. It can be seen that the optimization algorithm can improve the prediction accuracy of the single model, and the GTOA algorithm is more suitable for optimizing the weights and thresholds of ELM than DE optimization algorithm.
The DM test is utilized to test the statistical difference between the test model and the benchmark models. The null hypothesis is that the performance of the benchmark models and the tested model is not significant, and the alternative hypotheses is that the forecasting performance of the tested model is better than the benchmark models. Table 1, Table 2 and Table 3 report DM test results for one-step-, two-step-, and three-step-ahead predictions. The values in brackets are p-values of the DM test, and the digits above p-values are the values of the DM statistic. From the results of the DM test, several conclusions can be obtained: (1) When the proposed ICEEEMDAN-WT-GTOA-ELM is set as the tested model, the p-values are all smaller than 0.01; we can conclude that the data preprocessing technology with sample entropy embedded into two-stage decomposition can effectively reduce the forecasting difficulty of PM10 concentration and significantly improve the prediction accuracy of the hybrid model. (2) GTOA-ELM is outperforming ELM model at the significance level of 5% in one-step-, two-step- and three-step-ahead forecasting, indicating that the GTOA algorithm is an effective optimizer tool. (3) The predictive capability of GTOA-ELM is also better than DE-ELM, which shows that the GTOA algorithm can significantly improve the forecasting precision of ELM compared with the DE algorithm.

3.2.2. Comparison Analysis of PM10 Forecasting

In this subsection, the new dataset of hourly PM2.5 concentrations is utilized to test the stability of the new hybrid model. The multistep forecasting results of PM2.5 via the proposed hybrid model are also compared with the results of other benchmark models.
The forecasting errors of all the models are shown in Table 4, the optimal values are highlighted in bold, and it can be seen clearly in Figure 9, Figure 10, Figure 11, Figure 12 and Figure 13. Table 5, Table 6 and Table 7 provide the DM test results of one-step, two-step, and three-step forecasting.
From Table 4 and Figure 9, Figure 10, Figure 11, Figure 12 and Figure 13, it is obvious that similar conclusions can be summarized that: (1) In most cases, the proposed model ICEEMDAN-WT-GTOA-ELM performs better than the other benchmark models. With one-step-ahead prediction as an example, the MAE, MAPE, NRMSE and TIC values of the proposed model can be reduced more than 80% compared with GTOA-ELM. It is further demonstrated that the data preprocessing technology with sample entropy and two-stage decomposition can lead to a significant enhancement of forecasting performance. (2) Comparing the two types of decomposition models that use different decomposition techniques, the proposed hybrid models based on ICEEMDAN decomposition technique perform better than the models based on WT decomposition technique. (3) Based on the values of direction statistics, the hybrid model of embedded decomposition algorithm has good performance on directional forecasting, while the other models cannot forecast the variation directions precisely.
Table 5, Table 6 and Table 7 show the DM test results for one-step-, two-step-, and three-step-ahead predictions. The proposed model ICEEMDAN-WT-GTOA-ELM is also significantly better than the other benchmark models; the horizontal and directional accuracy can be greatly improved by data preprocessing technology that embedded sample entropy into the two-stage decomposition technique. The p-value between GTOA-ELM and DE-ELM in the two-step-ahead forecasting is greater than 0.05, but it is smaller than 0.01 in one-step- and three-step-ahead forecasting, and the forecasting errors of GTOA-ELM are all smaller than DE-ELM. The GTOA algorithm is still considered superior to the DE algorithm.

4. Conclusions and Discussion

In this paper, a hybrid approach of GTOA and ELM based on data preprocessing technology to predict the concentration of PM10 and PM2.5 is proposed. This hybrid ICEEMDAN-WT-GTOA-ELM prediction model is able to achieve precise prediction for PM10 and PM2.5 concentrations. The original concentration data of PM10 and PM2.5 are decomposed by ICEEMDAN. In order to completely extract the future of nonstationarity and irregular time series, WT is employed to conduct the secondary decomposition of subseries with high frequency, which possesses greater sample entropy value. The data preprocessing technology that embedded sample entropy into two-stage decomposition can reduce the volatility and prediction difficulty of the initial data significantly. GTOA is used to optimize the initial weights and thresholds of ELM, and the modified ELM is adopted to predict the concentration of subseries. For testing the superiority of the hybrid ICEEMDAN-WT-GTOA-ELM model, we utilized concentration series of PM10 and PM2.5 to make one-step-, two-step-, and three-step-ahead predictions. Empirical analysis results demonstrate that the proposed hybrid approach has superior performance in forecasting accuracy and stability for air-pollutant forecasting compared with other benchmark models, which indicates that the data preprocessing technology that embedded sample entropy into two stage-decomposition is a powerful tool for complex series forecasting and the heuristic algorithms of GTOA can efficiently optimize weights and thresholds of ELM.
Although the proposed approach has made substantial progress to make reliable forecasting using irregular and nonstationary time series, there are still a number of issues that need to be addressed. First, this paper considers the univariate time series prediction; some extra factors also can be taken into account. In addition, the deep learning methods with powerful ability of feature extraction have appeared. As a new machine learning method, it will be more efficient in promoting the prediction accuracy of air pollutant concentration. In the future, we will take the meteorological factors and other influence factors into consideration and utilize deep learning models that combine with other heuristic algorithms to further improve the prediction accuracy. Furthermore, it would be important to apply our improved approach to analyze the observed data in real time for making timely predictions. In addition, the proposed model can be also considered to forecast the complex time series in other fields such as finance, biological sciences, ecology, and engineering. All of these issues will be the topics of our further research.

Author Contributions

Conceptualization, F.J. and Y.Q.; methodology, F.J.; formal analysis, Y.Q.; data curation, F.J.; writing—original draft preparation, Y.Q. and X.J.; writing—review and editing, Y.Q. and T.T. All authors have read and agreed to the published version of the manuscript.

Funding

This research was funded by National Natural Science Foundation of China, grant number 61773401; Hubei Province Key Laboratory of Systems Science in Metallurgical Process (Wuhan University of Science and Technology) grant number Y202001 and Natural Science Foundation of Hubei Province, China, grant number 2020CFB180).

Institutional Review Board Statement

Not applicable.

Informed Consent Statement

Not applicable.

Data Availability Statement

Data and methods used in the research have been presented in sufficient detail in the paper.

Conflicts of Interest

The authors declare no conflict of interest.

References

  1. Wen, M.; Li, P.; Zhang, L.; Chen, Y. Stock market trend prediction using high-order information of time series. IEEE Access 2019, 7, 28299–28308. [Google Scholar] [CrossRef]
  2. Jeff, T. Ocean scientists work to forecast huge plankton blooms in arabian sea. Nature 2018, 555, 569–570. [Google Scholar] [CrossRef] [Green Version]
  3. Kim, K.; Kim, D.K.; Noh, J.; Kim, M. Stable Forecasting of Environmental Time Series via Long Short Term Memory Recurrent Neural Network. IEEE Access 2018, 6, 75216–75228. [Google Scholar] [CrossRef]
  4. Dippner, J.W.; Krncke, I. Ecological forecasting in the presence of abrupt regime shifts. J. Mar. Syst. 2015, 150, 34–40. [Google Scholar] [CrossRef]
  5. Qiao, W.; Yang, Z. Forecast the electricity price of U.S using a wavelet transform-based hybrid model. Energy 2020, 193, 511–530. [Google Scholar] [CrossRef]
  6. Zou, B.; Li, S.; Zheng, Z.; Zhan, F.B.; Yang, Z.; Wan, N. Healthier routes planning: A new method and online implementation for minimizing air pollution exposure risk. Comput. Environ. Urban Syst. 2020, 80, 101456. [Google Scholar] [CrossRef]
  7. Ma, X.; Longley, I.; Gao, J.; Salmond, J. Evaluating the effect of ambient concentrations, route choices, and environmental (in)justice on students dose of ambient no2 while walking to school at population scales. Environ. Sci. Technol. 2020, 54, 12908–12919. [Google Scholar] [CrossRef]
  8. Afghan, F.R.; Patidar, S.K. Health impacts assessment due to PM2.5, PM10 and NO2 exposure in National Capital Territory (NCT) Delhi. Pollution 2020, 6, 115–126. [Google Scholar] [CrossRef]
  9. Sharma, E.; Deo, R.C.; Prasad, R.; Parisi, A.V. A hybrid air quality early-warning framework: An hourly forecasting model with online sequential extreme learning machines and empirical mode decomposition algorithms. Sci. Total Environ. 2020, 709, 135934. [Google Scholar] [CrossRef]
  10. Gualtieri, G.; Carotenuto, F.; Finardi, S.; Tartaglia, M.; Toscano, P.; Gioli, B. Forecasting PM10 hourly concentrations in northern Italy: Insights on models performance and PM10 drivers through self-organizing maps. Atmos. Pollut. Res. 2018, 9, 1204–1213. [Google Scholar] [CrossRef]
  11. Venkataraman, V.; Usmanulla, S.; Sonnappa, A.; Sadashiv, P.; Mohammed, S.S.; Narayanan, S.S. Wavelet and multiple linear regression analysis for identifying factors affecting particulate matter PM2.5 in Mumbai City. India Int. J. Qual. Reliab. Manag. 2019, 36, 1750–1783. [Google Scholar] [CrossRef]
  12. Zhang, L.; Lin, J.; Qiu, R.; Hu, X.; Zhang, H.; Chen, Q.; Tian, H.; Lin, D.; Wang, J. Trend analysis and forecast of PM2.5 in Fuzhou, China using the ARIMA model. Ecol. Indic. 2018, 95, 702–710. [Google Scholar] [CrossRef]
  13. Xiao, Q.; Zeng, Z. Scale-limited lagrange stability and finite-time synchronization for memristive recurrent neural networks on time scales. IEEE Trans. Cybern. 2017, 47, 2984–2994. [Google Scholar] [CrossRef] [PubMed]
  14. Zhu, S.; Yang, Q.; Shen, Y. Noise further expresses exponential decay for globally exponentially stable time-varying delayed neural networks. Neural Netw. 2016, 77, 7–13. [Google Scholar] [CrossRef]
  15. Xayasouk, T.; Lee, H.M.; Lee, G. Air pollution prediction using long short-term memory (LSTM) and Deep Autoencoder (DAE) Models. Sustainability 2020, 12, 2570. [Google Scholar] [CrossRef] [Green Version]
  16. Kouziokas, G.N. SVM kernel based on particle swarm optimized vector and Bayesian optimized SVM in atmospheric particulate matter forecasting. Appl. Soft Comput. J. 2020, 93, 106410. [Google Scholar] [CrossRef]
  17. Zhou, Y.; Chang, F.J.; Chang, L.C.; Kao, I.F.; Wang, Y.S.; Kang, C.C. Multi-output support vector machine for regional multi-step-ahead PM2.5 forecasting. Sci. Total Environ. 2019, 651, 230–240. [Google Scholar] [CrossRef]
  18. Zheng, N.; Luo, M.; Zou, X.; Qiu, X.; Lu, J.; Han, J.; Wang, S.; Wei, Y.; Zhang, S.; Yao, H. A novel method for the recognition of air visibility level based on the optimal binary tree support vector machine. Atmosphere 2018, 9, 481. [Google Scholar] [CrossRef] [Green Version]
  19. Park, S.; Kim, M.; Kim, M.; Namgung, H.G.; Kim, K.T.; Cho, K.H.; Kwon, S.B. Predicting PM 10 concentration in Seoul metropolitan subway stations using artificial neural network (ANN). J. Hazard. Mater. 2018, 341, 75–82. [Google Scholar] [CrossRef]
  20. Mahajan, S.; Liu, H.M.; Tsai, T.C.; Chen, L.J. Improving the accuracy and efficiency of PM2.5 forecast service using cluster-based hybrid neural network model. IEEE Access 2018, 6, 19193–19204. [Google Scholar] [CrossRef]
  21. Jiang, F.; He, J.; Tian, T. A clustering-based ensemble approach with improved pigeon-inspired optimization and extreme learning machine for air quality prediction. Appl. Soft Comput. J. 2019, 85, 105827. [Google Scholar] [CrossRef]
  22. Wang, D.; Liu, Y.; Luo, H.; Yue, C.; Cheng, S. Day-Ahead PM2.5 concentration forecasting using WT-VMD based decomposition method and back propagation neural network improved by differential evolution. Int. J. Environ. Res. Public Health 2017, 14, 764. [Google Scholar] [CrossRef] [PubMed] [Green Version]
  23. Yang, H.; Zhu, Z.; Li, C.; Li, R. A novel combined forecasting system for air pollutants concentration based on fuzzy theory and optimization of aggregation weight. Appl. Soft Comput. J. 2019, 87, 105972. [Google Scholar] [CrossRef]
  24. Huang, N.E.; Shen, Z.; Long, S.R.; Wu, M.C.; Shih, H.H.; Zheng, Q.; Yen, N.C.; Tung, C.C.; Liu, H.H. The empirical mode decomposition and the Hilbert spectrum for nonlinear and non-stationary time series analysis. Proc. R. Soc. A Math. Phys. Eng. Sci. 1998, 454, 903–995. [Google Scholar] [CrossRef]
  25. Wu, Z.; Huang, N.E. Ensemble empirical mode decomposition: A noise-assisted data analysis method. Adv. Adapt. Data Anal. 2009, 1, 1–41. [Google Scholar] [CrossRef]
  26. Torres, M.E.; Colominas, M.A.; Schlotthauer, G.; Flandrin, P. A complete ensemble empirical mode decomposition with adaptive noise. In Proceedings of the IEEE International Conference on Acoustics, Speech and Signal Processing (ICASSP), Prague, Czech Republic, 22–27 May 2011; pp. 4144–4147. [Google Scholar] [CrossRef]
  27. Colominas, M.A.; Schlotthauer, G.; Torres, M.E. Improved complete ensemble EMD: A suitable tool for biomedical signal processing. Biomed. Signal Process. Control 2014, 14, 19–29. [Google Scholar] [CrossRef]
  28. Altuve, M.; Suárez, L.; Ardila, J. Fundamental heart sounds analysis using improved complete ensemble EMD with adaptive noise. Biocybern. Biomed. Eng. 2020, 40, 426–439. [Google Scholar] [CrossRef]
  29. Tascikaraoglu, A.; Sanandaji, B.M.; Poolla, K.; Varaiya, P. Exploiting sparsity of Interconnections inspatio-temporal wind speed forecasting using Wavelet Transform. Appl. Energy 2016, 165, 735–747. [Google Scholar] [CrossRef] [Green Version]
  30. Liu, H.; Mi, X.W.; Li, Y.F. Wind speed forecasting method based on deep learning strategy using empirical wavelet transform, long short term memory neural network and Elman neural network. Energy Convers. Manag. 2018, 156, 498–514. [Google Scholar] [CrossRef]
  31. Richman, J.S.; Moorman, J.R. Physiological time-series analysis using approximate entropy and sample entropy. Am. J. Physiol. Heart Circ. Physiol. 2000, 278, H2039–H2049. [Google Scholar] [CrossRef] [Green Version]
  32. Zhang, Y.; Jin, Z. Group teaching optimization algorithm: A novel metaheuristic method for solving global optimization problems. Expert Syst. Appl. 2020, 148, 113246. [Google Scholar] [CrossRef]
  33. Huang, G.B.; Zhu, Q.Y.; Siew, C.K. Extreme learning machine: Theory and applications. Neurocomputing 2006, 70, 489–501. [Google Scholar] [CrossRef]
  34. Sun, S.; Wang, S.; Zhang, G.; Zheng, J. A decomposition-clustering-ensemble learning approach for solar radiation forecasting. Sol. Energy 2018, 163, 189–199. [Google Scholar] [CrossRef]
  35. Diebold, F.X.; Mariano, R.S. Comparing Predictive Accuracy. J. Bus. Econ. Stat. 2002, 20, 134–144. [Google Scholar] [CrossRef]
Figure 1. The structure of the proposed improvement complementary ensemble empirical mode decomposition with adaptive noise (ICEEMDAN)-wavelet transform (WT)-group teaching optimization algorithm (GTOA)-extreme learning machine (ELM) hybrid approach. For i=1,…,N, IMF(i) is the sub-sequence of the data PM10 and Pm2.5 decomposed by ICEEMDAN.
Atmosphere 12 00064 g001
Figure 2. Original particulate matter (PM10) concentration time series.
Atmosphere 12 00064 g002
Figure 3. Original PM2.5 concentration time series.
Atmosphere 12 00064 g003
Figure 4. Mean absolute error (MAE) of PM10 forecasting.
Atmosphere 12 00064 g004
Figure 5. Mean absolute percentage error (MAPE) of PM10 forecasting.
Atmosphere 12 00064 g005
Figure 6. Normalized root mean square error (NRMSE) of PM10 forecasting.
Atmosphere 12 00064 g006
Figure 7. Theil’s coefficient (TIC) of PM10 forecasting.
Atmosphere 12 00064 g007
Figure 8. Direction statistics (Ds) of PM10 forecasting.
Atmosphere 12 00064 g008
Figure 9. MAE of PM2.5 forecasting.
Atmosphere 12 00064 g009
Figure 10. MAE of PM2.5 forecasting.
Atmosphere 12 00064 g010
Figure 11. NRMSE of PM2.5 forecasting.
Atmosphere 12 00064 g011
Figure 12. TIC of PM2.5 forecasting.
Atmosphere 12 00064 g012
Figure 13. Ds of PM2.5 forecasting.
Atmosphere 12 00064 g013
Table 1. DM test results of one-step ahead forecasting of PM10.
Tested Model Benchmark Model
ICEEMDAN-GTOA
-ELM
ICEEMDAN-
ELM
WT-GTOA-
ELM
WT-ELMGTOA-ELMDE-ELMELM
ICEEMDAN-WT
-GTOA-ELM
−3.5039−6.7207−6.0325−3.5972−6.5332−7.4301−8.6697
(0.0005)(0.0000)(0.0000)(0.0003)(0.0000)(0.0000)(0.0000)
ICEEMDAN-
GTOA-ELM
−3.8489−1.4691−3.0902−6.1659−7.0459−8.4643
(0.0001)(0.1420)(0.0020)(0.0000)(0.0000)(0.0000)
ICEEMDAN-ELM 0.9991−2.6930−5.8667−6.7564−8.1801
(0.3179)(0.0071)(0.0000)(0.0000)(0.0000)
WT-GTOA-ELM −3.0345−6.2075−7.0796−8.4683
(0.0024)(0.0000)(0.0000)(0.0000)
WT-ELM −4.1550−4.6741−7.2905
(0.0000)(0.0000)(0.0000)
GTOA-ELM −2.1288−8.1789
(0.0334)(0.0000)
DE-ELM −6.7950
(0.0000)
Table 2. DM test results of two-step ahead forecasting of PM10.
Tested Model Benchmark Model
ICEEMDAN-GTOA
-ELM
ICEEMDAN-
ELM
WT-GTOA-
ELM
WT-ELMGTOA-ELMDE-ELMELM
ICEEMDAN-WT
-GTOA-ELM
−3.6835−5.7928−3.9237−5.1016−5.7343−5.9685−6.1007
(0.0001)(0.0000)(0.0000)(0.0000)(0.0000)(0.0000)(0.0000)
ICEEMDAN-
GTOA-ELM
−5.5713−2.2100−3.3500−5.7349−5.9697−6.1089
(0.0000)(0.0136)(0.0004)(0.0000)(0.0000)(0.0000)
ICEEMDAN-ELM 0.6430−0.4859−5.2907−5.5537−5.7128
(0.7399)(0.3135)(0.0000)(0.0000)(0.0000)
WT-GTOA-ELM −1.1973−5.1684−5.4130−5.5706
(0.1156)(0.0000)(0.0000)(0.0000)
WT-ELM −4.9211−5.1515−5.2924
(0.0000)(0.0000)(0.0000)
GTOA-ELM −1.9304−1.8217
(0.0268)(0.0342)
DE-ELM −1.0706
(0.1422)
Table 3. DM test results of three-step ahead forecasting of PM10.
Tested ModelBenchmark Model
ICEEMDAN-GTOA
-ELM
ICEEMDAN-
ELM
WT-GTOA-
ELM
WT-ELMGTOA-ELMDE-ELMELM
ICEEMDAN-WT
-GTOA-ELM
−2.2889−4.9527−2.6244−4.1650−5.5552−5.8006−5.3671
(0.0110)(0.0000)(0.0000)(0.0000)(0.0000)(0.0000)(0.0000)
ICEEMDAN-
GTOA-ELM
−5.0106−1.9315−3.7159−5.5881−5.8494−5.4298
(0.0000)(0.0267)(0.0001)(0.0000)(0.0000)(0.0000)
ICEEMDAN-ELM 0.5495−1.2349−5.2393−5.4961−5.1462
(0.7087)(0.1084)(0.0000)(0.0000)(0.0000)
WT-GTOA-ELM −2.3284−4.9138−5.1012−4.8171
(0.0099)(0.0000)(0.0000)(0.0000)
WT-ELM −4.8673−5.0693−4.7804
(0.0000)(0.0000)(0.0000)
GTOA-ELM 0.0113−2.1057
(0.5045)(0.0176)
DE-ELM −2.3641
(0.0090)
Table 4. Forecasting error of PM2.5 concentration.
Multistep Ahead ModelMAE
(μg/m3)
MAPE
(%)
NRMSETICDs
(%)
One-step aheadELM4.4019.6116.270.0762.49
GTOA-ELM3.4013.2413.540.0668.00
DE-ELM3.8215.0314.760.0656.98
WT-ELM1.716.716.620.0389.17
WT-GTOA-ELM1.264.784.950.0293.71
ICEEMDAN-ELM1.114.334.030.0294.00
ICEEMDAN-GTOA-ELM0.602.352.420.0198.10
ICEEMDAN-WT-GTOA-ELM0.491.861.900.0198.88
Two-step aheadELM6.6925.7527.210.1149.54
GTOA-ELM5.5620.4323.520.1052.07
DE-ELM5.7221.3823.740.1048.07
WT-ELM2.9111.1311.000.0580.23
WT -GTOA-ELM2.489.339.420.0483.89
ICEEMDAN-ELM1.977.597.770.0385.46
ICEEMDAN-GTOA-ELM1.314.875.250.0292.92
ICEEMDAN-WT-GTOA-ELM1.134.314.310.0294.39
Three-step aheadELM8.9137.2334.620.1448.24
GTOA-ELM7.6628.5931.410.1347.61
DE-ELM7.9932.8032.180.1346.92
WT -ELM4.1015.4515.450.0674.17
WT -GTOA-ELM3.5713.5213.630.0677.64
ICEEMDAN-ELM2.8310.8411.410.0578.17
ICEEMDAN-GTOA-ELM1.425.396.010.0392.92
ICEEMDAN-WT-GTOA-ELM1.325.115.410.0293.51
Table 5. DM test results of one-step ahead forecasting of PM2.5.
Tested ModelBenchmark Model
ICEEMDAN-GTOA
-ELM
ICEEMDAN
-ELM
WT-GTOA
-ELM
WT-ELMGTOA-ELMDE-ELMELM
ICEEMDAN-WT
-GTOA-ELM
−2.7175−13.5408−10.7244−10.3035−10.2518−12.9119−11.8119
(0.0066)(0.0000)(0.0000)(0.0000)(0.0000)(0.0000)(0.0000)
ICEEMDAN-
GTOA-ELM
−9.3974−8.6997−9.2922−10.1336−12.7361−11.6786
(0.0000)(0.0000)(0.0000)(0.0000)(0.0000)(0.0000)
ICEEMDAN-ELM −4.0939−6.7991−9.6258−12.2484−11.2595
(0.0000)(0.0000)(0.0000)(0.0000)(0.0000)
WT-GTOA-ELM −6.3891−9.4224−12.0698−11.2966
(0.0000)(0.0000)(0.0000)(0.0000)
WT-ELM −9.0503−11.5472−11.4579
(0.0000)(0.0000)(0.0000)
GTOA-ELM −4.5612−6.2942
(0.0000)(0.0000)
DE-ELM −3.0523
(0.0023)
Table 6. DM test results of two-step ahead forecasting of PM2.5.
Tested Model Benchmark Model
ICEEMDAN-GTOA
-ELM
ICEEMDAN
-ELM
WT-GTOA
-ELM
WT-ELMGTOA-ELMDE-ELMELM
ICEEMDAN-WT
-GTOA-ELM
−7.2714−8.5699−15.3825−14.6345−10.2056−10.5647−11.1624
(0.0000)(0.0000)(0.0000)(0.0000)(0.0000)(0.0000)(0.0000)
ICEEMDAN-
GTOA-ELM
−8.0793−13.4719−13.5744−10.1615−10.5384−11.1396
(0.0000)(0.0000)(0.0000)(0.0000)(0.0000)(0.0000)
ICEEMDAN-ELM −4.4998−7.8214−10.0408−10.4871−11.0846
(0.0000)(0.0000)(0.0000)(0.0000)(0.0000)
WT-GTOA-ELM −6.7670−8.9025−9.2585−10.1599
(0.0000)(0.0000)(0.0000)(0.0000)
WT-ELM −8.3488−8.6986−9.7565
(0.0000)(0.0000)(0.0000)
GTOA-ELM −0.7343−5.8911
(0.2314)(0.0000)
DE-ELM −6.8786
(0.0000)
Table 7. DM test results of three-step ahead forecasting of PM2.5.
Tested Model Benchmark Model
ICEEMDAN-GTOA
-ELM
ICEEMDAN
-ELM
WT-GTOA
-ELM
WT-ELMGTOA-ELMDE-ELMELM
ICEEMDAN-WT
-GTOA-ELM
−5.9385−8.8548−15.2023−15.8871−11.1402−10.9329−12.4082
(0.0000)(0.0000)(0.0000)(0.0000)(0.0000)(0.0000)(0.0000)
ICEEMDAN-
GTOA-ELM
−8.4679−14.6155−15.4375−11.0997−10.8851−12.3653
(0.0000)(0.0000)(0.0000)(0.0000)(0.0000)(0.0000)
ICEEMDAN-ELM −4.0254−7.7477−11.1172−10.8874−12.3892
(0.0000)(0.0000)(0.0000)(0.0000)(0.0000)
WT-GTOA-ELM −5.8209−9.5422−9.4834−11.0517
(0.0000)(0.0000)(0.0000)(0.0000)
WT-ELM −9.0141−9.0406−10.5554
(0.0000)(0.0000)(0.0000)
GTOA-ELM −2.1974−5.3503
(0.0140)(0.0000)
DE-ELM −5.2124
(0.0000)
Publisher’s Note: MDPI stays neutral with regard to jurisdictional claims in published maps and institutional affiliations.

