Spatial Analysis (Measurements at Heights of 10 m and 20 m above Ground Level) of the Concentrations of Particulate Matter (PM10, PM2.5, and PM1.0) and Gaseous Pollutants (H2S) on the University Campus: A Case Study


Abstract
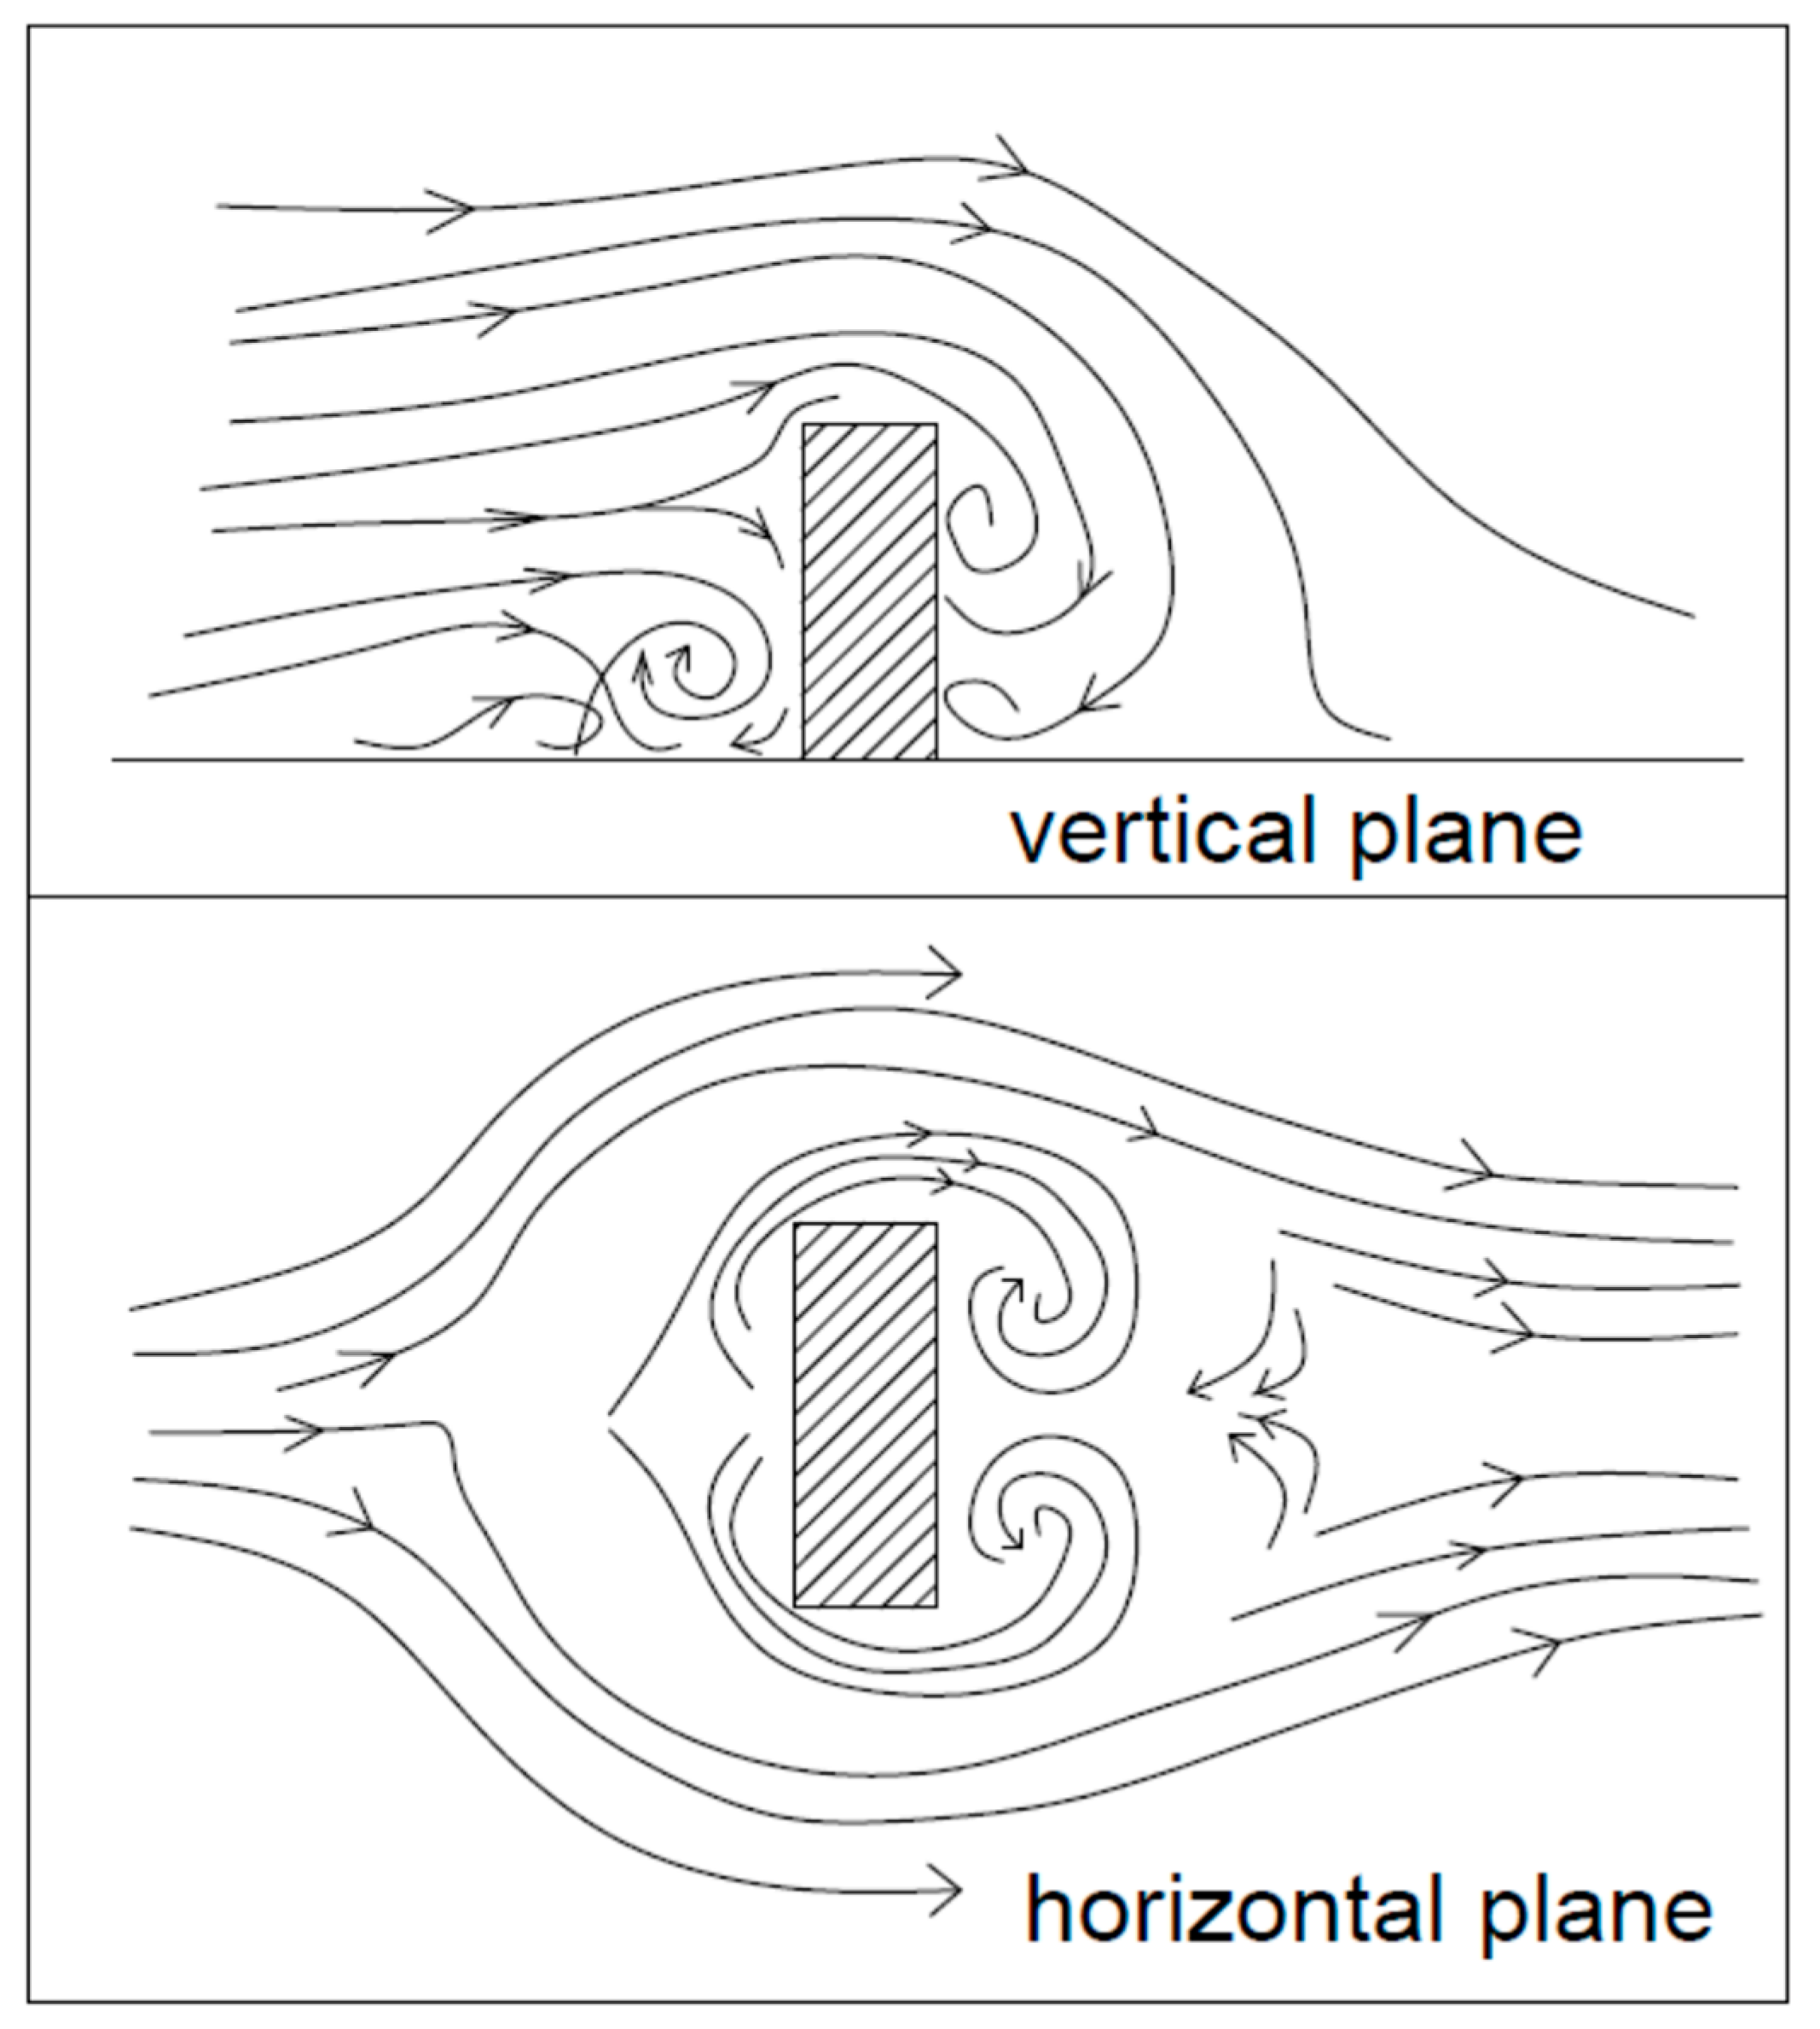
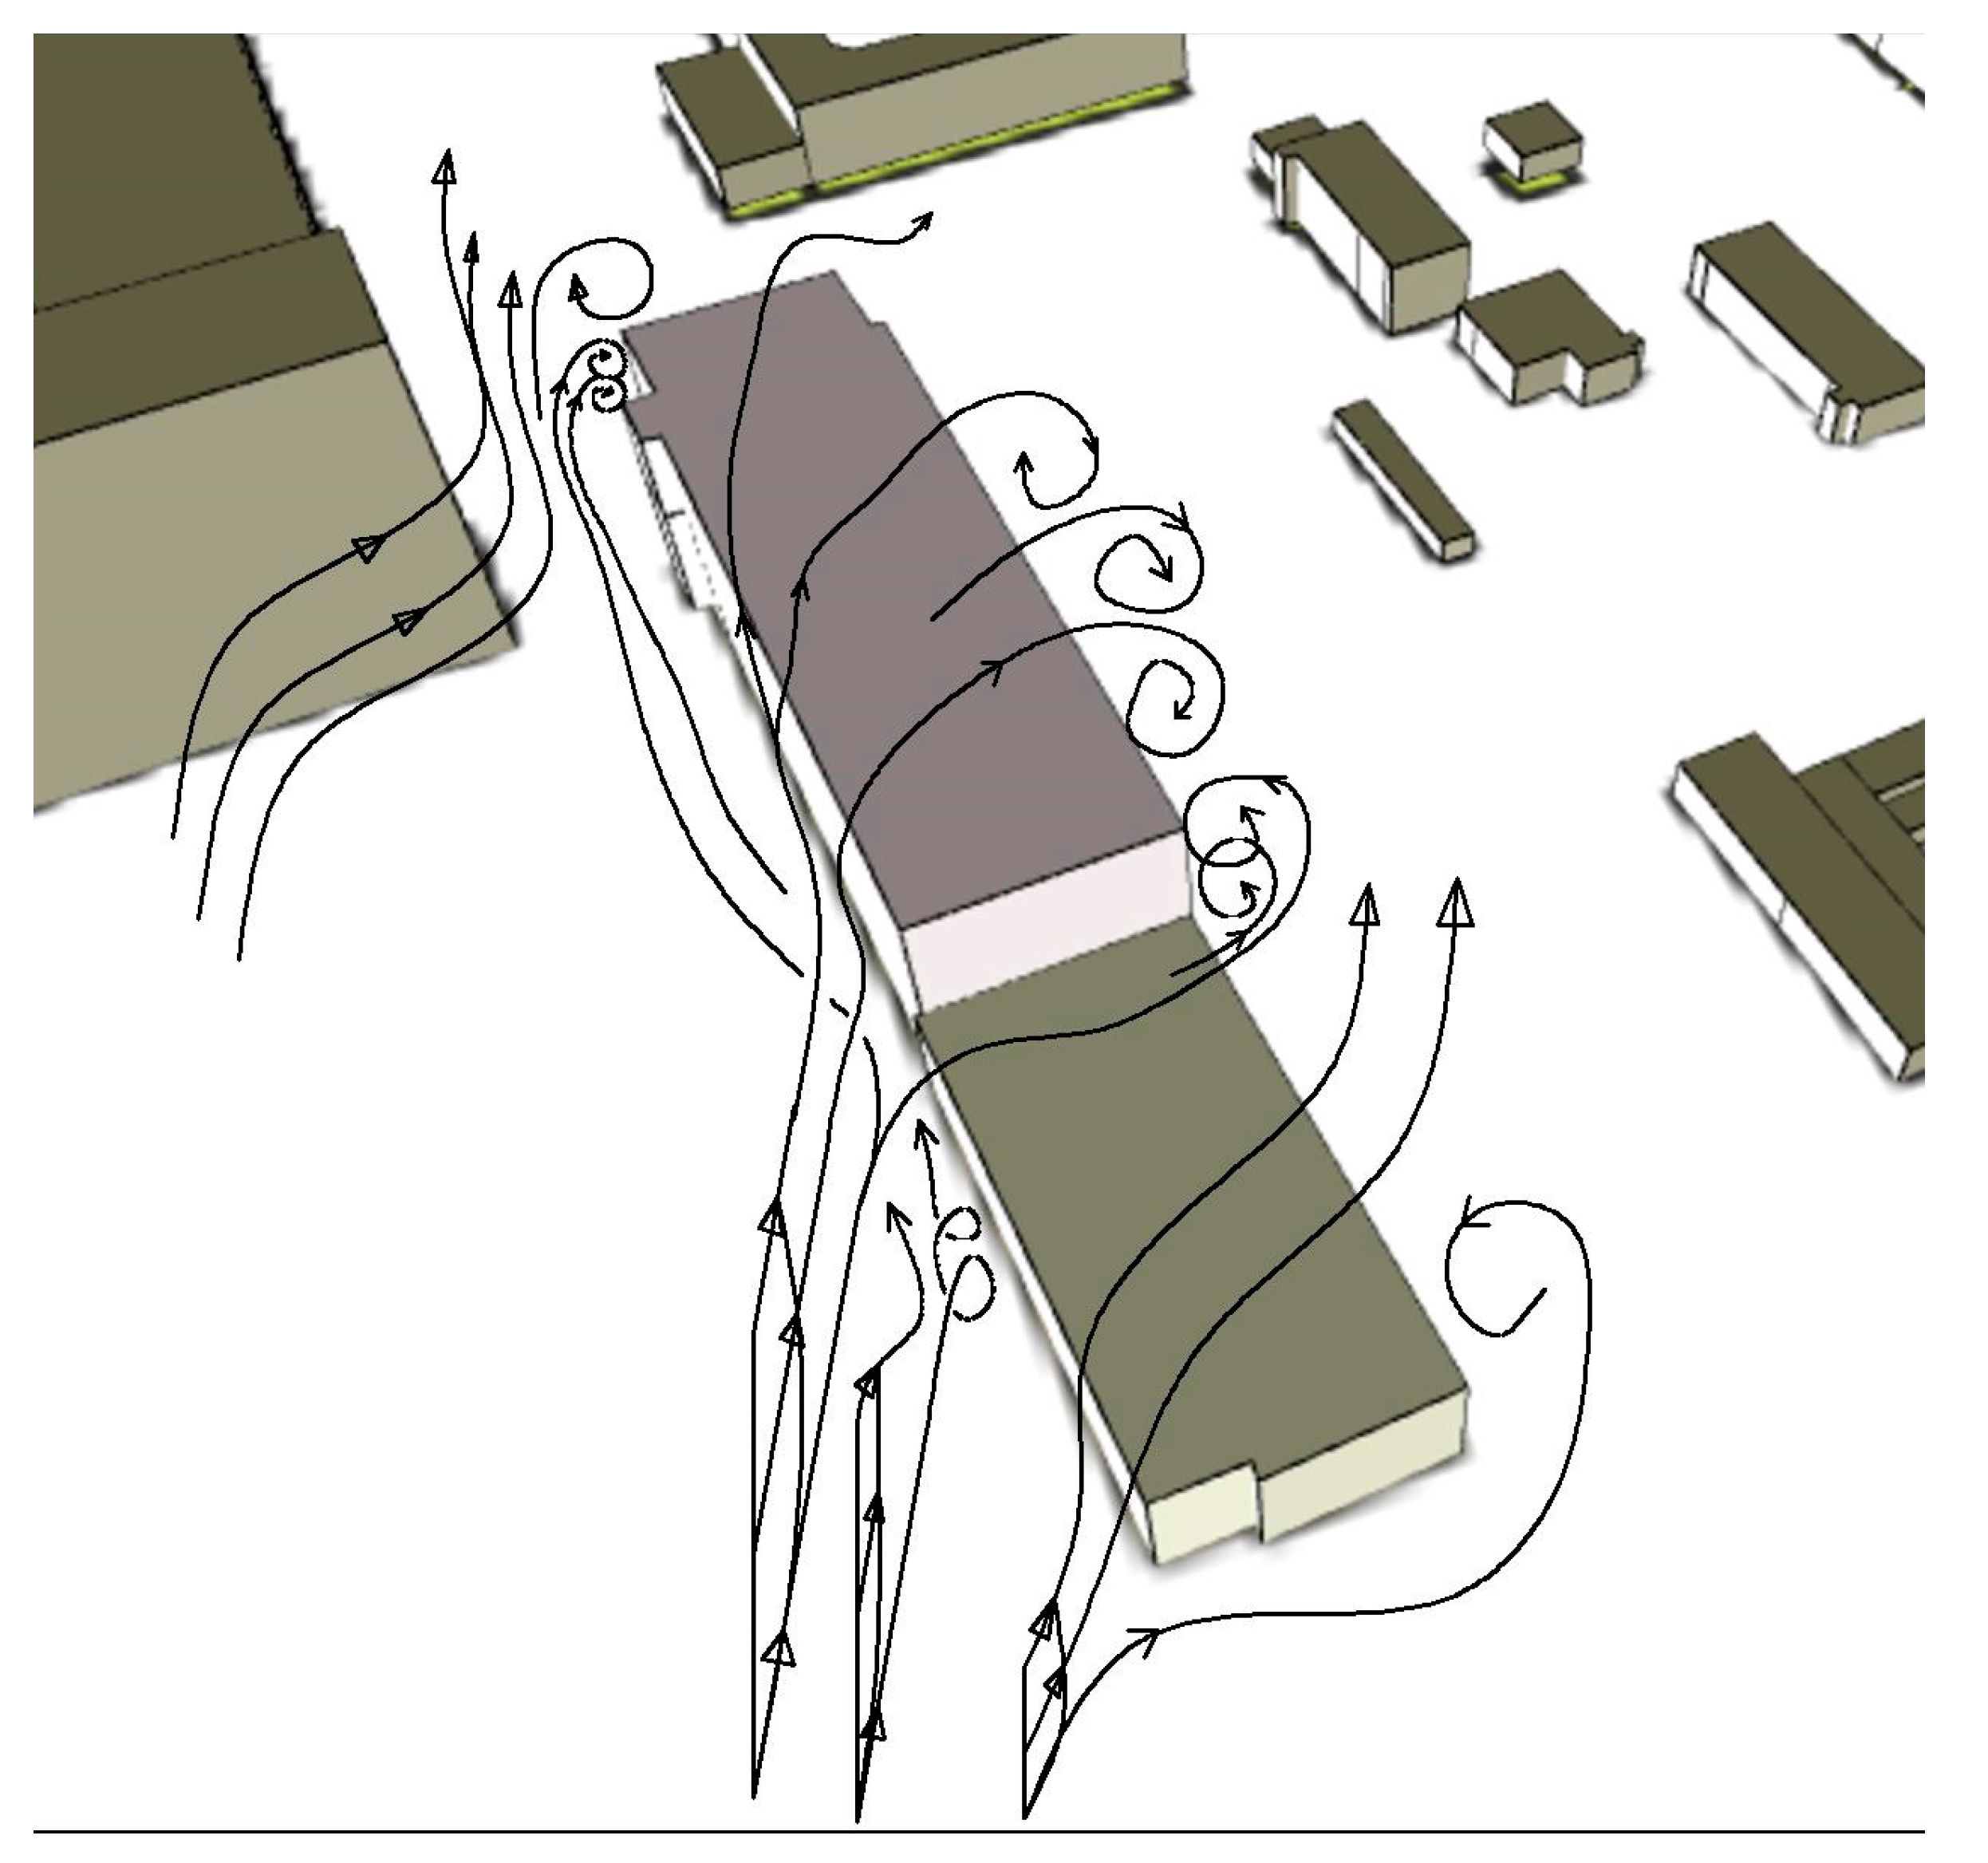
1. Introduction
2. Materials and Methods
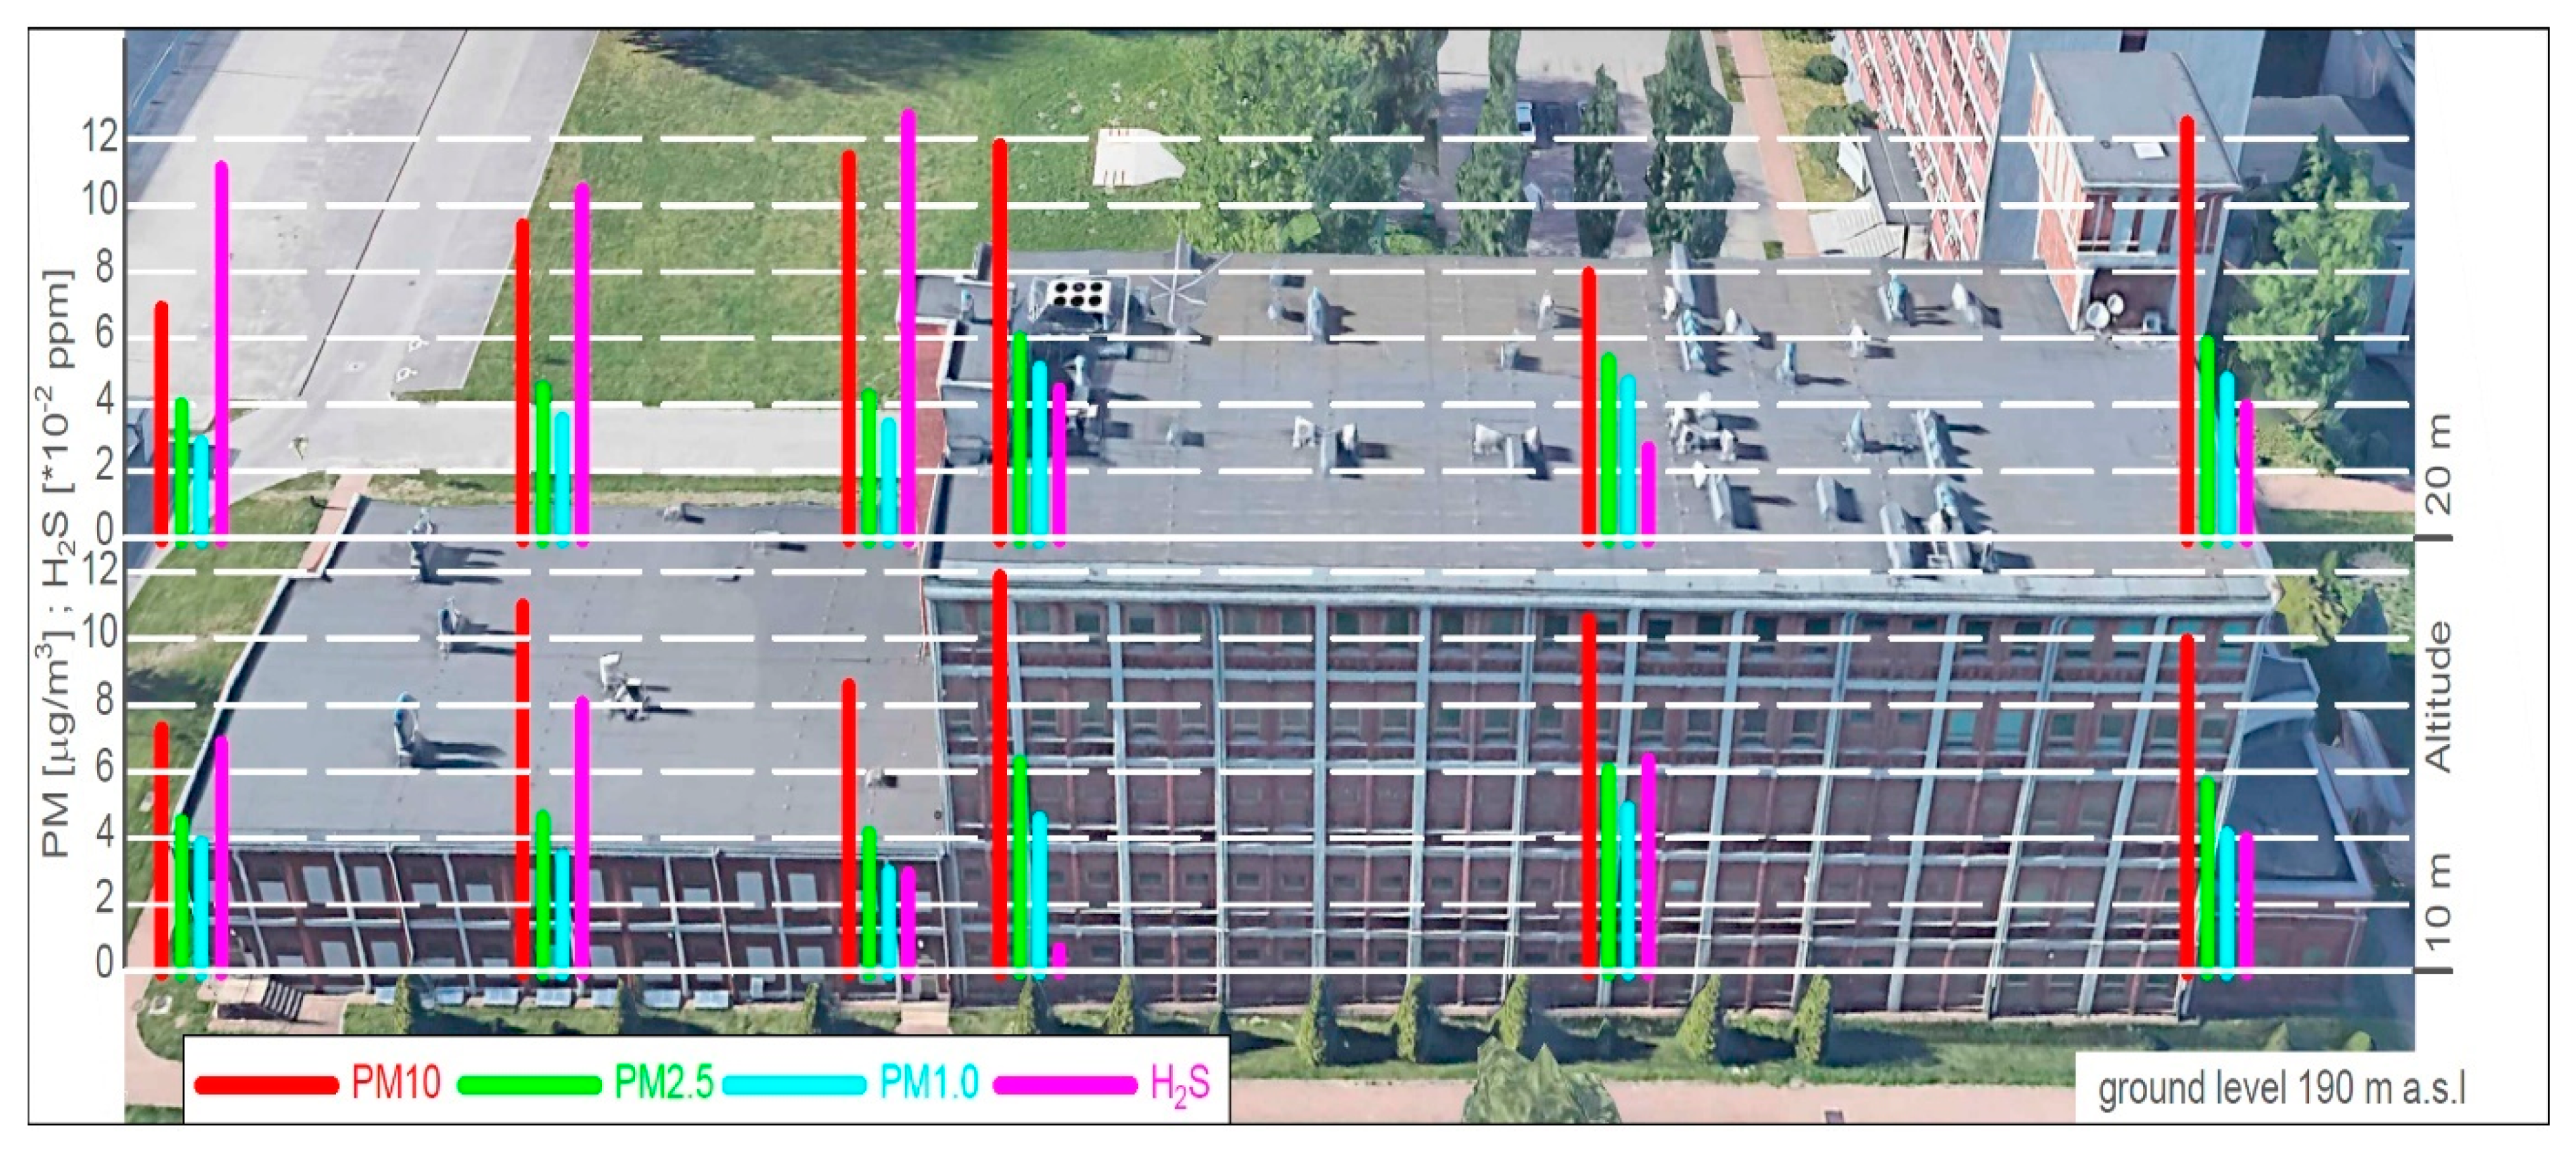
2.1. Measuring Apparatus and Sampling Location
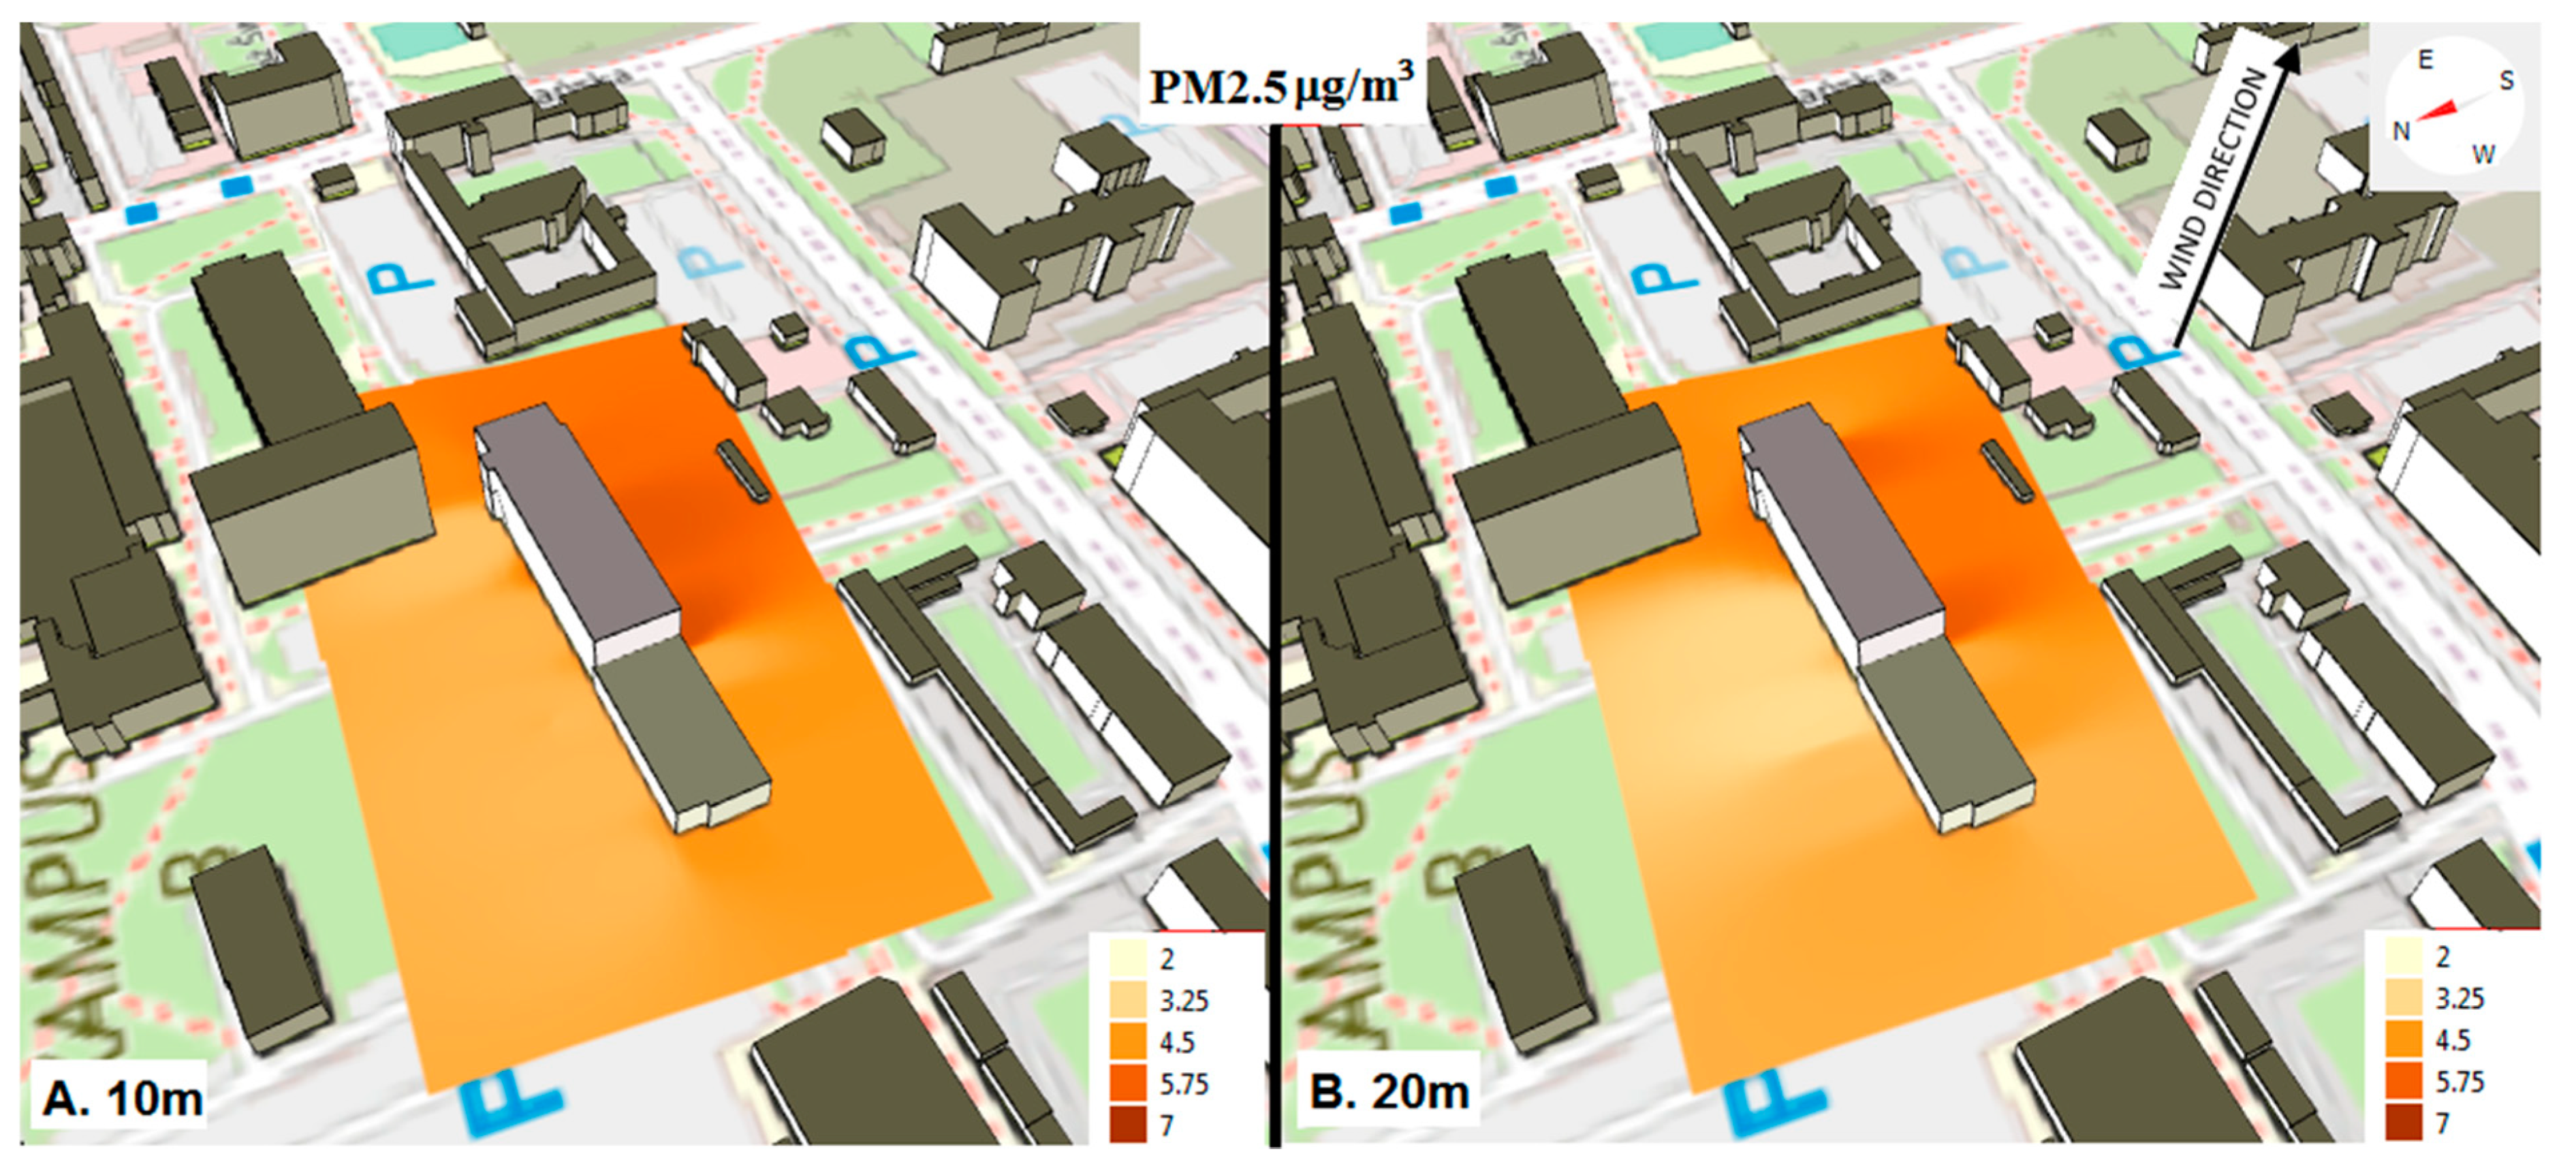
2.2. Spatial Method of Analyzing the Results
2.3. Meteorological Data of Measurements
3. Results and Discussions
4. Conclusions
Author Contributions
Funding
Institutional Review Board Statement
Informed Consent Statement
Data Availability Statement
Conflicts of Interest
References
- World Health Organization. Review of Evidence on Health Aspects of Air Pollution—REVIHAAP Project Retrieved from. World Health Organization 309. 2013. Available online: http://www.euro.who.int/en/health-topics/environment-and-health/air-quality/publications/2013/review-of-evidence-on-health-aspects-of-air-pollution-revihaap-project-finaltechnical-report (accessed on 18 November 2020).
- Cichowicz, R.; Stelęgowski, A. Average Hourly Concentrations of Air Contaminants in Selected Urban, Town, and Rural Sites. Arch. Environ. Contam. Toxicol. 2019, 77, 197–213. [Google Scholar] [CrossRef] [PubMed]
- Cichowicz, R.; Wielgosiński, G. Analysis of Variations in Air Pollution Fields in Selected Cities in Poland and Germany. Ecol. Chem. Eng. 2018, 25, 217–227. [Google Scholar] [CrossRef]
- Cichowicz, R.; Wielgosiński, G.; Fetter, W. Effect of wind speed on the level of particulate matter PM10 concentration in atmospheric air during winter season in vicinity of large combustion plant. J. Atmos. Chem. 2020, 77, 35–48. [Google Scholar] [CrossRef]
- Gao, J.; Wang, K.; Wang, Y.; Liu, S.; Zhu, C.; Hao, J.; Liu, H.; Hua, S.; Tian, H. Temporal-spatial characteristics and source apportionment of PM2.5 as well as its associated chemical species in the Beijing-Tianjin-Hebei region of China. Environ. Pollut. 2018, 233, 714–724. [Google Scholar] [CrossRef] [PubMed]
- Ma, H.; Sun, W.; Wang, S.; Kang, L. Structural contribution and scenario simulation of highway passenger transit carbon emissions in the Beijing-Tianjin-Hebei metropolitan region, China. Resour. Conserv. Recycl. 2019, 140, 209–215. [Google Scholar] [CrossRef]
- Meng, M.; Zhou, J. Has air pollution emission level in the Beijing–Tianjin–Hebei region peaked? A panel data analysis. Ecol. Indic. 2020, 119, 106875. [Google Scholar] [CrossRef] [PubMed]
- Edginton, S.; O’Sullivan, D.E.; King, W.D.; Lougheed, M.D. The effect of acute outdoor air pollution on peak expiratory flow in individuals with asthma: A systematic review and meta-analysis. Environ. Res. 2021, 192, 110296. [Google Scholar] [CrossRef] [PubMed]
- Liu, N.; Liu, X.; Jayaratne, R.; Morawska, L. A study on extending the use of air quality monitor data via deep learning techniques. J. Clean. Prod. 2020, 274, 122956. [Google Scholar] [CrossRef]
- Moreno-Silva, C.; Calvo, D.; Torres, N.; Ayala, L.; Gaitán, M.; González, L.; Rincón, P.; Susa, M.R. Hydrogen sulphide emissions and dispersion modelling from a wastewater reservoir using flux chamber measurements and AERMOD® simulations. Atmos. Environ. 2020, 224, 117263. [Google Scholar] [CrossRef]
- Dey, S.; Di Girolamo, L.; Van Donkelaar, A.; Tripathi, S.; Gupta, T.; Mohan, M. Variability of outdoor fine particulate (PM2.5) concentration in the Indian Subcontinent: A remote sensing approach. Remote. Sens. Environ. 2012, 127, 153–161. [Google Scholar] [CrossRef]
- Pope, C.A.; Burnett, R.; Thun, M.J.; Calle, E.E.; Krewskik, D.; Ito, K.; Thurston, G.D. Lung cancer, cardiopulmonary mortality, and long term exposure to fine particulate air pollution. J. Am. Med. Assoc. 2002, 287, 1132–1141. [Google Scholar] [CrossRef] [PubMed]
- Aventaggiato, L.; Colucci, A.P.; Strisciullo, G.; Favalli, F.; Gagliano-Candela, R. Lethal Hydrogen Sulfide poisoning in open space: An atypical case of asphyxiation of two workers. Forensic Sci. Int. 2020, 308, 110122. [Google Scholar] [CrossRef] [PubMed]
- Fujita, Y.; Fujino, Y.; Onodera, M.; Kikuchi, S.; Kikkawa, T.; Inoue, Y.; Niitsu, H.; Takahashi, K.; Endo, S. A fatal case of acute hydrogen sulfide poisoning caused by hydrogen sulfide: Hydroxocobalamin therapy for acute hydrogen sulfide poisoning. J. Anal. Toxicol. 2011, 35, 119–123. [Google Scholar] [CrossRef] [PubMed]
- Stetkiewicz, J. Siarkowodór. Dokumentacja dopuszczalnych wielkości narażenia zawodowego. Podstawy Metod. Oceny Sr. Pr. 2011, 4, 97–117. [Google Scholar]
- Hosker, R.P. Flow around isolated structures and building clusters, a review. ASHRAE Trans. 1985, 91, 1672–1692. [Google Scholar]
- Lateb, M.; Meroney, R.N.; Yataghene, M.; Fellouah, H.; Saleh, F.; Boufadel, M.C. On the use of numerical modelling for near-field pollutant dispersion in urban environments—A review. Environ. Pollut. 2016, 208, 271–283. [Google Scholar] [CrossRef]
- Pesic, D.; Zigar, D.; Anghel, I.; Glisovic, S. Large Eddy Simulation of wind flow impact on fire-induced indoor and outdoor air pollution in an idealized street canyon. J. Wind. Eng. Ind. Aerodyn. 2016, 155, 89–99. [Google Scholar] [CrossRef]
- Jiang, F.; Li, Z.; Zhao, Q.; Tao, Q.; Yuan, Y.; Lu, S. Flow field around a surface-mounted cubic building with louver blinds. Build. Simul. 2018, 12, 141–151. [Google Scholar] [CrossRef]
- Kikumoto, H.; Ooka, R. A numerical study of air pollutant dispersion with bimolecular chemical reactions in an urban street canyon using large-eddy simulation. Atmos. Environ. 2012, 54, 456–464. [Google Scholar] [CrossRef]
- Murena, F.; Mele, B. Effect of short–time variations of wind velocity on mass transfer rate between street canyons and the atmospheric boundary layer. Atmos. Pollut. Res. 2014, 5, 484–490. [Google Scholar] [CrossRef]
- Zhang, Y.; Kwok, K.; Liu, X.-P.; Niu, J.-L. Characteristics of air pollutant dispersion around a high-rise building. Environ. Pollut. 2015, 204, 280–288. [Google Scholar] [CrossRef] [PubMed]
- Galatioto, F.; Bell, M. Exploring the processes governing roadside pollutant concentrations in urban street canyon. Environ. Sci. Pollut. Res. 2013, 20, 4750–4765. [Google Scholar] [CrossRef] [PubMed]
- Rakowska, A.; Wong, K.C.; Townsend, T.; Chan, K.L.; Westerdahl, D.; Ng, S.; Močnik, G.; Drinovec, L.; Ning, Z. Impact of traffic volume and composition on the air quality and pedestrian exposure in urban street canyon. Atmos. Environ. 2014, 98, 260–270. [Google Scholar] [CrossRef]
- Zwack, L.M.; Paciorek, C.J.; Spengler, J.D.; Levy, J.I. Characterizing local traffic contributions to particulate air pollution in street canyons using mobile monitoring techniques. Atmos. Environ. 2011, 45, 2507–2514. [Google Scholar] [CrossRef]
- Lima, A.; De Vivo, B.; Cicchella, D.; Cortini, M.; Albanese, S. Multifractal IDW interpolation and fractal filtering method in environmental studies: An application on regional stream sediments of (Italy), Campania region. Appl. Geochem. 2003, 18, 1853–1865. [Google Scholar] [CrossRef]
- Singh, P.; Verma, P. A Comparative Study of Spatial Interpolation Technique (IDW and Kriging) for Determining Ground Water Quality. In GIS and Geostatistical Techniques for Groundwater Science; Elsevier: Amsterdam, The Netherlands, 2019; pp. 43–56. [Google Scholar]
- Weather Central District. Available online: www.meteoblue.com (accessed on 21 August 2020).
- Blocken, B.; Stathopoulos, T.; Carmeliet, J.J.; Hensen, J.L. Application of computational fluid dynamics in building performance simulation for the outdoor environment: An overview. J. Build. Perform. Simul. 2011, 4, 157–184. [Google Scholar] [CrossRef]
- Kourtidis, K.; Kelesis, A.; Petrakakis, M. Hydrogen sulfide (H2S) in urban ambient air. Atmos. Environ. 2008, 42, 7476–7482. [Google Scholar] [CrossRef]
- Pallarés, S.; Gómez, E.; Martínez, A.; Jordan, M. The relationship between indoor and outdoor levels of PM10 and its chemical composition at schools in a coastal region in Spain. Heliyon 2019, 5, e02270. [Google Scholar] [CrossRef]
- Zwoździak, A.; Sówka, I.; Krupińska, B.; Zwoździak, B.; Nych, A. Infiltration or indoor sources as determinants of the elemental composition of particulate matter inside a school in Wroc1aw, Poland? Build. Environ. 2013, 66, 173–180. [Google Scholar] [CrossRef]


| Date: 20 August 2020 | 24 h | 9:00 AM–11:00 AM | |||||
|---|---|---|---|---|---|---|---|
| Parameters | Unit | Min | Max | Average | Min | Max | Average |
| Temperature (2 m above gnd) | °C | 15.82 | 26.88 | 22.10 | 20.51 | 23.04 | 21.77 |
| Relative Humidity (2 m above gnd) | % | 29 | 89 | 54.42 | 58 | 72 | 65 |
| Total Precipitation (high resolution) (sfc) | mm | 0 | 0 | 0 | 0 | 0 | 0 |
| Total Cloud Cover | % | 0 | 49 | 8.7 | 3.9 | 10 | 7.97 |
| Wind Speed (10 m above gnd) | km/h | 2.10 | 15.07 | 9.33 | 10.18 | 10.80 | 10.50 |
| Wind Direction (10 m above gnd) | - | 295.11 | 343.30 | 318.44 | 306.87 | 321.95 | 314.61 |
| Wind Direction (10 m above gnd) | - | - | - | NW | - | - | NW |
| Altitude | Parameters | PM10 | PM2.5 | PM1.0 | H2S |
|---|---|---|---|---|---|
| 10 m | PM10 | 1 | 0.71 | 0.54 | −0.48 |
| PM2.5 | 0.71 | 1 | 0.91 | −0.72 | |
| PM1.0 | 0.54 | 0.91 | 1 | −0.64 | |
| H2S | −0.48 | −0.72 | −0.64 | 1 | |
| 20 m | PM10 | 1 | 0.77 | 0.72 | −0.45 |
| PM2.5 | 0.77 | 1 | 0h97 | −0.83 | |
| PM1.0 | 0.72 | 0.97 | 1 | −0.81 | |
| H2S | −0.45 | −0.83 | −0.81 | 1 |
| Altitude | Parameters | PM10 | PM2.5 | PM1.0 | H2S |
|---|---|---|---|---|---|
| μg/m3 | ppm | ||||
| 10 m | min | 6.39 | 3.70 | 2.70 | 0.0058 |
| 5-perc | 6.98 | 3.79 | 2.77 | 0.0218 | |
| average | 9.13 | 4.60 | 3.54 | 0.0737 | |
| 95-perc | 11.65 | 6.05 | 4.60 | 0.1270 | |
| max | 11.80 | 6.19 | 4.82 | 0.1309 | |
| 20 m | min | 4.55 | 3.14 | 2.22 | 0.0264 |
| 5-perc | 4.92 | 3.19 | 2.23 | 0.0289 | |
| average | 8.64 | 4.30 | 3.30 | 0.0968 | |
| 95-perc | 11.95 | 5.85 | 4.83 | 0.1325 | |
| max | 12.42 | 5.91 | 5.06 | 0.1338 | |
Publisher’s Note: MDPI stays neutral with regard to jurisdictional claims in published maps and institutional affiliations. |
© 2021 by the authors. Licensee MDPI, Basel, Switzerland. This article is an open access article distributed under the terms and conditions of the Creative Commons Attribution (CC BY) license (http://creativecommons.org/licenses/by/4.0/).
Share and Cite
Cichowicz, R.; Dobrzański, M. Spatial Analysis (Measurements at Heights of 10 m and 20 m above Ground Level) of the Concentrations of Particulate Matter (PM10, PM2.5, and PM1.0) and Gaseous Pollutants (H2S) on the University Campus: A Case Study. Atmosphere 2021, 12, 62. https://doi.org/10.3390/atmos12010062
Cichowicz R, Dobrzański M. Spatial Analysis (Measurements at Heights of 10 m and 20 m above Ground Level) of the Concentrations of Particulate Matter (PM10, PM2.5, and PM1.0) and Gaseous Pollutants (H2S) on the University Campus: A Case Study. Atmosphere. 2021; 12(1):62. https://doi.org/10.3390/atmos12010062
Chicago/Turabian StyleCichowicz, Robert, and Maciej Dobrzański. 2021. "Spatial Analysis (Measurements at Heights of 10 m and 20 m above Ground Level) of the Concentrations of Particulate Matter (PM10, PM2.5, and PM1.0) and Gaseous Pollutants (H2S) on the University Campus: A Case Study" Atmosphere 12, no. 1: 62. https://doi.org/10.3390/atmos12010062
APA StyleCichowicz, R., & Dobrzański, M. (2021). Spatial Analysis (Measurements at Heights of 10 m and 20 m above Ground Level) of the Concentrations of Particulate Matter (PM10, PM2.5, and PM1.0) and Gaseous Pollutants (H2S) on the University Campus: A Case Study. Atmosphere, 12(1), 62. https://doi.org/10.3390/atmos12010062