1. Introduction
Korea has occasionally suffered from serious haze events, which generally consist of various air pollutants accompanied by visibility degradation. The public thinks of air quality as being exacerbated despite its gradual improvement according to the long-term monitoring of most air pollutants in Korea [
1]. The reason is closely associated with visibility that people can identify easily with the naked eye every day since they are more interested in better air quality along with economic growth. Visibility impairment is due to the enhancement of fine particulates, which are largely emitted from local domestic sources and frequently mixed with long-range transported aerosols abroad.
Increases in aerosols are well known to have an influence on clouds and precipitation by modifying cloud microphysics [
2] increased aerosols could suppress the efficacy of droplets coalescence and accretion; and delay precipitation initiation [
3,
4], although the opposite results have been reported for precipitation enhancement by aerosols [
5]. Furthermore, cloud droplets lifted above the freezing level induced by enhanced aerosols might release additional latent heat and accordingly enhance the precipitation intensity by invigorating cloud vertical development [
5,
6] though it still brings about another dispute [
7]. In this regard, we can expect severe hazes accompanied with cloud systems to significantly modify the relevant meteorology including clouds and precipitation.
In China, there have been several recent studies on aerosol–meteorology interactions based on both the observation and modeling studies since China has been suffering frequent severe haze events by virtue of recent rapid industrialization and economic expansion. Zhong et al. [
8,
9] showed aerosol pollution enhanced by radiative cooling effects of increased aerosols, and similar studies demonstrated transported PM
2.5 scattering solar radiation and cooling the surface [
10]. Ding et al. [
11] showed significant weather modification and failure in the prediction of air temperature and rainfall by numerical modeling during a heavy pollution episode in the Pearl River Delta. Additionally, they also analyzed the impact of agricultural burning plumes on the modification of weather in autumn [
11]. Furthermore, Huang and Ding [
12] claimed significant bias and forecast errors in the daily forecast of lower-tropospheric air temperature specifically in the high-polluted regions.
The previous studies showed that long-range transported aerosols could degrade downstream air quality [
13] and delay precipitation at a weaker rate by modifying cloud microphysics such as a decrease in drop size [
4]. Furthermore, Eun et al. [
14] found the dependence of precipitation timing (time and duration) on three different hazes such as light precipitation in company with enhanced aerosol loadings during the long-range transported hazes in comparison with domestic urban hazes when high aerosol concentrations generally tend to be followed by precipitation. Likewise, there is some probable evidence of aerosol impact on precipitations mostly in its temporal and spatial regards rather than precipitation amounts through aerosol–cloud–precipitation interactions [
4].
However, it is hard to identify aerosol–meteorology interactions based on only observations because they are strongly dependent upon each other. For instance, aerosols can be virtually scavenged out by precipitation, although clouds and precipitation could be modified by enhanced aerosols in certain meteorological conditions. Therefore, the complicated interactions of aerosols and precipitation induced by the positive/negative feedback need to be segregated and investigated in an adequate manner based on the right hypothesis.
Basically, we intend to understand aerosol–meteorology interactions by first examining aerosols’ effect on meteorology and in turn meteorology’s effect on aerosols. For this purpose, the analysis is based on a golden episode of the January 2013 severe haze, when unprecedented aerosol loadings lasted largely for a week. A longer lifetime is assumed to play such a strong discernible forcing to be detected in the operational observation framework. This episode has a big advantage in terms of substantial external forcing on the response domain, mainly the mid-Korean peninsula. Aerosol concentrations during the haze period are greater by several factors than the normal condition. Meanwhile, it consists of two regimes; one is a long-range transported haze and the other is an urban haze with a distinct difference in aerosol characteristics, which enables us to examine aerosol-meteorology interactions.
First, we examine meteorological features dominant for different haze classifications in terms of stability, boundary layer height, and boundary wind speed using surface observation and reanalysis data for 2011 to 2016. Afterward, we investigate an episodic analysis of aerosols impact on precipitation during the long-lasting and unprecedented aerosol episode (January 2013 severe haze). Next, we discuss the associated response of the meteorological conditions attributable to the clouds and precipitation modification by aerosol external forcing. The analysis is limited to mainly the period of 10 to 18 January 2013.
The basic hypothesis is that aerosol imports from abroad could modify the cloud and precipitation in the mid-Korean peninsula, a response domain, and accordingly change environmental conditions, such as static stability, mixing depth, etc. Secondly, severe haze episodes could be maintained longer and even exacerbated by stronger stability intensified by aerosol–cloud interactions. It is important for the monitoring and forecast of fine particles that this kind of stability change might intensify the severe haze by suppressing ventilation and dispersion of atmospheric aerosols.
The selected severe haze period (10–18 January 2013) is such a great episode that lasts more than one week and daily average PM2.5 mass concentration reached 150 μg m−3 with the maximum of aerosol light scattering coefficient, 800 Mm−1. Additionally, the serious haze had occurred a couple of days before in the Beijing area, China, with PM2.5 concentrations exceeding 600 μg m−3. This episode would provide us with a better testbed to examine enhanced aerosol impacts on meteorology and, in turn, the modified meteorology impacts on aerosols. Furthermore, this kind of intensive analysis on the special episode would contribute to enlightening aerosol–cloud–precipitation interactions and further improving both short-term weather and fine particle forecasts especially on the polluted days.
2. Method and Data
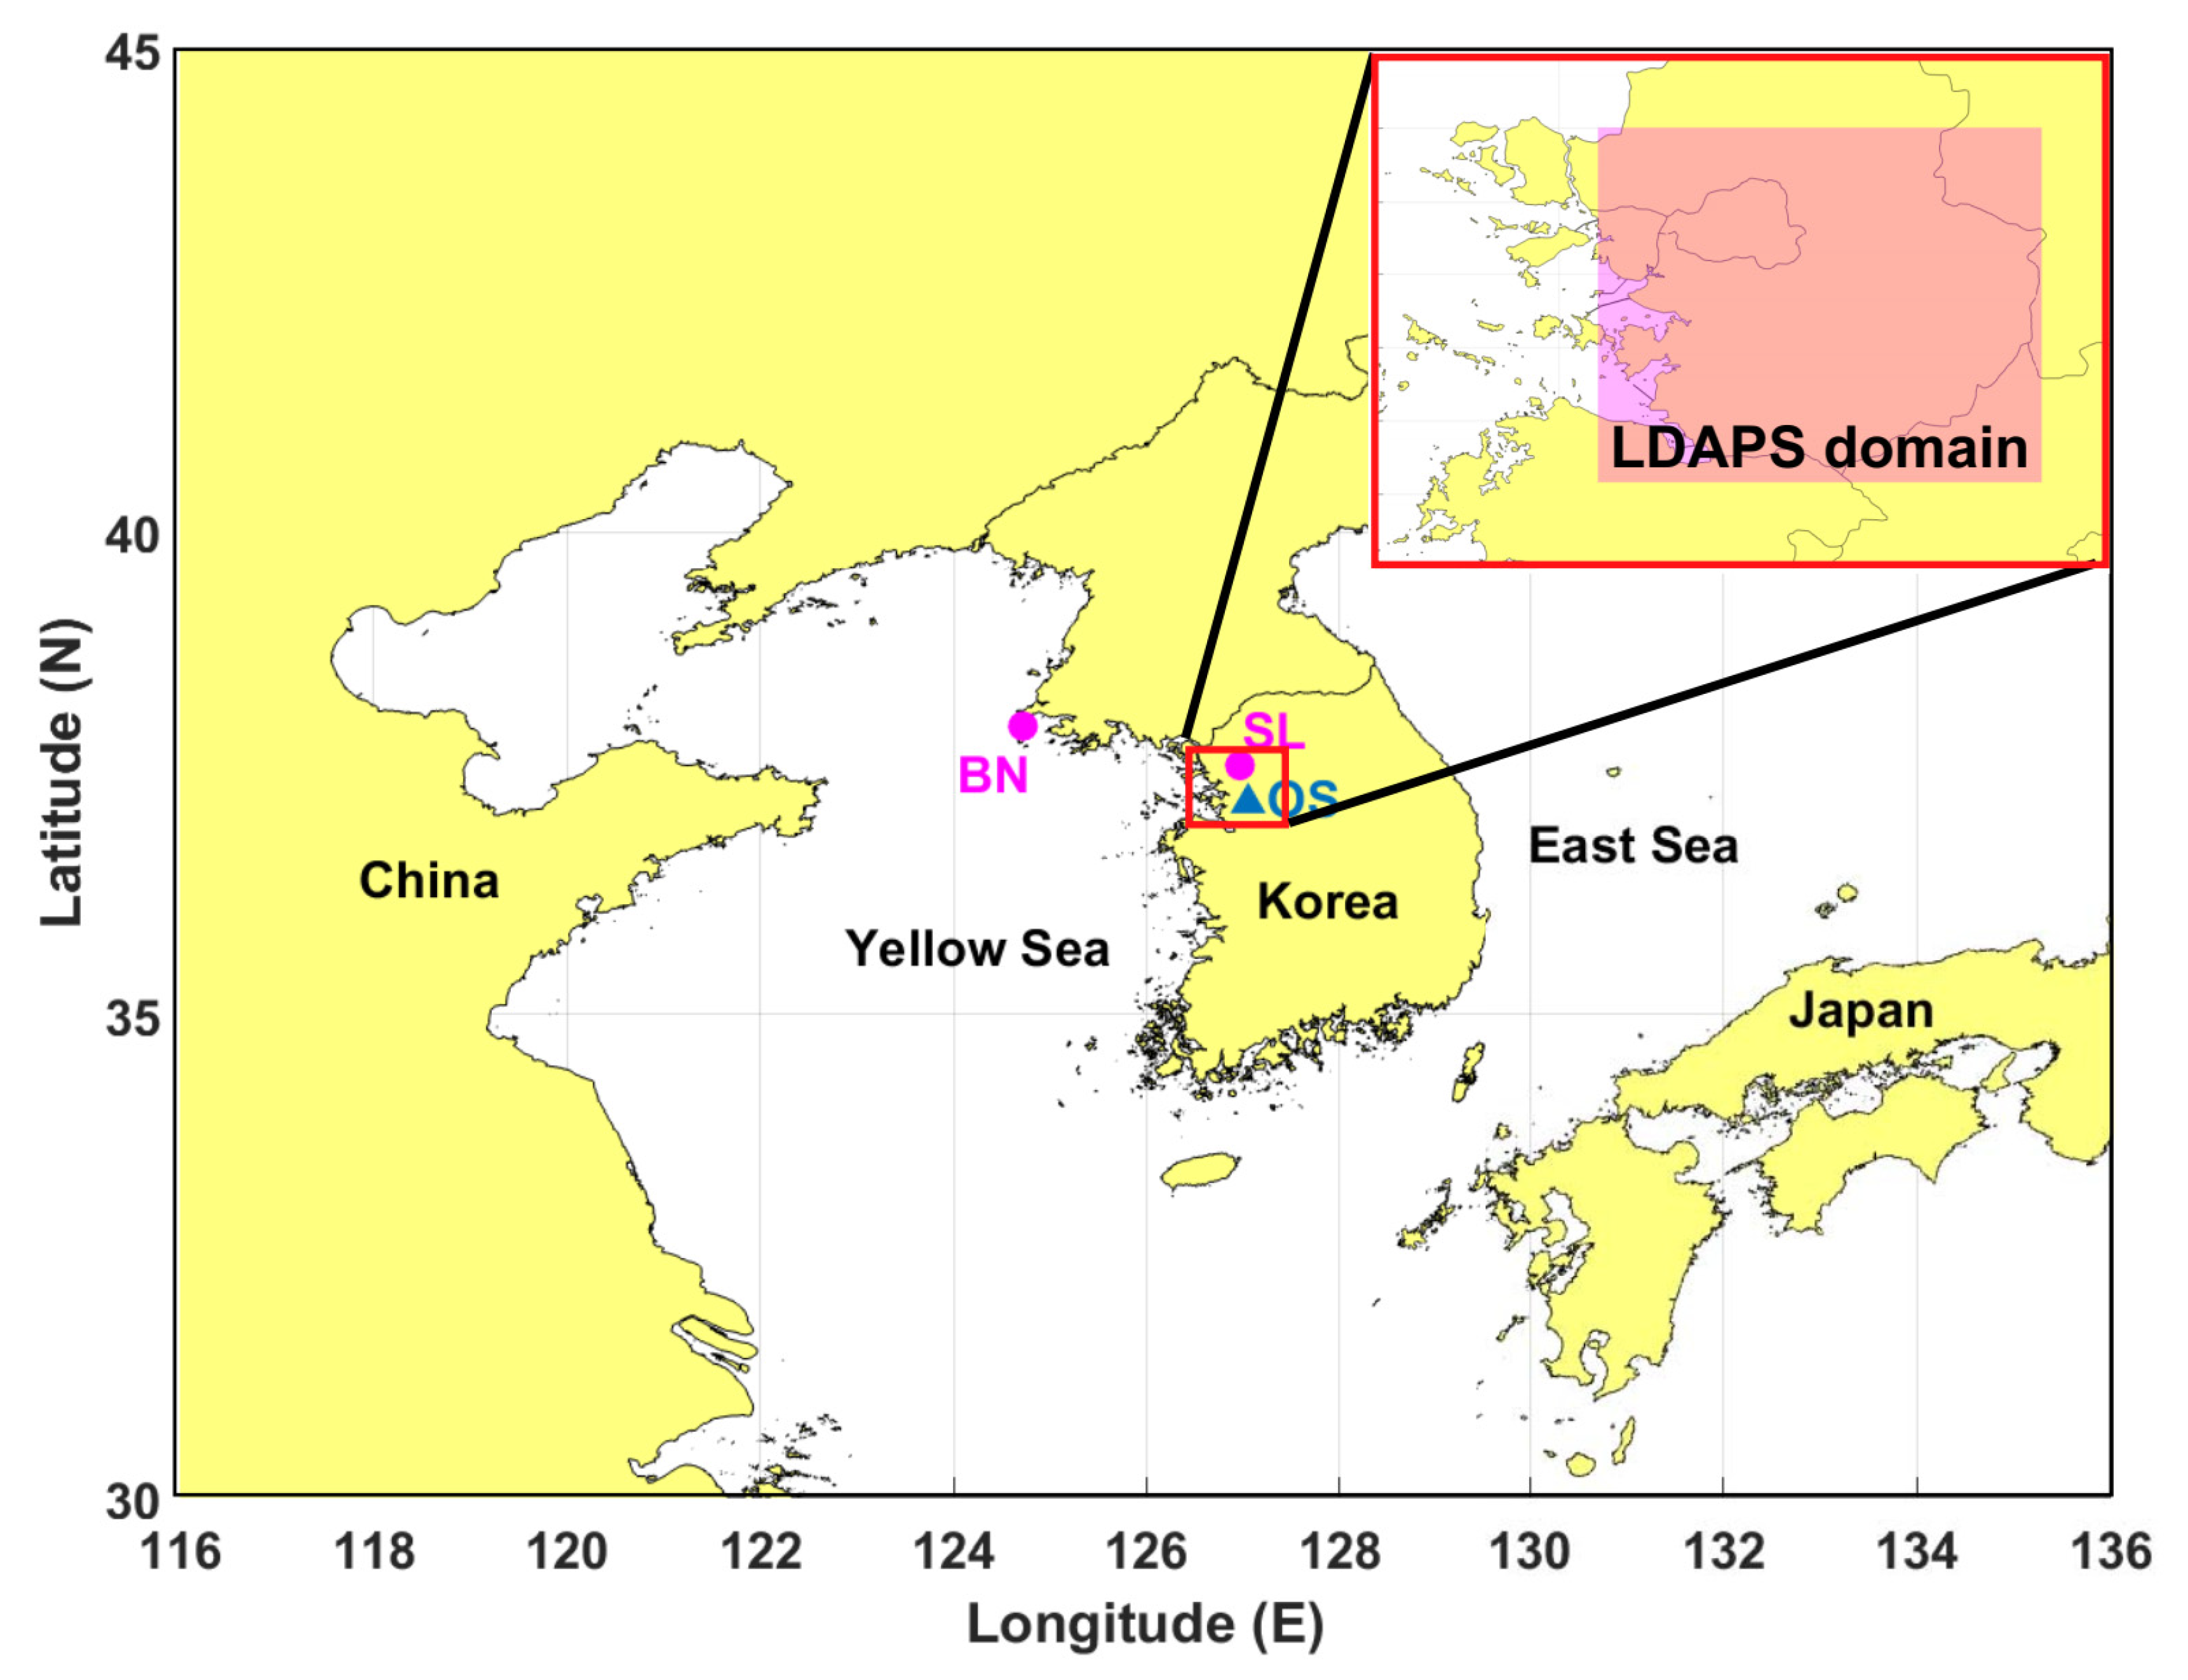
We used two air pollution intensive monitoring stations, Baengnyeongdo (BN) and Seoul (SL). SL is located to the east about 200 km from BN, largely downwind region of BN by considering the dominant westerly flow. Both stations have been established and managed by the National Institute of Environmental Research (NIER) in order to obtain comprehensive information on air quality in Korea. PM
10 and PM
2.5 are measured by the beta gauge method with MetOne BAM (1020 method) and by the gravitation method with a Tapered Element Oscillating Microbalance (TEOM 1400a), respectively. Particle mass concentrations are examined based on hourly averaged data. Aerosol light scattering coefficient (
) is measured with a Nephelometer (TSI 3563). Variability in
is a good surrogate for aerosol number concentrations since scattering is much more sensitive to aerosol number rather than aerosol mass. Furthermore, the previous studies guaranteed quite significant positive correlations between
and PM
2.5 with different humidity levels.
is examined as 5-min averages [
14,
15].
Eun et al. [
14] and Lee et al. [
15] developed a classification method of different hazes based on the previous analysis. The method is briefly summarized. First, PM
2.5 and PM
10 mass concentrations are used to define the event as a haze case in case both mass concentrations are greater than the average and plus one standard deviation, which is a threshold value for haze. For instance, the threshold values (+1 standard deviation,
) of PM
2.5 and PM
10 are 49.5 and 81.7 μg m
−3, respectively, at Seoul. Second, we check out the time lag of PM
2.5 concentrations between BN and SL, which are about 200 km far from each other. Therefore, we intend to have increases in PM
2.5 and PM
10 mass concentrations at Seoul with a couple of hours lags to those at BN. The following step is to identify whether 850 hPa backward trajectory comes from northwest to west. Of the events satisfying the 3 former steps, we select the day when the ratio of PM
2.5 to PM
10 is larger than 0.7. The ratio of 0.7 is arbitrarily determined based on previous studies [
15]. Specifically, PM
2.5 mass concentrations significantly increase with accumulation-mode aerosols during the heavy haze period, whereas PM
10 concentration remarkably increases relative to PM
2.5 for the Yellow Sand event. The following event is classified as a domestic haze (urban haze) when PM
2.5 and PM
10 concentrations increase only at SL with those of BN as low as the normal days, that is, lower than the threshold
given for haze classification.
ERA(ECMWF Re-Analysis)-Interim data have been employed for the meteorological data, provided by ECMWF (European Centre for Medium-Range Weather Forecasts). The reanalysis is carried out using a 4D-variational analysis on a spectral grid with triangular truncation of 22 waves (T255, approximately 80 km) in the horizontal direction, a hybrid vertical coordinate system consisting of 60 vertical layers from the ground surface to the 0.1 hPa in the vertical direction, and a 3 hourly temporal resolution [
16].
To evaluate the meteorological conditions for the different hazes from 2011 to 2016, we analyzed lower troposphere stability (LTS), boundary layer height (BLH), wind speed (WS), and relative humidity (RH) using ERA-Interim reanalysis data. Since these variables have different variability among each other, the following normalization is given.
where
x is the value of a variable,
is the 6-years average of
x, and
is the standard deviation of 6-years x. LTS was examined to describe the lower tropospheric stability, defined as the difference between the potential temperature of 850 hPa and 1000 hPa (
). The boundary layer height (BLH) is a good indicator of the vertical mixing extent of the pollutants [
17,
18]. WS and RH indicate wind speed and humidity, respectively, of 850 hPa, representative for the boundary layer thermodynamic characteristics.
For the intensive analysis, we used the UM-LDAPS (Unified Model-Local Data Assimilation and Prediction System) data from the Korea Meteorological Agency (KMA). The horizontal resolution of LDAPS is 1.5 km, and there are 70 layers using hybrid vertical coordinates from the surface to 40 km. The LDAPS assimilates a variety of measurements, including radiosonde observations at highly discrete levels into weather prediction models in a physically consistent manner. The LDAPS database includes wind field (u and v component), air temperature at 1000 hPa and 850 hPa, total cloud fraction, relative humidity, and boundary layer height. The variables from LDAPS are averaged for further analysis over domain A, which covers 36.8 N–37.8 N and 126.4 E–127.8 E (
Figure 1). The sounding data from 10 to 18 January 2013 are used to obtain the thermodynamic profiles at Osan, close to Seoul. The radiosonde soundings are made 4 times a day at 0000, 0600, 1200, and 1800 UTC. We used the thermodynamic profiles at 0600 UTC (1500 LST) mainly for the daytime unstable structure. In addition, temperature and wind fields from LDAPS reanalysis were also used to understand boundary layer evolution in detail.
3. Meteorological Dependence
Atmospheric aerosols in Korea have significant variability in time and space dimensions since Korea has various sorts of its own emission sources of air pollutants as well as naturally occurring sea salts and Yellow Sand. Moreover, Korea is located just downstream of China, the most rapidly developing country [
19,
20].
Table 1 summarizes the overall statistical properties of aerosols at SL and BN sites from 2011 to 2016. Since aerosols concentration is the asymmetric (or skewed) distribution, the geometric mean and geometric standard deviation are presented along with the arithmetic mean, standard deviation, and median. Over the 6 years, arithmetic mean and standard deviation of PM
10 (PM
2.5) concentrations in SL and BN were 46.1 ± 35.6 (28.6 ± 20.9) and 42.5 ± 39.9 (23.4 ± 20.6) μg m
−3, respectively. There are no significant differences in PM
10 concentration between both.
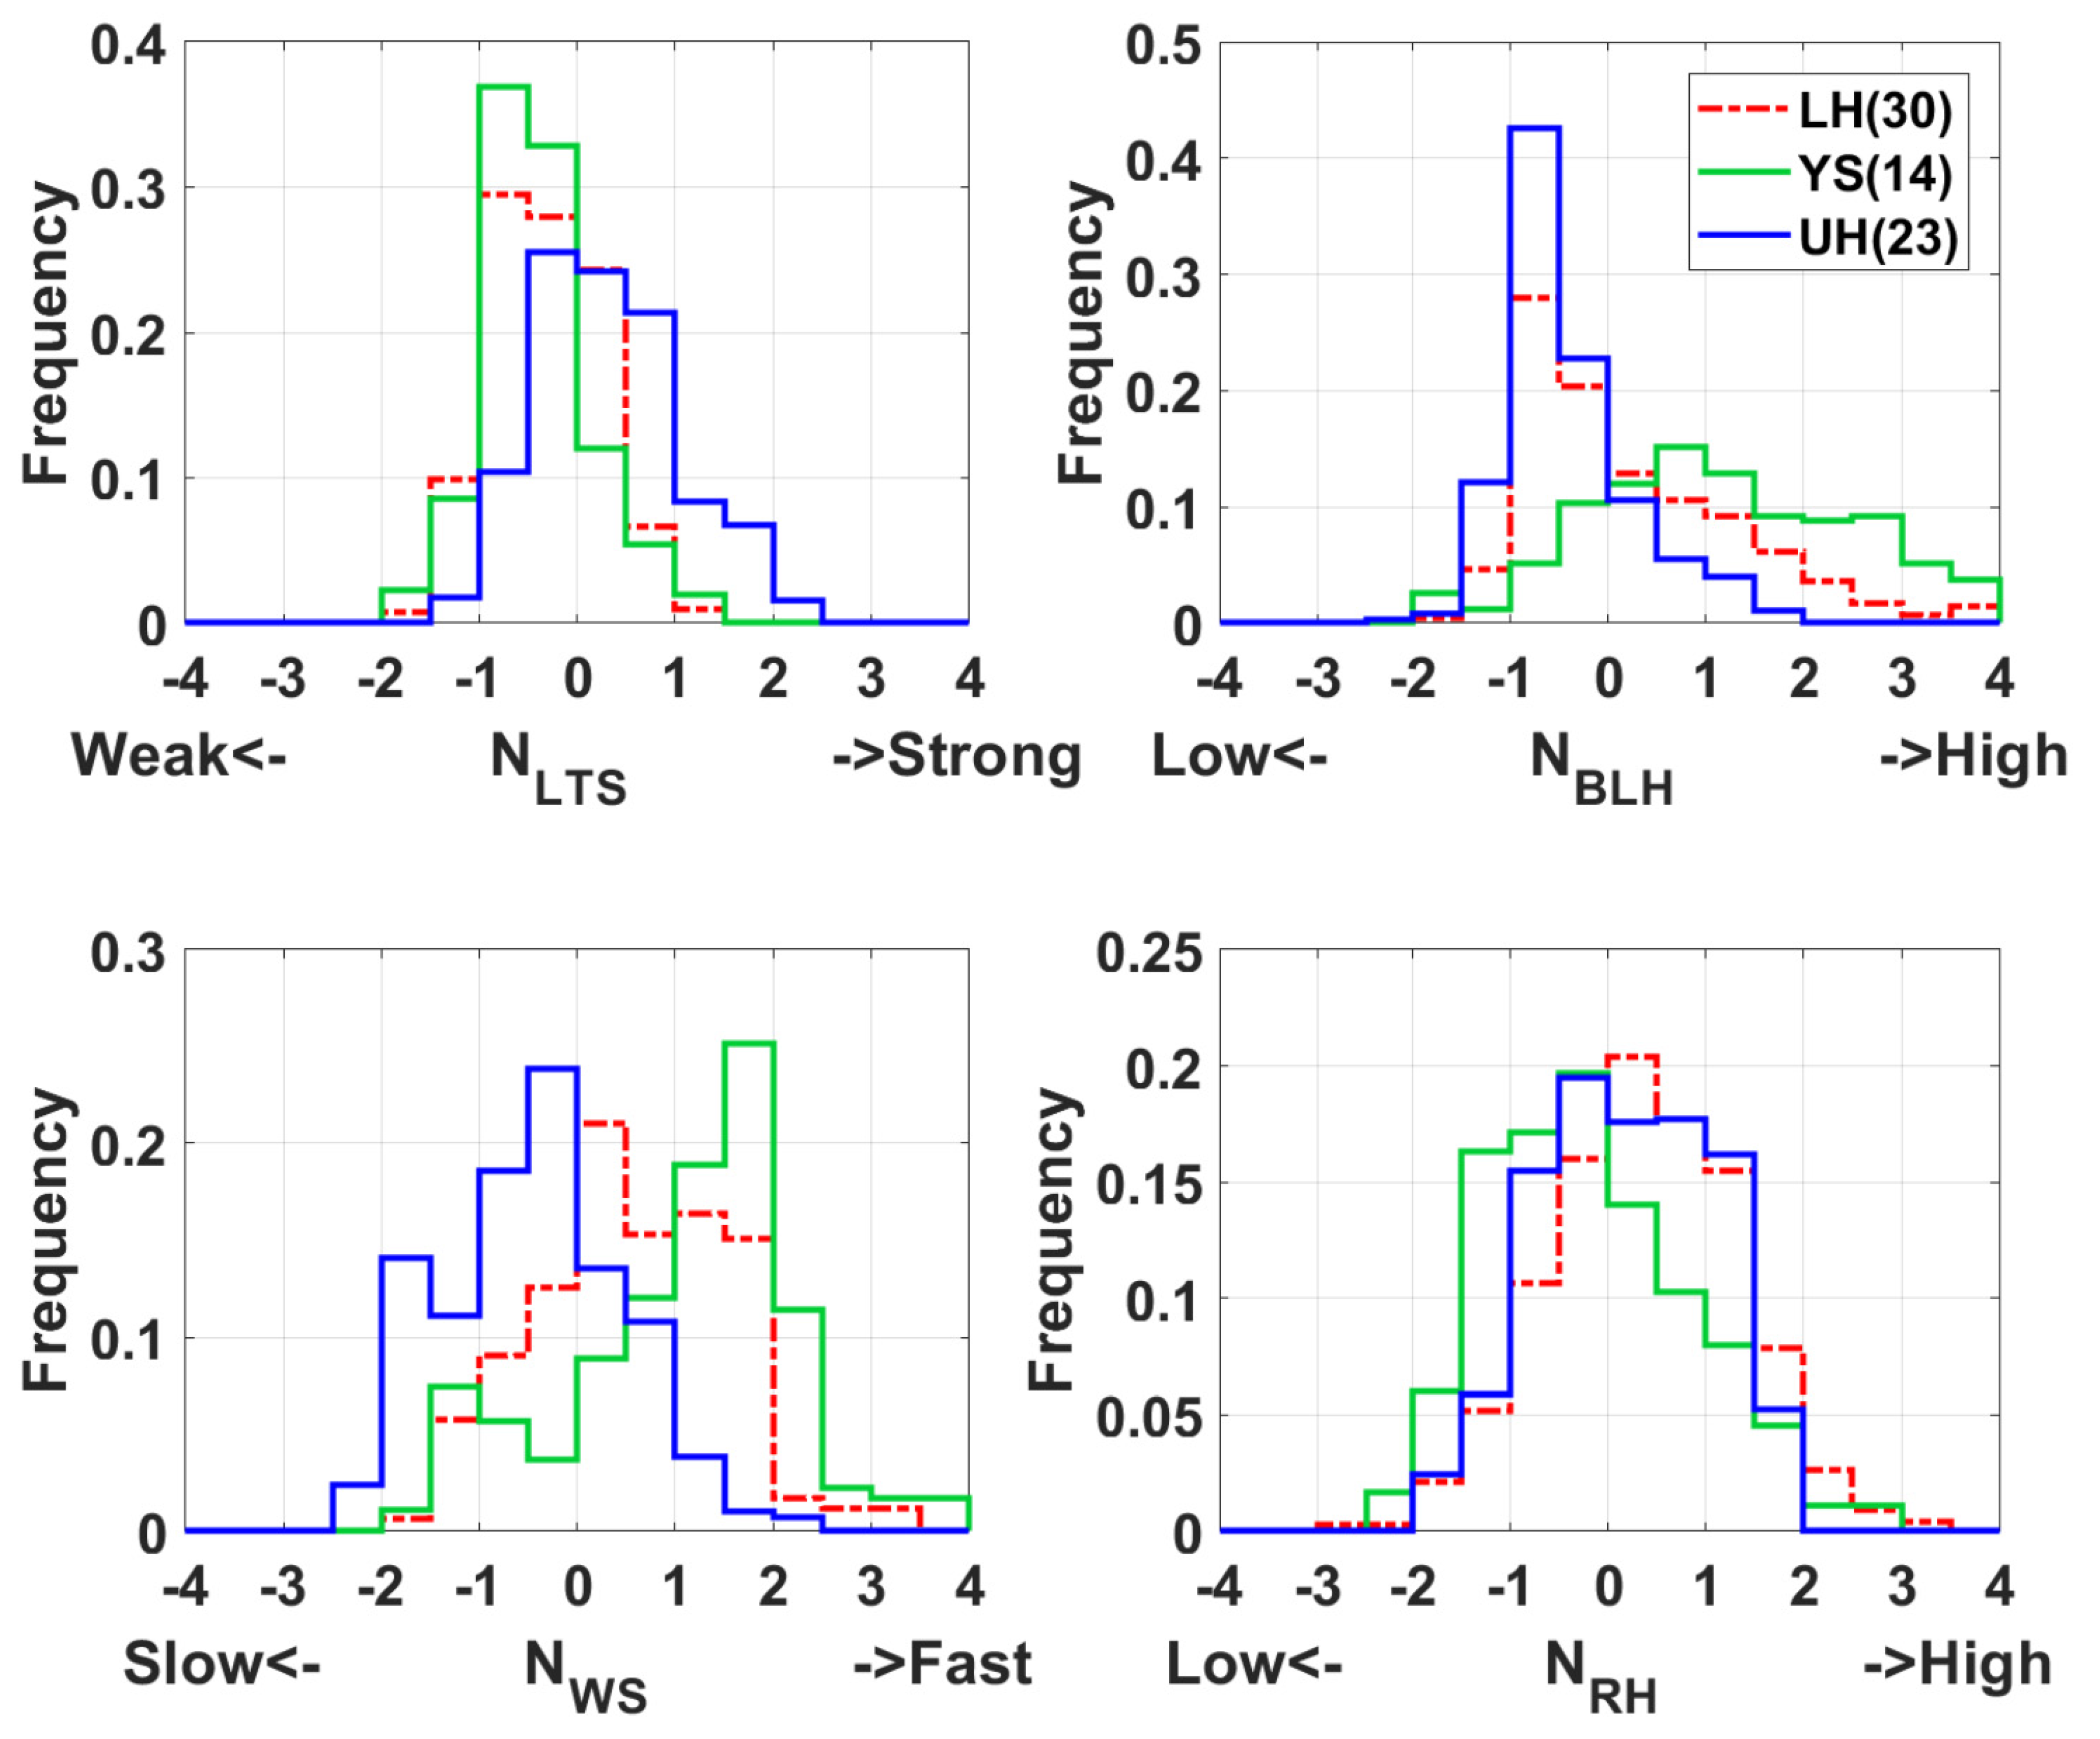
Figure 2 shows lower tropospheric stability (LTS), boundary layer height (BLH), wind speed (WS), and relative humidity (RH) at 850 hPa, as boundary layer characteristics using ERA-Interim. For the long-term analysis, the 67 hazes are selected for a 6-year period from 2011 to 2016 on a 24-h basis. Most haze cases occurred in the winter and spring seasons, whereas UH appeared largely in all seasons.
Figure 2 displays comparisons of meteorological conditions normalized by its average among LH, YS, and UH (refer to Equation (1)). First, the normalized LTS (
) of LH and YS generally shows a negative bias than that of UH, indicative of relatively less stable conditions for the long-range transported events. Meanwhile, both LH and YS have greater BLH (positive
) and stronger wind speed (positive
) than UH. Interestingly, a general feature of long-range transported aerosols events appears to be more vigorous with stronger wind, less stable with greater BLH, which is in contrast to those of typical urban haze. The stronger wind speed within the boundary layer and greater BLH of LH and YS are indicative of less stable and more favorable conditions for the long-range transported aerosols events. Meanwhile, the atmospheric condition of UH is liable to accumulate and increase aerosol mass by lower BLH along with much stronger stability on the contrary to LH and YS.
4. Aerosol-Meteorology Interactions
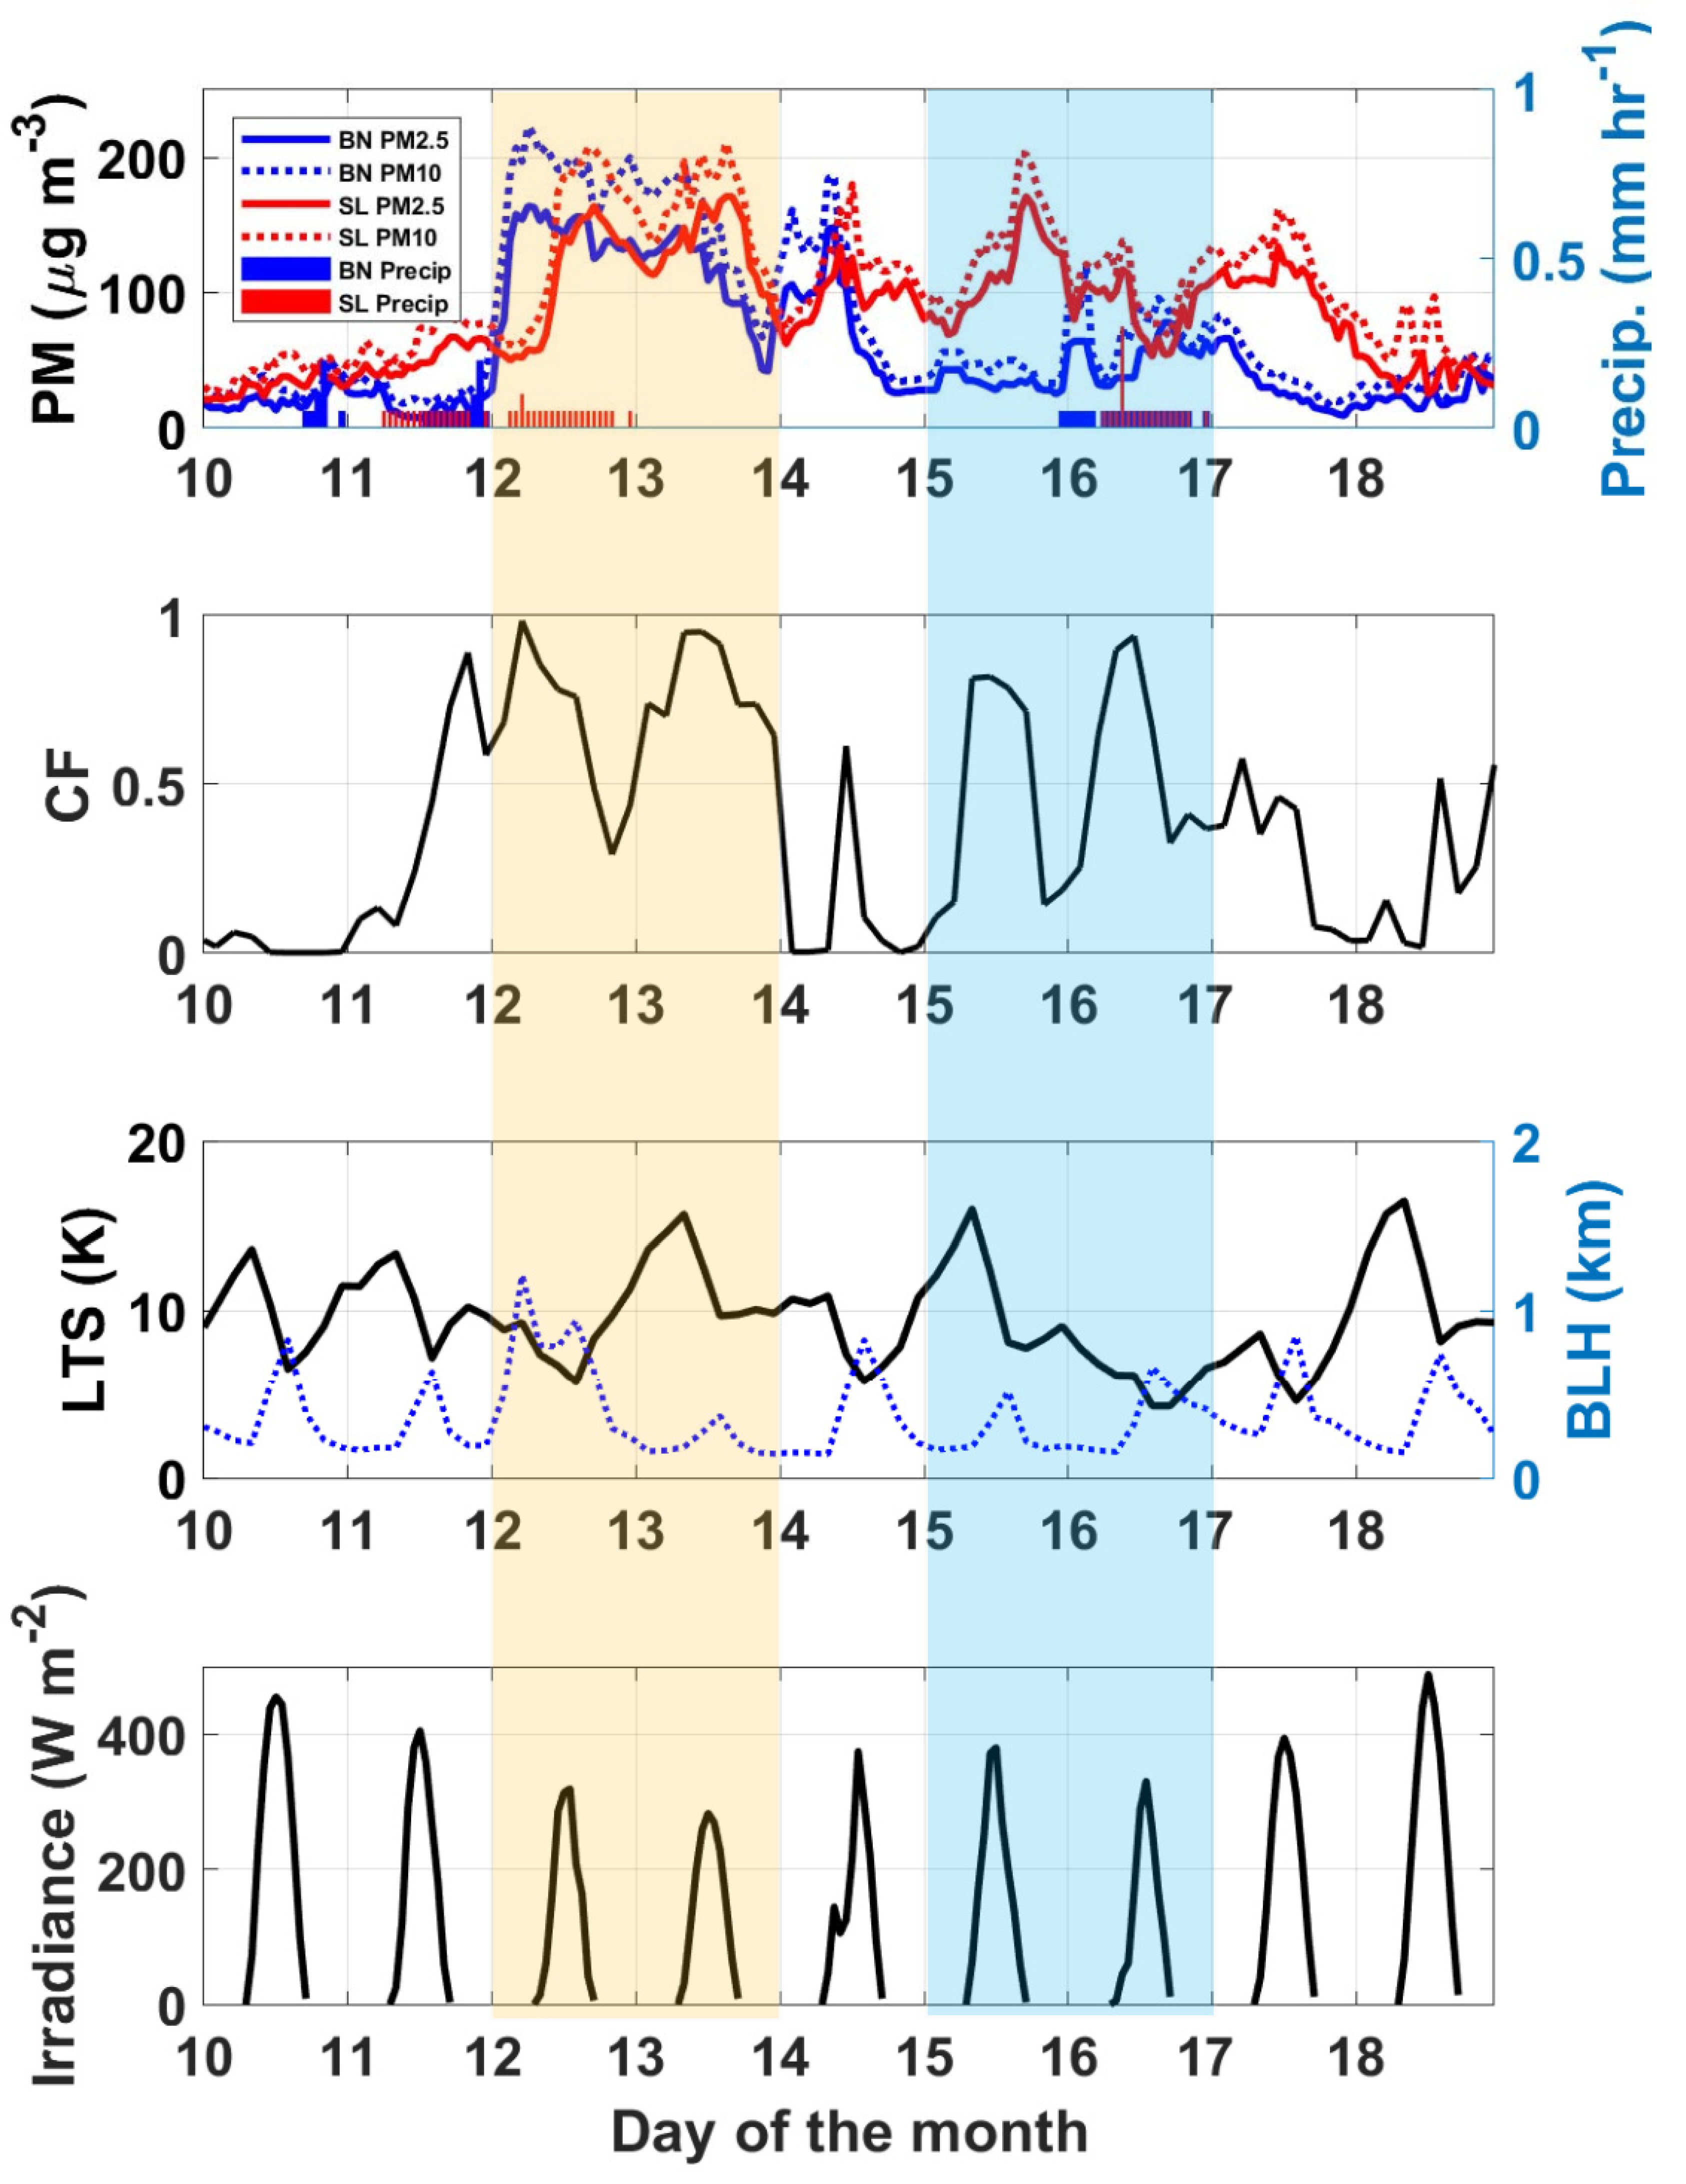
The unprecedented increase in aerosol loadings has been observed for one week from 10 to 18 January 2013. The severe haze consists of two periods; the first is the stronger one lasting largely 2 days and the latter is relatively weaker but still severe. This haze accompanied by visibility degradation occurred due to dramatic increases in fine particles. Aerosols were largely composed of fine particles by virtue of PM
2.5 almost the majority part of PM
10 as shown in
Figure 3. Specifically, the first period, 12 to 13 January, was assumed to be influenced by long-range transported aerosols from China. The severe haze had been observed a couple of days before in the Beijing region [
21]. The long-range transport of aerosols from northern China was well represented by backward trajectory analysis [
22] but not shown here.
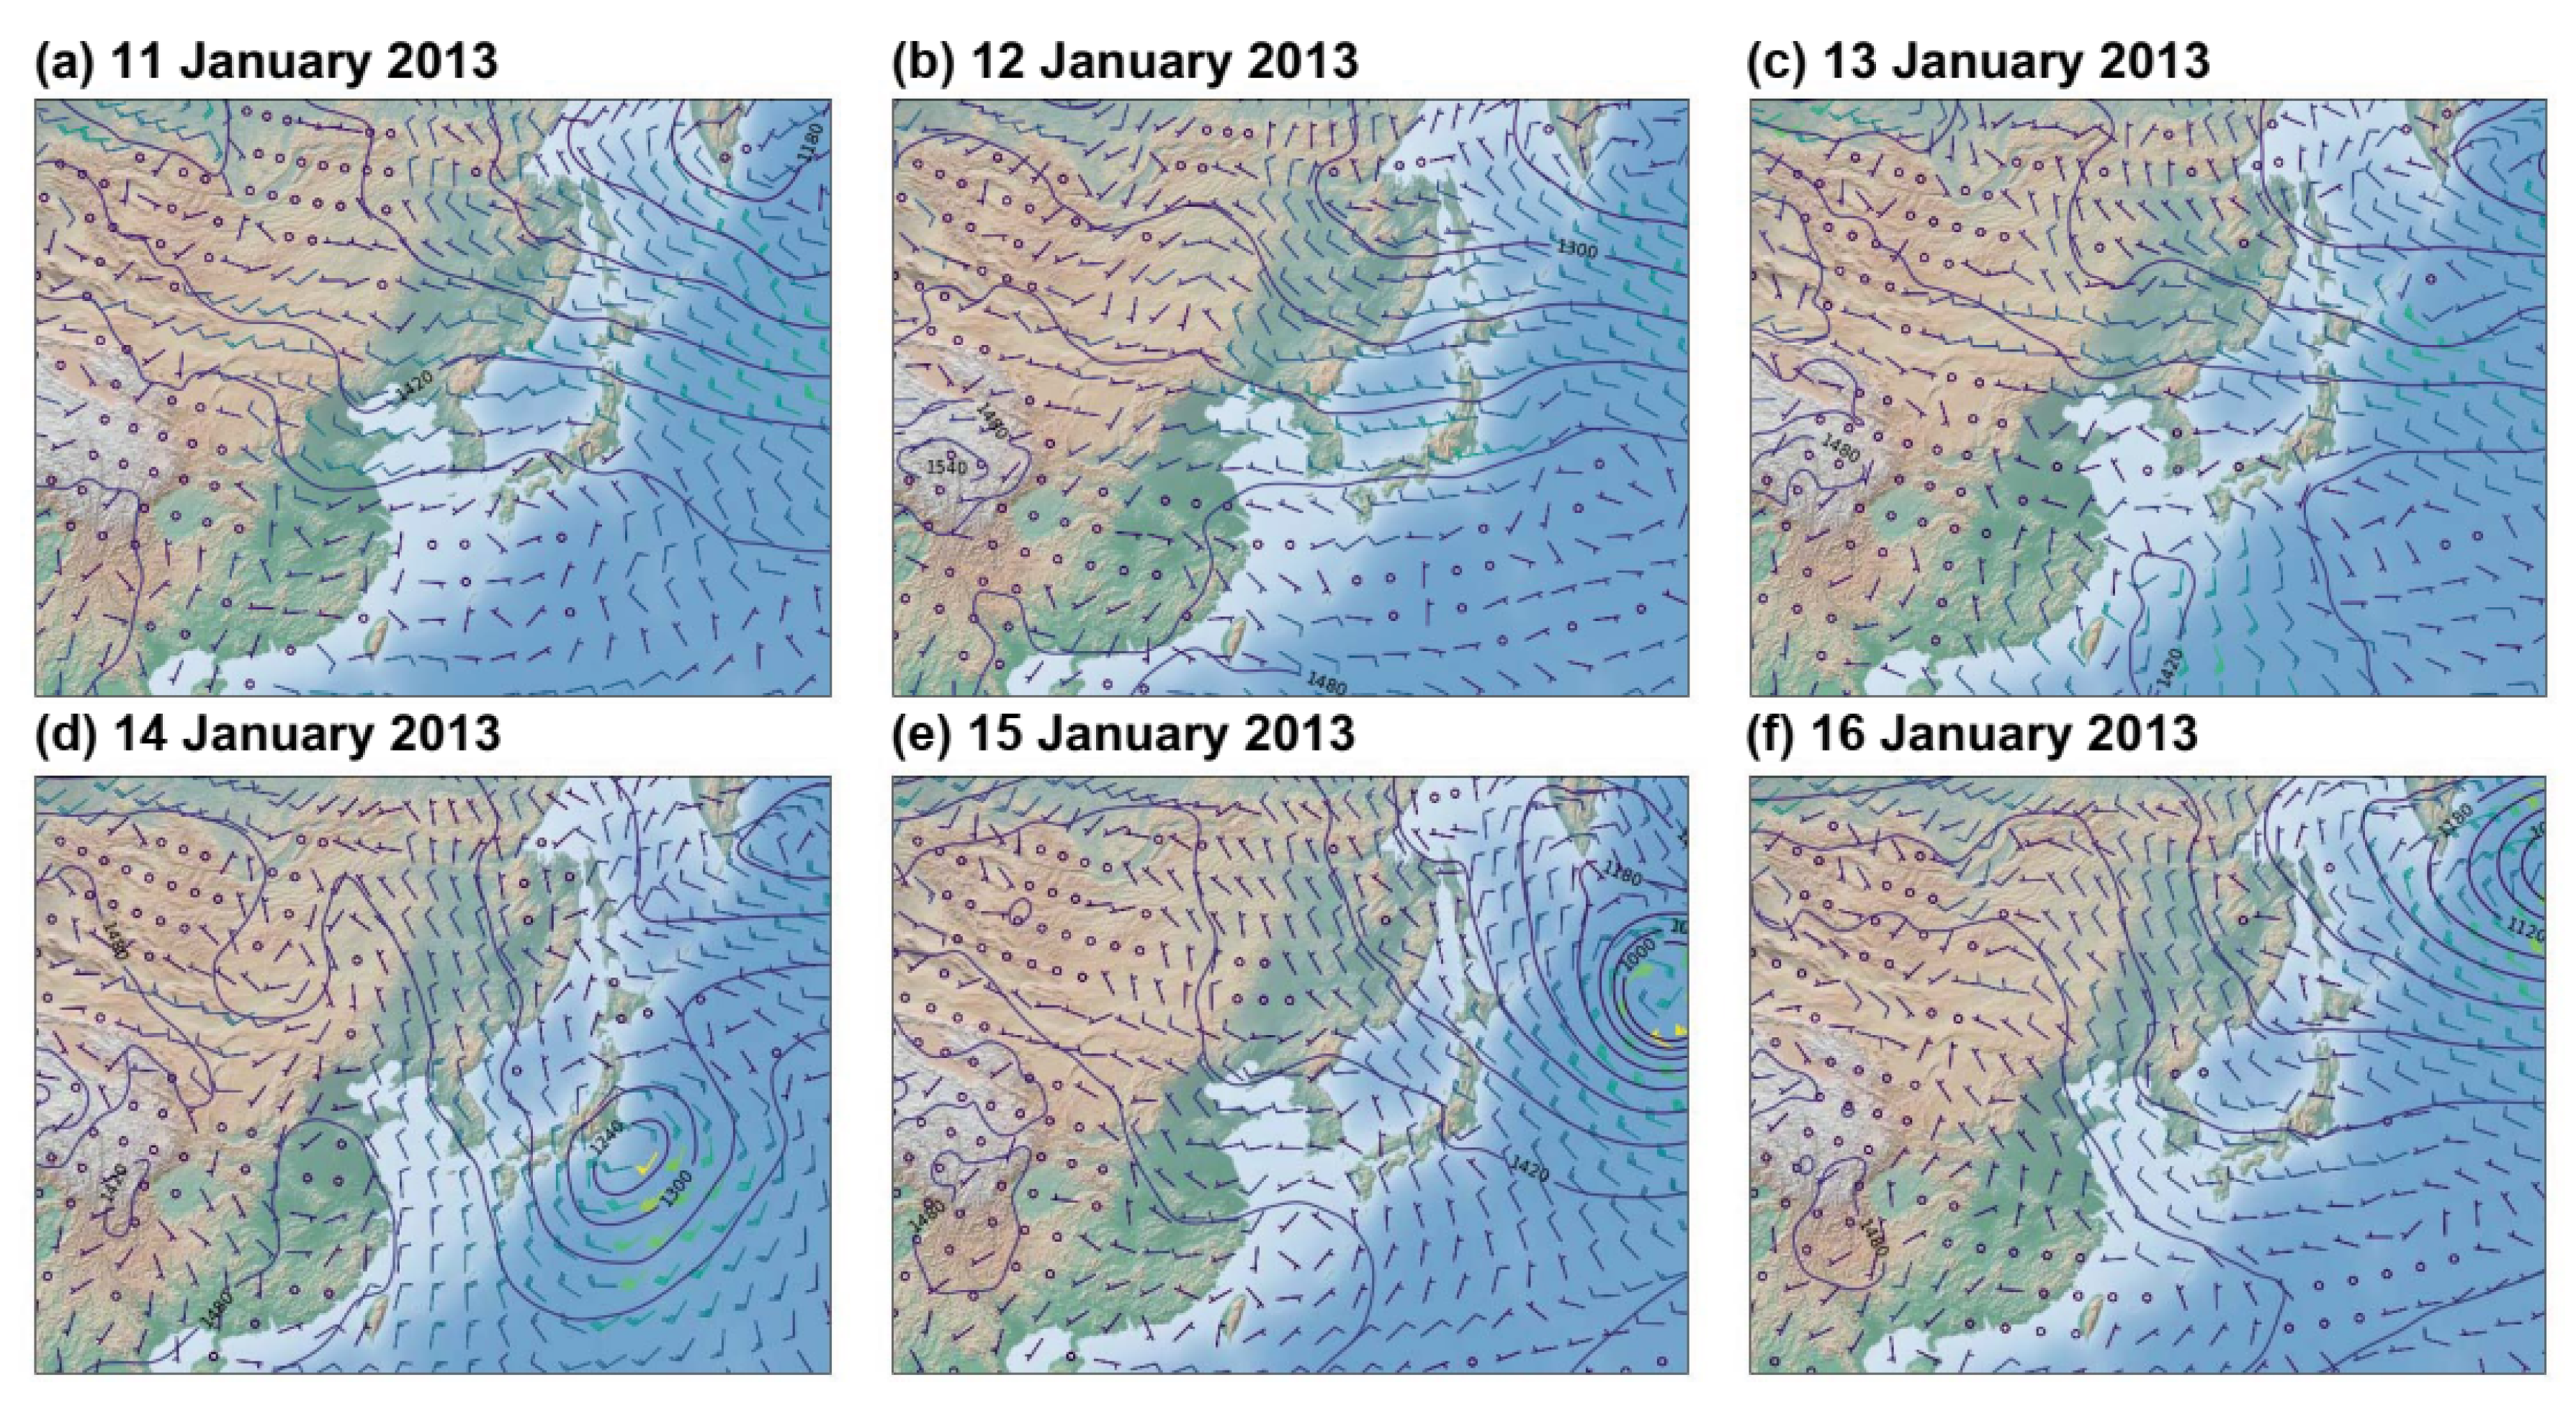
Figure 4 indicates synoptic weather charts at 850 hPa level generated by the ECMWF at 0600 UTC during 11–16 January 2013. On 11 January 2013, a trough system centered at the Manchuria passed by the northern Korean peninsula, which brought light precipitation (less than 0.1 mm h
−1) in Korea on 12 January (
Figure 3), especially around the mid-Korean peninsula region. Eun et al. [
4] suggest the precipitation lasted even after PM concentration began to increase around noon, which implies aerosol scavenging effect suppressed during the precipitation since probably enhanced aerosol loadings could have an impact on cloud and precipitation. The kind of stagnant synoptic systems lasted until the next day, 13 January, with the rain stopped. Isolines of geopotential height around Korea were zonally parallel from west to east in the 850 hPa weather chart (
Figure 4), which would accelerate the aerosols transport to Korea from East China. The enhanced aerosols pollution had been steadily maintained for about 2 days by the persistent synoptic environment during the first period. Gradually, the synoptic pattern has changed along with the northerly flow by low pressure developing in the southern Sikoku, Japan on 14 January (a transition day).
The second period after the transition day was also characterized by a stagnant system due to a slow-moving low-pressure system in the Sea of Okhotsk. The Korean peninsula was overall covered by the ridge on 15 January, which could make it possible to accumulate domestic air pollutants in the Seoul Metropolitan Area. As displayed in
Figure 3, PM
2.5 and PM
10 concentrations increased only at SL relative to BN in the normal state (30–50 μg m
−3), after they decreased at both sites (SL and BN) late afternoon of 13 January. The second period represents the accumulation of domestic pollutants to the residual transported aerosols for the first period by virtue of stagnant synoptic conditions. Similarly, Liu et al. [
23] divided severe haze events into the transport stage and the cumulative stage in China.
Temporal variations of total cloud fraction (CF), LTS (
), BLH, and solar irradiance during the entire measurement period are shown in
Figure 3. Time series of domain-averaged CF shows a significant increase up to 0.98 on 12 January when PM
10 and PM
2.5 began to increase at both BN and SL. It might be interpreted that clouds could be maintained longer through the modification of cloud microphysics due to the enhanced aerosols. Consistent with
Figure 3, LTS decreased and BLH increased during the transported period of 12 January such that higher mixing height with less stability could help to transport aerosols to the analysis domain. Cloud fraction on 13 January was still higher (~0.9) even after precipitation ended. Increased cloud fractions reduced solar irradiance (~280 W m
−2) on the surface because of the enhanced scattering of incoming solar radiation by persistent clouds. Accordingly, it is thought to decrease BLH to 163 m from 794 m and increase LTS to 15.7 K from 5.7 K (the previous day). It might imply that the modified meteorological condition induced by transported aerosols leads to maintain elevated aerosol concentration much longer on 13 January around Seoul after long-range transport of aerosols on 12 January.
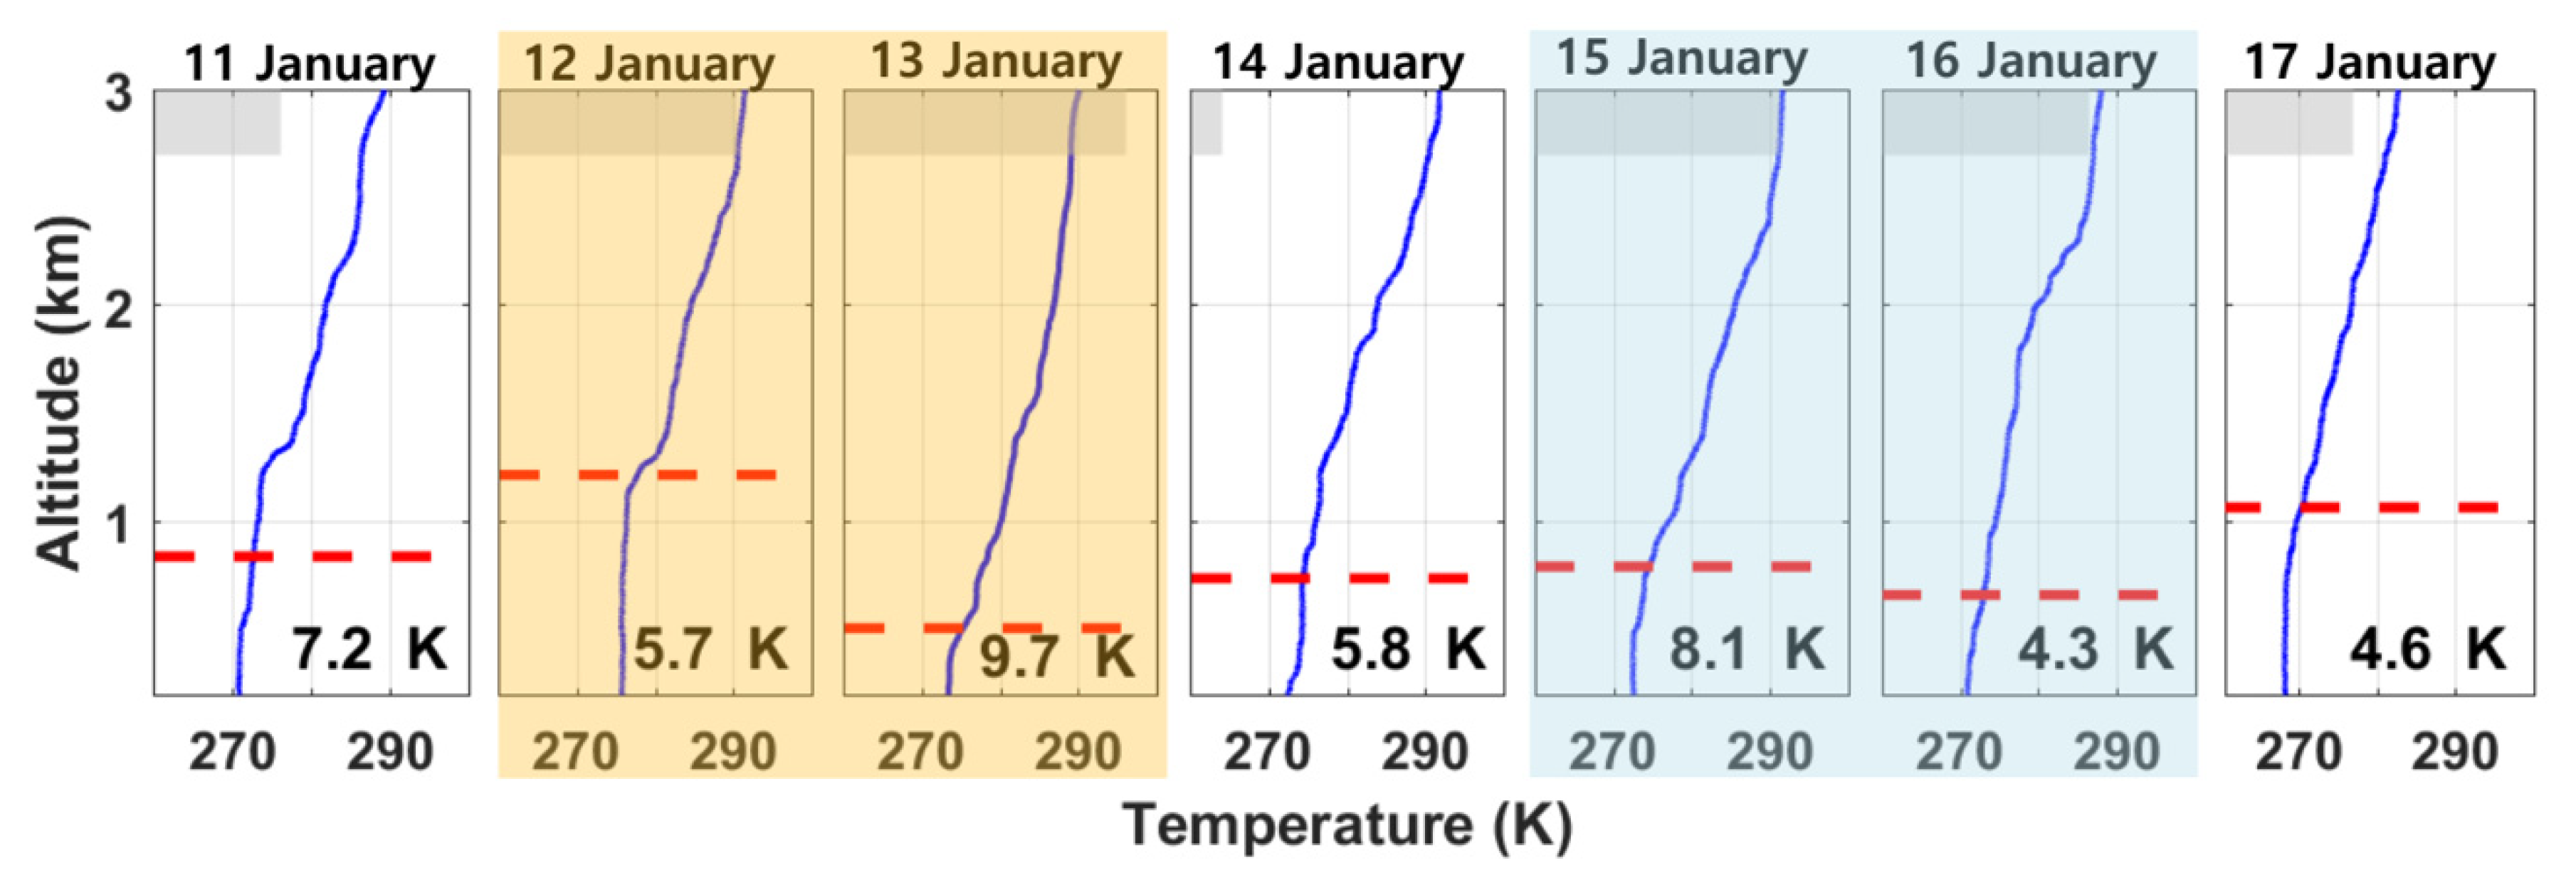
We analyzed the evolution of the thermodynamic profiles such as the potential temperature, BLH, and LTS measured by rawinsonde in Osan. In this study, BLH is obtained using the rawinsonde data based on the Heffter planetary boundary layer height method [
24].
Figure 5 shows BLH of about 1.1 km on 12 January is higher than that on 11 January with LTS reduced to 5.7 K, which is in accordance with
Figure 3. After that, total CFs on 13 January increased along with the elevated aerosol loadings. It also implies the cloud fraction would increase by aerosol-induced modification in cloud microphysics. Increased CFs eventually lead to lower BLH and higher LTS, more stable conditions with the increased aerosols lasting longer simultaneously.
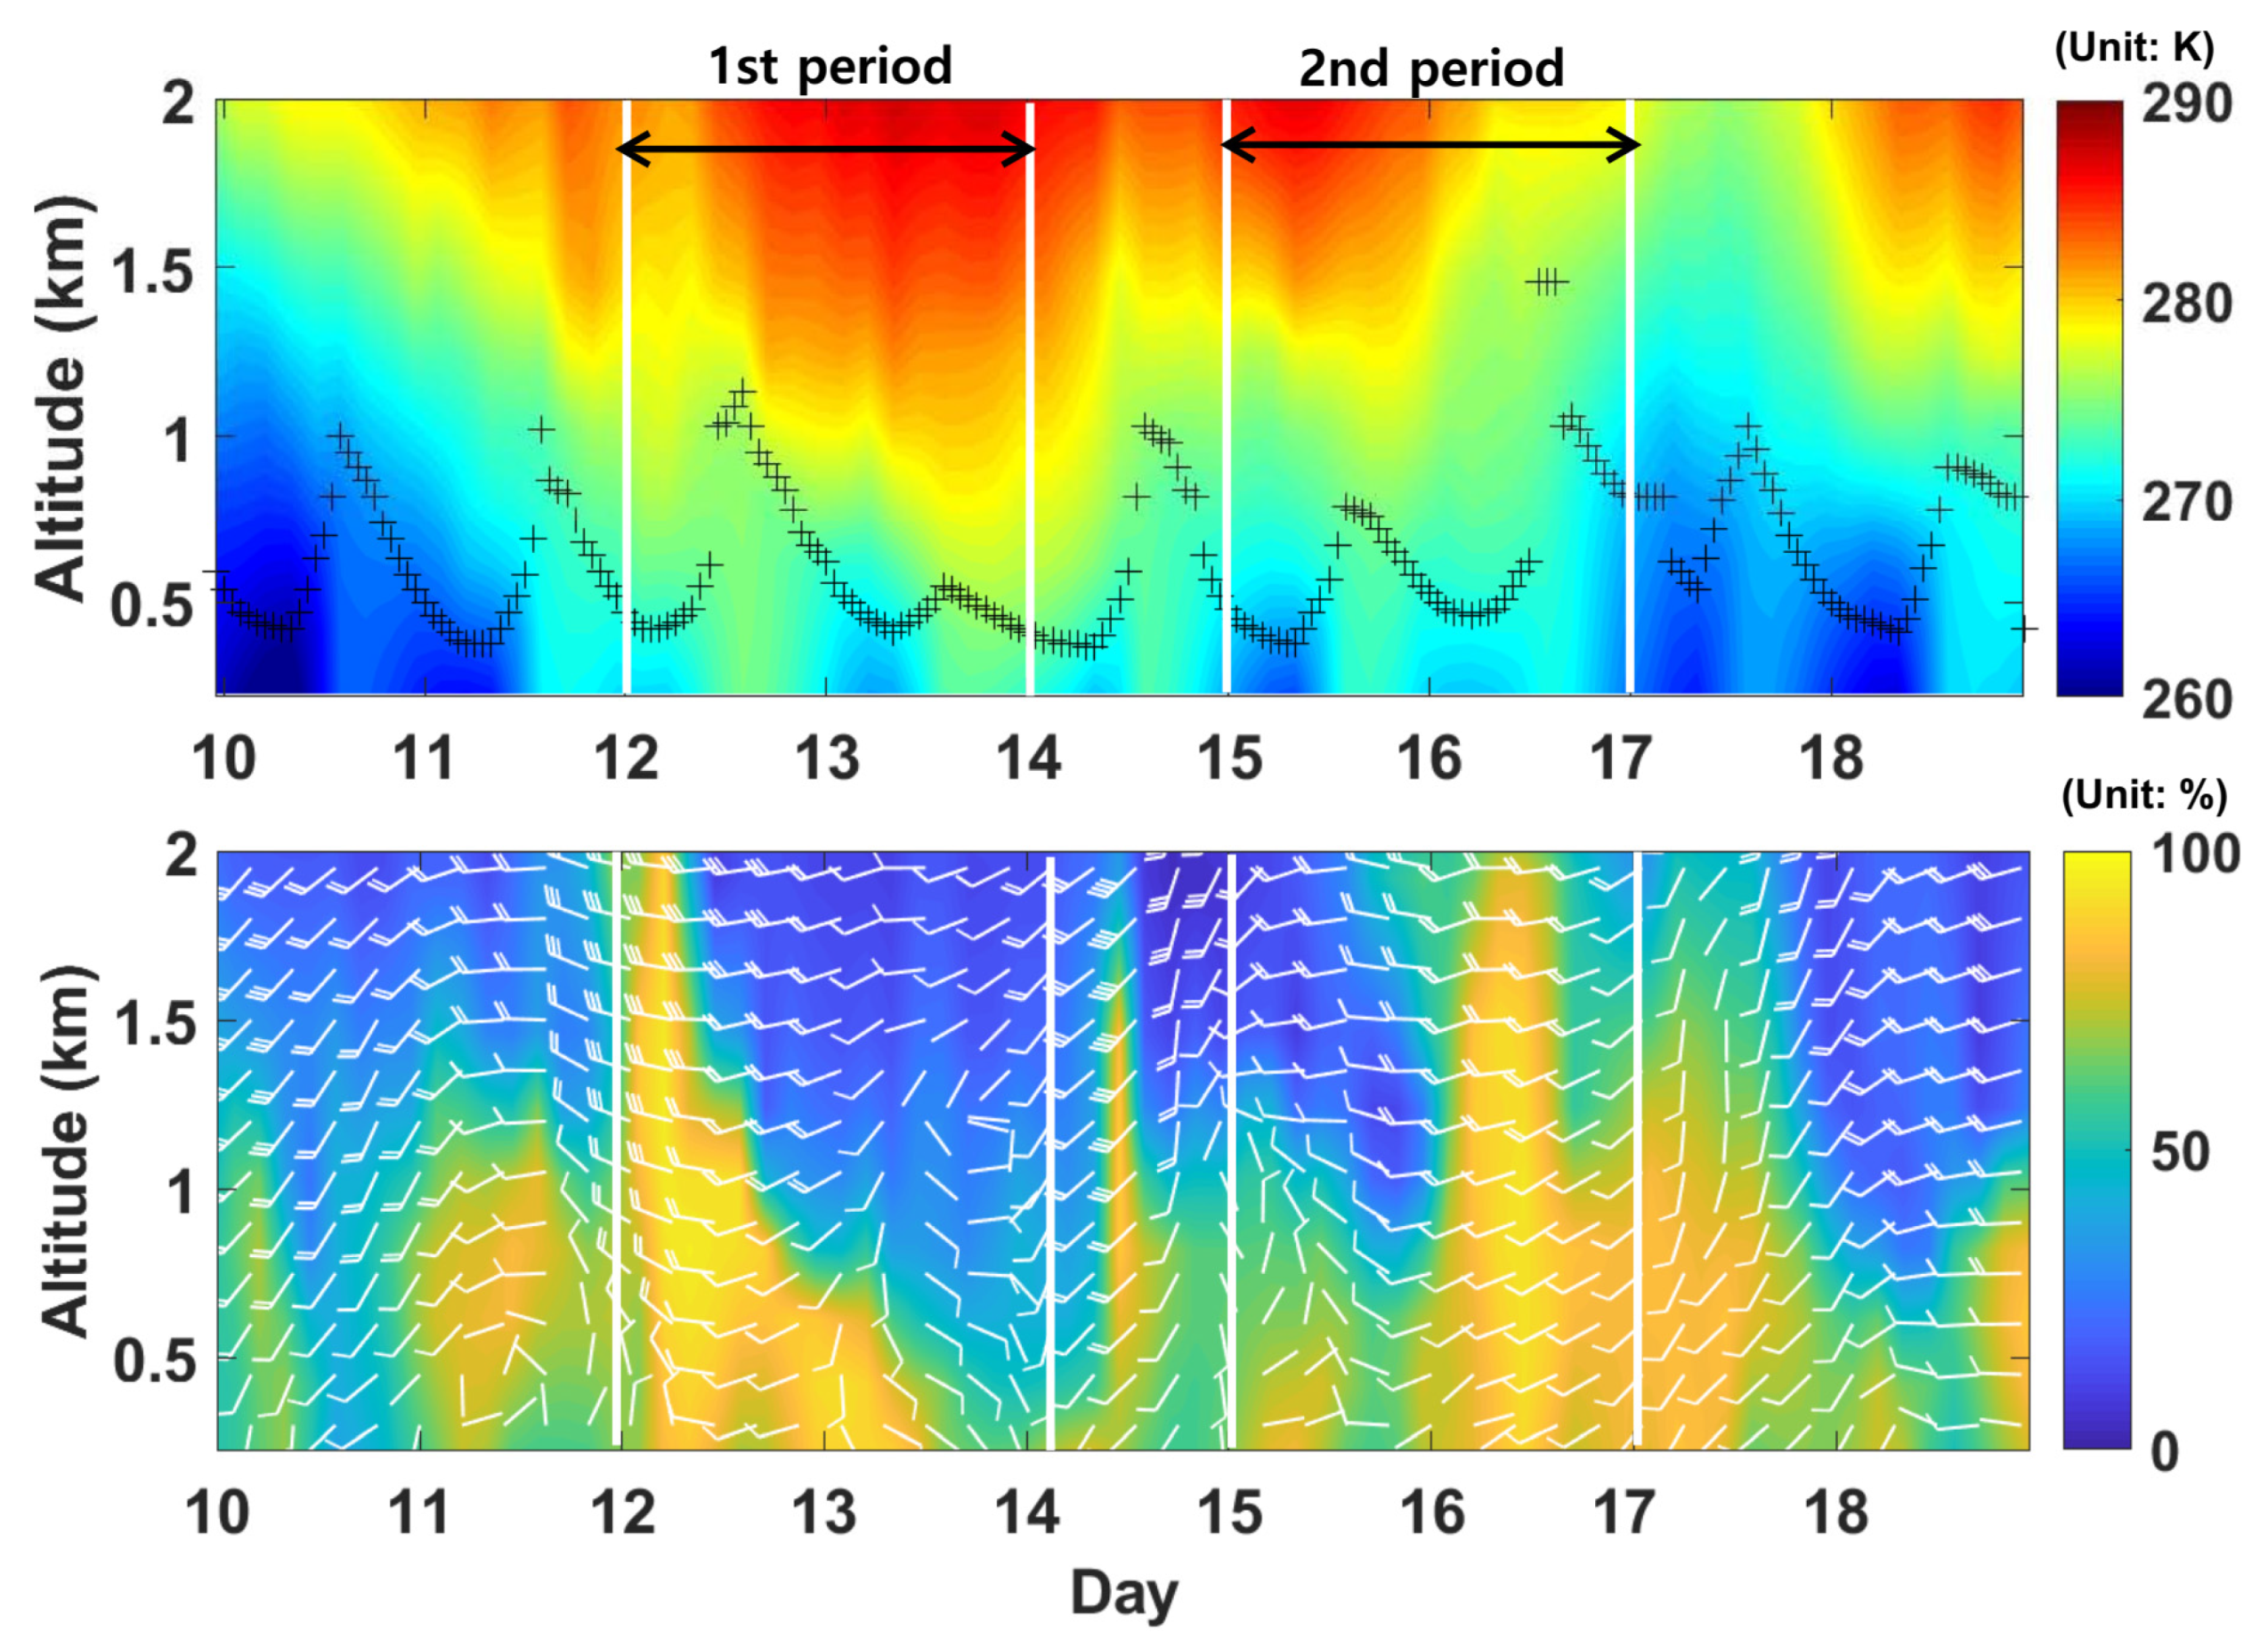
Figure 6 shows the time series of vertical profiles of potential temperature, BLH, RH, and wind speed of LDAPS from 10 January to 18 January. Such as
Figure 5, the boundary layer wind speed increased up to 16.0 m s
−1, which could produce mechanically unstable conditions along with much higher BLH on 12 January (first period). This suggests these mechanically unstable conditions and higher boundary layer height are favorable for the long-range transport of aerosols as previously mentioned. On 13 January, both BLH and wind speed decreased (about 4.8 m s
−1 and 550 m, respectively). These conditions are supposed to facilitate the accumulation of air pollution, and further modify the cloud properties such as increased cloud lifetime and cloudiness. In turn, it would increase LTS and decrease BLH again by decreasing solar irradiance by 283 W m
−2 as in
Figure 3.
The synoptic situation was slightly changed on 14 January in
Figure 4 with the northerly flow after the first period (12–13 January). The residual aerosols of the first period were suspended in the Seoul Metropolitan Area (SMA) during this transition period (14 January), which was later followed by the stagnant meteorological situation, that provided favorable conditions for aerosol accumulation and subsequent severe hazes. Still, cloud fraction increased again on 15 January when the lower BLH and the stronger stability were observed (
Figure 3). The LTS increased to 15 K, and BLH decreased below 800 m, which was conducive to the aerosol accumulation from local domestic emissions rather than long-range transport from abroad.
During the second period, PM
2.5 concentrations at BN were largely below 50 μg m
−3, except for a slight increase on 16 January. The second period is defined as an urban haze by a distinctive difference in PM
2.5 concentrations between SL and BN. The enhanced PM
2.5 concentrations gradually decreased with light precipitation (≤0.1 mm hr
−1), after which PM
2.5 concentration was restored to more than 100 μg m
−3 (
Figure 3). During this period, LTS (8.1 K) and BLH (840 m) were observed at 0600 UTC on 15 January (
Figure 5). The second period had relatively stable conditions; weak wind speed (4.8 m s
−1 within 2 km) and higher RH (see
Figure 6). In the weak synoptic forcing, increased stability might facilitate aerosols accumulation in the urban region with light wind speed and further keep severe haze lasting longer due to abundant moisture after light precipitation. The moist environment is good for aerosol formation and hygroscopic growth.
In this study, the analysis is limited to one single episode, and it is certain that the inherent coherence of aerosol and meteorology along with the synoptic dependence cannot be ruled out. However, this unique severe haze episode having its substantial strength and quite a long lifetime could be explained as an advertent weather modification experiment applied to Korea, when aerosol–meteorology interactions are well represented by both the observation and reanalysis data in the relatively weak synoptic forcing.
5. Discussion and Conclusions
Korea is located just downstream of China and thus has lots of opportunities to have a broad spectrum of various aerosols transport from abroad over the Yellow Sea. Aerosol-cloud–precipitation interactions have been examined and discussed in accordance with the meteorological conditions modified by an external aerosol forcing, with a special emphasis on the severe haze episode of 10 to 18 January 2013.
The general meteorological characteristics have been examined for the different haze categories using 6-years surface observation and reanalysis data. Distinctive different meteorological conditions are shown for LH (including YS) and UH such that higher BLH and stronger wind speed along with weak LTS are characterized for LH and YS in comparison with UH.
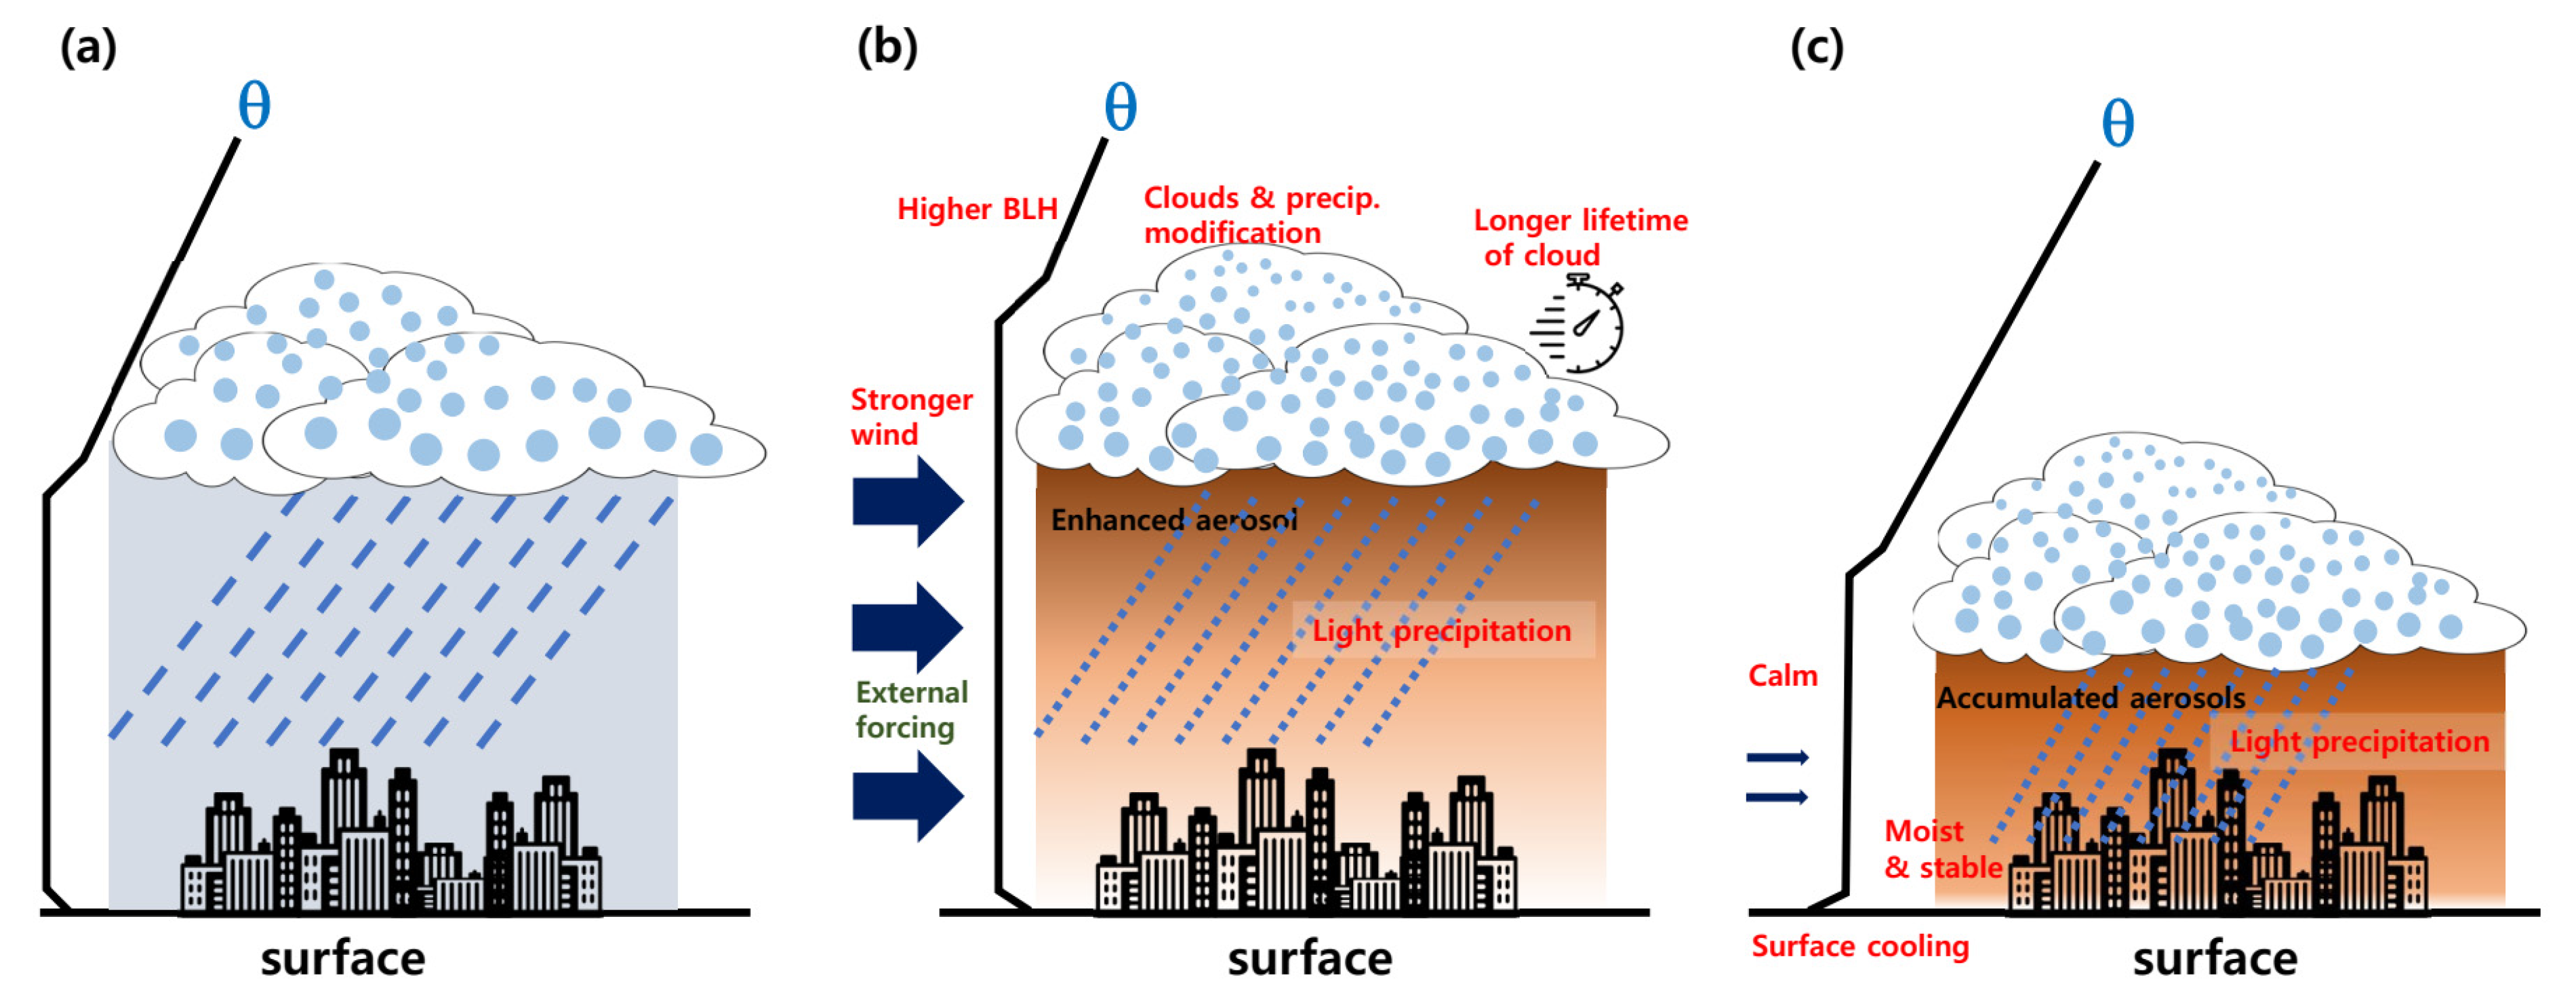
Figure 7 demonstrates a conceptual schematic diagram in summary to show how aerosols influence the meteorology through the aerosol–meteorology interactions feedback.
This study provides a couple of remarkable pieces of evidence of aerosols–meteorology interactions during a week period since it was a significant external aerosol forcing whose amount and lifetime are one order of magnitude greater and much longer than the average, respectively. The first period clearly demonstrates severe aerosols effect on precipitation in terms of its extension and scale (
Figure 7b), whereas the second period, in turn, demonstrates the modified meteorological condition might accumulate the suspended aerosols after the first period as explained in
Figure 7c. Aerosols emitted in the urban domain appears to be accumulated in the condition of stronger stability due to reduced solar radiation by increased cloud fraction and light precipitation lasting longer.
The analysis of aerosol–meteorology interactions is limited to an extraordinary episode, through which we can identify clearly aerosol impacts on precipitation and meteorology, and further the maintained mechanism of severe haze process due to the modified meteorological environment by aerosol–cloud interactions in the weak synoptic forcing as summarized in
Figure 7. Observations of aerosol–meteorology interactions are to be discernible by a virtue of drastic increases of aerosols concentration with such a long time scale that the response of precipitation and meteorology could stand out by enhanced aerosols and afterward the severe haze might be worsened by the stronger stability due to aerosol–cloud–precipitation interactions. Uno et al. [
25] showed an abrupt decrease in air pollution, SO
2 and NO
x, and composition shift. Accordingly, we can expect a long-term change of clouds and precipitation due to the decrease in aerosols and paradigm shift in aerosol chemical composition. Probably meteorology including clouds and precipitation will also respond to the different aerosols forcing in a different pathway, which needs further study in the near future.


