Article

A Wind Study of Venus’s Cloud Top: New Doppler Velocimetry Observations †

1
Institute of Astrophysics and Space Sciences, Observatório Astronómico de Lisboa, Ed. Leste, Tapada da Ajuda, 1349-018 Lisbon, Portugal
2
LESIA, Observatoire de Paris, Université PSL, CNRS, Sorbonne Université, Université de Paris, 5 Place Jules Janssen, 92195 Meudon, France
3
Dynamiques patrimoniales et culturelles (DYPAC), Université Paris-Saclay, 78000 Versailles, France
*
Author to whom correspondence should be addressed.
Based on observations obtained at the Canada-France-Hawaii Telescope (CFHT).
Atmosphere 2021, 12(1), 2; https://doi.org/10.3390/atmos12010002
Submission received: 9 October 2020 / Revised: 11 November 2020 / Accepted: 16 December 2020 / Published: 22 December 2020
(This article belongs to the Special Issue Observations of Venus Atmosphere)

Abstract

:
At Venus’s cloud top, the circulation is dominated by the superroration, where zonal wind speed peaks at ∼100 ms 1 , in the low-to-middle latitudes. The constraining of zonal and meridional circulations is essential to understanding the mechanisms driving the superrotation of Venus’s atmosphere, which are still poorly understood. We present new Doppler velocimetry measurements of horizontal wind velocities at Venus’s cloud top, around 70 km altitude. These results were based on March 2015 observations at the Canada–France–Hawaii Telescope (CFHT, Mauna Kea, Hawaii), using ESPaDOnS. The Doppler velocimetry method used has already successfully provided zonal and meridional results in previous works led by P. Machado and R. Gonçalves, proving to be a good reference ground-based technique in the study of the dynamics of Venus’s atmosphere. These observations were carried out between 27 and 29 March 2015, using the Echelle SpectroPolarimetric Device for the Observation of Stars (ESPaDOnS) which provides simultaneous visible-near IR spectra from 370 to 1050 nm, with a spectral resolution of 81000 allowing wind field characterization in the scattered Franuhofer solar lines by Venus’s cloud top on the dayside. The zonal velocities are consistent with previous results while also showing evidence of spatial variability, along planetocentric latitude and longitude (local-time). The meridional wind circulation presents a notably constant latitudinal structure with null velocities at lower latitudes, below 10 N–S, and peak velocities of ∼30 ms 1 , centered around 35 N–S. The uncertainty of the meridional wind results from ground observations is of the same order as the uncertainty of meridional wind retrieved by space-based observations using cloud-tracking, as also shown by previous work led by R. Gonçalves and published in 2020. These March 2015 measurements present a unique and valuable contribution to the study of horizontal wind at the cloud top, from a period when Doppler velocimetry was the only available method to do so, since no space mission was orbiting Venus between Venus Express ending in January 2015 and Akatsuki’s orbit insertion in December 2015. These results from new observations provide (1) constraints on zonal wind temporal and spatial variability (latitude and local time), (2) constraints on the meridional wind latitudinal profile, (3) additional evidence of zonal and meridional wind stability for the period between 2011 and 2015 (along previous Doppler results) (4) further evidence of the consistency and robustness of our Doppler velocimetry method.

1. Introduction

Venus is usually referred to as Earth’s twin due to its similarities, namely, the mass, radius, density and bulk chemical composition [1]. However, the superrotation of the Venusian atmosphere, only seen in slow rotating planets, challenges the current understanding of geophysical fluid dynamics inherited from non-superrotating Earth [2,3,4,5]. Research on Venus’s atmosphere has benefited from two recent space missions: ESA’s Venus Express (2006–2014) and the Japanese spacecraft Akatsuki, in orbit around Venus since 2015 [6]. The study of Venus’s atmosphere could be a fundamental key in our understanding of the atmospheric dynamics and evolution of any of the so called Earth-like planets, and the Earth itself.
At the cloud level, the atmospheric circulation is dominated by a zonal wind that peaks at the top of the upper clouds (70–75 km). Venus’s middle and lower atmosphere are in a state of retrograde superrotation where the atmosphere rotates about 50 times faster than the solid planet. Zonal wind speed exceeds the meridional one by an order of magnitude and reaches its maximum of 100 m/s at the cloud top in the low-to-middle latitudes [7,8,9,10,11,12]. The mechanisms maintaining the superrotation of Venus’s atmosphere are still poorly understood [2,3,13]. Both the source and maintenance of a superrotating atmosphere in a slow rotating planet constitute a long-standing problem in planetary atmospheric dynamics [14,15].
The Hadley-type poleward meridional circulation transports angular momentum from the equator to the poles [16]. A unique polar vortex circulation has been supposed to be maintained at high latitudes ( 70 ) at both hemispheres by both zonal and meridional circulation [13,17,18]. Due to the unfavorable viewing geometry and poor UV contrast of polar clouds, only a fraction of the total wind measurements have been reported for the polar regions. Existing data indicate a circumpolar circulation close to solid-body rotation, with E–W winds decreasing to zero close to the pole, and marginal N–S circulation [7,13,17].
Several authors have investigated cloud top wind field properties using a variety of retrieval techniques from Venus Express/VIRTIS, Venus Express/VMC, Akatsuki/UVI [7,9,11,19,20,21,22] and ground-based observations [10,12,23]. Most of them have revealed a spatially variable zonal wind field in latitude and local solar time, as well as the meridional structure of the superrotation at the cloud top. The ground-based Doppler results are complementary to space-based measurements, in constraining global wind circulation models over different time scales [10,12]. The characterizations of shorter time-scale variations are expected to bring new constraints on Venus general circulation models at the cloud top level [24].
We present new zonal and meridional Venus’s cloud top wind results from March 2015 observations based on Doppler velocimetry technique with the ESPaDOnS at CFHT. The results will be useful to (1) constrain zonal and meridional wind circulation at cloud top level, (2) study the wind variability along time, (2) show the consistency of our Doppler velocimetry technique in the retrieval of horizontal cloud top winds, (3) provide continuous coverage of cloud top dynamical properties and (4) detect short-term and long-term variations in the wind velocities, in order to characterize global-scale waves and constraint or determine the possible sources of variability.

2. Observations

The observations were made on 27–29 March 2015, using the ESPaDOnS at CFHT. We also executed a short observation run (1.5 h) on the 25th to test and fine tune our observation strategy; but targeting drift and the presence of clouds resulted in low quality spectra; hence, no results could be retrieved. Venus was observed at a phase angle Φ (Sun-Target-Observer) of 54.0 –54.9 , with surface brightness 1.16 (mag/arcsec), apparent magnitude −4.0, illuminated fraction between 79.4–78.7% and an angular diameter of 13.5–13.7 arcsec (see Table 1 for more details). The choice of observing dates offered the best compromise between the need to (i) maximize the angular diameter of Venus and spatial resolution on the disk, and (ii) minimize Venus phase angle (Earth-Sun-Venus) and illuminated fraction as we only observe the day side.
Figure 1 represents the Venus disk as seen from Earth during observations. In this figure is represented each fiber displacement along the upper end Venus disk. The scanning sequences on Venus’s dayside hemisphere during the observation run is presented in Table 2.
The observing strategy has been to displace the entrance fiber of the spectrograph along points on the dayside hemisphere, while taking a reference point exposure between each sequence (reference point number 22, at the intersection of Equator and the null zonal Doppler meridian, as in Figure 1). Exposure times were adjusted at t = 3 s to obtain a S/N > 400 on the continuum and avoid saturation. The sequence of observation points (adjusting the fiber of ESPaDOnS to each positions as is Figure 1) is displayed in Table 2.

3. Doppler Velocimetry Technique

3.1. Summary

The Doppler velocimetry method used in this work was initially developed by Widemann et al. [25] and further improved and fine tuned by Machado et al. [8,26]. The technique has proven to be a reference on the retrieval of zonal and meridional wind at Venus’s cloud top, with both long slit and fiber-fed spectrographs, as shown in Machado et al. [26] (UVES/VLT), Machado et al. [8,10] (ESPaDOnS/CFHT) and Gonçalves et al. [12] (HARPS-N/TNG). A detailed description of the method can be found in Machado et al. [8,10].
The method uses visible Fraunhofer lines scattered by Venus’s cloud top. The Fraunhofer spectrum results from absorption of solar continuum radiation emitted from warmer, deeper layers, by atoms and molecules of the solar atmosphere, such as H, S, Si, Fe, Ba, Mg, CN [25]. The Doppler shift measured in solar light scattered on Venus dayside is the result of two instantaneous motions: (1) a motion between the Sun and Venus upper clouds particles, which scatter incoming radiation in all directions including the observer’s one (this Doppler velocity is minimal near Venus sub-solar point); (2) a motion between the observer and Venus clouds, resulting from the topocentric velocity of Venus cloud particles in the observer’s frame (this effect is minimal near Venus sub-terrestrial point). The measured Doppler shift is the combined effect of these instantaneous motions.
At half-phase angle (HPA), these two effects cancel out for the zonal component of the wind field, as the relative velocities of particles toward the source of incoming radiation and towards the observer cancel each other out (Figure 1, thick solid red line). For all points lying along this meridian we assume that the retrieved Doppler velocities cannot be attributed to a zonal component, thus, a non-zonal wind regime, such as meridional wind flow, should explain the Doppler shifts observed along the HPA meridian.
We therefore assumed that the Doppler shift residue retrieved along this meridian can be used to investigate the meridional wind flow. A χ 2 analysis yields a consistent result for a meridional flow pattern, with a marginal significance of the zonal component at the 2- σ level (we used the same protocol as in Machado et al. [10] and Gonçalves et al. [12]).
In this work, the positions along the HPA meridian (see Figure 1) were the points number 4, 10, 16, 22 (reference point), 28, 34 and 40, at ϕ ϕ E = 25 , covering the latitudes from 45 S to 45 N by steps of 5 .

3.2. Altitude Probed

The Doppler velocimetry technique is based on solar light scattered on Venus dayside. Therefore, the altitude of the retrieved horizontal velocities is approximately where optical depth unity is reached, which corresponds to the cloud top at around 70 km. [27,28]. Based on photometry and polarization, Hansen and Hovenier [29] determined that cloud top altitude, at visible range, is located at about 65–70 km, where an optical depth of unity ( τ = 1) is reached. Kawabata et al. [27] indicated that this level is about 40 mb pressure and 70 km altitude, based on a detailed analysis of Pioneer Venus OCPP UV and visible data. Using the depth of CO 2 bands in VEx/VIRTIS-M combined with VEx/VMC UV images, Ignatiev et al. [28] stated that the optical depth of the cloud haze is nearly 0.6 at 40 mbar, and varies with the wavelength as λ 1.7 , implying that a τ = 1 level is reached within one scale height of the clouds top roughly at 70 km of altitude, for the visible domain. Fedorova et al. [30] using SPICAV/VEx Vis-IR observations demonstrated that, for a fixed upper aerosol scale height for all latitudes, the cloud top altitude varies from 68 to 73 km at latitudes from 40 S to 40 N with an average of 70.2 ± 0.8 km.

3.3. Measurement Errors

On a fiber-fed spectrograph, such as ESPaDOnS, Doppler velocimetry technique relies on a sequential spectral acquisition on Venus disk. This allows us to monitor a reference point on Venus disk during observations, in order to correct the Doppler velocities retrieved from the instrumental spectral drift and/or spectral calibration variability with time. The reference point (point 22 as in Figure 1) was chosen as to be located along the equator and along the HPA meridian, so that both meridional and zonal components of the wind retrieved from Doppler velocity should be zero. This makes the reference point an ideal tracker of the spectral drift, as long as it is observed frequently during the observation run.
Any variation along time measured on the Doppler shift of the reference point will be assume to be caused by the spectral drift of the instrument. We fit all the reference point-22 velocities to a series of linear segments v t r e n d ( t ) , assuming the initial velocity of point-22 as the zero offset. Using this interpolated trend line, we can derive the offset caused by the spectrograph drift at any point in time, and therefore, correct this drifted offset to all the points observed, so that:
v i = v i v i , t r e n d
where each Doppler measurement v i is subtracted by the value of the trend v i , t r e n d at the time v i was observed, obtaining a spectral drift corrected velocity v i .
As in previous works [12], the confidence interval σ i on v i on a given line-of-sight Doppler measurement can be considered as an upper limit of the combined uncertainties: (i) the Th-Ar dispersion law uncertainty (instrument’s calibration lamp); (ii) the least-square deconvolution of Fraunhofer lines uncertainty; (iii) the fit to telluric lines method uncertainty; (iv) spectral changes due to temperature variations or spectrograph mechanical flexure; (v) the uncertainly resulting from guiding and pointing errors by the observer.
Note that both data points and the reference polynomial v t r e n d are affected by these combined uncertainties. Instead of determining each individual error contribution, we repeated three short-time exposures at each point, to test the internal consistency of the retrieved radial velocity. Considering that σ i is the error on the chosen reference point velocity relative to the measurement v i , therefore the statistical combined error at each point is σ i = σ t r e n d , i 2 + σ i 2 . To determine σ t r e n d , i 2 on the trend fitting function v t r e n d ( t ) at each point i, we linearly interpolated the error bar along the segment between two exposures of the reference point (point number 22, as in Figure 1). Following this method, the Doppler velocities retrieved in this work showed an upper limit for the estimated error, for both components of the wind, of the order of 10 ms 1 .
The error associated with the fiber’s field of view (FOV) drift during an exposure, along Venus’s disk, is bigger than the sum of all of the remaining uncertainties, since it will be propagated through the de-projection of line-of-sight shifts into horizontal zonal and meridional velocities. The observation run is thoroughly supervised, in situ and real time, by one of the researchers. If, during the 3 s exposure, the FOV of the fiber drifts away from the targeted point by more than a half of the fiber angular diameter, that exposure is discarded and repeated, until a total of 3 acceptable exposures is reached. This ensures a substantial containment of the errors caused from guiding and pointing drifts. The remaining error is further statistically reduced by observing the same point 3 times sequentially, for each time the point is being observed (see Table 2 for a detailed line-up of the observation strategy).
This method was used by Machado et al. [8,10], Widemann et al. [25] and Gonçalves et al. [12]. A more detailed explanation on the method can be found in Machado et al. [8,10].

3.4. Young Effect

Since Doppler velocimetry is based on solar Fraunhoffer lines, we must consider a systematic error caused by the finite angular size of the Sun. Points near the terminator of Venus are unequally illuminated by the approaching and receding equatorial limbs of the Sun. The effect is due to the large, ∼1 deg angular size of the Sun seen from Venus. A different elevation of receding and approaching solar limbs produce an apparent redshift (blueshift) due to excess radiation from the receding (approaching) solar limb at evening (morning) terminator. The excess of one or the other will affect the apparent spectral shifts measured across the Venus disk at high solar zenithal angle (SZA), i.e., near terminator and in the polar regions [8,26,31].
Young [32] proposed the empirical relation Y = 3.2 tan ( φ ) , where Y is the actual error in ms 1 , φ is the SZA at planetocentric latitude and longitude. This equation was used by Machado et al. [8,10] and Gonçalves et al. [12]. However, Gaulme et al. [33], in its extensive study on Doppler velocimetry on Venus and how to address the limb darkening issue, suggested the use of the following equation.
Δ V Y ( φ , θ ) = Y ( Λ ) sin ( θ ) cos ( φ )
where φ is the SZA (angle of solar incidence), θ is the inclination of the solar rotation axis with respect to the local horizon and Y ( Λ ) is a coefficient dependent on the wavelength. We used Y for a wavelenght of 550 nm, which corresponds to Y = 2.88 (see Gaulme et al. [33] and Allen [34]). While the previous equation was valid only for the equator, this new approach to the Young effect actually extends its validity to the entire planet’s disk and effectively reduces the associated error; therefore, we applied this equation on this work. However, the introduction of this new calculus only impacted the Young effect on the meridian closer to the evening terminator, ϕ ϕ E = 20 and by a factor of 1 % .

4. Results

4.1. Zonal Wind

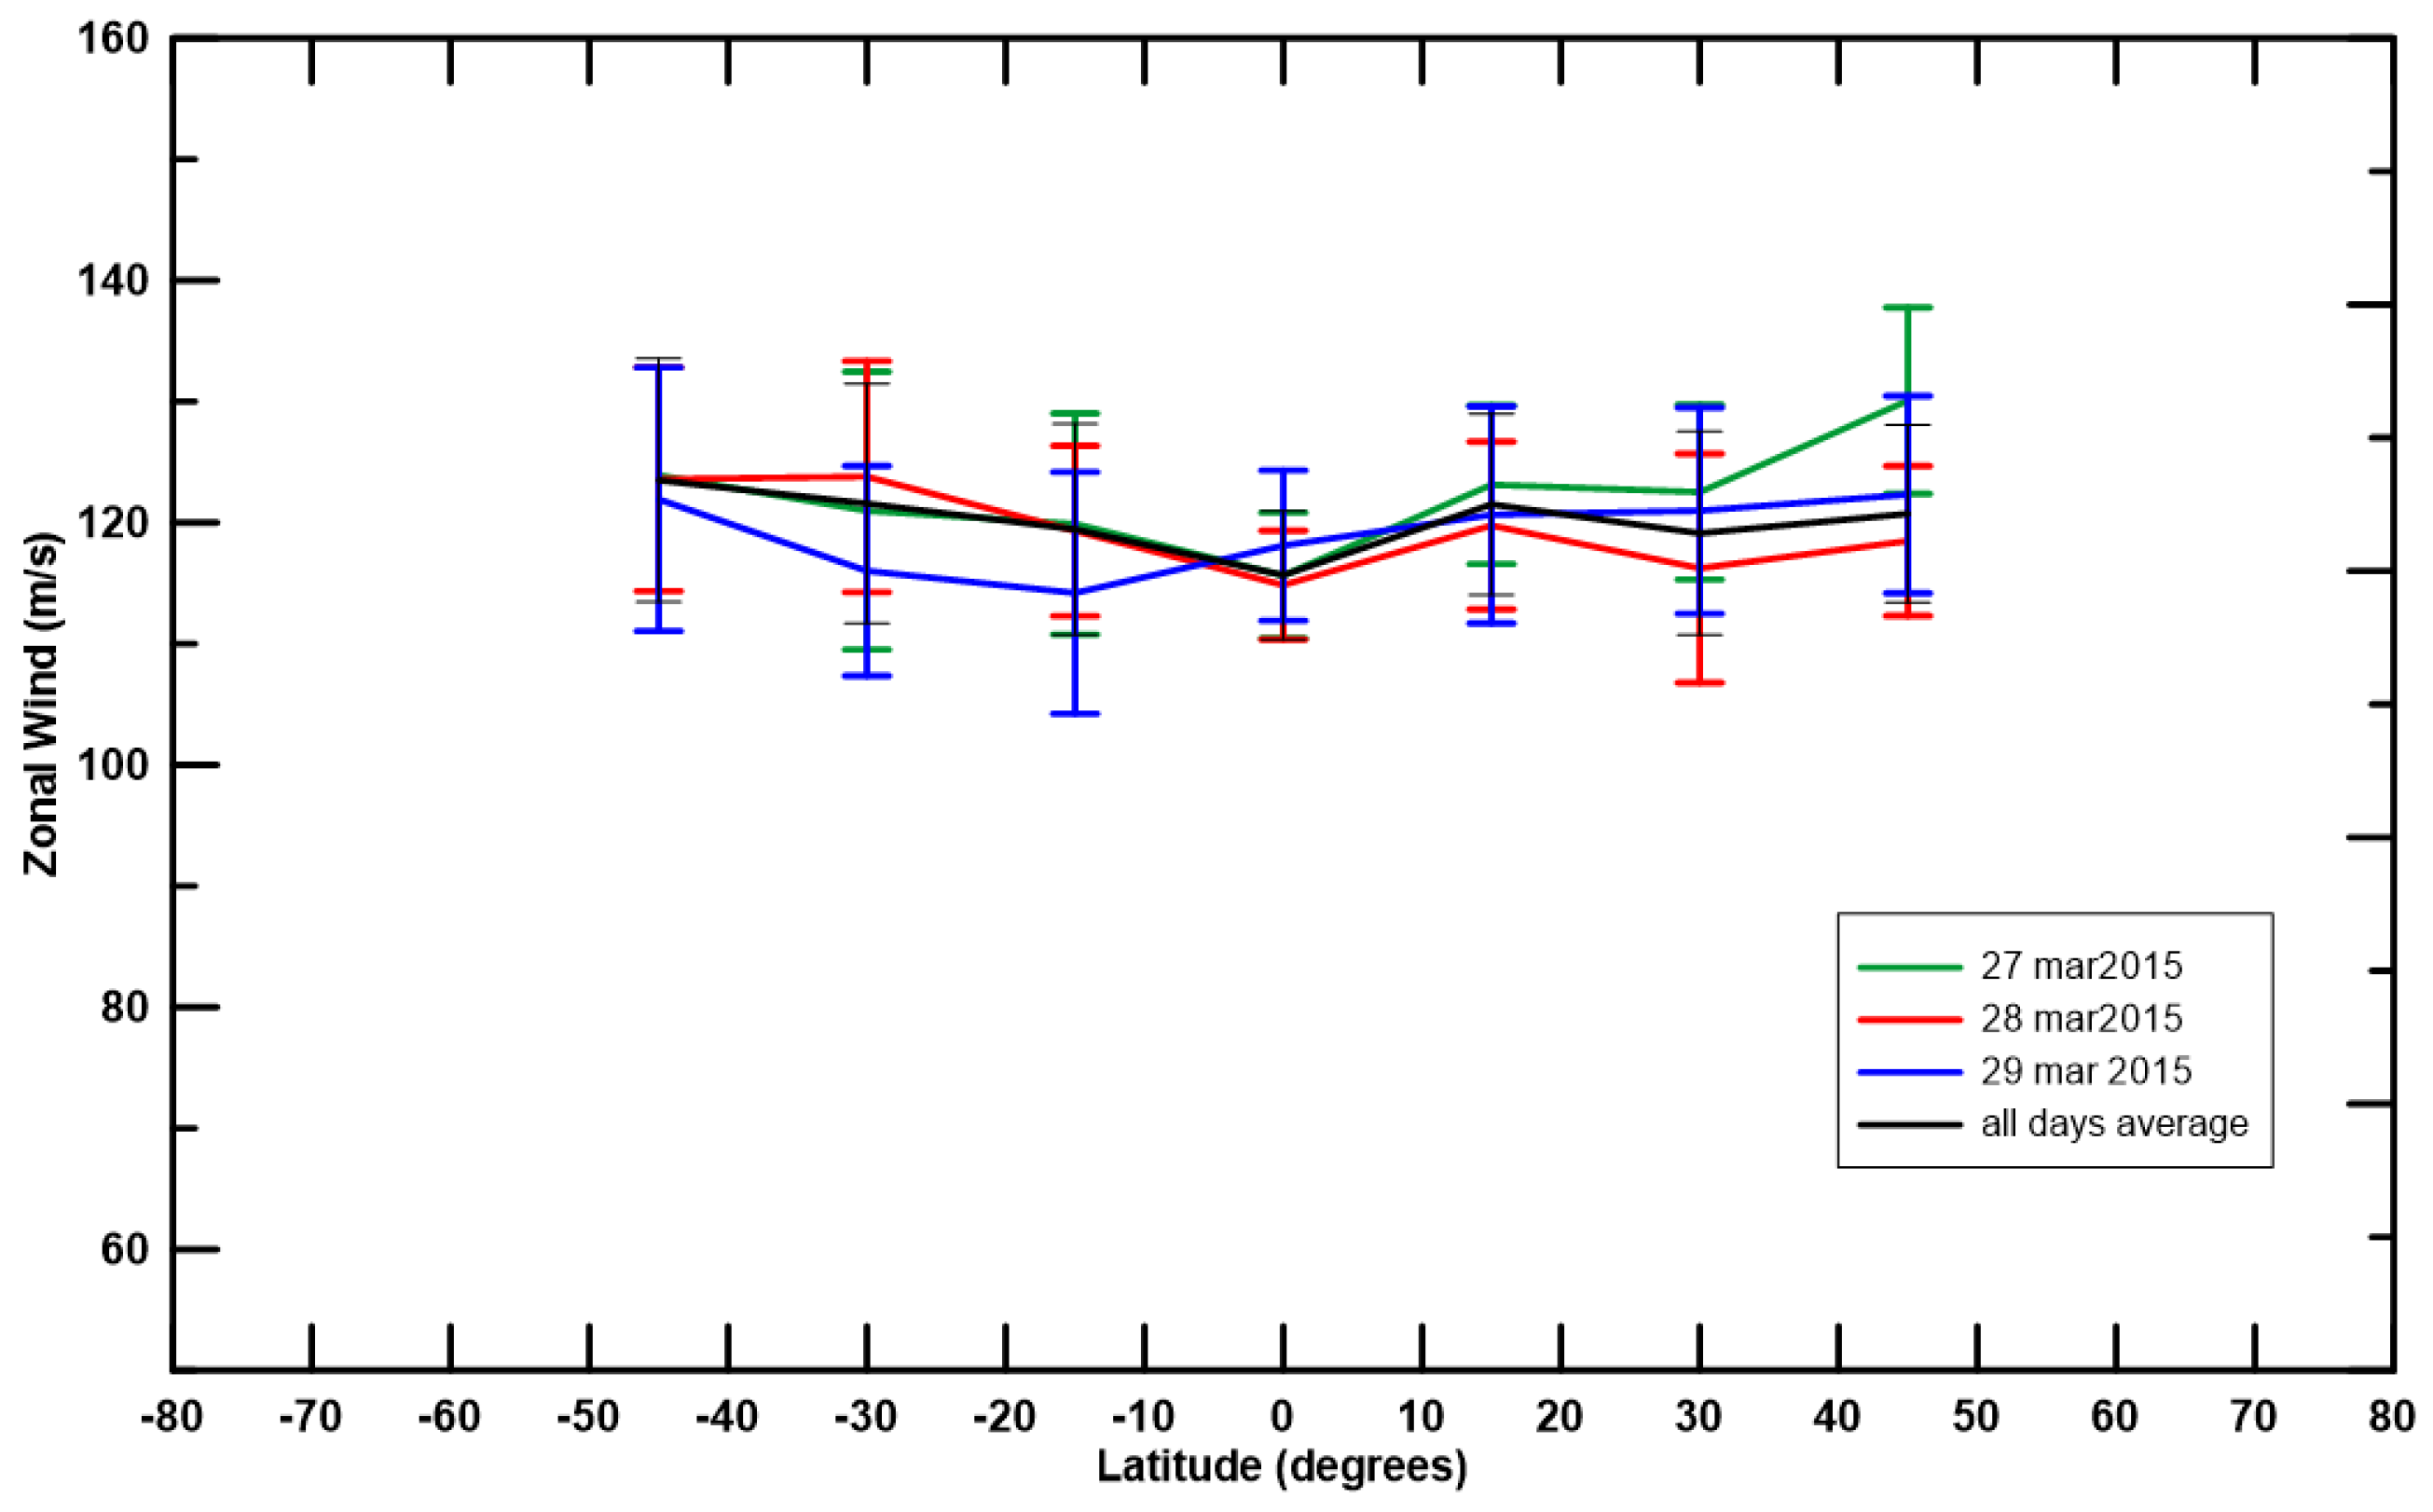
First we applied the required corrections and weighted averaged all the measures of each position of the same day, for each day, using the inverse of the variance associated to each velocity measurement as the weighing coefficients. Then we applied the theoretical models for each wind circulation—(1) zonal wind, under the assumption of a pure zonal wind system for all data points with latitudes between 45 S– 45 N, (2) and the same procedure for meridional wind, under the assumption of a pure meridional wind system for all points located at the HPA meridian ( ϕ ϕ E = 25 ), using the same method as described by Machado et al. [8,10], Gonçalves et al. [12]. The zonal wind latitudinal profile of each day of observation, as seen in Figure 2, was obtained by weighted averaging each point along the same latitude for each day.
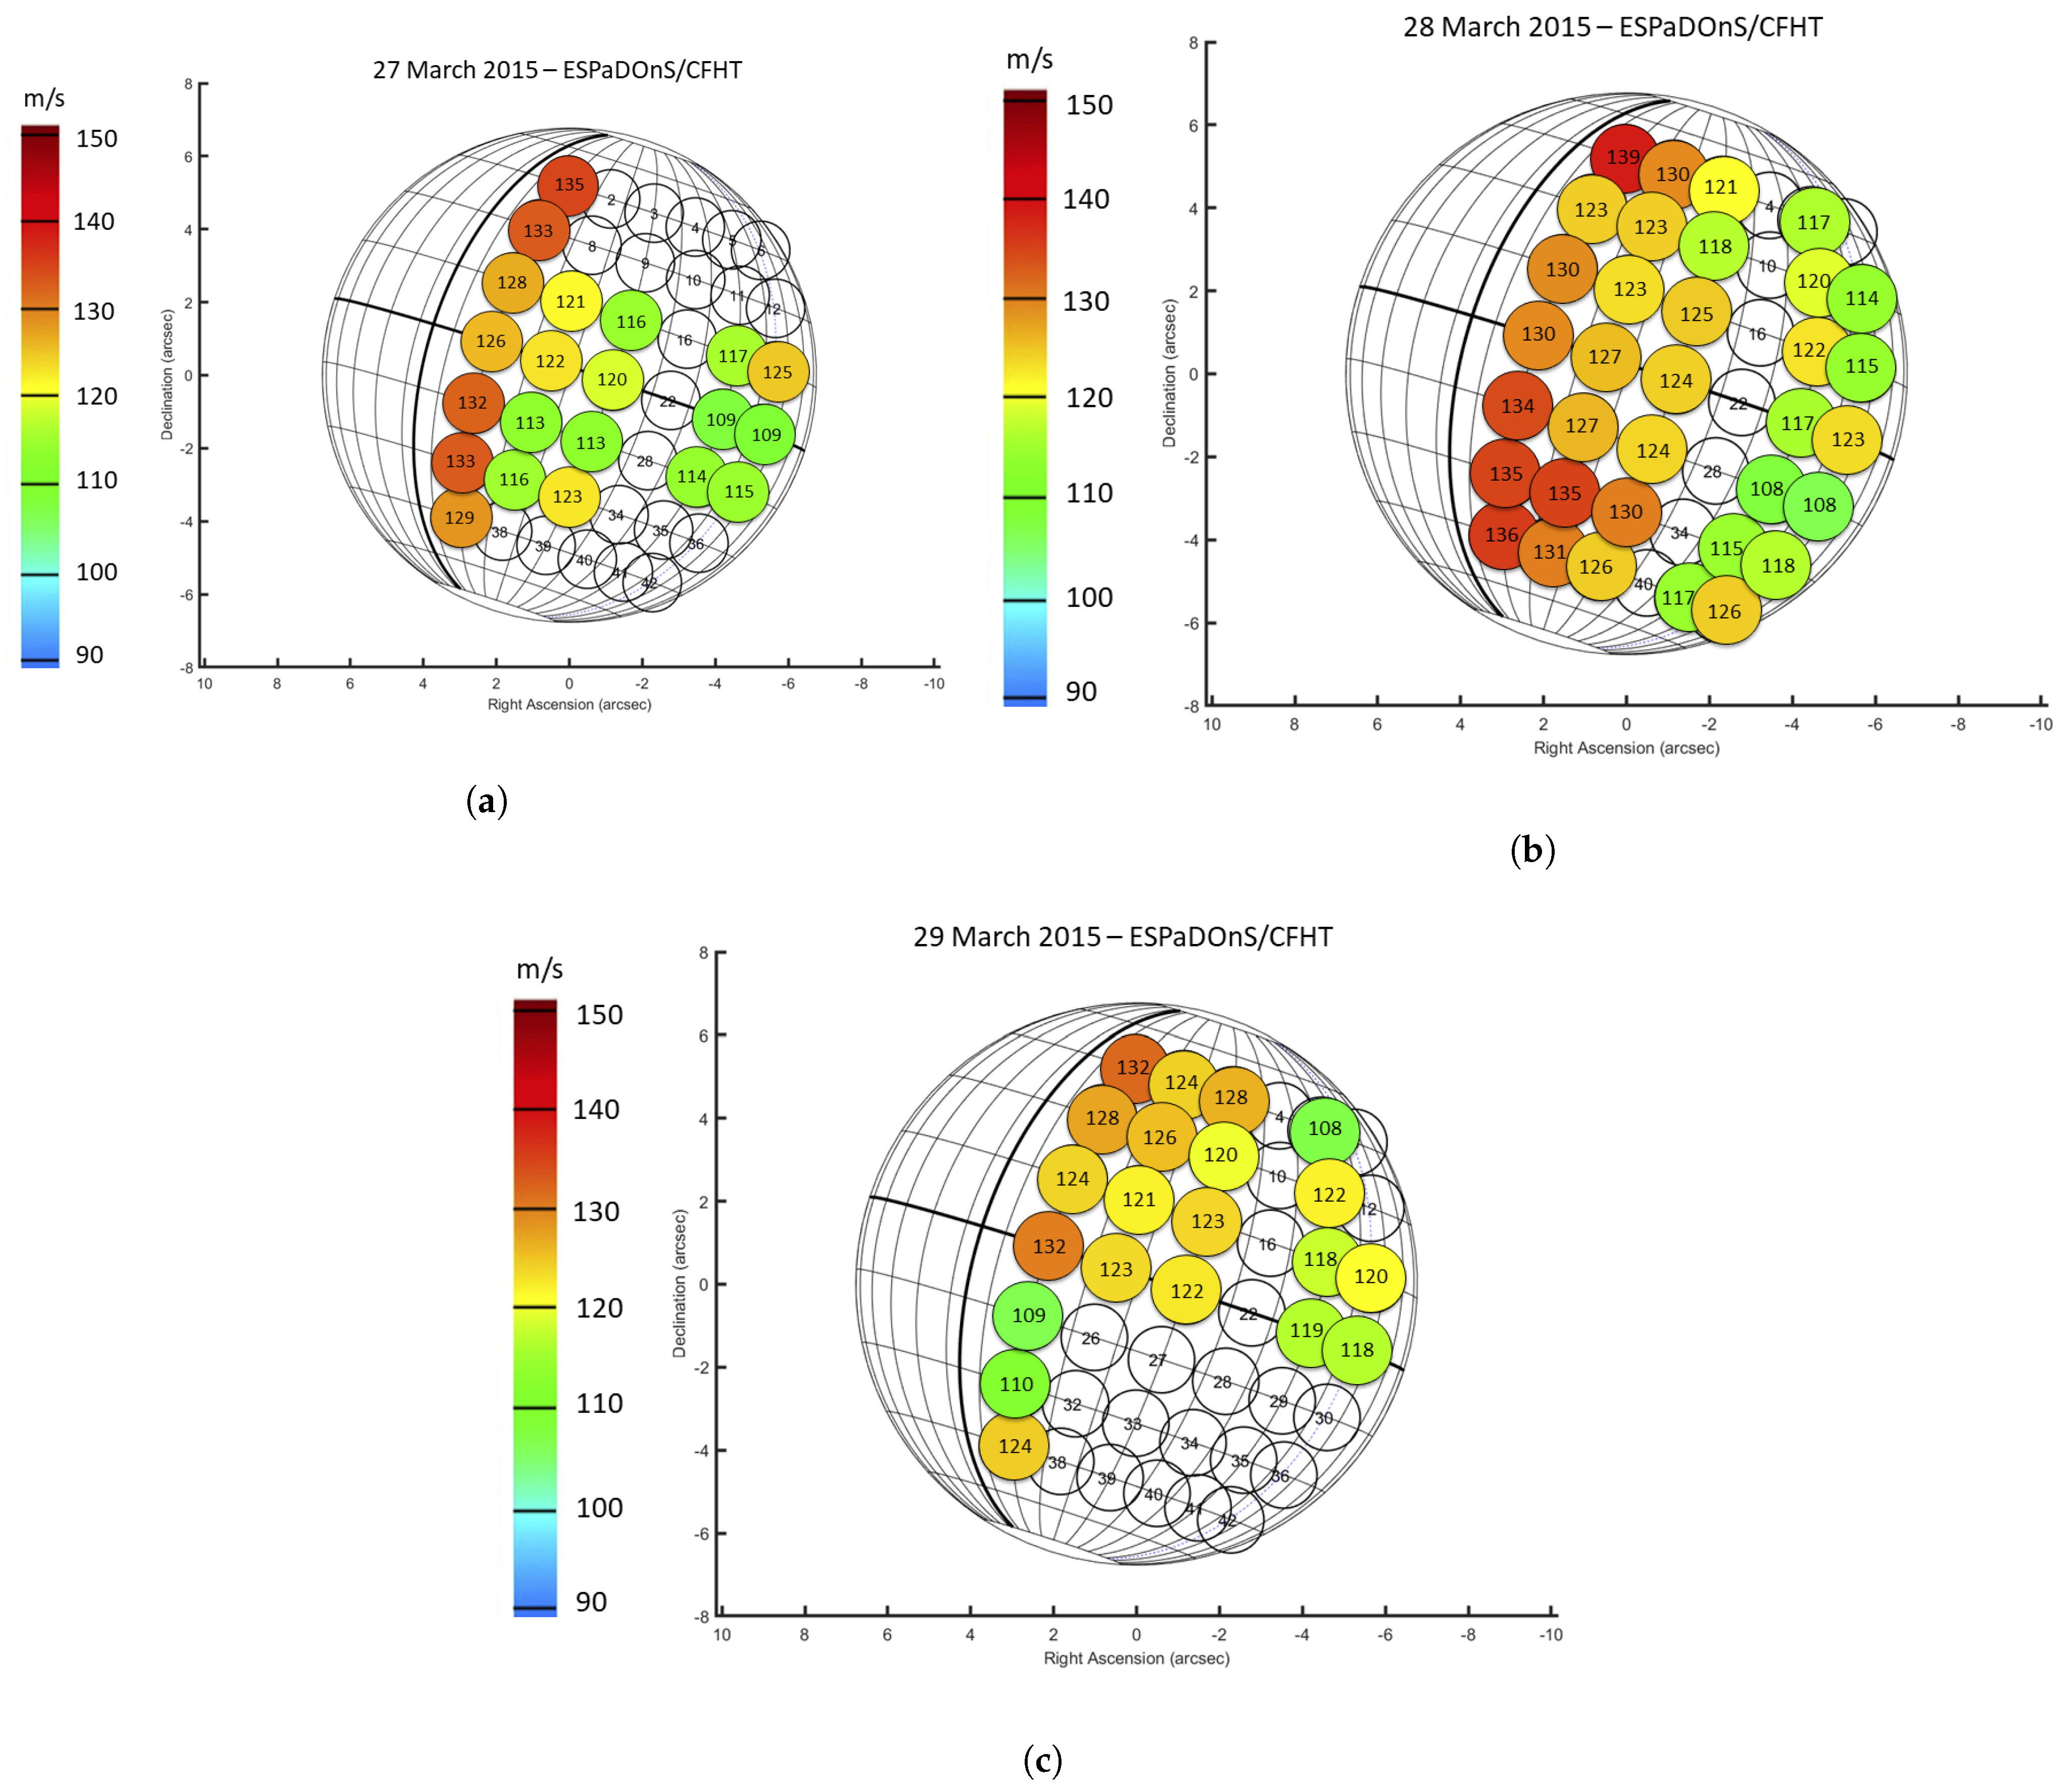
The zonal wind velocity obtained for each FOV position for each day of observation is displayed in Figure 3. Since the zonal component of the wind cannot be retrieved in the HPA (see Section 3.1), this meridian does not present any zonal velocities. The HPA meridian was used to retrieve meridional wind velocities.
No unambiguous conclusion can be made regarding daily variability of the latitudinal wind profile since all variability present in Figure 2 is within the uncertainty of the measurements.
All profiles present lower and homogeneous velocities near equator (latitudes between 10 S– 10 N). Although the profile suggests an increase of around ∼ 5–10 ms 1 up to 45 N and S, these values are within the associated errors, therefore, no unambiguous conclusion can be inferred.
The mean values of the zonal wind velocities (averaged on all points on the same sub-Earth longitude/local time and for all days of observation) are 129, 123, 122, 116 and 118 ms 1 , with an uncertainty of the order of 10 ms 1 , for the corresponding local time meridians of 16:55, 15:55, 14:55, 12:55 and 11:55. The meridian closer to the evening terminator ( ϕ ϕ E = 20 , 16:55 local time) presents zonal velocities on average higher by 15 ms 1 when compared with the mean zonal wind measured at meridians within 1 h ( 15 longitude) from the sub-solar meridian (as shown in Figure 3). However, for the results from 29 March, this difference is ambiguous and within the uncertainty margin.

4.2. Meridional Wind

The meridional wind was obtained by observing several points along the HPA meridian. We used these data to retrieve mean meridional wind for those positions (positive velocities in the northern hemisphere and negative velocities in the southern hemisphere both reflect poleward motion).
The HPA meridian corresponds to points 4, 10, 16, 22, 28, 34 and 40, all located at ϕ ϕ E = 25 (Figure 1). A poleward meridional wind component is determined within the 2- σ statistical significance by selecting the line-of-sight measurements on HPA meridian.
Figure 4 presents the meridional wind for each day of observations (27–29 March 2015) and the average of all days (in black). The meridional profile is consistent within all three days of observations; no daily variability can be unambiguously inferred. The profile presents peak velocities at 45 , in the order of 25 ms 1 .

5. Discussion

The Doppler velocimetry method we used is identical to the method used in Machado et al. [8,10] and Gonçalves et al. [12]. Only one adaptation was made regarding the Young effect correction where we introduced an approach suggested by Gaulme et al. [33].
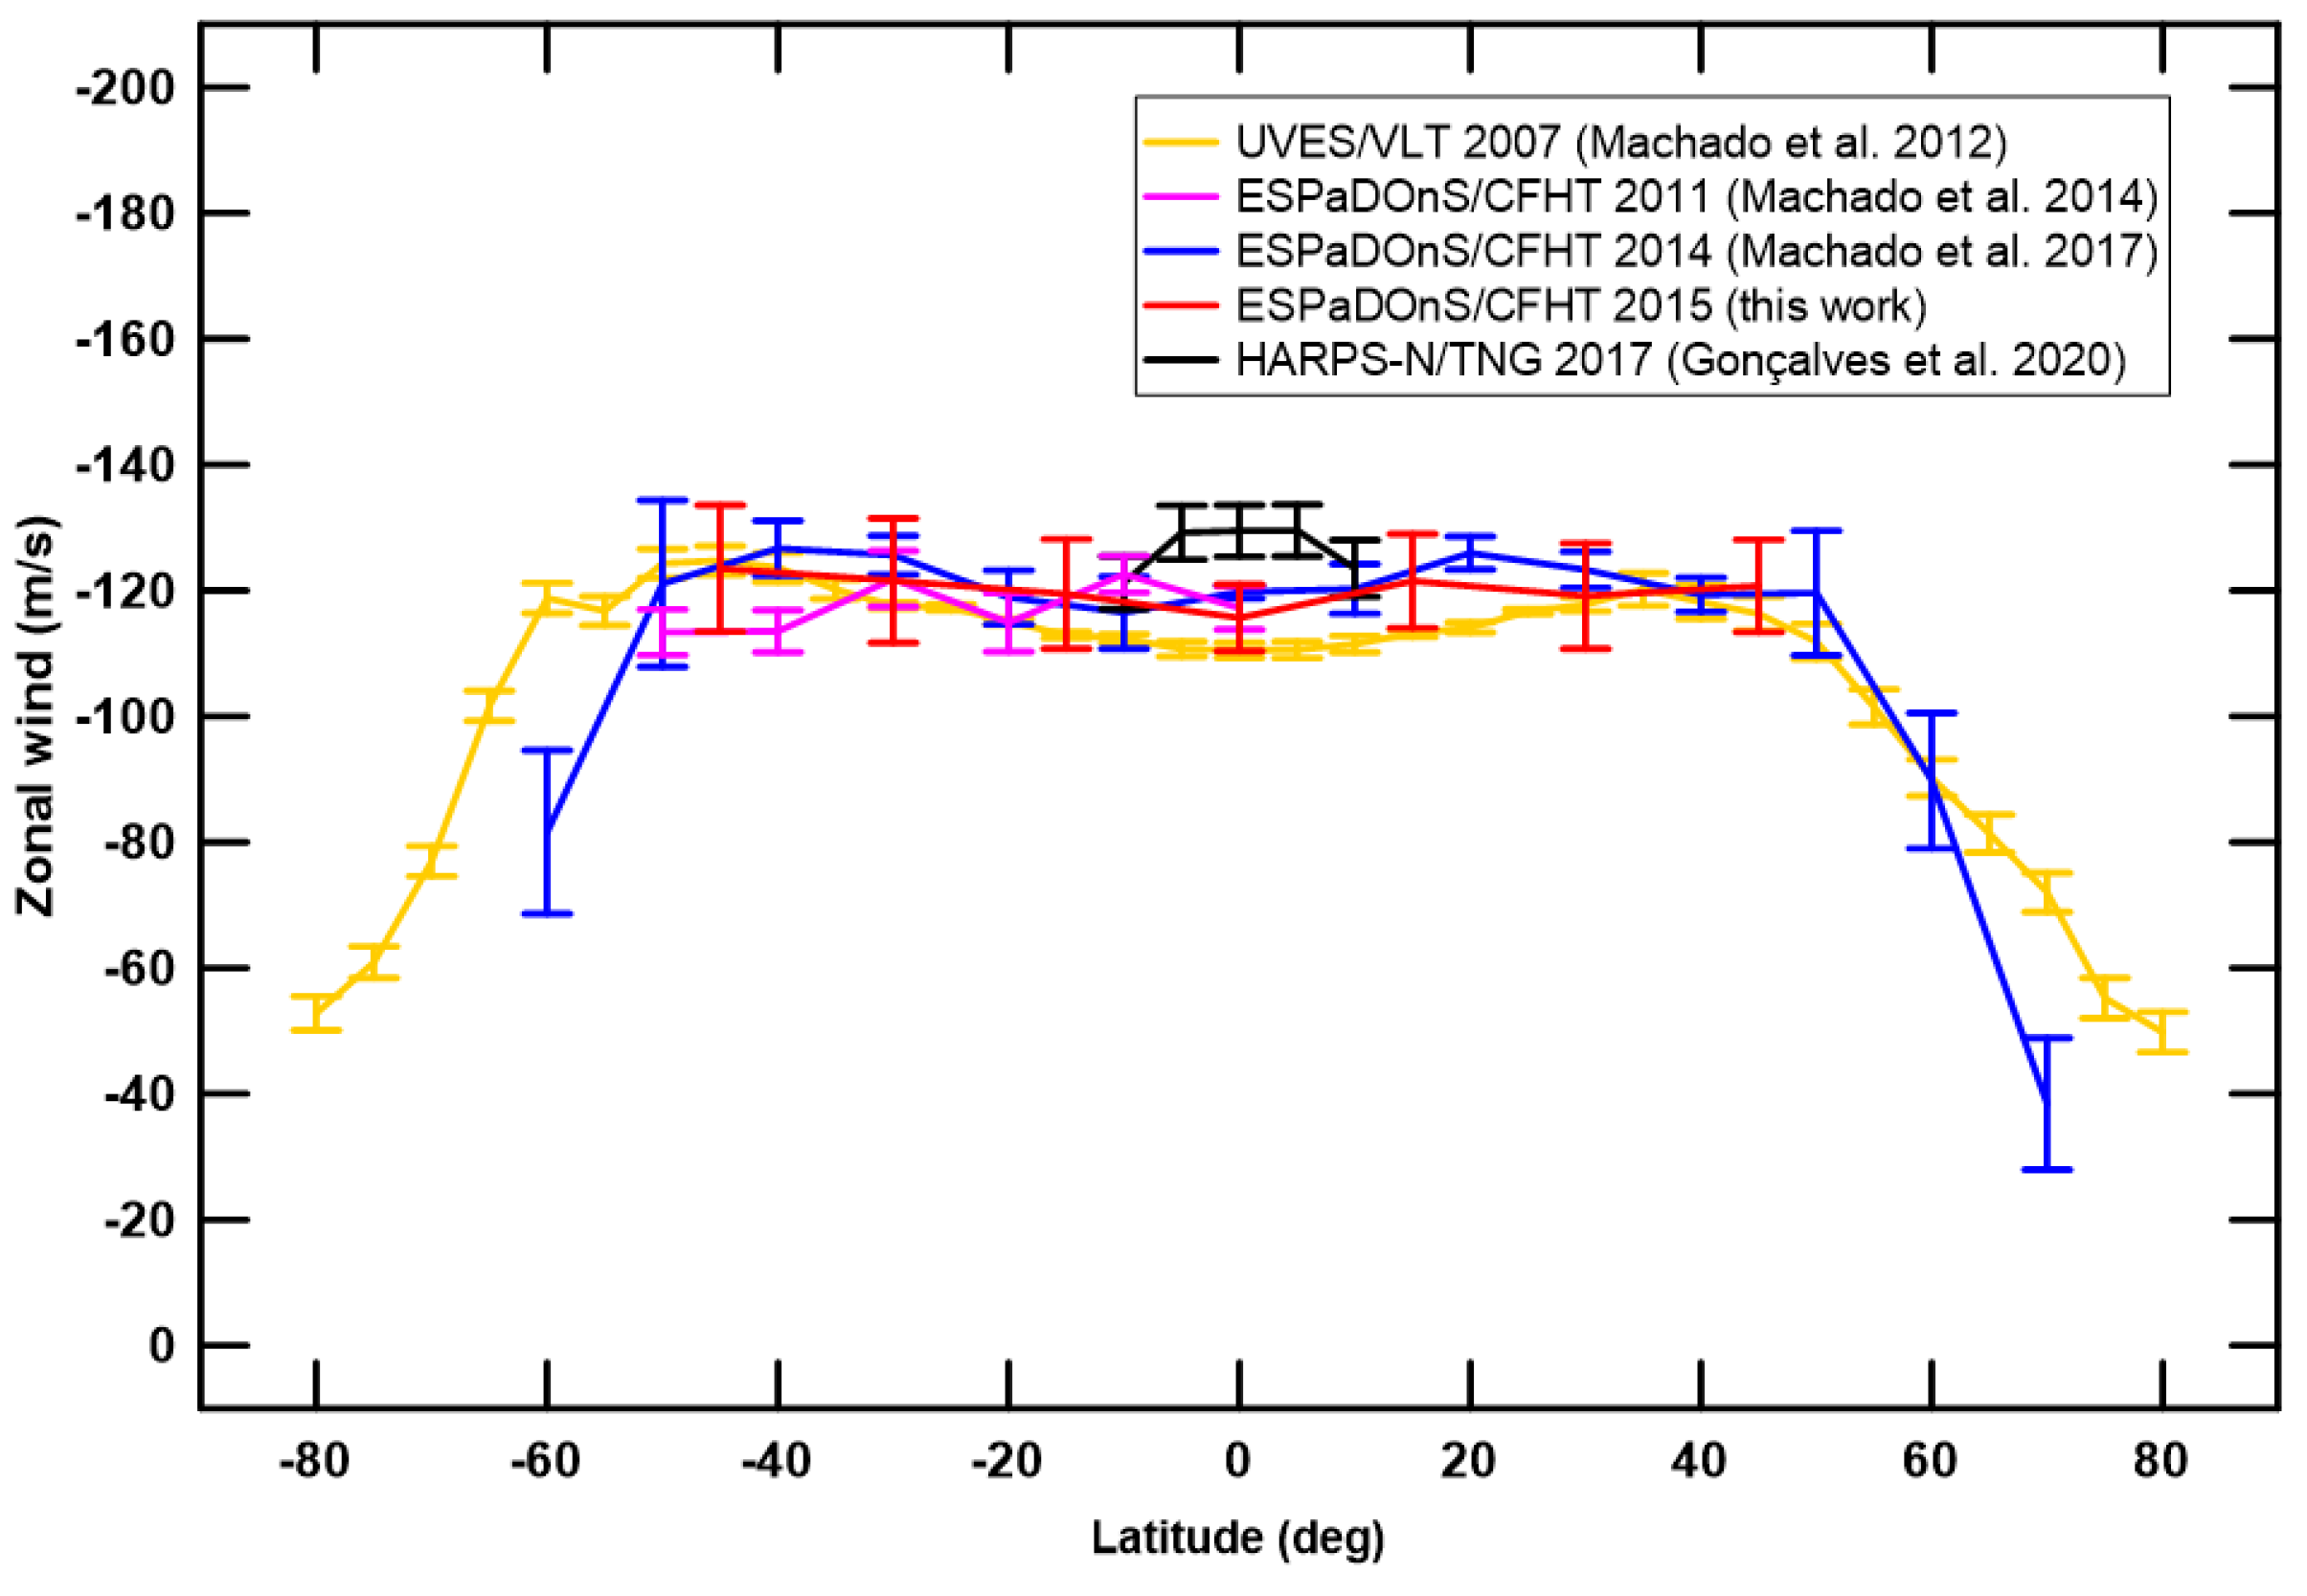
The latitudinal profile of the zonal wind retrieved in this work is consistent with previous Doppler velocimetry results using the same method, as seen in Figure 5. Although this work did not provide observations at latitudes higher than 45 , the zonal wind profile shows consistency with previous data for the latitudes observed. There is no significant variability in zonal wind within the associated uncertainty, with the exception of the data from Gonçalves et al. [12].
Regarding local-time variability, there is evidence of an increase in the magnitude of the zonal wind velocity near the evening terminator (Figure 3). The meridian closer to the evening terminator ( ϕ ϕ E = 20 , 16:55 local time) presents zonal velocities on average higher by 15 ms 1 when compared with the mean zonal winds measured at meridians within 1 h ( 15 sub-Earth longitude) from the sub-solar meridian (as shown in Figure 3). The magnitude of this increase is consistent with the zonal wind variation with local time detected by Horinouchi et al. [11], where an increase of 12–15 ms 1 is shown between 12 h and 16 h local time. Since the averaged zonal wind calculated for each local time band is affected by an uncertainty of at most 10 ms 1 in our Doppler velocities, and cloud-tracked averaged zonal winds were obtained by Horinouchi et al. [11] with an uncertainty of around 4–8 ms 1 , we can state that the increase of zonal wind close to the terminator is in fact relevant.
A combination of vertical wind shear and local-time dependence of temperature and wind structures associated with the thermal tide may explain this increase in zonal wind closer to the terminator, as already discussed by several authors [7,9,11,24].
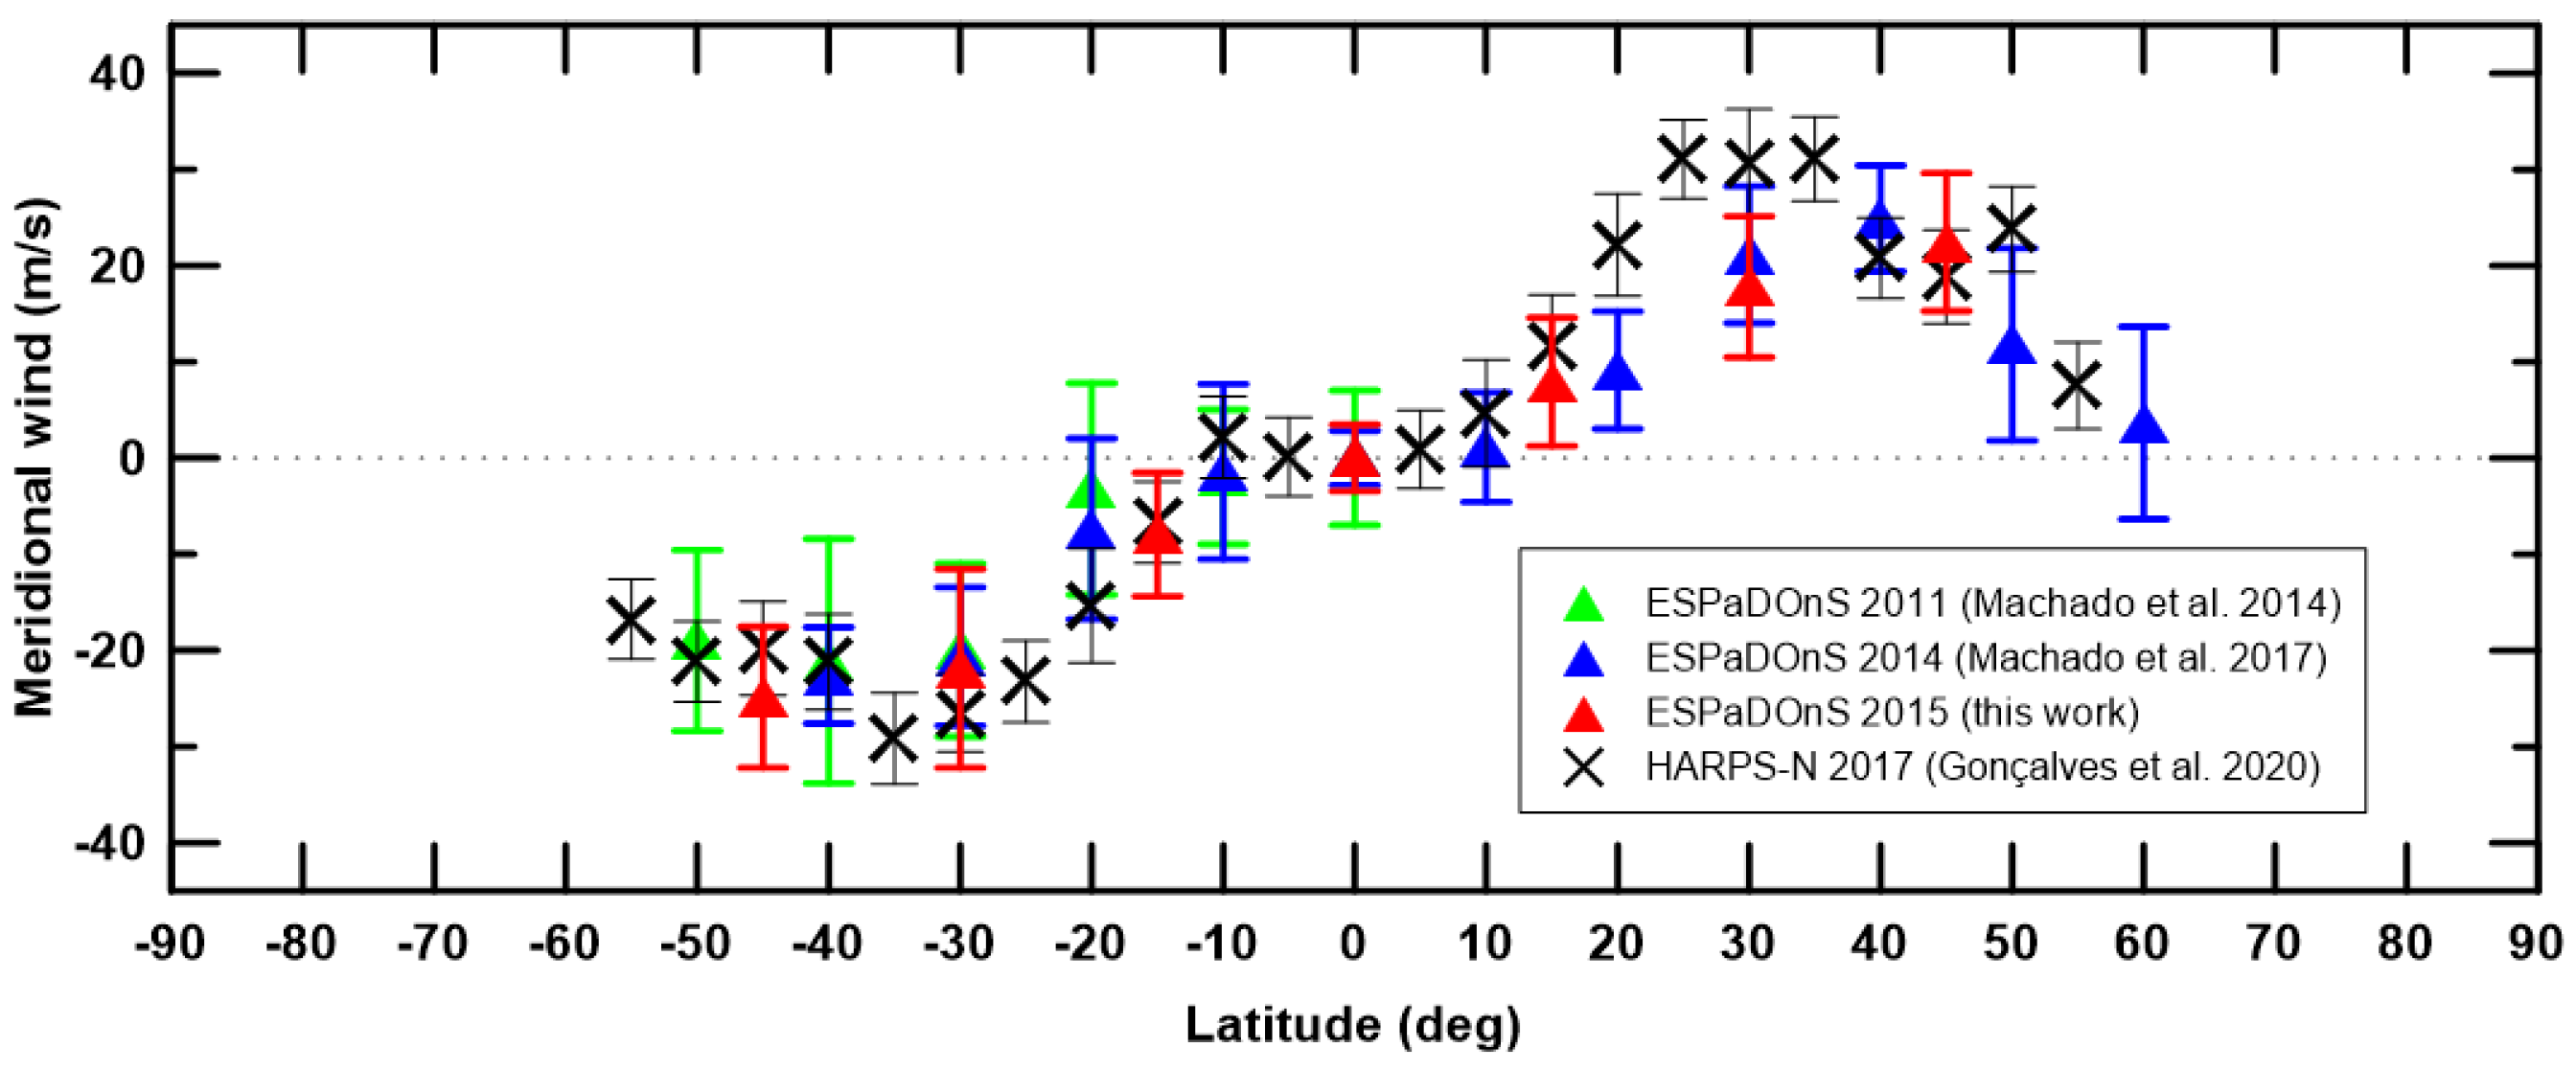
The meridional wind profiles of multiple Doppler velocimetry results are shown in Figure 6, where we present results from Machado et al. [8,10] (with ESPaDOnS/CFHT) and Gonçalves et al. [12] (with HARPS-N/TNG). All these results were retrieved using the same method. This work’s meridional profile is consistent with previous Doppler velocimetry measurements, all presenting a profiles with (1) peak velocities (∼30 ms 1 ) at around 40 , (2) wind speed decreases at latitudes higher than 50 and (3) null velocities at lower latitudes (< 10 ).
The precision of the results obtained was negatively affected by the large size of the FOV of the instrument in comparison with Venus’s disk. Observations made with an higher phase angle (lower illumination fraction) would present a bigger angular diameter of Venus disk, allowing a more precise measure of zonal wind. However, in such conditions (larger phase angle) the HPA meridian would be located further way from the sub-Earth point and closer to the limb, at higher longitudes. This would represent a lower precision in our meridional wind measurements, since the placement of FOV of the instrument along the HPA would be covering a larger area of the atmosphere when compared with a meridian closer to sub-Earth geometry.
We note that retrieved winds, both zonal and meridional, are assumed to result from scattering of visible light at a cloud-top altitude of about 65–70 km, where the optical depth is one. However, as suggested by Hueso et al. [9], Venus’s cloud top seems to be located in a region (58–70 km) of high vertical wind shear above a region of small wind shear (58–48 km). It is also possible that Doppler observations could be probing altitudes of ∼72 km, in a region of even higher vertical wind shear than the regions below, while cloud-tracking UV observations were probing altitudes of 68–70 km. Considering cloud top Doppler results from Machado et al. [10], with an average of 120 ms 1 placed at 70 km, and cloud-tracking NIR data from Hueso et al. [9], with an average of 65 ms 1 placed at 58 km, we obtain a linear vertical wind shear of about 4.6 ms 1 per km. It could be argued that a fraction of wind variations measured at an accuracy of ∼10 ms 1 could result from a cloud top altitude variation and not necessarily by actual atmospheric circulation. However, considering the different spatial scales involved in latitude, longitude and local time, it is likely that such a study would require simultaneous measurements of cloud top height (e.g., from an orbiter mission, Cottini et al. [35]). Such a study would be of high interest both to modeling and future investigations.
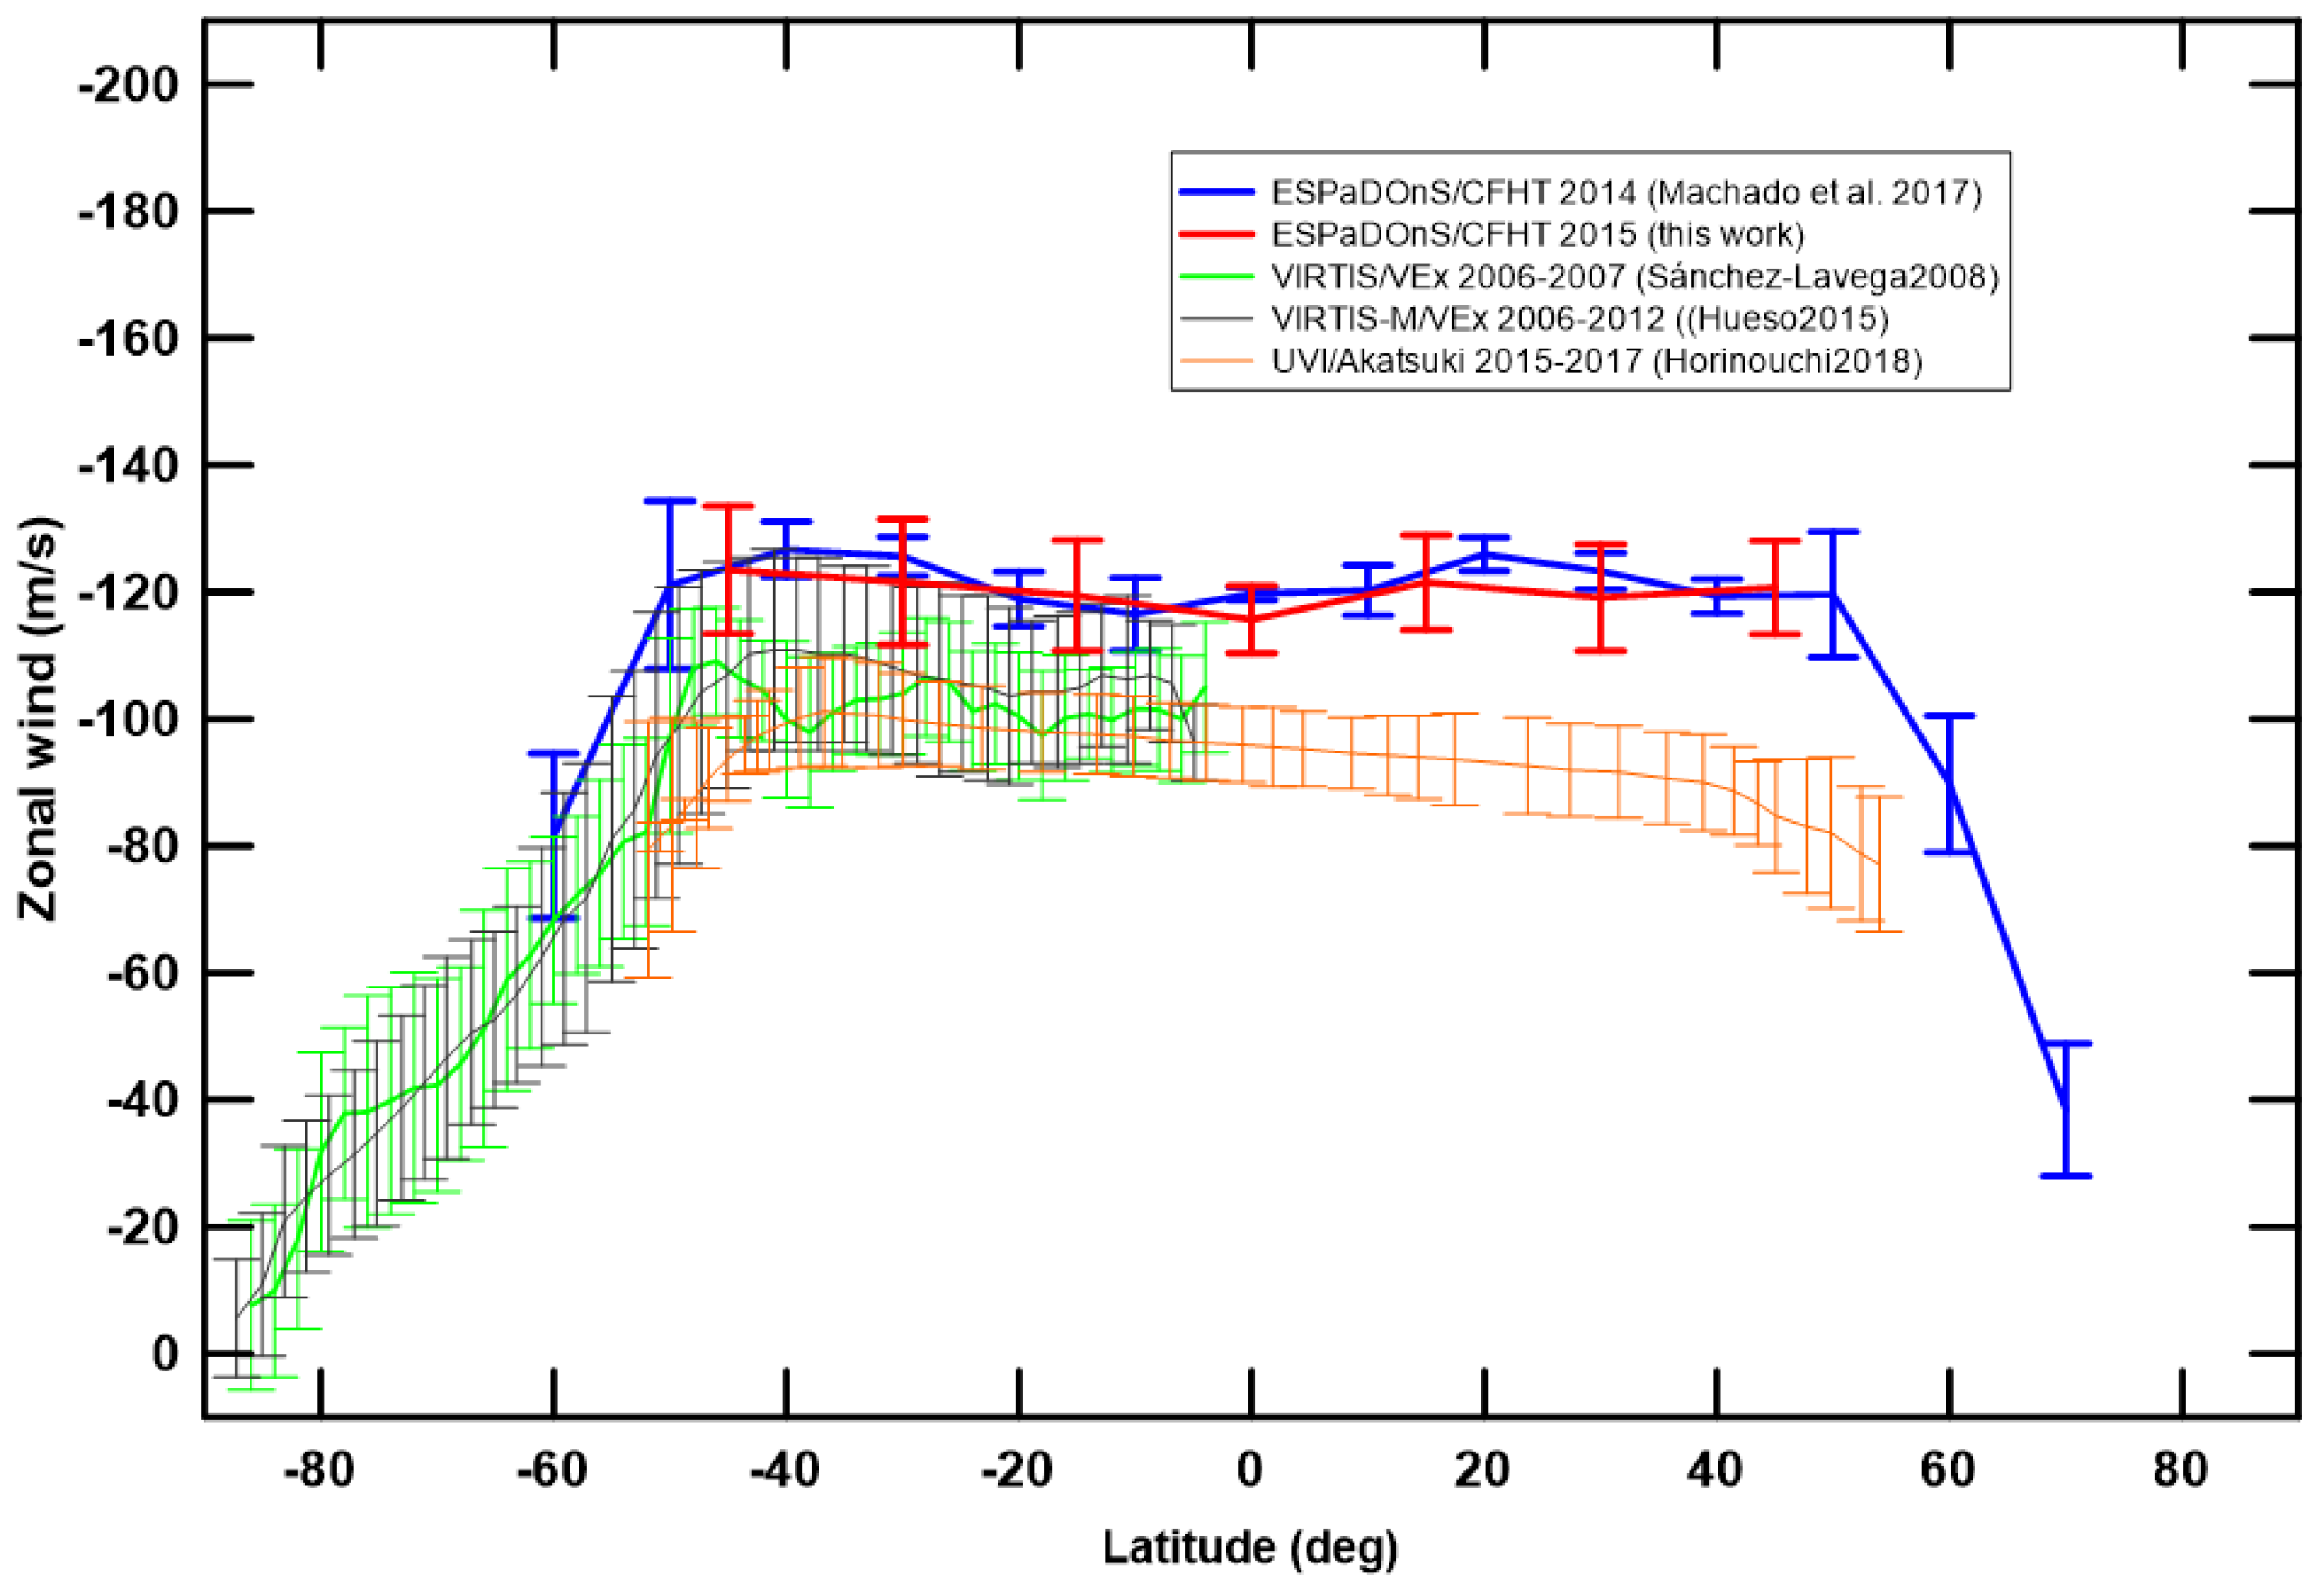
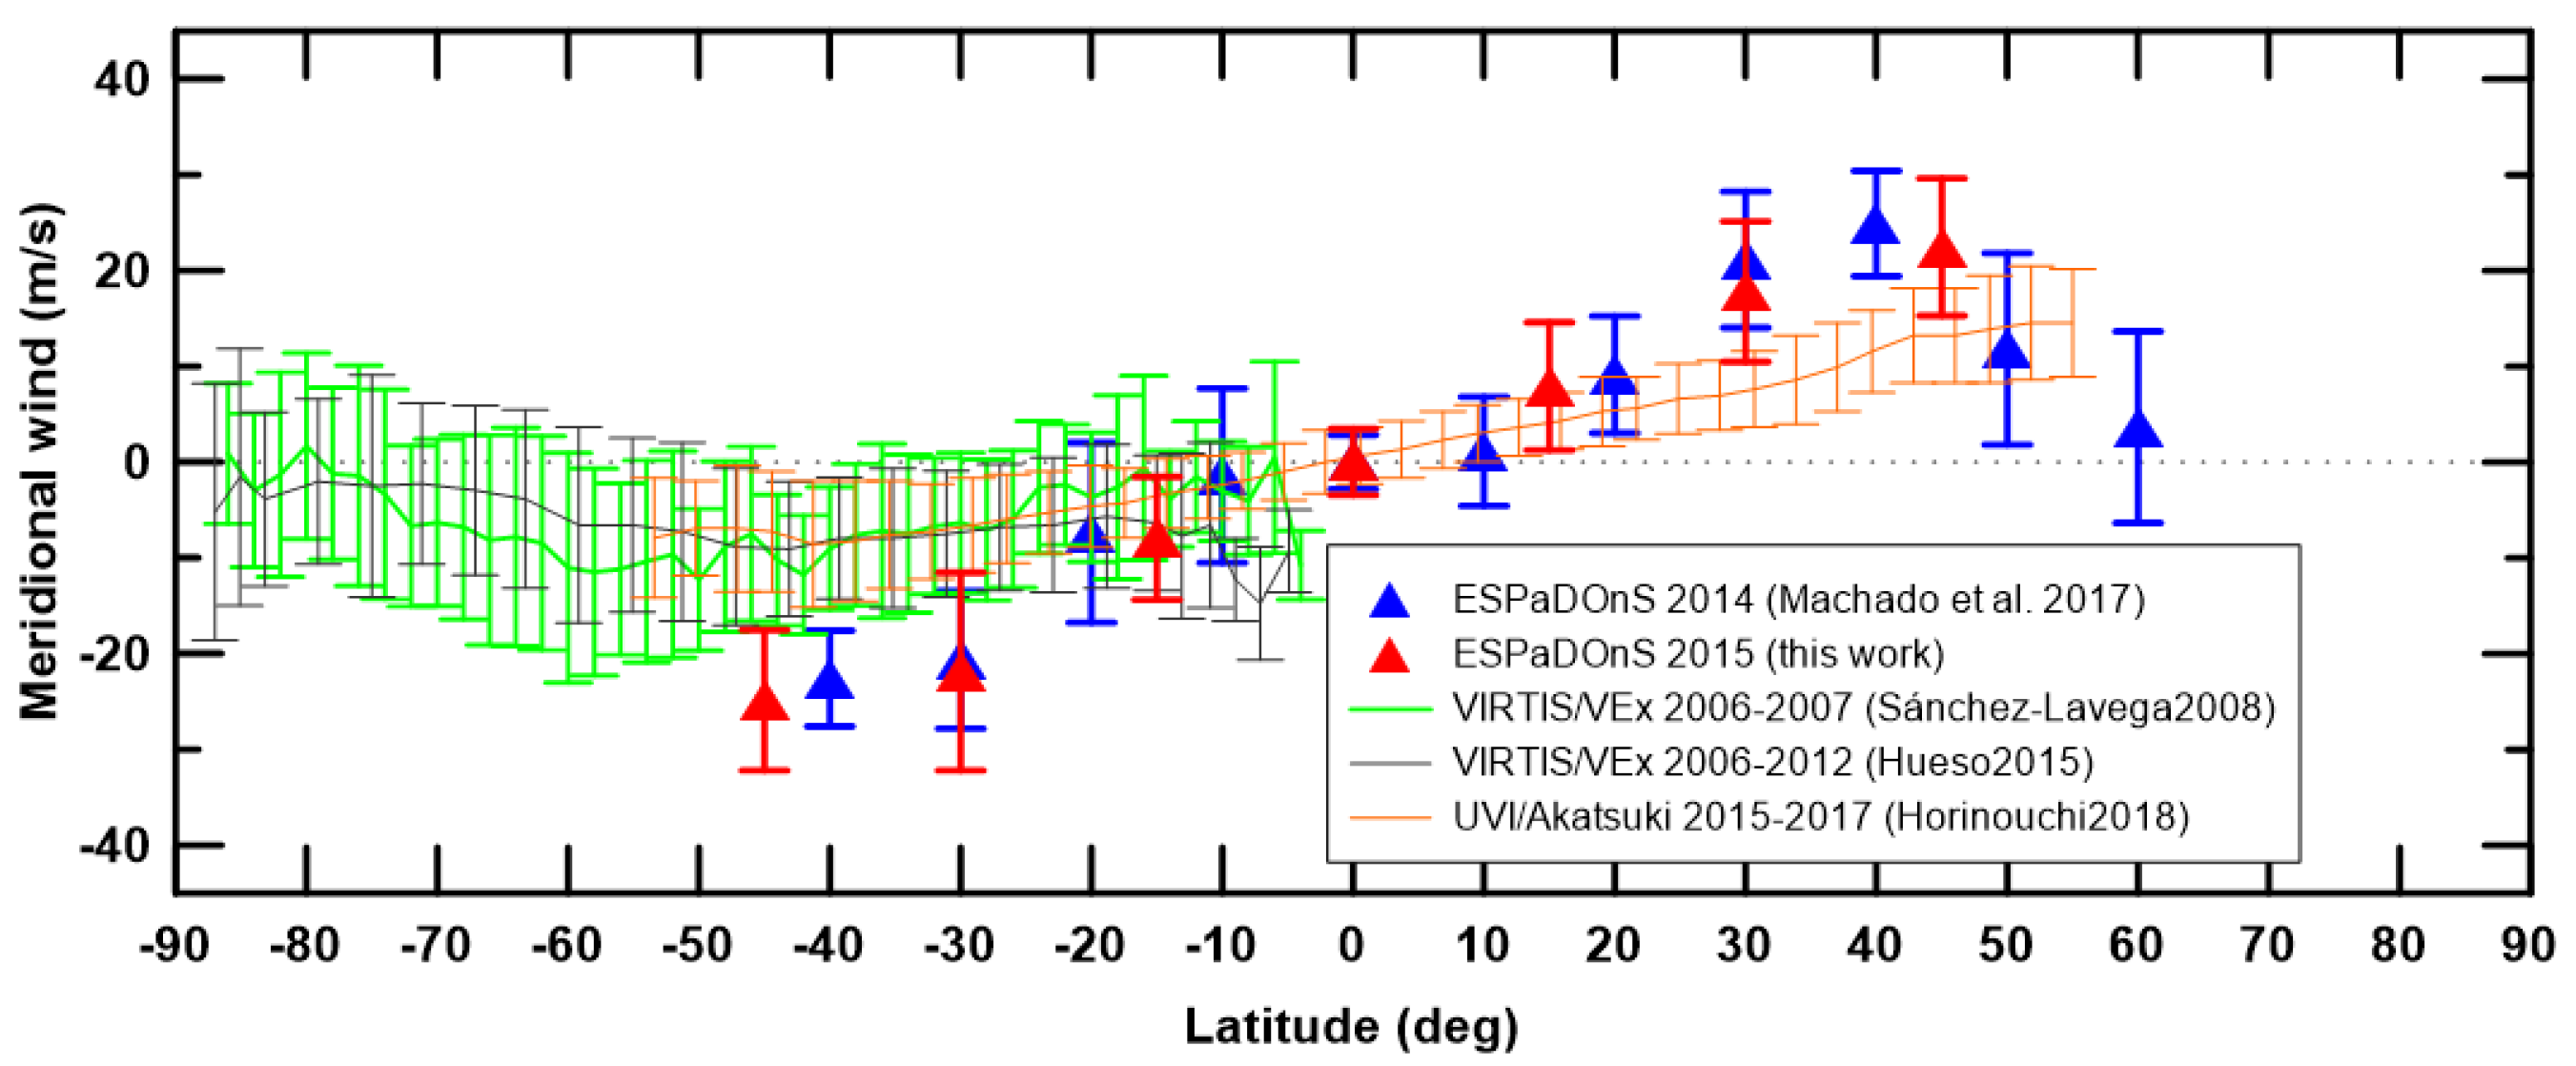
Figure 7 and Figure 8 present comparisons between zonal and meridional wind results (respectively) from several ground and space observations. The ground observations correspond to this work, data from march 2015, and Machado et al. [10], data from april 2014, both using the same method and the same instrument (ESPaDOnS/CFHT). The results from space observations, using the cloud-tracking technique, include data from VIRTIS-M/Venus Express 2006–2012 [7,9] and UVI/Akatsuki 2015–2017 [11].
As for the meridional wind, the comparison between Doppler and cloud-tracking results (see Figure 8) also suggests that the former could be probing a higher altitude, where the upper branch of meridional circulation peaks. GCM models, such as Takagi et al. [24], predict that the region between 65 and 75 km presents a high vertical wind shear, which could explain the differences between Doppler and cloud-tracking meridional wind profiles. However, said model does not predict a steep decrease of the meridional wind upwards of 50 , as shown by Doppler results. Additional meridional wind measurements are essential to better constrain its profile at high latitudes and further improve GCM data.
These comparisons show consistency in between results from the same technique. However, there is a difference in zonal wind speed between Doppler and cloud-tracking data, the former presenting velocities pf 10–15 ms 1 . For the meridional wind, Doppler results present peak velocities of 10 ms 1 —higher when compared with cloud-tracking results. These differences in wind speed suggest that the techniques might be probing winds at slightly different altitudes. A difference in altitude of up to 2–3 km could be enough to represent a zonal wind variability of around 10–15 ms 1 [36].

6. Conclusions

This work is based on three days of observations at the CFHT using its ESPaDOnS spectrograph. The Doppler velocimetry method we used is identical to the method used in Machado et al. [8,10] and Gonçalves et al. [12]. This technique has been successfully used to retrieve zonal and meridional wind at Venus’s cloud top, where the velocity of the superrotation regime peaks. This new zonal and meridional wind measurements present new the opportunity to access (1) daily and spatial (latitude and local-time) zonal wind variability, (2) wind variability across time and (3) the consistency of results provided by the Doppler velocimetry method.
These March 2015 measurements provide valuable and unique data to constrain horizontal winds at the cloud top level, since Doppler velocimetry was the only available method to do so in a period when no space mission was orbiting Venus between Venus Express’s end in January 2015 and Akatsuki’s orbit insertion in December 2015. The frequent survey of horizontal winds is essential to constrain both short and long term variability, allowing a more comprehensive understanding of the dynamics of Venus’s atmosphere.
Spatial variability of zonal wind is also shown, with an increase of velocities up to 15 ms 1 near the evening terminator, at ϕ ϕ E = 20 . This is consistent with previous works, both with observational data and modelization, as in Sánchez-Lavega et al. [7], Hueso et al. [9], Horinouchi et al. [11], Takagi et al. [24].
Daily zonal wind variability cannot be unambiguously inferred from our results (Figure 3), since the variability shown (around 5 ms 1 ) is contained within the uncertainty interval. This is also the case for meridional wind daily variability; no variability can be inferred considering the associated errors.
The latitudinal profile of meridional wind presents null velocities at lower latitudes, below 10 N–S, and peak velocities of ∼30 ms 1 ) at around 40 , consistent with previous Doppler results (Figure 6).
Both zonal and meridional wind profiles are consistent with our previous Doppler velocimetry studies, using the same observing technique and retrieval method. This demonstrates the efficiency and viability of the method in the retrieval of wind velocities at the cloud top of Venus’s atmosphere and the robustness of our detection and characterization of meridional wind latitudinal profiles.
When comparing this work’s results with previous Doppler observations, with the exception of the 2017 data from Gonçalves et al. [12], there is an absence of unambiguous temporal variability (Figure 5 and Figure 6). This suggests a long-term stability of Venus’s dynamics for the period of time under study, 2011–2015.
The comparison of Doppler and cloud-tracking results from different datasets, suggest that Doppler winds consistently reach higher velocities, up to 20 ms 1 for zonal wind and up to 10 ms 1 for meridional wind (Figure 7 and Figure 8). This suggests that the Doppler technique might be probing a higher altitude than the one probed by space observations using cloud-tracking. Considering the vertical wind shear at cloud top level, a difference of up to 2–3 km could be enough to explain a wind variation of around 15 ms 1 [36].
Additional measurements of horizontal winds with a wide spatial coverage would be extremely relevant to the study of zonal wind variation with local time and to address what the behavior of the wind is when crossing from the night hemisphere to the dayside and vice-versa. Further dynamical studies will also help to (i) constrain long term variability of zonal wind, (ii) constrain zonal wind variation with local time, particularly near the terminator (evening and morning) and (ii) characterize meridional flow and its contribution to the superrotation of Venus’s atmosphere.

Author Contributions

Conceptualization, R.G. and P.M.; Data curation, T.W., F.B. and J.R.; Formal analysis, P.M.; Investigation, R.G. and P.M.; Methodology, R.G., P.M. and T.W.; Software, F.B. and J.R.; Supervision, P.M.; Visualization, F.B. and J.R.; Writing—original draft, R.G. and P.M.; Writing—review and editing, T.W. All authors have read and agreed to the published version of the manuscript.

Funding

This research received no external funding.

Data Availability Statement

Data available in a publicly accessible repository. The data presented in this study are openly available in “Data_Goncalves2020”, Mendeley Data, V1, doi:10.17632/7gzv7hc7kg.1, http://dx.doi.org/10.17632/7gzv7hc7kg.1.

Acknowledgments

We acknowledge support from the Portuguese Fundação Para a Ciência e a Tecnologia (reference PD/BD/128019/2016 and reference PTDC/FIS-AST/29942/2017) through national funds and by FEDER through COMPETE 2020 (reference POCI-509 01-0145 FEDER-007672).

Conflicts of Interest

The authors declare no conflict of interest.

References

  1. Svedhem, H.; Titov, D.; Taylor, F.; Witasse, O. Venus as a more Earth-like planet. Nature 2007, 450, 629–632. [Google Scholar]
  2. Gierasch, P.J.; Goody, R.M.; Young, R.E.; Crisp, D.; Edwards, C.; Kahn, R.; Rider, D.; Del Genio, A.; Greeley, R.; Hou, A.; et al. The General Circulation of the Venus Atmosphere: An Assessment. Venus II: Geology, Geophysics, Atmosphere, and Solar Wind Environment; Tucson, A.Z., Bougher, S.W., Hunten, D.M., Phillips, R.J., Eds.; University of Arizona Press: Tucson, AZ, USA, 1997; pp. 459–500. [Google Scholar]
  3. Schubert, G.; Bougher, S.; Covey, C.; Del Genio, A.; Grossman, A.; Hollingsworth, J.; Limaye, S.; Young, R. Venus Atmosphere Dynamics: A Continuing Enigma, in Exploring Venus as a Terrestrial Planet; Esposito, L.W., Stofan, E.R., Cravens, T.E., Eds.; American Geophysical Union: Washington, DC, USA, 2007; pp. 101–120. [Google Scholar]
  4. Sánchez-Lavega, A.; Lebonnois, S.; Imamura, T.; Read, P.; Luz, D. The Atmospheric Dynamics of Venus. Space Sci. Rev. 2017, 212, 1541–1616. [Google Scholar]
  5. Read, P.L.; Lebonnois, S. Superrotation on Venus, on Titan, and Elsewhere. Annu. Rev. Earth Planet. Sci. 2018, 46, 175–202. [Google Scholar]
  6. Nakamura, M.; Imamura, T.; Ishii, N.; Abe, T.; Kawakatsu, Y.; Hirose, C.; Satoh, T.; Suzuki, M.; Ueno, M.; Yamazaki, A.; et al. AKATSUKI returns to Venus. Earth Planets Space 2016, 68, 75. [Google Scholar] [CrossRef] [Green Version]
  7. Sánchez-Lavega, A.; Hueso, R.; Piccioni, G.; Drossart, P.; Peralta, J.; Pérez-Hoyos, S.; Wilson, C.F.; Taylor, F.W.; Baines, K.H.; Luz, D.; et al. Variable winds on Venus mapped in three dimension. Geophys. Res. Lett. 2008, 35, 13204. [Google Scholar]
  8. Machado, P.; Widemann, T.; Luz, D.; Peralta, J. Wind circulation regimes at Venus’ cloud tops: Ground-based Doppler velocimetry using CFHT/ESPaDOnS and comparison with simultaneous cloud tracking measurements using VEx/VIRTIS in February 2011. Icarus 2014, 243, 249–263. [Google Scholar]
  9. Hueso, R.; Peralta, J.; Garate-Lopez, I.; Bados, T.V.; Sánchez-Lavega, A. Six years of Venus winds at the upper cloud level from UV, visible and near infrared observations from VIRTIS on Venus Express. Planet. Space Sci. 2015, 113–114, 78–99. [Google Scholar]
  10. Machado, P.; Widemann, T.; Peralta, J.; Gonçalves, R.; Donati, J.; Luz, D. Venus cloud-tracked and Doppler velocimetry winds from CFHT/ESPaDOnS and Venus Express/VIRTIS in April 2014. Icarus 2017, 285, 8–26. [Google Scholar]
  11. Horinouchi, T.; Kouyama, T.; Lee, Y.J.; Murakami, S.; Ogohara, K.; Takagi, M.; Imamura, T.; Nakajima, K.; Peralta, J.; Yamazaki, A. Mean winds at the cloud top of Venus obtained from two-wavelength UV imaging by Akatsuk. Earth Planets Space 2018, 70, 10. [Google Scholar]
  12. Gonçalves, R.; Machado, P.; Widemann, T.; Peralta, J.; Watanabe, S.; Yamazaki, A.; Satoh, T.; Takagi, M.; Ogohara, K.; Lee, Y.J.; et al. Venus’ cloud top wind study: Coordinated Akatsuki/UVI with cloud tracking and TNG/HARPS-N with Doppler velocimetry observations. Icarus 2020, 335, 113418. [Google Scholar] [CrossRef]
  13. Limaye, S. Venus Atmospheric Circulation: Known and unknown. J. Geophys. Res. Planets 2007, 112, E04S09. [Google Scholar]
  14. Lebonnois, S.; Lee, C.; Yamamoto, M.; Dawson, J.; Lewis, S.R.; Mendonca, J.; Read, P.; Parish, H.F.; Schubert, G.; Bengtsson, L.; et al. Models of Venus Atmosphere. In Towards Understanding the Climate of Venus. ISSI Scientific Report Series; Springer: New York, NY, USA, 2013; Volume 11, p. 129. ISBN 978-1-4614-5063-4. [Google Scholar]
  15. Horinouchi, T.; Hayashi, Y.Y.; Watanabe, S.; Yamada, M.; Yamazaki, A.; Kouyama, T.; Taguchi, M.; Fukuhara, T.; Takagi, M.; Ogohara, K.; et al. How waves and turbulence maintain the super-rotation of Venus’ atmosphere. Science 2020, 368, 405–409. [Google Scholar] [PubMed]
  16. Gierasch, P. Meridional circulation and the maintenance of the Venus atmospheric rotation. J. Atmos. Sci. 1995, 32, 1038. [Google Scholar]
  17. Luz, D.; Berry, D.L.; Piccioni, G.; Drossart, P.; Politi, R.; Wilson, C.F.; Erard, S.; Nuccilli, F. Venus’s Southern Polar Vortex Reveals Precessing Circulation. Science 2011, 332, 577–580. [Google Scholar]
  18. Garate-Lopez, I.; Hueso, R.; Sanchez-Lavega, A.; Peralta, J.; Piccioni, G.; Drossart, P. A chaotic long-lived vortex at the southern pole of Venus. Nat. Geosci. 2013, 6, 254–255. [Google Scholar]
  19. Moissl, R.; Khatuntsev, I.; Limaye, S.S.; Titov, D.V.; Markiewicz, W.J.; Ignatiev, N.I.; Roatsch, T.; Matz, K.D.; Jaumann, R.; Almeida, M.; et al. Venus cloud top winds from tracking UV features in Venus Monitoring Camera. J. Geophys. Res. 2009, 114, E00B31. [Google Scholar]
  20. Kouyama, T.; Imamura, T.; Nakamura, M.; Satoh, T.; Futaana, Y. Long-term variation in the cloud-tracked zonal velocities at the cloud top of Venus deduced from Venus Express VMC images. J. Geophys. Res. Planets 2013, 118, 37–46. [Google Scholar] [CrossRef]
  21. Khatuntsev, I.V.; Patsaeva, M.V.; Titov, D.V.; Ignatiev, N.I.; Turin, A.V.; Limaye, S.S.; Markiewicz, W.J.; Almeida, M.; Roatsch, T.; Moissl, R. Cloud level winds from the Venus Express Monitoring Camera imaging. Icarus 2013, 226, 140–158. [Google Scholar]
  22. Patsaeva, M.V.; Khatuntsev, I.V.; Patsaev, D.V.; Titov, D.V.; Ignatiev, N.I.; Markiewicz, W.J.; Rodin, A.V. The relationship between mesoscale circulation and cloud morphology at the upper cloud level of Venus from VMC/Venus Express. Planet Space Sci. 2015, 113, 100–108. [Google Scholar]
  23. Gaulme, P.; Schmider, F.-X.; Widemann, T.; Gonçalves, I.; Ariste, A.-L.; Gelly, B. Atmospheric circulation of Venus measured with visible imaging spectroscopy at the THEMIS observatory, Astron. Astrophys 2019, 627, A82. [Google Scholar]
  24. Takagi, M.; Sugimoto, N.; Ando, H.; Matsuda, Y. Three-Dimensional Structures of Thermal Tides Simulated by a Venus GCM. J. Geophys. Res. 2018, 123, 335–352. [Google Scholar] [CrossRef]
  25. Widemann, T.; Lellouch, E.; Donati, J.F. Venus Doppler winds at cloud tops observed with ESPaDOnS at CFHT. Planet. Space Sci. 2008, 56, 1320–1334. [Google Scholar] [CrossRef]
  26. Machado, P.; Luz, D.; Widemann, T.; Lellouch, E.; Witasse, O. Characterizing the atmospheric dynamics of Venus from ground-based Doppler velocimetry. Icarus 2012, 221, 248–261. [Google Scholar] [CrossRef]
  27. Kawabata, K.; Coffeen, D.; Hansen, J.; Lane, W.; Sato, M.; Travis, L. Cloud and haze properties from Pioneer Venus polarimetry. J. Geophys. Res. 1980, 85, 8129–8140. [Google Scholar] [CrossRef]
  28. Ignatiev, N.I.; Titov, D.V.; Piccioni, G.; Drossart, P.; Markiewicz, W.J.; Cottini, V.; Roatsch, T.; Almeida, M.; Manoel, N. Altimetry of the Venus cloud tops from the Venus Express observations. J. Geophys. Res. 2009, 114, E00B43. [Google Scholar] [CrossRef]
  29. Hansen, J.; Hovenier, J. Interpretation of the polarization of Venus. J. Atmos. Sci. 1974, 31, 1137–1160. [Google Scholar] [CrossRef]
  30. Fedorova, A.; Marcq, E.; Luginin, M.; Korablev, O.; Bertaux, J.L.; Montmessin, F. Variations of water vapor and cloud top altitude in the Venus’ mesosphere from SPICAV/VEx observations. Icarus 2016, 275, 143–162. [Google Scholar] [CrossRef]
  31. Widemann, T.; Lellouch, E.; Campargue, A. New wind measurements in Venus lower mesosphere from visible spectroscopy. Planet. Space Sci. 2007, 55, 1741–1756. [Google Scholar] [CrossRef]
  32. Young, A. Is the Four-Day “Rotation” of Venus Illusory? Icarus 1975, 24, 1–10. [Google Scholar] [CrossRef]
  33. Gaulme, P.; Schmider, F.-X.; Gonçalves, I. Measuring planetary atmospheric dynamics with Doppler spectroscopy. Astron. Astrophys. 2018, 617, A41. [Google Scholar] [CrossRef] [Green Version]
  34. Allen, C.W. Astrophysical Quantities; Athlone Press: London, UK, 1973. [Google Scholar]
  35. Cottini, V.; Ignatiev, N.I.; Piccioni, G.; Drossart, P.; Grassi, D.; Markiewicz, W.J. Water vapor near the cloud tops of Venus from Venus Express/VIRTIS dayside data. Icarus 2012, 217, 561–569. [Google Scholar] [CrossRef]
  36. Gilli, G.; Lebonnois, S.; González-Galindo, F.; López-Valverde, M.A.; Stolzenbach, A.; Lefèvre, F.; Chaufray, J.Y.; Lott, F. Thermal structure of the upper atmosphere of Venus simulated by a ground-to-thermosphere GCM. Icarus 2017, 281, 55–72. [Google Scholar] [CrossRef]
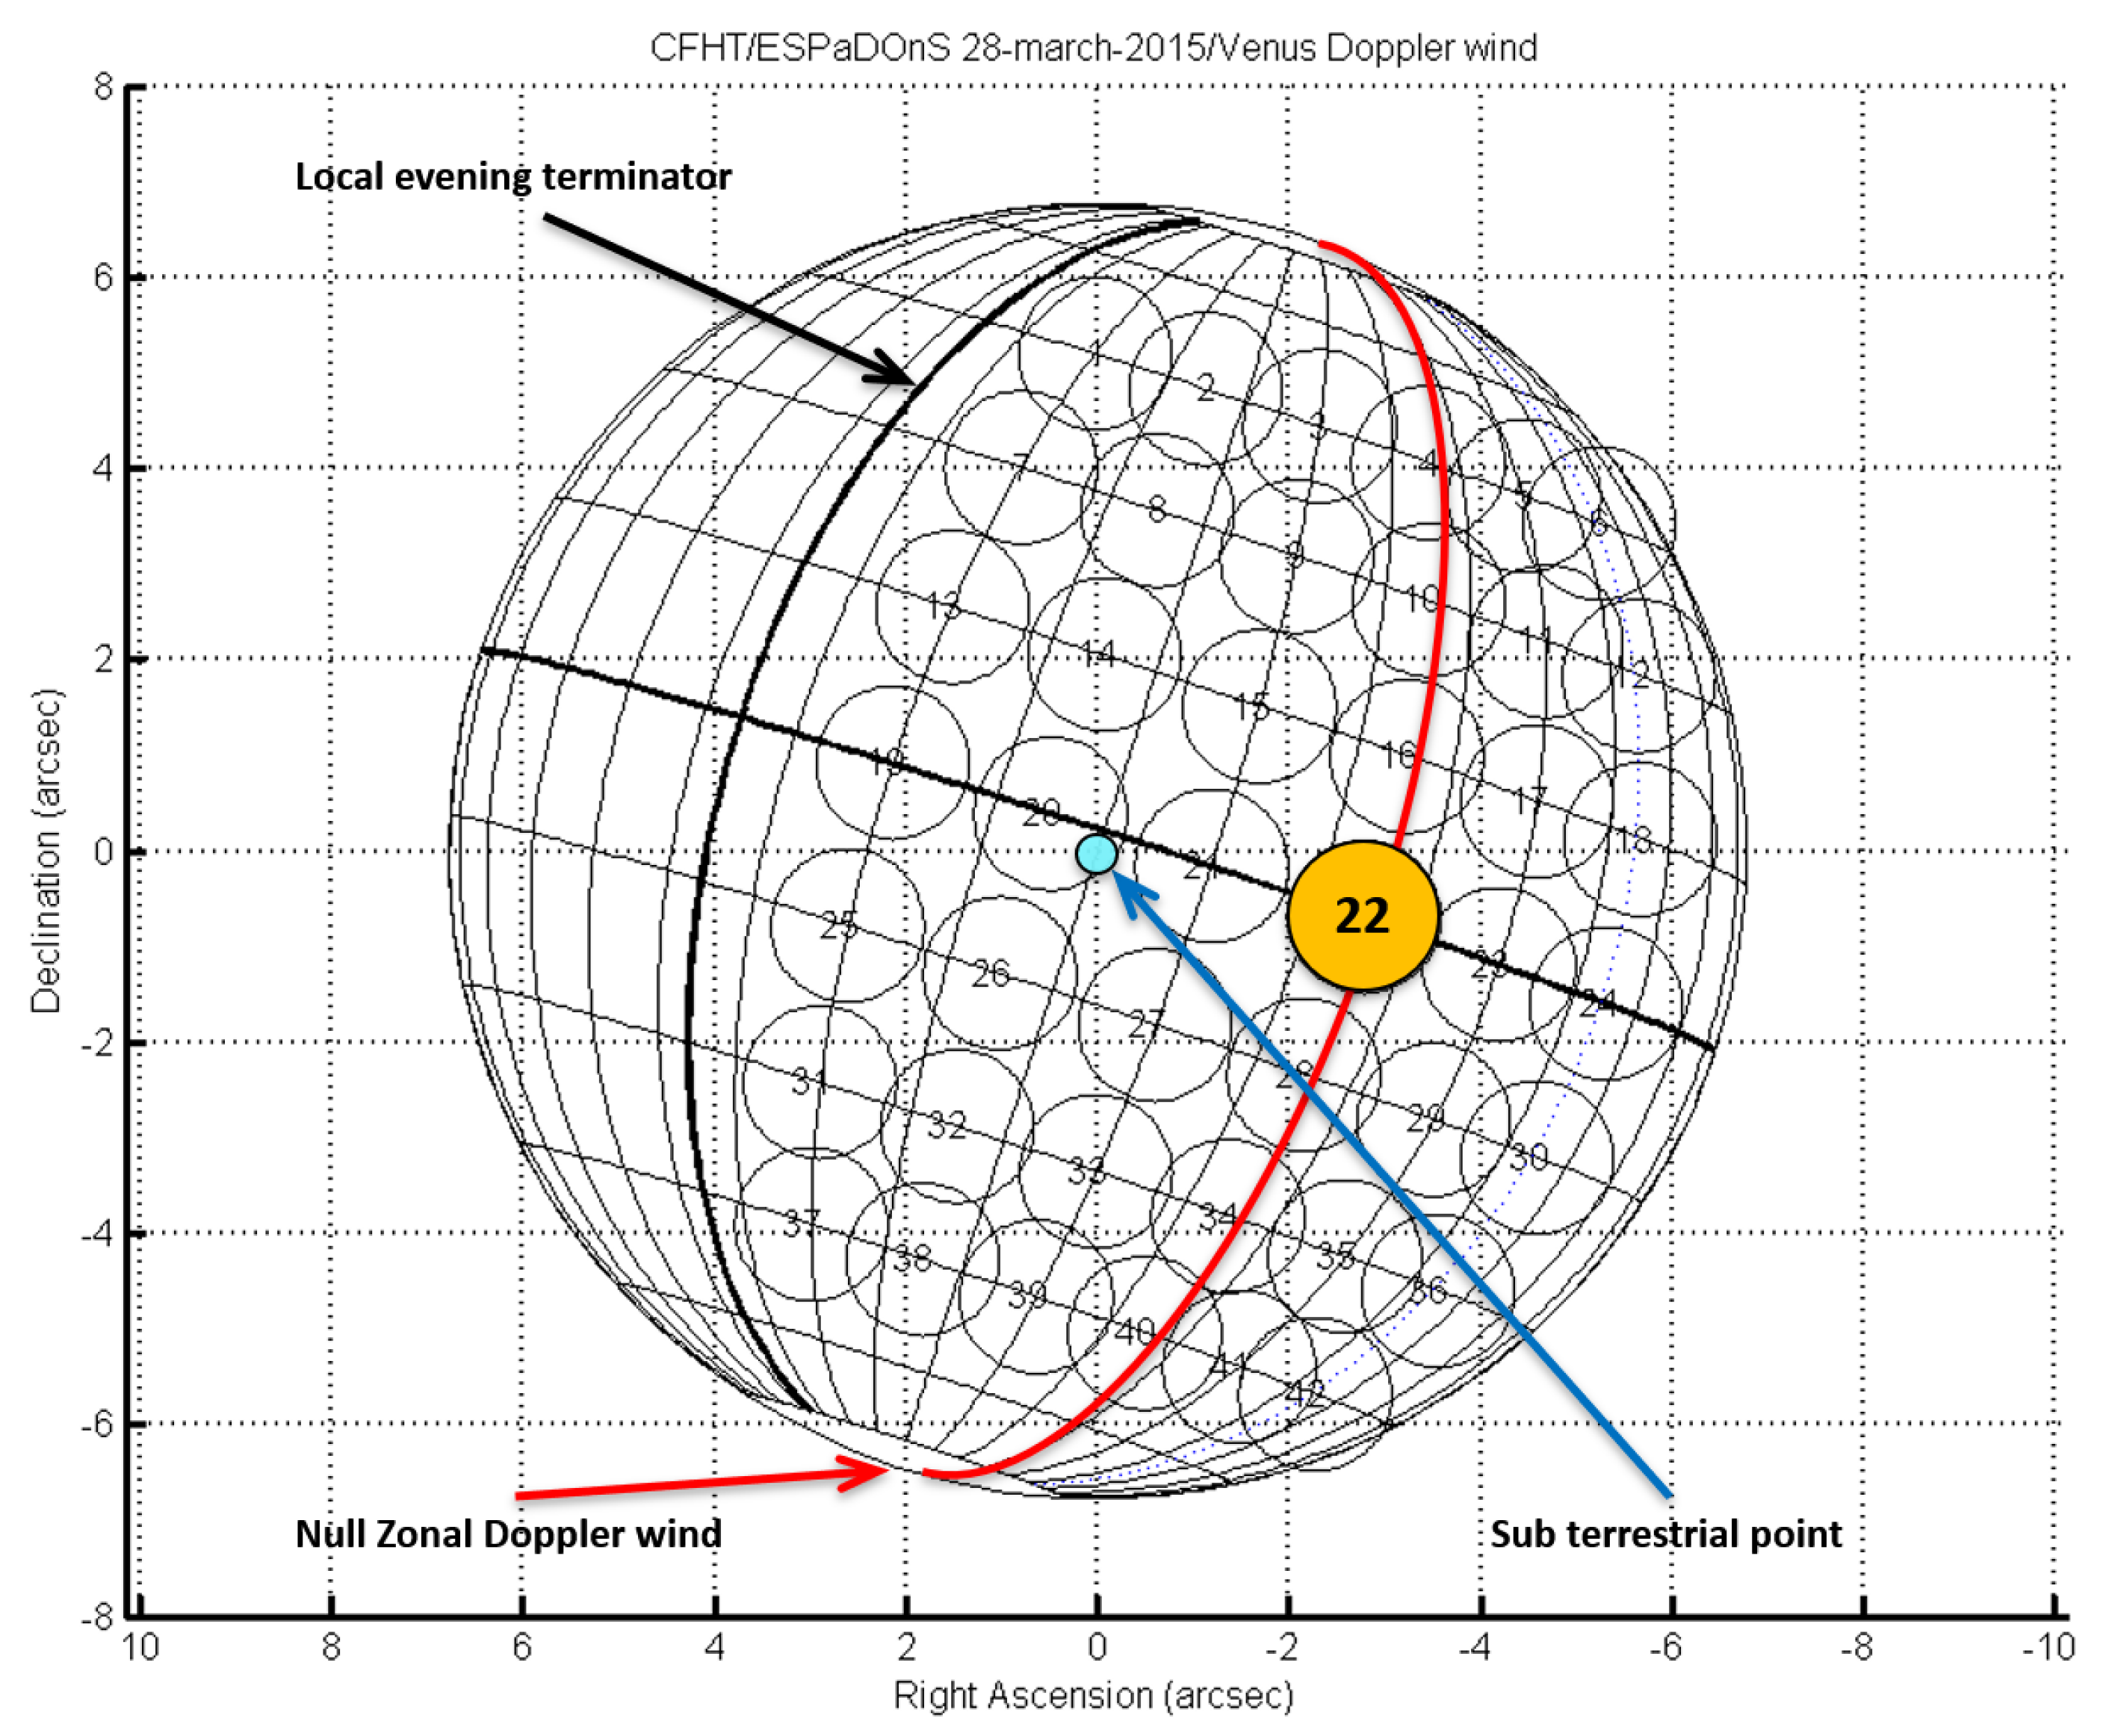
Figure 1. Aspect and angular size of Venus as seen from Earth on 28 March 2015, 00h UTC. RA and DEC axes are in arcsec. Celestial North is up. Red solid line in the half-phase angle (HPA) meridian at ϕ ϕ E = Φ / 2 27 ; sub−Earth point as a blue circle; local evening terminator is noted as a thick solid grid line west of central meridian. The grid has steps of 15 latitude and 10 longitude. The reference point 22, used for the spectral calibration, is the as orange solid circle (0 latitude and 25 longitude).
Atmosphere 12 00002 g001
Figure 2. Latitudinal profile of zonal wind for each day of observation and the average values of the observation campaign (in black). For each day, we applied a weighted average of all the points at the same latitude, producing a daily latitudinal profile of the zonal wind.
Atmosphere 12 00002 g002
Figure 3. Colour plots of zonal wind for each position observed (as in Figure 1) between 27 and 29 March 2015 (panels (ac), respectively). Zonal wind velocity represented as a color code in a westward direction. The zonal wind velocity is displayed in each FOV, in m/s rounded to unity. The reference point (22) value represents the background wind velocity measured for each day. The zonal wind velocities of all the points located at the half-phase angle (HPA) were retrieved as fluctuations regarding the reference background point.
Atmosphere 12 00002 g003
Figure 4. Latitudinal profile of meridional wind for each day of observation. For each day, we applied a weighted average on all the Doppler values at each latitude, producing a daily latitudinal profile of the meridional wind.
Atmosphere 12 00002 g004
Figure 5. Comparison of zonal wind velocities obtained using the Doppler velocimetry technique throughout multiple observations campaigns—Machado et al. [26] (UVES/VLT), Machado et al. [8,10] (ESPaDOnS/CFHT) and [12] (HARPS-N/TNG).
Atmosphere 12 00002 g005
Figure 6. Comparison of meridional wind latitudinal profiles obtained with Doppler velocimetry technique along several observation campaigns. All results were obtained using the same method and all observations were made with a fiber-fed high-resolution spectrograph—this work and Machado et al. [8,10] used ESPaDOnS at CFHT; Gonçalves et al. [12] used the HARPS-N/TNG.
Atmosphere 12 00002 g006
Figure 7. Long term comparison of zonal wind latitudinal profiles obtained from several observations. The comparison includes results from Doppler velocimetry observations using ESpaDOnS/CFHT from 2014 [10]), cloud-tracked observations using VIRTIS-M/VEx from 2006–2012 [7,9] and UVI/Akatsuki from 2015–2017 [11].
Atmosphere 12 00002 g007
Figure 8. Long term comparison of meridional wind latitudinal profiles obtained from several observations. The comparison includes results from Doppler velocimetry observations using ESpaDOnS/CFHT from 2014 [10]), cloud-tracked observations using VIRTIS-M/VEx from 2006–2012 [7,9] and UVI/Akatsuki from 2015–2017 [11].
Atmosphere 12 00002 g008
Table 1. Orbital geometry and circumstances of ground-based observations 27–29 March 2015: (1–2) Date/UT interval; (3–5) disk aspect; (6) sub-observer longitude and latitude (planetocentric); (7) airmass.
(1)(2)(3)(4)(5)(6)(7)
DateUTPhase AngleIll. FractionAng. Diam.Ob-lon/latAirmass
Φ ( )(%)(″)( )
27 March20:00–00:5254.079.413.522.4/−1.882.5–1.0
28 March19:31–00:5554.479.113.625.0/−1.933.4–1.0
29 March19:32–00:0454.878.813.727.7/−1.983.4–1.0
Table 2. Scanning sequences on Venus’s dayside hemisphere using CFHT/ESPaDOnS during the 27–29 March 2015 observing run: (1) date; (2) location on disk; (3) UT time interval; (4) points acquisition order; points in parentheses have been observed but not included in the kinematic best fits either for their lower S/N and/or limb or high SZA geometry; (5) exposure repetition: each point was acquired 3 times to check for internal consistency. Points in brackets were discarded from analysis due to poor visibility, severe pointing drift or tracking issues.
(1)(2)(3)(4)(5)
 
Date
 
Loc.
Time Span
(UT)
Points
Order
Exp.
Repetition
March 27
Equator20:00–20:1823-21-20-19-23-24-223 x
N lat 15 20:21–20:4122-16-15-14-13-17-18-223 x
S lat 15 20:42–20:5928-22-28-27-26-25-223 x
ϕ ϕ E = −25 (HPA)22:59–23:2022-16-10-4-22-28-34-40-223 x
ϕ ϕ E = 20 N23:22–23:3922-19-19-13-7-1-223 x
ϕ ϕ E = 20 S23:47–00:1022-25-31-22-31-37-37-22-223 x
S lat 15 00:12–00:3322-28-27-22-26-25-29-30-223 x
S lat 30 00:34–00:5122-34-22-33-32-31-223 x
March 28
Equator19:31–19:4922-22-21-20-19-23-24-243 x
S lat 15 19:51–20:0922-28-27-26-25-29-30-223 x
S lat 30 20:10–20:2822-34-33-32-31-35-36-223 x
S lat 45 20:29–20:4622-22-40-39-38-37-41-42-223 x
ϕ ϕ E = 20 20:47–23:0822-19-13-7-1-25-31-37-223 x
ϕ ϕ E = −25 (HPA)23:08-23:2616-22-10-4-28-34-40-223 x
N lat 15 23:35–23:5422-13-14-15-16-17-18-223 x
N lat 30 23:55–00:137-8-22-9-10-11-123 x
N lat 45 00:14–00:3022-1-2-3-4-5-[6]3 x
Equator 00:32–00:3022-21-20-19-22-[22]-[22]3 x
March 29
ϕ ϕ E = 20 19:32–19:5422-19-13-13-7-1-25-31-37-223 x
ϕ ϕ E = −25 (HPA)19:56–20:1522-16-10-4-22-28-34-40-223 x
Equator20:17–22:4222-21-22-22-21-20-19-23-243 x
N lat 15 22:43–23:0122-16-22-15-14-13-17-183 x
N lat 30 23:02–23:2222-10-22-9-8-7-11-12-223 x
N lat 45 23:33–00:0322-4-3-2-1-5-22-[22]-[22]-[22]3 x
Publisher’s Note: MDPI stays neutral with regard to jurisdictional claims in published maps and institutional affiliations.