Article

Evaluating Hydrological Processes of the Atmosphere–Vegetation Interaction Model and MERRA-2 at Global Scale

CAS Key Laboratory of Regional Climate and Environment for Temperate East Asia, Institute of Atmospheric Physics, Chinese Academy of Sciences, Beijing 100029, China
*
Author to whom correspondence should be addressed.
Atmosphere 2021, 12(1), 16; https://doi.org/10.3390/atmos12010016
Submission received: 14 October 2020 / Revised: 14 December 2020 / Accepted: 20 December 2020 / Published: 24 December 2020
(This article belongs to the Section Biosphere/Hydrosphere/Land–Atmosphere Interactions)

Abstract

:
Hydrological processes are a key component of land surface models and link to the energy budget and carbon cycle. This study assessed the global hydrological processes of the Atmosphere–Vegetation Interaction Model (AVIM) using multiple datasets, including the Global Land Data Assimilation System (GLDAS), the University of New Hampshire and Global Runoff Data Centre (UNH-GRDC), the European Space Agency (ESA) Climate Change Initiative (CCI), the Global Land Evaporation Amsterdam Model (GLEAM), and the Modern-Era Retrospective Analysis for Research and Applications Version 2 (MERRA-2) datasets. The comparisons showed that the AVIM gives a reasonable spatial pattern for surface soil moisture and surface runoff, but a less satisfactory spatial pattern for evapotranspiration. The AVIM clearly underestimates surface runoff worldwide and overestimates the surface soil moisture in the high latitudes of the Northern Hemisphere, while yielding moderately higher evapotranspiration in arid areas and lower evapotranspiration in low-latitude areas near the equator. The annual cycle of evapotranspiration in the AVIM shows good agreement with the GLEAM dataset, whereas the surface soil moisture in the AVIM has a poor annual cycle relative to the CCI dataset. The AVIM simulates a late start time for snowmelt, which leads to a two-month delay in the peak surface runoff. These results clearly point out the directions required for improvements in the AVIM, which will support future investigations of water–carbon–atmosphere interactions. In addition, the evapotranspiration in the MERRA-2 dataset had an overall good performance comparable with that of the GLEAM dataset, but its surface soil moisture did not perform well when validated against the CCI dataset.

1. Introduction

Water, vegetation, and the atmosphere interact closely with each other [1,2]. Pitman and McAvaney [3] and Pitman [4] stated that, “The ways in which the hydrology are modeled may be more important than the surface energy balance, at least in second-generation schemes.” It has been shown that climate change predictions cannot be improved without a better description of the hydrology [4,5,6,7]. Moreover, changes in hydrological processes strongly affect the ecological system [8,9]. The coupling between ecological and hydrological processes has drawn increasing attention in scientific communities [1].
Soil moisture is a core variable in land–atmosphere interactions [10,11,12] and involves a series of feedbacks on local, regional, and global scales [10,13]. The soil moisture has an essential role in the carbon cycle of terrestrial ecosystems through affecting the uptake of carbon by photosynthesis and the release of carbon by respiration [14]. The soil moisture also affects the partitioning of incoming energy between the latent and sensible heat fluxes [10]. Evapotranspiration returns about 60% of the total precipitation over land back to the atmosphere [15] and may use more than half of the total amount of solar energy absorbed by land surfaces [16]. The coupling of soil moisture and evapotranspiration can influence the generation of precipitation in the afternoon [17,18,19], and it is relevant to the occurrence of extreme heatwaves which may lead to a reduction in the gross primary productivity [20,21,22,23,24]. Runoff is an important component of the water cycle, and its generation critically depends on the parameterization of land–atmosphere–biosphere interactions. The runoff is therefore a useful diagnostic in the parameterizations of hydrology and other surface processes in different climatic regions [25].
Lu and Ji [26] discussed the interaction between the physical and physiological processes in the Atmosphere–Vegetation Interaction Model (AVIM) in North China, and found that moisture is a major factor controlling the spatiotemporal variations of net primary productivity (NPP) and leaf area index (LAI). However, little evaluation has been carried out in terms of the performance of the AVIM hydrological processes, except that Dan et al. [27] compared the AVIM-modeled soil moisture in the top 0.1 m with in situ observations from 40 sites in China. To systematically assess the overall performance of AVIM, it is necessary to carry out a global validation of the AVIM hydrological processes against satellite and reanalysis data. This paper aims to evaluate the performance of the hydrological processes of AVIM using multiple global datasets: the Global Land Data Assimilation System (GLDAS), the University of New Hampshire and Global Runoff Data Centre (UNH-GRDC), the European Space Agency (ESA) Climate Change Initiative (CCI), the Global Land Evaporation Amsterdam Model (GLEAM), and the Modern-Era Retrospective Analysis for Research and Applications Version 2 (MERRA-2) datasets. The findings can help to find out whether the hydrological processes in the AVIM require further improvement to provide a better model basis for future research on carbon–water–atmosphere interactions. Moreover, we compared the soil moisture and evapotranspiration in the MERRA-2 dataset with those in the CCI and GLEAM datasets to validate the performance of MERRA-2.

2. Model, Data, and Methodology

2.1. Model Introduction

The AVIM is a land surface model originally proposed to simulate the energy–water balance among the atmosphere–vegetation–soil system by Ji in 1995 [28] in the Institute of Atmospheric Physics, Chinese Academy of Sciences, China. The AVIM was developed through adding dynamic vegetation physiology processes into the simple one-dimensional land surface process model of Ji and Hu in 1989 [29] in which vegetation was considered as a horizontally uniform layer and coupled with atmosphere and soil through transfers and exchanges of energy and water. The AVIM is involved in two international comparison plans: the Ecosystem Model-Data Intercomparison (EMDI) and the Carbon Subplan in the Project for Intercomparison of Land-surface Parameterization Schemes (PILPS-C). The AVIM showed the best performance among the models participating in the EMDI in terms of the NPP simulation on a global scale. The AVIM has been successfully coupled into several climate models—for example, the Global Ocean–Atmosphere–Land System (IAP/LASG GOALS) [6,30] model and the Regional Integrated Environment Modeling System (RIEMS) [31].
The AVIM V2.0 with a spatial resolution of 1.0° was used in this study. The AVIM contains one canopy layer and a snowmelt module, but does not take into account the groundwater and subsurface runoff simulations. The AVIM has ten soil layers with a total depth of 2.5 m and assumes that the physical and chemical conditions in the deepest soil layer are constant. A one-dimensional Richards equation was used to calculate the movement of soil water between two adjacent layers as follows. The time step is 1 h.
w t = z ( D w z ) + K w η s z + S u η s
where η is the volumetric soil water content (mm/mm), ηs is the saturated volumetric soil water content (mm/mm), w is the relative soil moisture expressed as η/ηs, D is the permeability of the soil, and Su is the transpiration (m/s) due to the uptake of water by roots.
The surface runoff is controlled by a simple empirical equation of the surface soil moisture of the top 0.1 m of the soil, the ground precipitation, and the ground snowmelt water. The ground precipitation is the sum of the total precipitation minus the water intercepted by the canopy and the canopy drainage. If the temperature is less than zero, then the surface runoff is equal to zero.
R s = 0.2 w 1 1.5 × ( P g + 2.5 S m g )
P g = P P c + D c
where Rs is the surface runoff (m/s), w1 is the surface soil moisture, Smg is the ground snowmelt water (m/s), Pg is the ground precipitation (m/s), P is the total precipitation (m/s), Pc is the precipitation intercepted by the canopy (m/s), and Dc is the canopy drainage (m/s).
The AVIM adopts an aerodynamic method to compute the evapotranspiration (Ea), which includes the evaporation from bare soil (Eg), the evaporation from the wet part of the canopy (Ew), and the transpiration from the dry part of the canopy (Etr). The total evapotranspiration and the different components are expressed as:
E a = E g + E w + E t r
E w = δ c × ρ a × σ c ( q s ( T c ) q a c ) / r b
where δc is the ratio of the wet part of the canopy to the total canopy, ρa is the air density, σc is the canopy coverage, qs(Tc) is the saturated specific humidity when the leaf temperature is Tc, qac is the specific humidity of the canopy air, and rb is the resistance at the surface boundary layer of the leaves.
E t r = ( 1 δ c ) × ρ a × σ c ( q s ( T c ) q a c ) / ( r b + r c )
where rc is the stomatal resistance.
E g = ρ a × ( q s * ( T c ) q a c ) / ( r a + r s )
where q s * ( T c ) is the specific humidity at the ground surface, ra is the air resistance above the canopy, and rs is the resistance of the soil surface. Detailed information about the AVIM has been published previously [28,32,33,34].

2.2. Data and Methodology

As the AVIM does not simulate subsurface runoff, the water budget cannot be evaluated, and therefore the AVIM hydrological assessment focused on the surface runoff, soil moisture, and evapotranspiration. We previously evaluated the spatiotemporal characteristics of the runoff generated by GLDAS (versions 1.0 and 2.1) using the UNH-GRDC dataset [35]. In this study, the AVIM global surface runoff was validated directly by the GLDAS surface runoff and indirectly by the UNH-GRDC total runoff data. The soil moisture results from the CCI and MERRA-2 datasets were used to evaluate the surface soil moisture in the AVIM. The evapotranspiration performance of the AVIM was assessed by the GLEAM and MERRA-2 datasets. Furthermore, the surface soil moisture and evapotranspiration in the AVIM were primarily validated by the CCI and GLEAM datasets, respectively. We analyzed the MERRA-2 dataset to validate the AVIM, but were also interested in validating the surface soil moisture and evapotranspiration performances of MERRA-2 against the CCI and GLEAM datasets, respectively. The global datasets used in this study are presented in Table 1, and introduced below.
(1) GLDAS generates the optimum fields of the land surface states and fluxes by integrating satellite- and ground-based observational data using advanced land surface modeling and data assimilation techniques [36]. Lv et al. [35] summarized the features of land surface models: the Common Land Model (CLM), the Variable Infiltration Capacity (VIC), and the Noah land surface model. Similarly to the AVIM, they are all one-dimensional land surface models with a snowpack module and use the one-dimensional Richards equation to calculate the soil moisture, and also without taking groundwater into account. (2) UNH-GRDC V1.0 with a 0.5° resolution was produced by combining the river discharge observations from the GRDC with a climate-driven water balance model developed by the UNH. It provides the annual and monthly climatological global runoff data which preserves the accuracy of the discharge measurements and the spatial and temporal distribution of simulated runoff. Therefore, it is considered as the best available global gridded runoff dataset [37,38,39]. (3) The ESA released a global satellite-observed soil moisture dataset as part of its CCI program. The CCI algorithm generated three consistent, quality-controlled, multi-decadal soil moisture datasets from satellite observations—namely, a dataset based on only active microwave data (ACTIVE), a dataset based on only passive microwave data (PASSIVE), and a combined active–passive product (COMBINED) [11,40,41,42]. The combined product of the CCI V04.7 dataset with a spatial resolution of 0.25° was used in this study. (4) The GLEAM V3.3a data with a spatial resolution of 0.25° [43,44], was employed here. This dataset is based on reanalysis radiation and air temperature data, a combination of gage-based, reanalysis, and satellite-based precipitation, and the satellite-based vegetation optical depth. (5) The MERRA-2 dataset with a spatial resolution of (0.5° × 0.625°) is the latest atmospheric reanalysis dataset of the modern satellite era produced by NASA’s Global Modeling and Assimilation Office. It replaces the original MERRA reanalysis dataset [45] using an upgraded version of the Goddard Earth Observing System Model, Version 5 data assimilation system. A comprehensive overview of the MERRA-2 dataset can be found in Gelaro et al. [46].
Considering that the AVIM surface runoff was mainly evaluated by the GLDAS 1.0 results in Lv et al. [35], the AVIM global simulation was forced by the GLDAS 1.0 forcing data, and the study period in this study was chosen as the most recent ten years after 2006 which is consistent with the period used by Lv et al. [35]. The AVIM model was run for 500 years to allow for spin-up. When the monthly series of the global area-mean variables (e.g., LAI, NPP, soil moisture, and surface runoff) had no obvious trend and fluctuate regularly, the spin-up was considered sufficient. The datasets used in this study have different spatial resolutions and were therefore re-gridded to a common spatial resolution of 0.25°. We found that there are differences among the 12-month spatial distributions of missing data in the CCI dataset; therefore, each month of soil moisture data in the AVIM and MERRA-2 datasets was pre-processed to the same spatial distribution as the corresponding month in the CCI dataset. The performances of the AVIM and MERRA-2 datasets were validated by the statistical indexes of the pattern correlation coefficient (PCC), relative bias (RB), and the ratio of the standardized deviation (RSD). These metrics are calculated as follows.
R B = i = 1 N x i i N y i 1
R S D = i = 1 N ( x i x ¯ ) 2 / i = 1 N ( y i y ¯ ) 2
P C C = i = 1 N ( x i x ¯ ) ( y i y ¯ ) i = 1 N ( x i x ¯ ) 2 i = 1 N ( y i y ) 2
where xi is the evaluated dataset and x ¯ is its average value, yi is the reference dataset and y ¯ is the corresponding average, and N is the number of data points.

3. Results

3.1. Surface Runoff

The AVIM generates a weaker surface runoff than the GLDAS models globally (Figure 1 and Figure 2). We found that a large portion (~70%) of precipitation is intercepted by the canopy in the AVIM, which likely accounts for the underestimation of surface runoff. The AVIM global area-weighted mean surface runoff shows an annual range from 1.4 to 1.8 mm month−1, while the GLDAS models results vary from 2 to 20 mm month−1. This implies that the AVIM underestimates the annual cycle of surface runoff relative to the GLDAS models. The AVIM global mean surface runoff shows two peaks in March and August, whereas all the GLDAS models show only one peak occurring in the period March–May. The global annual cycle of the AVIM surface runoff is relatively close to that of the GLDAS Noah subsurface runoff whose peaks are in March and September. Seen from Figure 1b,e, the August and September peaks in the AVIM global mean surface runoff and the GLDAS Noah global mean subsurface runoff are the results of their corresponding peaks in the Northern Hemisphere. The annual cycle of the AVIM surface runoff in the Southern Hemisphere matches well with the GLDAS1.0 CLM, with peaks in January and March in both models. Given that the primary peak in the UNH-GRDC total runoff in the Northern Hemisphere occurs in June as a result of the combination of precipitation and snowmelt at high latitudes [35], the annual cycle implies that the snowmelt is delayed in the AVIM, which leads to a late surface runoff peak (August) which is 2 months later than that of UNH-GRDC (June). This was confirmed by analyzing the monthly spatial distribution—namely, the AVIM begins to produce an obvious snowmelt runoff from May, whereas this starts in April in the UNH-GRDC dataset [35].
The AVIM generated an overall reasonable spatial distribution of the mean annual surface runoff that is closest to the spatial pattern of the GLDAS1.0 CLM surface runoff among the models in GLDAS 1.0 and 2.1 (Figure 2 only shows the spatial distribution of the GLDAS 1.0 CLM), characterized by a greater surface runoff over low-latitude regions near the equator and snowmelt surface runoff over the northern high-latitude areas. However, the AVIM surface runoff is excessively high in the southern and western Tibetan Plateau.

3.2. Surface Soil Moisture

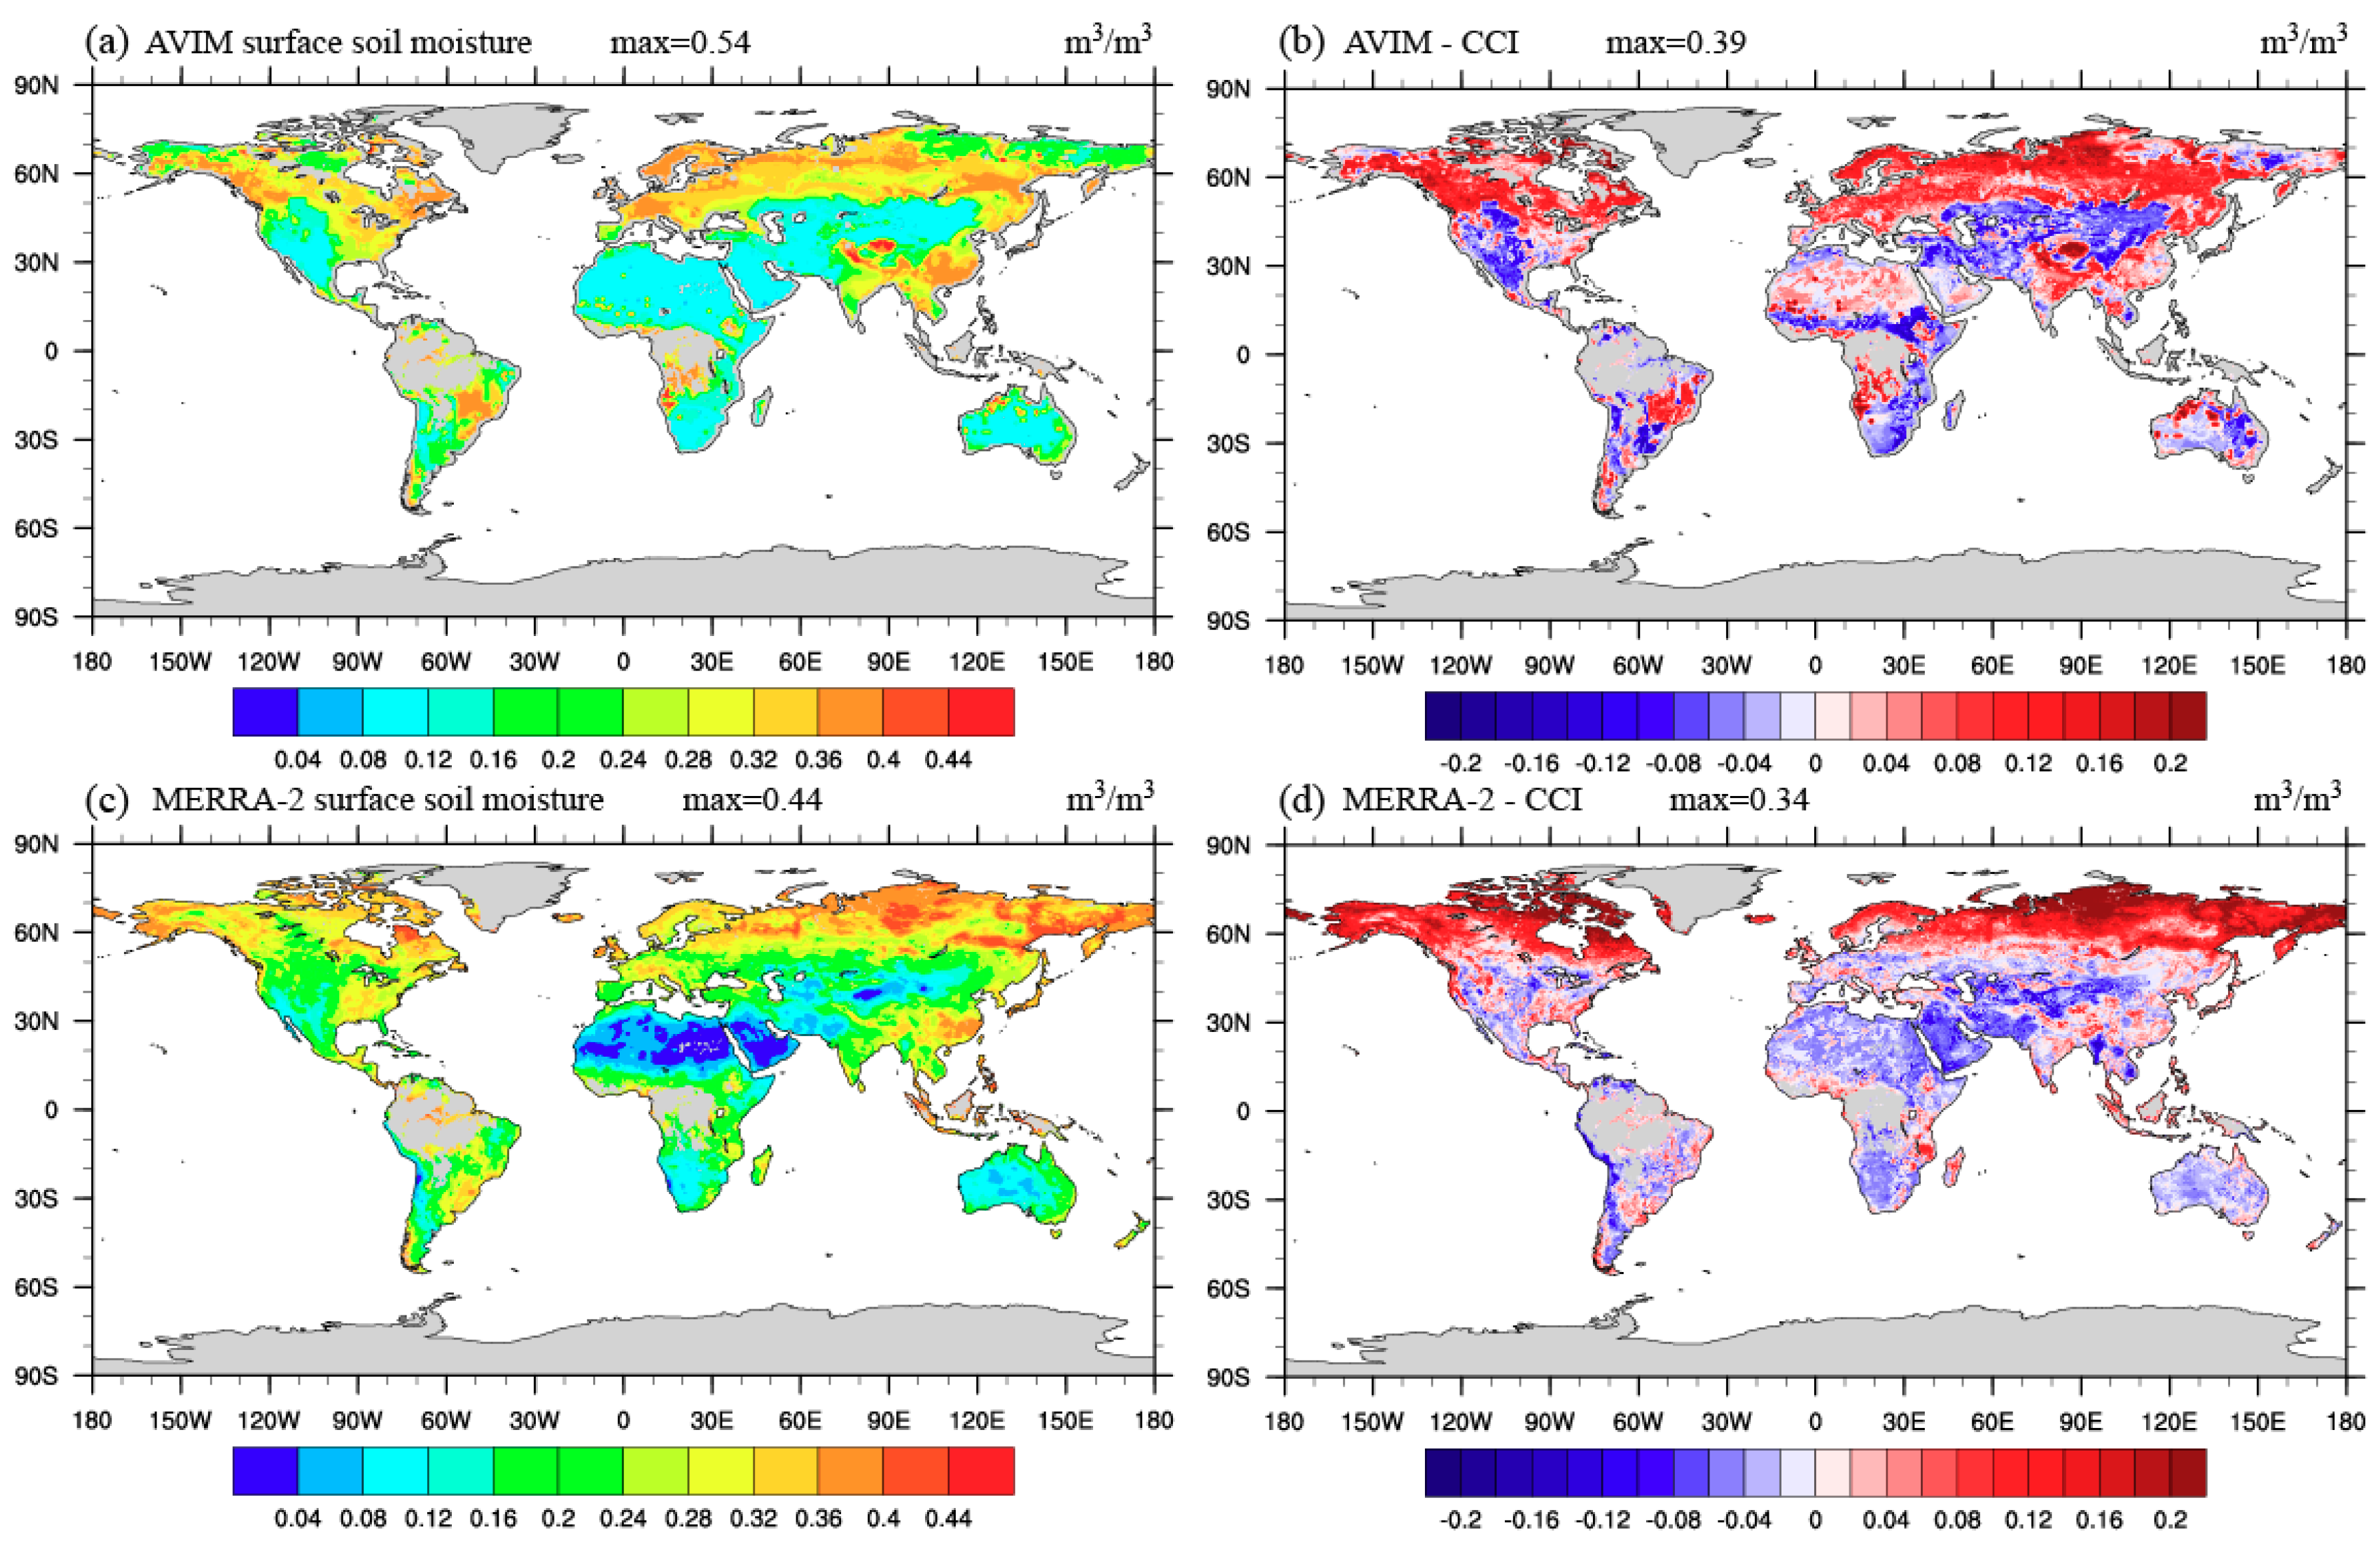
The spatial patterns of the monthly mean surface soil moisture from the AVIM, CCI, and MERRA-2 datasets are generally consistent. Figure 3 shows that the differences between the AVIM and CCI datasets and the differences between the MERRA-2 and CCI datasets are spatially similar. However, both the AVIM and MERRA-2 datasets overestimate the surface soil moisture over the high-latitude regions between 65 and 90° N, and the wet bias is much greater in the MERRA-2 dataset than in the AVIM. For example, the MERRA-2 dataset overestimates the surface soil moisture by >0.2 m3/m3 against around 0.12 m3/m3 in the AVIM in the high latitudes of the Northern Hemisphere. Moreover, the AVIM slightly overestimates the surface soil moisture in northern Africa and moderately overestimates the soil moisture on the Brazilian Plateau, the central-southern region of Africa, and northwest Australia. By contrast, the MERRA-2 dataset shows slightly drier soil moisture over these regions. In addition, the AVIM significantly overestimates the surface soil moisture in the southern and western Tibetan Plateau where there is also a large bias in the surface runoff (Figure 2). The CCI dataset has missing data in some low-latitude regions and the MERRA-2 dataset is slightly different from the CCI dataset near these regions. We therefore evaluated the AVIM soil moisture in low-latitude regions based on the MERRA-2 data. The comparison with MERRA-2 shows that the AVIM yields slightly drier (wetter) soil over northwestern South America (central Africa) and comparable soil moisture for islands (data not shown).
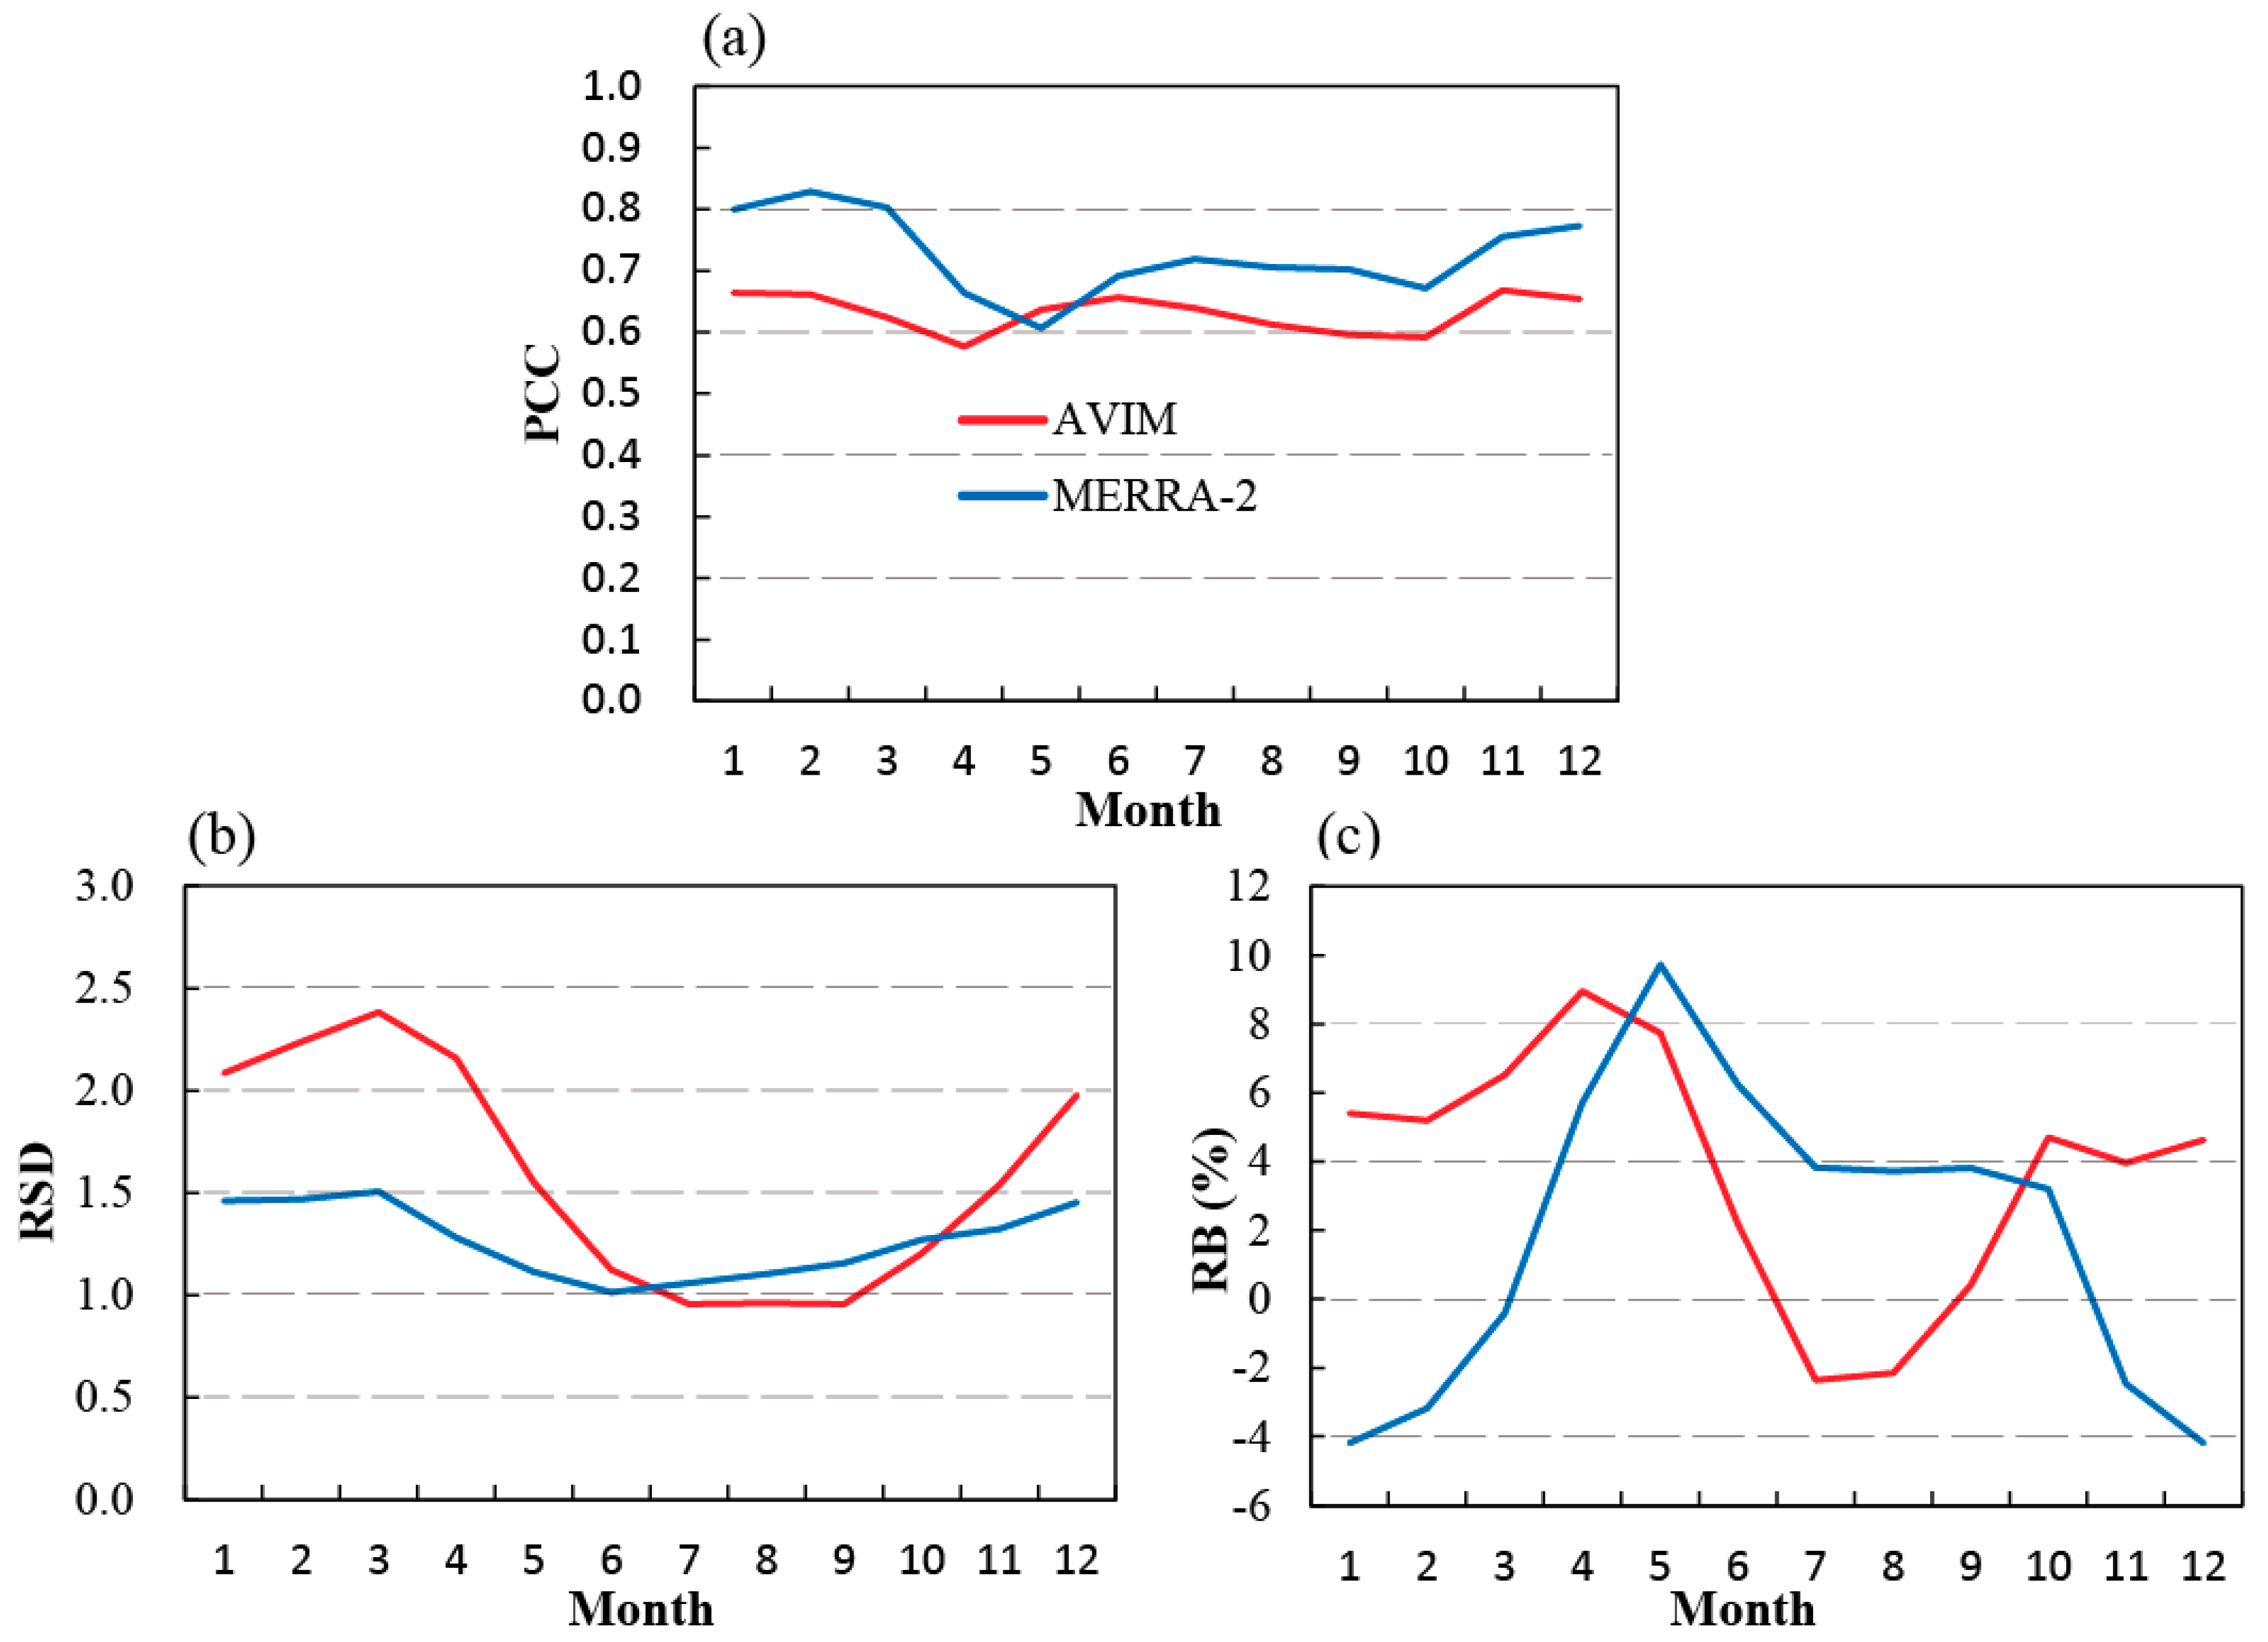
To examine the performance in each month, we calculated the PCC, RSD, and RB of the AVIM and MERRA-2 datasets based on the global climatology of the surface soil moisture (Figure 4). The MERRA-2 dataset generally performs better than the AVIM dataset in terms of the spatial pattern and standard deviation of the soil moisture. Almost all of the PCCs in the MERRA-2 dataset are greater than the values in the AVIM, except for the PCC in May. The AVIM has the lowest PCC (0.57) in April and the second lowest (0.59) in October, whereas the lowest (0.61) and second lowest (0.67) PCCs in the MERRA-2 dataset are in May and October, respectively. The obvious overestimation of the surface soil moisture at high latitudes in the Northern Hemisphere results in the low PCCs of the AVIM and MERRA-2 datasets in April, May, and October. With respect to the spatial variation, the RSDs from June to October for the AVIM and from May to October for the MERRA-2 dataset are closer to 1.0, whereas the spatial variations in the other months are exaggerated and the RSDs are up to 2.38 and 1.51 in March for the AVIM and MERRA-2 datasets, respectively. The RB result shows that the AVIM produces slightly drier soil moisture on a global scale in July and August characterized by RBs of −2.36 and −2.15%, respectively, whereas the MERRA-2 dataset simulated slightly drier soil moisture from November to March with RBs of −0.41 to −4.19%. Both the AVIM (April and October) and MERRA-2 (May and October) datasets show double peaks in the RB curve, which is consistent with the overestimation of the surface soil moisture over high-latitude regions.
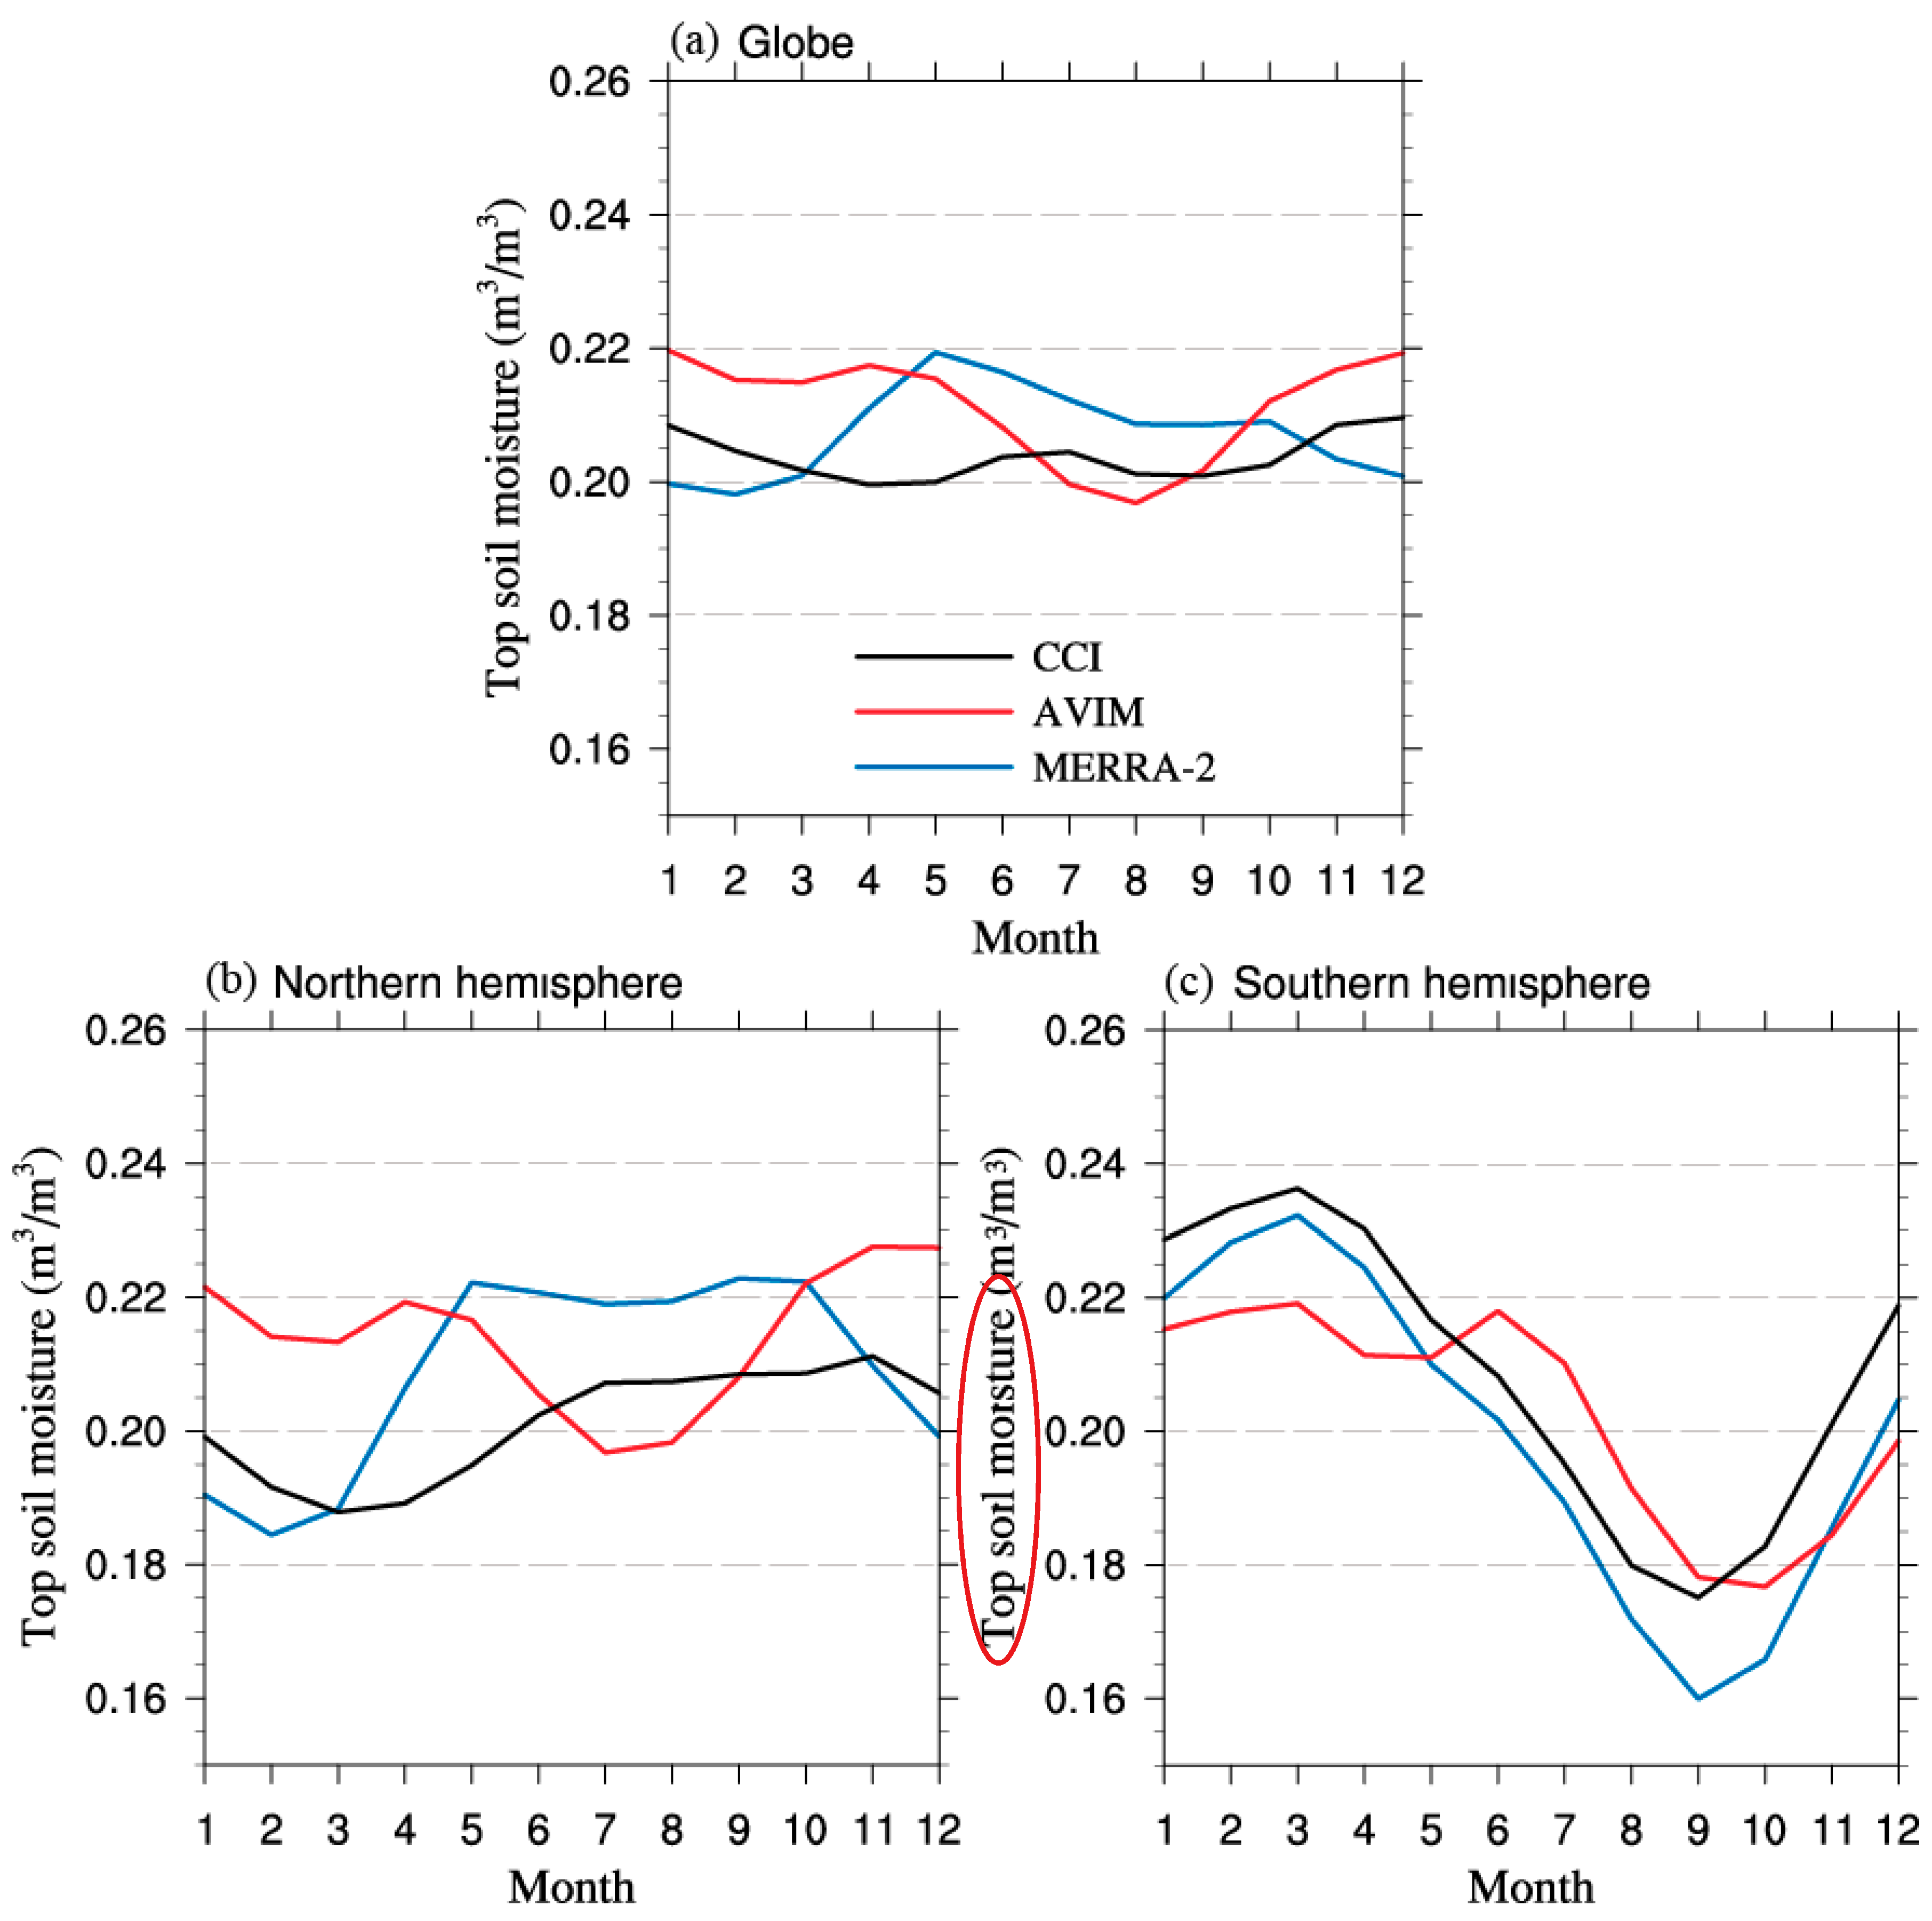
We also found remarkable differences in the annual cycle of the area-weighted mean soil moisture at the global scale among the CCI, MERRA-2, and AVIM datasets (Figure 5a). Peaks in the CCI dataset appear in July and December, whereas the peaks in the AVIM are in January and April, and the peaks in the MERRA-2 dataset are in May and October. Figure 5a also shows that the AVIM and MERRA-2 datasets exaggerate the monthly variation relative to the CCI dataset, and it again indicates that the soil moisture overestimations in the AVIM and MERRA-2 datasets are most pronounced in April and May, respectively. Figure 5 implies that the difference in the global annual cycle between the CCI and MERRA-2 datasets is mainly caused by the difference in the Northern Hemisphere. The annual cycle of the MERRA-2 dataset in the Southern Hemisphere is consistent with that of the CCI dataset. Shown in Figure 5c, both the CCI and MERRA-2 datasets show the highest soil moisture in March and the lowest in September, but with a slight underestimation by the MERRA-2 dataset (most obvious in September). However, besides the peak in March, the AVIM presents another peak in June, while the lowest soil moisture occurs in October which is one month later than in the CCI and MERRA-2 datasets (Figure 5c). Moreover, the difference in magnitude between the AVIM and CCI datasets is more obvious in January–April than other months (Figure 5c). Seen from Figure 5b, the disparity among the CCI, AVIM, and MERRA-2 datasets is pronounced in the Northern Hemisphere. The CCI shows a peak in November and a trough in March. However, the peaks appear in May and September in the MERRA-2 dataset and in April and November for the AVIM. The trough is in February in the MERRA-2 dataset and in July for the AVIM. In addition, the differences in magnitude in the Northern Hemisphere are more significant than those in the Southern Hemisphere.

3.3. Evapotranspiration

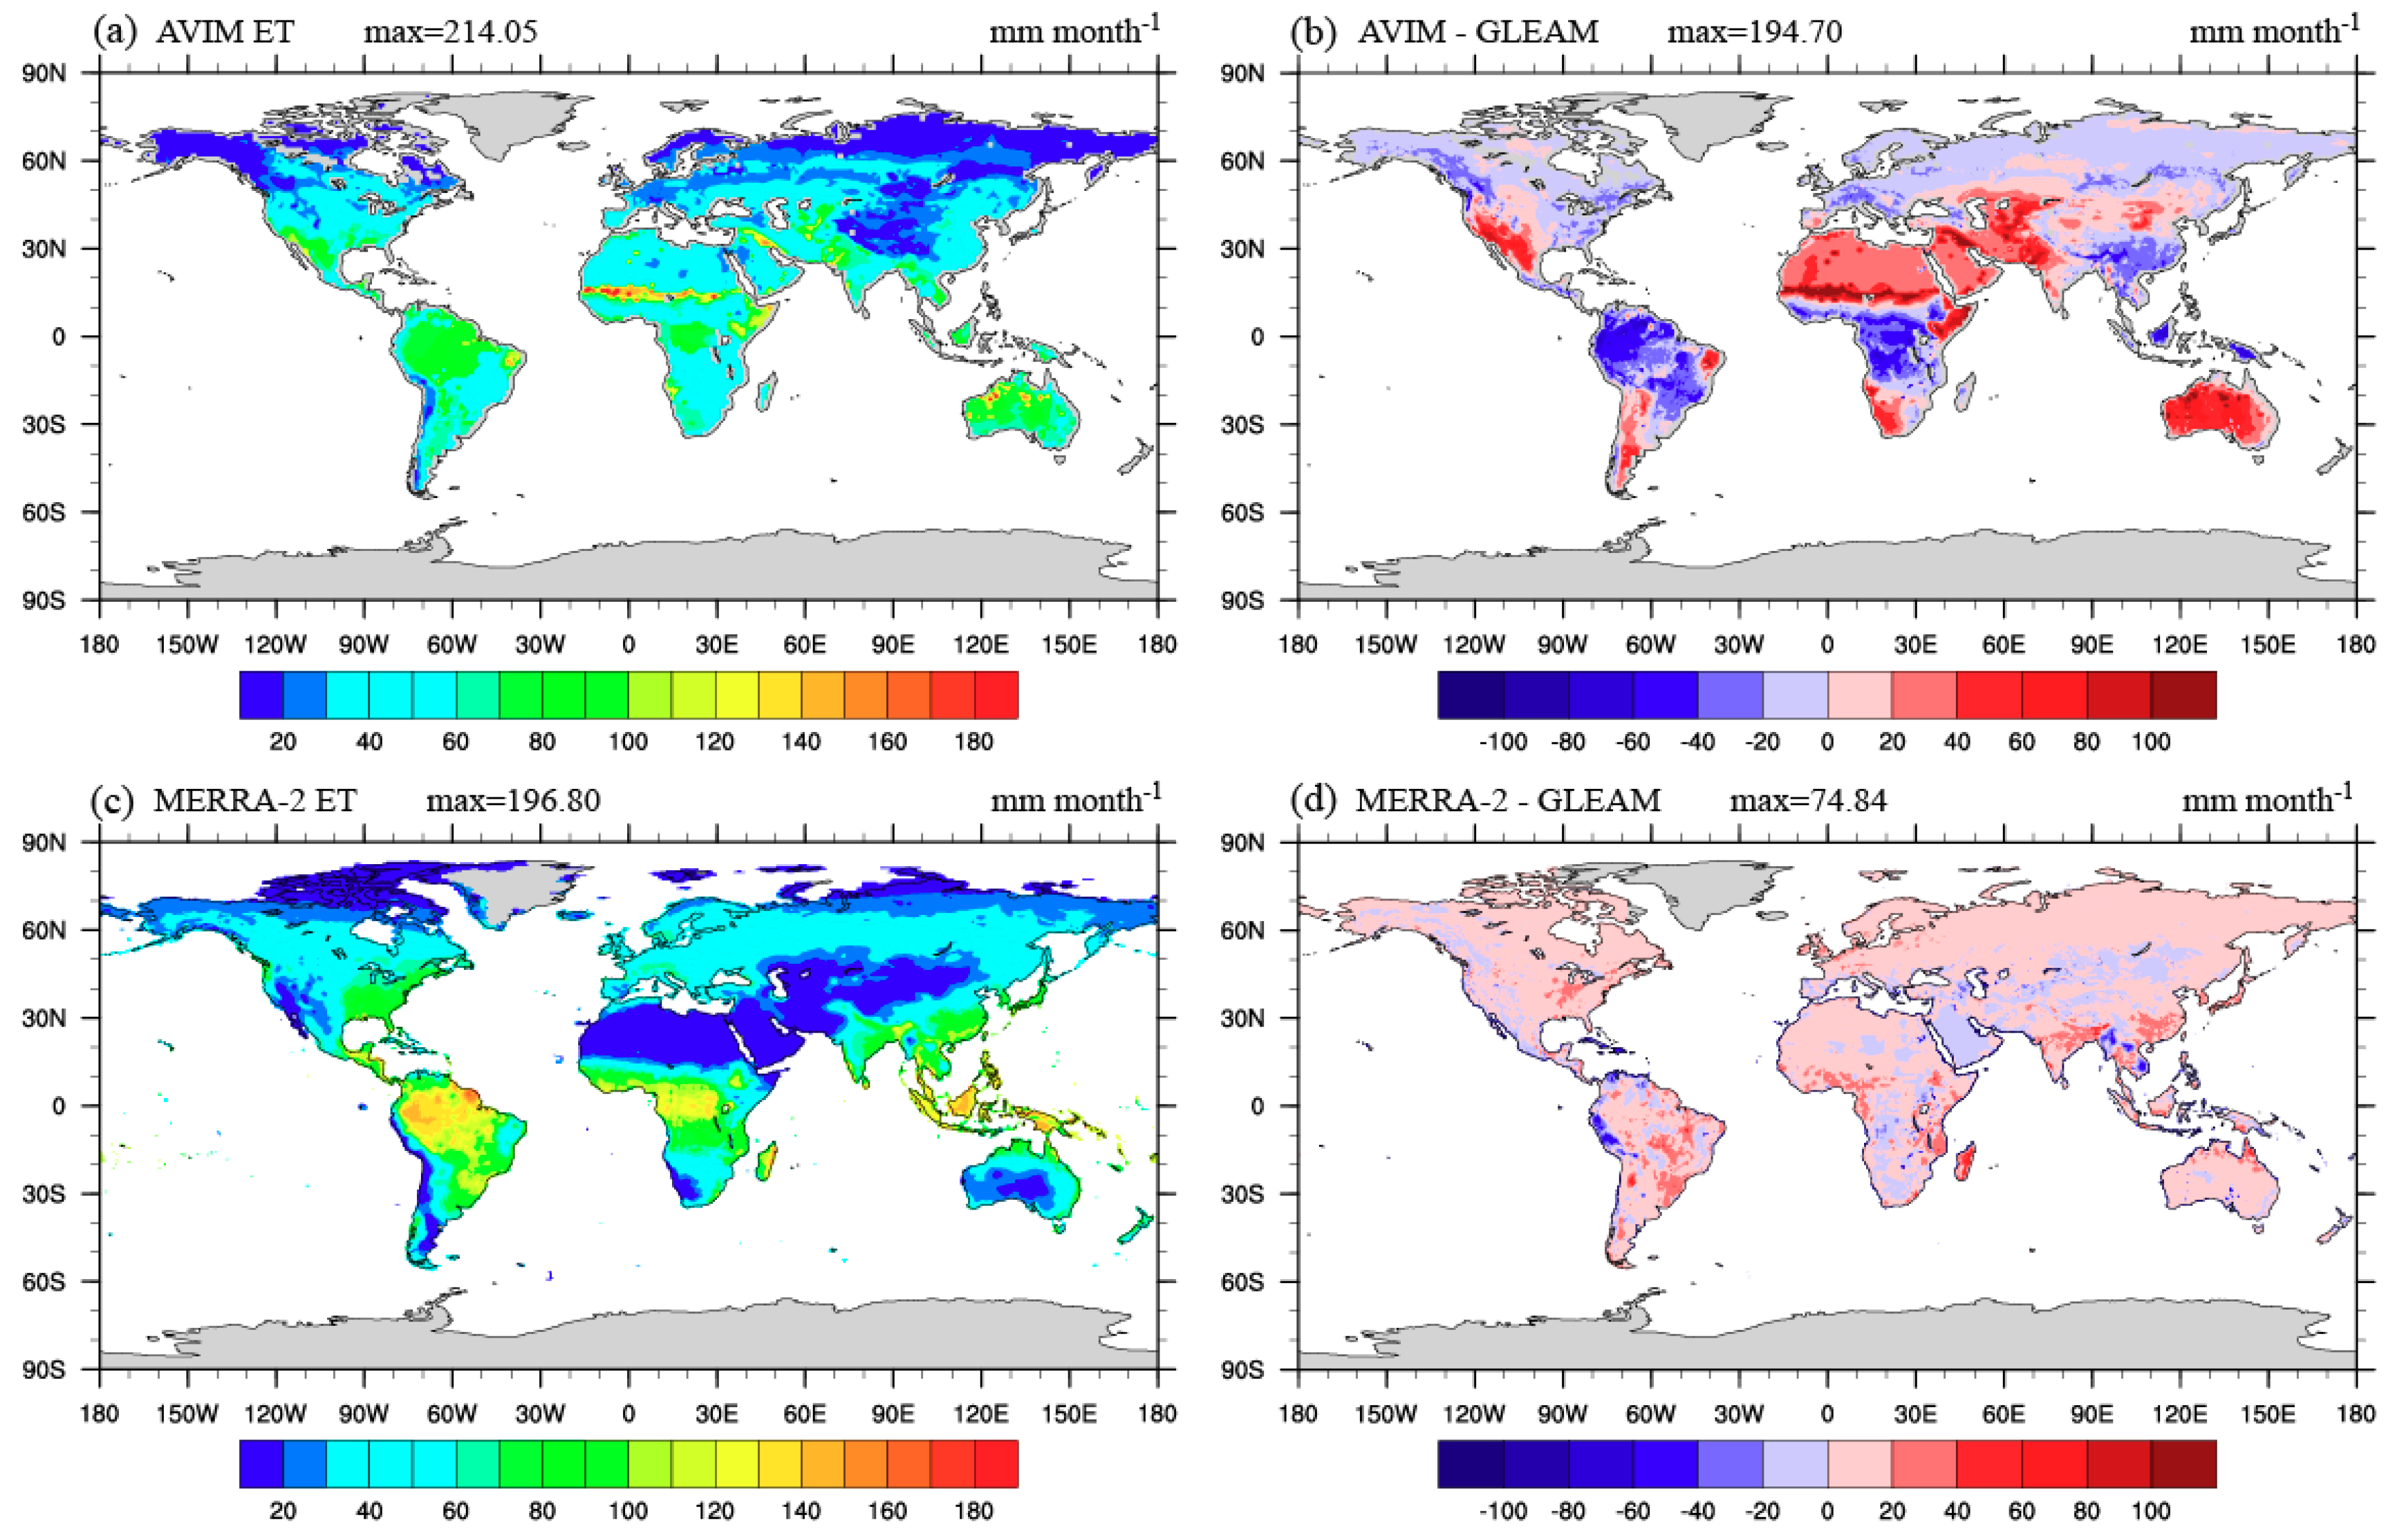
Compared with the monthly mean evapotranspiration in the GLEAM dataset, the MERRA-2 dataset slightly overestimates evapotranspiration over most parts of the globe, except for some local areas where the evapotranspiration is slightly underestimated (Figure 6c,d). Furthermore, the difference is about 20 to 20 mm month−1. By contrast, the AVIM has a relatively poor performance in terms of simulating evapotranspiration. Although the AVIM produces acceptable evapotranspiration in the high-latitude regions between 50 and 90° N, it clearly overestimates evapotranspiration in arid areas, including northern Africa, western Asia, Australia, and western North America, where the bias varies from about 40 to 194 mm month−1 (Figure 6a,b). The AVIM moderately underestimates evapotranspiration over low-latitude areas near the equator where the evapotranspiration should be highest worldwide. Furthermore, the overestimation of the AVIM evapotranspiration in Australia is most apparent from October to March, while the greatest overestimations in northern Africa and western Asia occur from May to August. The degree of underestimation of the AVIM evapotranspiration over low-latitude areas is similar throughout the year.
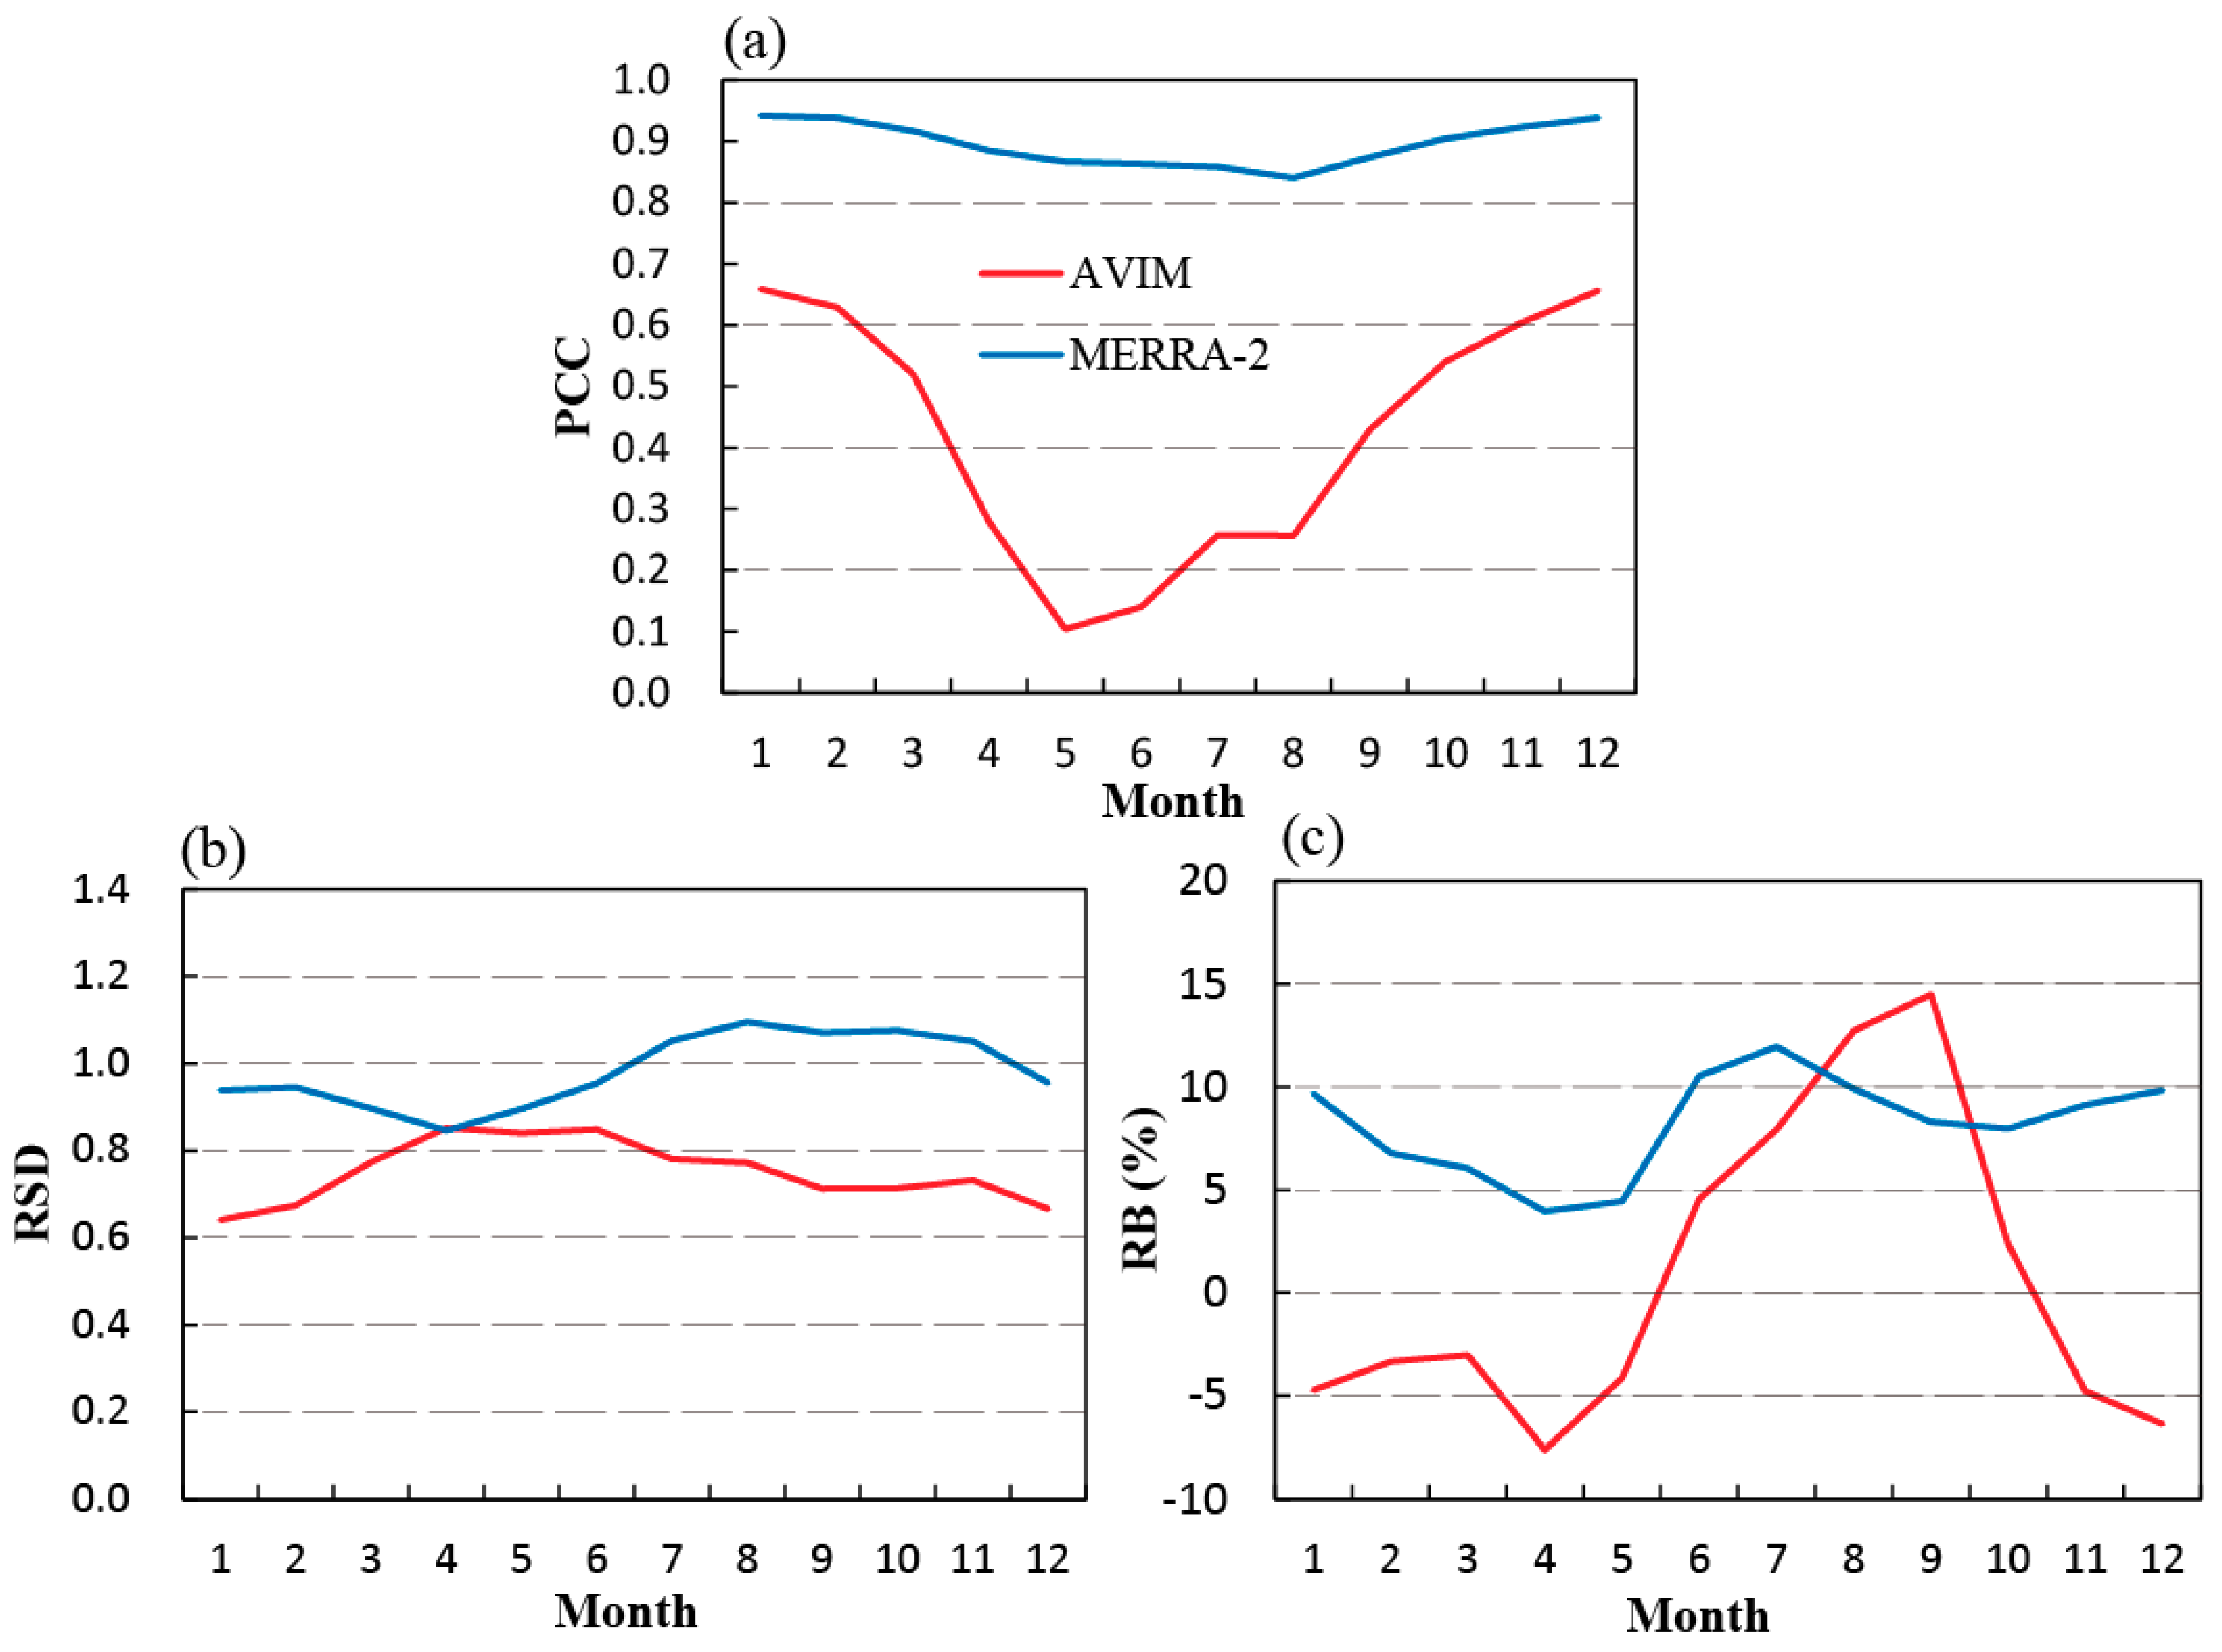
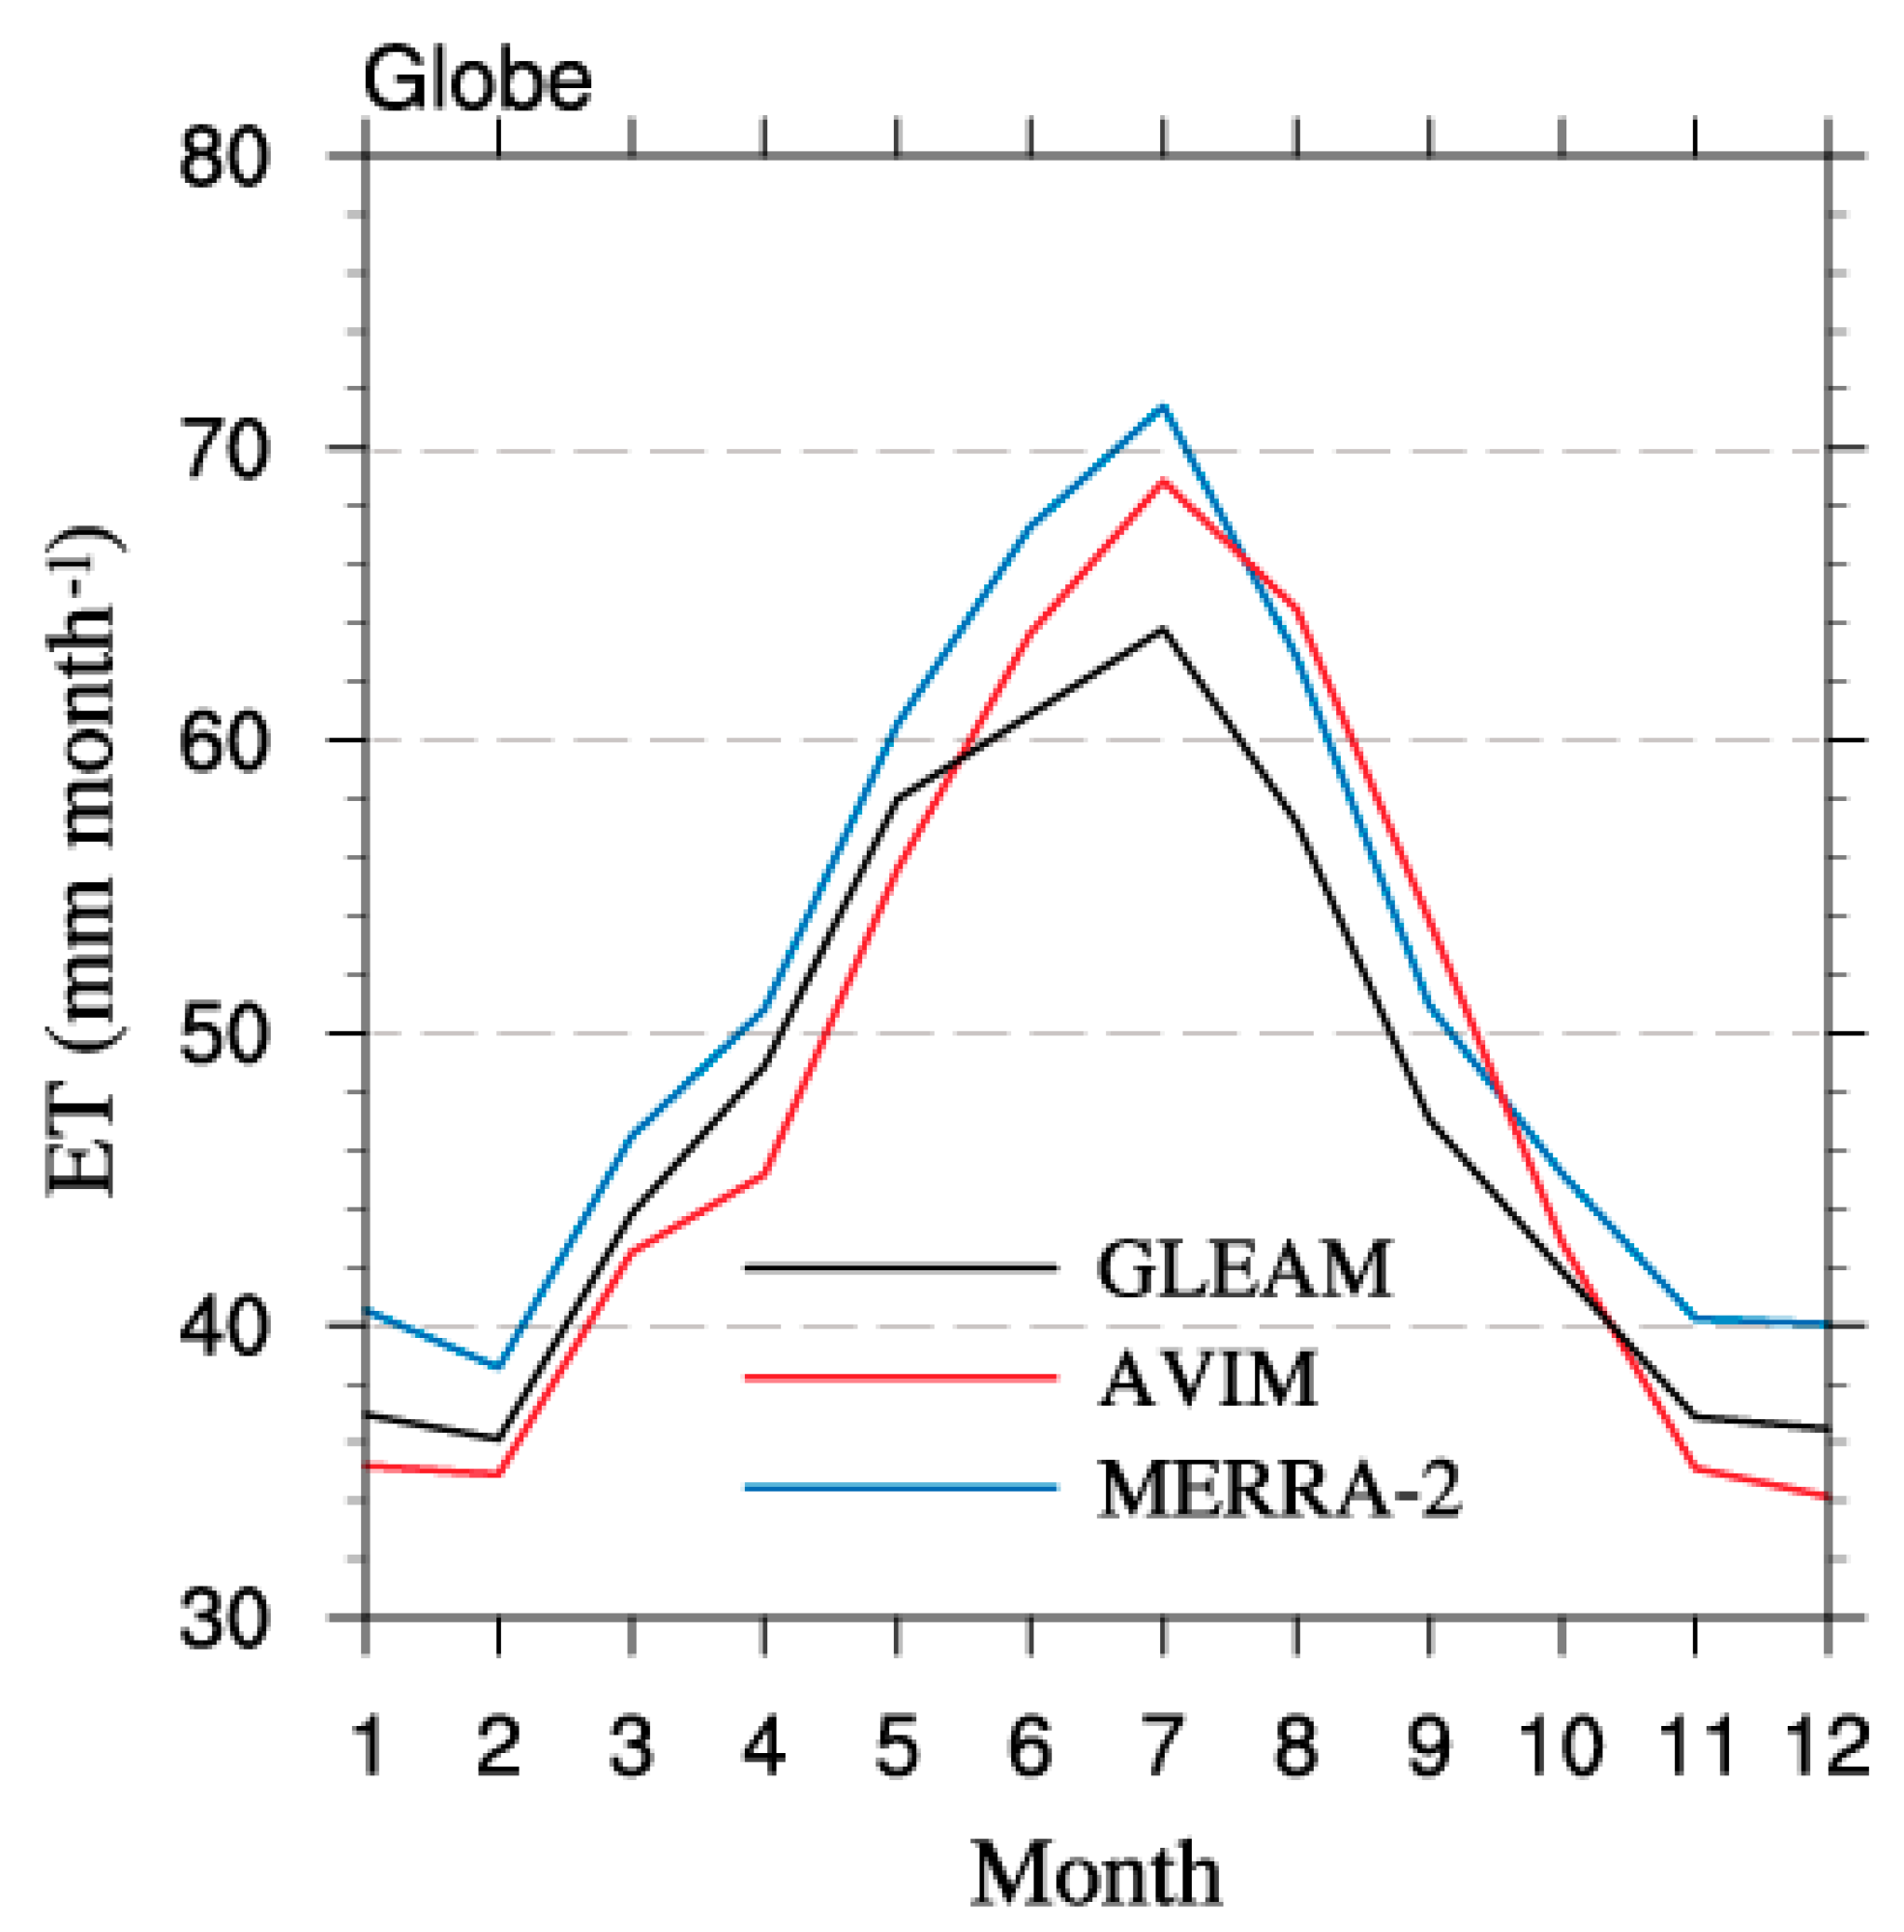
Figure 7 shows the PCC, RSD and RB of the global annual mean monthly evapotranspiration derived from the MERRA-2 and AVIM datasets. The AVIM shows a poorer performance than the MERRA-2 dataset in simulating the spatial pattern of evapotranspiration, with an annual mean PCC of 0.37 for the AVIM and 0.91 for the MERRA-2 dataset. The RSD of the AVIM varies from 0.64 (January) to 0.85 (April), indicating that the AVIM moderately underestimates the spatial variation. The MERRA-2 dataset shows a comparable spatial variation to the GLEAM dataset, with the RSD varying from 0.85 to 1.09. The estimation of the global area-weighted mean evapotranspiration in the AVIM is slightly smaller than that for the GLEAM dataset from November to May with RBs of −3.02 to −7.59%, but it is a little larger between June and October with RBs of 2.34–14.49% (Figure 7c). The MERRA-2 dataset produces higher evapotranspiration in all months, showing RBs of 3.97–11.94%. Figure 8 shows that the annual cycle in the AVIM is consistent with both the GLEAM and MERRA-2 datasets. All three datasets produced a peak in July, but this peak is higher for the AVIM, and especially for the MERRA-2 dataset than for the GLEAM dataset, but the differences in the other months are not significant.

3.4. Discussion

The evaluation presented in this study still contains uncertainties. For example, AVIM was forced by one dataset (GLDAS 1.0), which would affect the hydrological simulations. In addition, the satellite and reanalysis observational data also contain some uncertainties, which is another important uncertainty source. Although previous studies have verified the reliability of the datasets used in this study, these datasets are inevitably subject to some bias.
Wang et al. [47] found that the GLDAS 1.0 has a high quality daily and monthly precipitation in a semiarid mesoscale basin in China from March 2000 to December 2006. Wang and Zeng [48] compared six atmospheric reanalysis products, including GLDAS 1.0; MERRA; the National Centers for Environmental Prediction/National Center for Atmospheric Research data (NCEP/NCAR-1); the Climate Forecast System Reanalysis data (CFSR); the 40-yr European Centre for Medium-Range Weather Forecasts (ECMWF) Re-Analysis (ERA-40) data; and the interim ECMWF Re-Analysis data (ERA-Interim), with in situ measurements over the Tibetan Plateau during 1992 and 2004, and concluded that GLDAS 1.0 has the best overall performance in both daily and monthly precipitation. Wang et al. [49] evaluated the GLDAS 1.0 forcing data against ground-based hydrometeorological data and suggested that GLDAS 1.0 matches well with the observed precipitation data by visual inspection during 1979–2010 in China; however, the snowfall was overestimated during 2000 to 2010. Yang et al. [50] carried out a comparison of four forcing datasets in China, including GLDAS 1.0, the China Meteorological Administration (CMA) Land Data Assimilation System (CLDAS), the China Meteorological Forcing Dataset (CMFD), and the CN05.1 precipitation dataset from CMA; and their results indicated that the GLDAS 1.0 can capture the spatial distribution of precipitation but insufficiently capture the spatiotemporal variability compared with in situ observations in the middle and lower reaches of the Yangtze River. Moreover, Rui and Beaudoing [51] stated that the GLDAS 1.0 forcing data from 1995 to 1997 have high uncertainties. Moreover, the GLDAS 1.0 precipitation has considerable errors in 1996 [49,52] and 2000 [49], and the temperature of GLDAS 1.0 has large errors during 2000 and 2005 [49]. Therefore, we excluded the period from 1995 to 2005 in this study.
Ma et al. [53] carried out a comparison among different satellite surface soil moisture datasets, including the CCI, the Soil Moisture Active Passive (SMAP), the Soil Moisture and Ocean Salinity (SMOS), and the Advanced Microwave Scanning Radiometer 2 (AMSR2), against global ground-based observations, and found that the CCI dataset outperforms the other three datasets in the overall performance. An et al. [54] used the soil moisture results from meteorological stations and the Noah model to compare with CCI, and the results showed that CCI performs better in grassland than in cropland, urban, and built-up regions in China. Chakravorty et al. [55] found that the CCI combined data is more consistent with MERRA-Land than the SMOS Level-3 data over India for the period 2010–2013. Dorigo et al. [56] compared the CCI data with the 1979–2010 ground-based observational soil moisture of 596 sites from 28 historical and active monitoring networks worldwide, and concluded that the CCI quality has an upward trend over time but declines between 2007 and 2010. Dorigo et al. [11] found that the CCI soil moisture generally has a good agreement with the spatiotemporal distributions obtained by land surface models and in situ observations.
Khan et al. [57] validated the evapotranspiration datasets of GLEAM, GLDAS, and the Moderate Resolution Imaging Spectroradiometer (MODIS) global evapotranspiration project (MOD16) in Asia during the period 2000–2010, and found that all datasets show higher relative uncertainties for low vegetations than tall vegetations, and GLEAM performs best in forest. Miralles et al. [58] showed that the global products of GLEAM and the Priestley–Taylor Jet Propulsion Laboratory model (PT-JPL) outperform the Penman–Monteith algorithm behind the official Moderate Resolution Imaging Spectroradiometer (MODIS) product (PM-MOD) for most ecosystems and climate regimes. Yang et al. [59] assessed the GLEAM product using the ChinaFLUX evapotranspiration measurements from eight sites over China and found that GLEAM can estimate evapotranspiration with reasonable accuracy at different time scales (daily, monthly, annual) and perform well for most of the land-cover types but with a higher skill score for grassland than forest and cropland.
Reichle et al. [60] indicated that the MERRA-2 dataset has a better surface and root zone soil moisture performance than its predecessor MERRA and the ERA-Interim/Land dataset compared with in situ measurements from 220–320 stations in North America, Europe, and Australia. Bosilovich et al. [61] also found that, compared to MERRA, MERRA-2 generates a more accurate surface and root-zone soil moisture that is close to the in situ observations from the 140 sites from the USDA Natural Resources Conservation Service Soil Climate Analysis Network (SCAN) in the US, but it provides higher land evaporation than the NASA Energy and Water Cycle Studies (NEWS) estimate. Bosilovich et al. [62] showed that the land evaporation of MERRA-2 is higher than the NASA Energy and Water Cycle Study observations, but it is closer to the observations than the ocean evaporation of MERRA-2. Draper et al. [63] compared the global energy fluxes of several datasets, such as MERRA-2, GLEAM, and NEWS, and showed that MERRA-2 appears to overestimate the latent heat flux.

4. Conclusions

We assessed the ability of the AVIM to simulate hydrological processes using the runoff from the GLDAS and UNH-GRDC datasets, the surface soil moisture from the CCI and MERRA-2 datasets, and the evapotranspiration from the GLEAM and MERRA-2 datasets. We also validated the surface soil moisture and evapotranspiration skills in the MERRA-2 dataset.
We found that the AVIM presents a reasonable spatial distribution for surface runoff, but significantly underestimates surface runoff across the globe, which likely resulted from the overestimation of precipitation intercepted by the canopy. The annual cycle of AVIM global surface runoff shows different peak times with those in the GLDAS dataset, but is relatively close to the times of subsurface runoff in the GLDAS Noah, which is mainly controlled by the peak characteristics in the Northern Hemisphere. The AVIM gives a late start time for snowmelt, and this results in a 2-month delayed surface runoff peak relative to the UNH-GRDC result. The spatial pattern of the surface soil moisture is reasonable in the AVIM. The AVIM overestimates the soil moisture in high latitudes of the Northern Hemisphere, especially in April. The time difference of peaks in the annual cycles of the AVIM and CCI datasets is significant in the Northern and Southern Hemispheres. Moreover, the AVIM surface runoff and surface soil moisture both show very high values in the southern and western Tibetan Plateau. The annual cycle of evapotranspiration in the AVIM matches well with that of the GLEAM dataset with respect to the peak time and magnitude. However, the spatial distribution of the AVIM evapotranspiration is relatively poor, particularly in May, and it overestimates evapotranspiration in arid areas and underestimates evapotranspiration over the low-latitude regions near the equator.
The evapotranspiration in the MERRA-2 dataset matches well overall with the GLEAM dataset in terms of spatial distribution, spatial variation, and annual cycle, but with slightly higher evapotranspiration. However, the MERRA-2 dataset does not perform well for the surface soil moisture compared with the CCI dataset. It overestimates the soil moisture in northern high-latitude regions and shows an even larger bias than the AVIM result. The difference in the annual cycles between the global CCI and MERRA-2 datasets is primarily caused by the difference in the annual cycle in the Northern Hemisphere.
These results clearly show that the hydrological processes in the AVIM need further improvement and point out the specific improvement directions. The evaluation is expected to guide the development of the AVIM model and support future studies of water–carbon interactions and climate change projection, which are both important research topics.

Author Contributions

M.L. (Meizhao Lv) conducted the analysis and wrote the paper; Z.X. supervised the study; M.L. (Meixia Lv) collected data and conducted simulations; and all of the authors contributed to the paper writing. All authors have read and agreed to the published version of the manuscript.

Funding

The study was supported by the National Natural Science Foundation of China (41805008) and the National Key R&D Program of China (2018YFA0606004).

Institutional Review Board Statement

Not applicable.

Informed Consent Statement

Not applicable.

Data Availability Statement

Acknowledgments

The authors acknowledge the release of data from GLDAS 1.0 and 2.1 (), the UNH-GRDC gridded runoff data, the MERRA-2 reanalysis data, the CCI soil moisture dataand the GLEAM evapotranspiration data. The authors are grateful to the anonymous reviewers for their useful suggestions to improve the paper.

Conflicts of Interest

The authors declare no conflict of interest.

References

  1. Song, C.; Yuan, L.; Yang, X.; Fu, B. Ecological-hydrological processes in arid environment: Past, present and future. J. Geogr. Sci. 2017, 27, 1577–1594. [Google Scholar] [CrossRef]
  2. Santanello, J.A., Jr.; Dirmeyer, P.A.; Ferguson, C.R.; Findell, K.L.; Tawfik, A.B.; Berg, A.; Ek, M.; Gentine, P.; Guillod, B.P.; Van Heerwaarden, C. Land–atmosphere interactions: The loco perspective. Bull. Am. Meteorol. Soc. 2018, 99, 1253–1272. [Google Scholar] [CrossRef]
  3. Pitman, A.J.; McAvaney, B.J. The role of surface energy balance complexity in land surface models’ sensitivity to increasing carbon dioxide. Clim. Dyn. 2002, 19, 609–618. [Google Scholar]
  4. Pitman, A.J. The evolution of, and revolution in, land surface schemes designed for climate models. Int. J. Climatol. J. R. Meteorol. Soc. 2003, 23, 479–510. [Google Scholar] [CrossRef]
  5. Crossley, J.; Polcher, J.; Cox, P.; Gedney, N.; Planton, S. Uncertainties linked to land-surface processes in climate change simulations. Clim. Dyn. 2000, 16, 949–961. [Google Scholar] [CrossRef]
  6. Dan, L.; Ji, J.; Li, Y. Climatic and biological simulations in a two-way coupled atmosphere–biosphere model (cabm). Glob. Planet. Chang. 2005, 47, 153–169. [Google Scholar] [CrossRef]
  7. Zabel, F. Land-Atmosphere Coupling between a Land Surface Hydrological Model and a regional Climate Model. Doctoral thesis, LMU München, München, Germany, 2012. [Google Scholar]
  8. Intergovernmental Panel on Climate Change (IPCC). Climate Change 2014-Impacts, Adaptation and Vulnerability: Part a: Global and Sectoral Aspects: Volume 1, Global and Sectoral Aspects: Working Group ii Contribution to the Ipcc Fifth Assessment Report; Cambridge University Press: Cambridge, UK, 2014. [Google Scholar]
  9. Fang, G.; Yang, J.; Chen, Y.; Li, Z.; De Maeyer, P. Impact of gcm structure uncertainty on hydrological processes in an arid area of china. Hydrol. Res. 2018, 49, 893–907. [Google Scholar] [CrossRef]
  10. Seneviratne, S.I.; Corti, T.; Davin, E.L.; Hirschi, M.; Jaeger, E.B.; Lehner, I.; Orlowsky, B.; Teuling, A.J. Investigating soil moisture–climate interactions in a changing climate: A review. Earth-Sci. Rev. 2010, 99, 125–161. [Google Scholar] [CrossRef]
  11. Dorigo, W.; Wagner, W.; Albergel, C.; Albrecht, F.; Balsamo, G.; Brocca, L.; Chung, D.; Ertl, M.; Forkel, M.; Gruber, A. Esa cci soil moisture for improved earth system understanding: State-of-the art and future directions. Remote Sens. Environ. 2017, 203, 185–215. [Google Scholar] [CrossRef]
  12. McColl, K.A.; Alemohammad, S.H.; Akbar, R.; Konings, A.G.; Yueh, S.; Entekhabi, D. The global distribution and dynamics of surface soil moisture. Nat. Geosci. 2017, 10, 100–104. [Google Scholar] [CrossRef]
  13. Crow, W.; Chen, F.; Reichle, R.; Xia, Y.; Liu, Q. Exploiting soil moisture, precipitation, and streamflow observations to evaluate soil moisture/runoff coupling in land surface models. Geophys. Res. Lett. 2018, 45, 4869–4878. [Google Scholar] [CrossRef] [PubMed]
  14. van der Molen, M.K.; Dolman, A.J.; Ciais, P.; Eglin, T.; Gobron, N.; Law, B.E.; Meir, P.; Peters, W.; Phillips, O.L.; Reichstein, M. Drought and ecosystem carbon cycling. Agric. For. Meteorol. 2011, 151, 765–773. [Google Scholar] [CrossRef]
  15. Oki, T.; Kanae, S. Global hydrological cycles and world water resources. Science 2006, 313, 1068–1072. [Google Scholar] [CrossRef] [PubMed] [Green Version]
  16. Trenberth, K.E.; Fasullo, J.T.; Kiehl, J. Earth’s global energy budget. Bull. Am. Meteorol. Soc. 2009, 90, 311–324. [Google Scholar] [CrossRef]
  17. Findell, K.L.; Gentine, P.; Lintner, B.R.; Kerr, C. Probability of afternoon precipitation in eastern united states and mexico enhanced by high evaporation. Nat. Geosci. 2011, 4, 434–439. [Google Scholar] [CrossRef]
  18. Taylor, C.M.; de Jeu, R.A.; Guichard, F.; Harris, P.P.; Dorigo, W.A. Afternoon rain more likely over drier soils. Nature 2012, 489, 423–426. [Google Scholar] [CrossRef] [Green Version]
  19. Guillod, B.P.; Orlowsky, B.; Miralles, D.G.; Teuling, A.J.; Seneviratne, S.I. Reconciling spatial and temporal soil moisture effects on afternoon rainfall. Nat. Commun. 2015, 6, 1–6. [Google Scholar] [CrossRef]
  20. Ciais, P.; Reichstein, M.; Viovy, N.; Granier, A.; Ogée, J.; Allard, V.; Aubinet, M.; Buchmann, N.; Bernhofer, C.; Carrara, A. Europe-wide reduction in primary productivity caused by the heat and drought in 2003. Nature 2005, 437, 529–533. [Google Scholar] [CrossRef]
  21. Fischer, E.M.; Seneviratne, S.I.; Lüthi, D.; Schär, C. Contribution of land—Atmosphere coupling to recent european summer heat waves. Geophys. Res. Lett. 2007, 34. [Google Scholar] [CrossRef] [Green Version]
  22. Hirschi, M.; Seneviratne, S.I.; Alexandrov, V.; Boberg, F.; Boroneant, C.; Christensen, O.B.; Formayer, H.; Orlowsky, B.; Stepanek, P. Observational evidence for soil-moisture impact on hot extremes in southeastern europe. Nat. Geosci. 2011, 4, 17–21. [Google Scholar] [CrossRef]
  23. Miralles, D.G.; Teuling, A.J.; Van Heerwaarden, C.C.; De Arellano, J.V.-G. Mega-heatwave temperatures due to combined soil desiccation and atmospheric heat accumulation. Nat. Geosci. 2014, 7, 345–349. [Google Scholar] [CrossRef]
  24. Mueller, B.; Seneviratne, S.I. Hot days induced by precipitation deficits at the global scale. Proc. Natl. Acad. Sci. USA 2012, 109, 12398–12403. [Google Scholar] [CrossRef] [Green Version]
  25. Kuhl, S.C.; Miller, J.R. Seasonal river runoff calculated from a global atmospheric model. Water Resour. Res. 1992, 28, 2029–2039. [Google Scholar] [CrossRef]
  26. Lu, J.; Ji, J. A simulation and mechanism analysis of long-Term variations at land surface over arid/semi-arid area in north china. J. Geophys. Res. Atmos. 2006, 111. [Google Scholar] [CrossRef]
  27. Dan, L.; Ji, J.; Zhang, P. The soil moisture of china in a high resolution climate-vegetation model. Adv. Atmos. Sci. 22, 720–729.
  28. Ji, J. A climate-vegetation interaction model: Simulating physical and biological processes at the surface. J. Biogeogr. 1995, 22, 445–451. [Google Scholar] [CrossRef]
  29. Ji, J.; Hu, Y. A simple land surface process model for use in climate study. Acta Meteorol. Sin. 1989, 3, 342–351. [Google Scholar]
  30. Dan, L.; Ji, J.; He, Y. Use of islscp ii data to intercompare and validate the terrestrial net primary production in a land surface model coupled to a general circulation model. J. Geophys. Res. Atmos. 2007, 112. [Google Scholar] [CrossRef] [Green Version]
  31. Dan, L.; Cao, F.; Gao, R. The improvement of a regional climate model by coupling a land surface model with eco-physiological processes: A case study in 1998. Clim. Chang. 2015, 129, 457–470. [Google Scholar] [CrossRef] [Green Version]
  32. Li, Y.; Ji, J. Model estimates of global carbon flux between vegetation and the atmosphere. Adv. Atmos. Sci. 2001, 18, 807–818. [Google Scholar]
  33. Dan, L.; Ji, J.; Li, Y. Climate simulations based on a different-grid nested and coupled model. Adv. Atmos. Sci. 2002, 19, 487–499. [Google Scholar]
  34. Lu, J.; Ji, J. A simulation study of atmosphere-vegetation interactions over the tibetan plateau part i: Physical fluxes and parameters. Chin. J. Atmos. Sci. 2002, 26, 111–126. [Google Scholar]
  35. Lv, M.; Lu, H.; Yang, K.; Xu, Z.; Lv, M.; Huang, X. Assessment of runoff components simulated by gldas against unh–grdc dataset at global and hemispheric scales. Water 2018, 10, 969. [Google Scholar] [CrossRef] [Green Version]
  36. Rodell, M.; Houser, P.; Jambor, U.; Gottschalck, J.; Mitchell, K.; Meng, C.-J.; Arsenault, K.; Cosgrove, B.; Radakovich, J.; Bosilovich, M. The global land data assimilation system. Bull. Am. Meteorol. Soc. 2004, 85, 381–394. [Google Scholar] [CrossRef] [Green Version]
  37. Fekete, B.M.; Vörösmarty, C.J.; Grabs, W. Global Composite Runoff Fields Based on Observed River Discharge and Simulated Water Balances; University of New Hampshire: Durham, NH, USA, 2000. [Google Scholar]
  38. Fekete, B.M.; Vörösmarty, C.J.; Grabs, W. High-resolution fields of global runoff combining observed river discharge and simulated water balances. Glob. Biogeochem. Cycles 2002, 16, 15-1–15-10. [Google Scholar] [CrossRef]
  39. Cai, X.; Yang, Z.L.; David, C.H.; Niu, G.Y.; Rodell, M. Hydrological evaluation of the noah-mp land surface model for the mississippi river basin. J. Geophys. Res. Atmos. 2015, 119, 23–38. [Google Scholar] [CrossRef]
  40. Liu, Y.; Dorigo, W.A.; Parinussa, R.; de Jeu, R.A.; Wagner, W.; McCabe, M.F.; Evans, J.; Van Dijk, A. Trend-preserving blending of passive and active microwave soil moisture retrievals. Remote Sens. Environ. 2012, 123, 280–297. [Google Scholar] [CrossRef]
  41. Gruber, A.; Dorigo, W.A.; Crow, W.; Wagner, W. Triple collocation-based merging of satellite soil moisture retrievals. IEEE Trans. Geosci. Remote Sens. 2017, 55, 6780–6792. [Google Scholar] [CrossRef]
  42. Gruber, A.; Scanlon, T.; van der Schalie, R.; Wagner, W.; Dorigo, W. Evolution of the esa cci soil moisture climate data records and their underlying merging methodology. Earth Syst. Sci. Data 2019, 11, 717–739. [Google Scholar] [CrossRef] [Green Version]
  43. Miralles, D.G.; Jeu, R.A.M.D.; Gash, J.H.; Holmes, T.R.H.; Dolman, A.J. An application of gleam to estimating global evaporation. Hydrol. Earth Syst. Sci. Discuss. 2011, 8, 1–27. [Google Scholar] [CrossRef] [Green Version]
  44. Martens, B.; Gonzalez Miralles, D.; Lievens, H.; Van Der Schalie, R.; De Jeu, R.A.; Fernández-Prieto, D.; Beck, H.E.; Dorigo, W.; Verhoest, N. Gleam v3: Satellite-based land evaporation and root-zone soil moisture. Geosci. Model Dev. 2017, 10, 1903–1925. [Google Scholar] [CrossRef] [Green Version]
  45. Rienecker, M.M.; Suarez, M.J.; Gelaro, R.; Todling, R.; Bacmeister, J.; Liu, E.; Bosilovich, M.G.; Schubert, S.D.; Takacs, L.; Kim, G.-K. Merra: Nasa’s modern-era retrospective analysis for research and applications. J. Clim. 2011, 24, 3624–3648. [Google Scholar] [CrossRef]
  46. Gelaro, R.; McCarty, W.; Suárez, M.J.; Todling, R.; Molod, A.; Takacs, L.; Randles, C.A.; Darmenov, A.; Bosilovich, M.G.; Reichle, R. The modern-era retrospective analysis for research and applications, version 2 (merra-2). J. Clim. 2017, 30, 5419–5454. [Google Scholar] [CrossRef] [PubMed]
  47. Wang, F.; Wang, L.; Koike, T.; Zhou, H.; Yang, K.; Wang, A.; Li, W. Evaluation and application of a fine-resolution global data set in a semiarid mesoscale river basin with a distributed biosphere hydrological model. J. Geophys. Res. Atmos. 2011, 116. [Google Scholar] [CrossRef]
  48. Wang, A.; Zeng, X. Evaluation of multireanalysis products with in situ observations over the tibetan plateau. J. Geophys. Res. Atmos. 2012, 117. [Google Scholar] [CrossRef]
  49. Wang, W.; Cui, W.; Wang, X.; Chen, X. Evaluation of gldas-1 and gldas-2 forcing data and noah model simulations over china at the monthly scale. J. Hydrometeorol. 2016, 17, 2815–2833. [Google Scholar] [CrossRef]
  50. Yang, F.; Lu, H.; Yang, K.; He, J.; Wang, W.; Wright, J.S.; Li, C.; Han, M.; Li, Y. Evaluation of multiple forcing data sets for precipitation and shortwave radiation over major land areas of china. Hydrol. Earth Syst. Sci. 2017, 21, 5805–5821. [Google Scholar] [CrossRef] [Green Version]
  51. Rui, H.; Beaudoing, H. Readme Document for the Global Land Data Assimilation System Version 2 (Gldas-2) Products; Nasa Goddard Earth Sciences Data and Information Services Center: Greenbelt, MD, USA, 2014. [Google Scholar]
  52. Zhou, X.; Zhang, Y.; Yang, Y.; Yang, Y.; Han, S. Evaluation of anomalies in gldas-1996 dataset. Water Sci. Technol. 2013, 67, 1718–1727. [Google Scholar] [CrossRef]
  53. Ma, H.; Zeng, J.; Chen, N.; Zhang, X.; Cosh, M.H.; Wang, W. Satellite surface soil moisture from smap, smos, amsr2 and esa cci: A comprehensive assessment using global ground-based observations. Remote Sens. Environ. 2019, 231, 111215. [Google Scholar] [CrossRef]
  54. An, R.; Zhang, L.; Wang, Z.; Quaye-Ballard, J.A.; You, J.; Shen, X.; Gao, W.; Huang, L.; Zhao, Y.; Ke, Z. Validation of the esa cci soil moisture product in china. Int. J. Appl. Earth Obs. Geoinf. 2016, 48, 28–36. [Google Scholar] [CrossRef]
  55. Chakravorty, A.; Chahar, B.R.; Sharma, O.P.; Dhanya, C. A regional scale performance evaluation of smos and esa-cci soil moisture products over india with simulated soil moisture from merra-land. Remote Sens. Environ. 2016, 186, 514–527. [Google Scholar] [CrossRef]
  56. Dorigo, W.; Gruber, A.; De Jeu, R.; Wagner, W.; Stacke, T.; Loew, A.; Albergel, C.; Brocca, L.; Chung, D.; Parinussa, R. Evaluation of the esa cci soil moisture product using ground-based observations. Remote Sens. Environ. 2015, 162, 380–395. [Google Scholar] [CrossRef]
  57. Khan, M.S.; Liaqat, U.W.; Baik, J.; Choi, M. Stand-alone uncertainty characterization of gleam, gldas and mod16 evapotranspiration products using an extended triple collocation approach. Agric. For. Meteorol. 2018, 252, 256–268. [Google Scholar] [CrossRef]
  58. Miralles, D.G.; Jiménez, C.; Jung, M.; Michel, D.; Ershadi, A.; McCabe, M.; Hirschi, M.; Martens, B.; Dolman, A.J.; Fisher, J.B. The wacmos-et project-part 2: Evaluation of global terrestrial evaporation data sets. Hydrol. Earth Syst. Sci. 2016, 20, 823–842. [Google Scholar] [CrossRef] [Green Version]
  59. Yang, X.; Yong, B.; Ren, L.; Zhang, Y.; Long, D. Multi-scale validation of gleam evapotranspiration products over china via chinaflux et measurements. Int. J. Remote Sens. 2017, 38, 5688–5709. [Google Scholar] [CrossRef]
  60. Reichle, R.H.; Draper, C.S.; Liu, Q.; Girotto, M.; Mahanama, S.P.; Koster, R.D.; De Lannoy, G.J. Assessment of merra-2 land surface hydrology estimates. J. Clim. 2017, 30, 2937–2960. [Google Scholar] [CrossRef] [Green Version]
  61. Bosilovich, M.G.; Akella, S.; Coy, L.; Cullather, R.; Draper, C.; Gelaro, R.; Kovach, R.; Liu, Q.; Molod, A.; Norris, P. Merra-2: Initial Evaluation of the Climate; NASA Technical Report Series on Global Modeling and Data Assimilation, NASA/TM-2015-104606; National Aeronautics and Space Administration, Goddard Space Flight Center: Greenbelt, MD, USA, 2015; Volume 43, 139p.
  62. Bosilovich, M.G.; Robertson, F.R.; Takacs, L.; Molod, A.; Mocko, D. Atmospheric water balance and variability in the merra-2 reanalysis. J. Clim. 2017, 30, 1177–1196. [Google Scholar] [CrossRef]
  63. Draper, C.S.; Reichle, R.H.; Koster, R.D. Assessment of merra-2 land surface energy flux estimates. J. Clim. 2018, 31, 671–691. [Google Scholar] [CrossRef]
Figure 1. Annual cycle of the AVIM area-weighted mean surface runoff globally (a), in the Northern Hemisphere (b) and in the Southern Hemisphere (c). The GLDAS area-weighted mean surface runoff globally (d), in the Northern Hemisphere (e) and in the Southern Hemisphere (f). The GLDAS area-weighted mean subsurface runoff globally (g), in the Northern Hemisphere (h) and in the Southern Hemisphere (i). (di) were reproduced from Lv et al. [35].
Atmosphere 12 00016 g001
Figure 2. Spatial distribution of the annual mean surface runoff in the AVIM and GLDAS1.0 CLM datasets.
Atmosphere 12 00016 g002
Figure 3. Monthly mean surface soil moisture in the AVIM (a) and MERRA-2 (c) datasets, and the differences between the CCI dataset and the AVIM (b) and MERRA-2 (d) datasets.
Atmosphere 12 00016 g003
Figure 4. Monthly PCC (a), RSD (b), and RB (c) of the surface soil moisture in the AVIM and MERRA-2 datasets with the CCI dataset as a reference. The statistics were calculated based on mean annual monthly global data.
Atmosphere 12 00016 g004
Figure 5. Annual cycle of the area-weighted mean surface soil moisture globally (a), in the Northern Hemisphere (b) and in the Southern Hemisphere (c) for the AVIM, MERRA-2, and CCI datasets.
Atmosphere 12 00016 g005
Figure 6. Monthly mean evapotranspiration (ET) of the AVIM (a) and MERRA-2 (c) datasets, and differences between the GLEAM dataset and the AVIM (b) and MERRA-2 (d) datasets.
Atmosphere 12 00016 g006
Figure 7. Monthly PCC (a), RSD (b), and RB (c) of the AVIM and MERRA-2 evapotranspiration with the GLEAM dataset as a reference. The statistics were calculated based on mean annual monthly global data.
Atmosphere 12 00016 g007
Figure 8. Annual cycle of the global area-weighted mean evapotranspiration (ET) for the AVIM. MERRA-2, and GLEAM datasets.
Atmosphere 12 00016 g008
Table 1. Datasets used in this study.
Global DatasetsForcing DataSurface RunoffTotal RunoffSurface Soil MoistureEvapotranspiration
GLDAS 1.0-CLM, VIC, and Noah (1.0° × 1.0°)
GLDAS 2.1-Noah (0.25° × 0.25°)
UNH-GRDC V1.0 (0.5° × 0.5°)
GLEAM V3.3a (0.25° × 0.25°)
CCI COMBINED V04.7 (0.25° × 0.25°)
MERRA-2 (0.5° × 0.625°)
Publisher’s Note: MDPI stays neutral with regard to jurisdictional claims in published maps and institutional affiliations.