1. Introduction
Over the past three decades, China has witnessed remarkable economic growth with the national gross domestic product (GDP) increasing by about 10% each year [
1]. One consequence of this rapid economic growth is the extraordinary progress of urbanization, which has been accompanied by an acceleration in the urban population from 18% of the national population in 1979 to 49.68% in 2010 [
2]. It is a commonly held belief about urban development in China that the Eastern Coastal region enjoys substantial locational advantage over, and is growing much more rapidly than, Central and Western China. However, several cities in western China have recorded urban population growths comparable to those in the Eastern Coastal cities. For example, urban population in Urumqi, the capital of the Xinjiang Uyghur Autonomous Region in western China, increased by 79% between 1989 and 2006, second only to Shanghai (86%) during the same period [
3]. Compared with the extraordinary development of coastal cities, the urbanization process in western China has its own features and driven mechanism. The growth of Shanghai, one of the centrally administered municipalities (CAMs) and the economic capital of the country, and is expected to show a phenomenal rate of urban growth. However, it is difficult to explain the case of Urumqi, which is located in the remote hinterland, several thousand kilometers from the major centers of economic activity. What have been the defining the characteristics of the urban expansion process in China’s western arid region where Urumqi is located? What is the underlying force driving such rapid urban expansion? How might this urban growth and development proceed in the foreseeable future? This study attempts to gain a better understanding of urban expansion and the internal and external driving forces in recent decades that have operated in the North Xinjiang Economic Zone (NXEZ) of western China. The NXEZ, or North Tian Shan Slope City Belt (NTSSCB), is located in China’s arid zone.
Because of the advantages of remote sensing (RS) and geographical information system (GIS) techniques in handling large-scale data, these tools were widely used to analyze urban expansion and dynamics of land use change as the consequence of the interactions between population, economy, policy, and resources [
4,
5,
6,
7,
8,
9,
10]. Contemporary remote sensing technology makes it possible to monitor and model the spatio-temporal pattern of long-term land cover change in the arid zone of western China [
11,
12,
13,
14].
Dynamic models are more suitable for studying the process of urban land use change, while empirical/statistical models can complement dynamic simulation models to analyze driving factors [
15,
16,
17,
18,
19,
20,
21,
22]. Land use models can help planners understand these dynamics processes and project foreseeable future land use patterns, providing invaluable support for management decisions [
23,
24] because land use dynamics are essential information for environmental management and land use planning [
25]. Based on RS and GIS, the spatial variations of urban growth patterns of Springfield, Missouri were modeled using a logistic geographically weighted regression technique [
26]. Furthermore, a hybrid urban expansion model was proposed to simulate rapid urban growth in Dongying, China, a typical industrial city [
27].
There are many methods that are available for urban expansion modeling. A new urban expansion dynamic (UED) model was presented that incorporates a potential model into a cellular automata (CA) model in order to effectively capture the urban expansion process [
28]. Using a CA model to present the city space dynamic simulation by a kind of loose coupling cellular automaton model, the SLEUTH (slope, land use, exclusion, urban extent, transportation, hill shade) model was employed to model the future (2001–2020) spatial dynamic evolutionary process in western Urumqi [
29].
To address the emerging need for recurring and predicting land use and land cover change, a number of models have been developed, including the Conversion of Land Use and its Effect Scanner (CLUE-S) model. Compared with most empirical models, such as those based on CA frameworks, the CLUE-S model has the capability to simulate multiple land use types simultaneously through the dynamic competition between land use types [
28,
30,
31,
32,
33,
34]. This model also incorporates the stability characteristics of land use systems, ensuring that a drastic change in driving factors will not directly change the landscape structure. Many scholars have employed the CLUE-S model to simulate the competitive relationship between manifold land use types and analyze different scenarios [
35,
36,
37]. The multi-scale capability of CLUE makes it suitable for scenario analysis and for land use change simulation. The CLUE-S model also incorporates the stability characteristics of land use systems, ensuring that drastic change in driving factors will not directly change the landscape structure [
38]. It was employed to simulate the competitive relationship between many land use types and in different scenarios [
39]. The results have theoretical significance and practical implications for city planning in the NXEZ as well.
Since cities and towns in the NXEZ have expanded rapidly in recent years, and the NXEZ has been determined by the central government as the national priority zone for economic development, the historical processes, current situation, and future possibilities of urban expansion are essential for local sustainable development. The North Xinjiang Economic Zone (NXEZ or North Tian Shan Slope City Belt, NTSSCB) is the oasis with the highest population density and the most developed economy in Xinjiang. The gross domestic product (GDP), industrial enterprises above designated size, and town population of the NXEZ, account for 45%, 90%, and 60% of Xinjiang, respectively. The NXEZ is among the national priority economic development zones. Although the cities and towns in the NXEZ expanded rapidly in recent years, the current situation and the processes of urban expansion are not aware. Yet the local government has a strong initiative to promote modernization of cities and towns over the next decade. Therefore, a detailed study of the processes of urbanization and economic development in the NXEZ is crucial for urban system planning and for the sustainable development of Xinjiang, China, which may also provide an essential reference for urban development in other arid regions. In this study, we aim to (1) detect the spatial and temporal patterns of the urban expansion using the CLUE-S model based on RS and GIS techniques, (2) predict the future changes of the urban expansion at different scenarios, and (3) to identify the forcing factors in the urbanization in arid areas.
2. Study Area and Data
2.1. Study Area
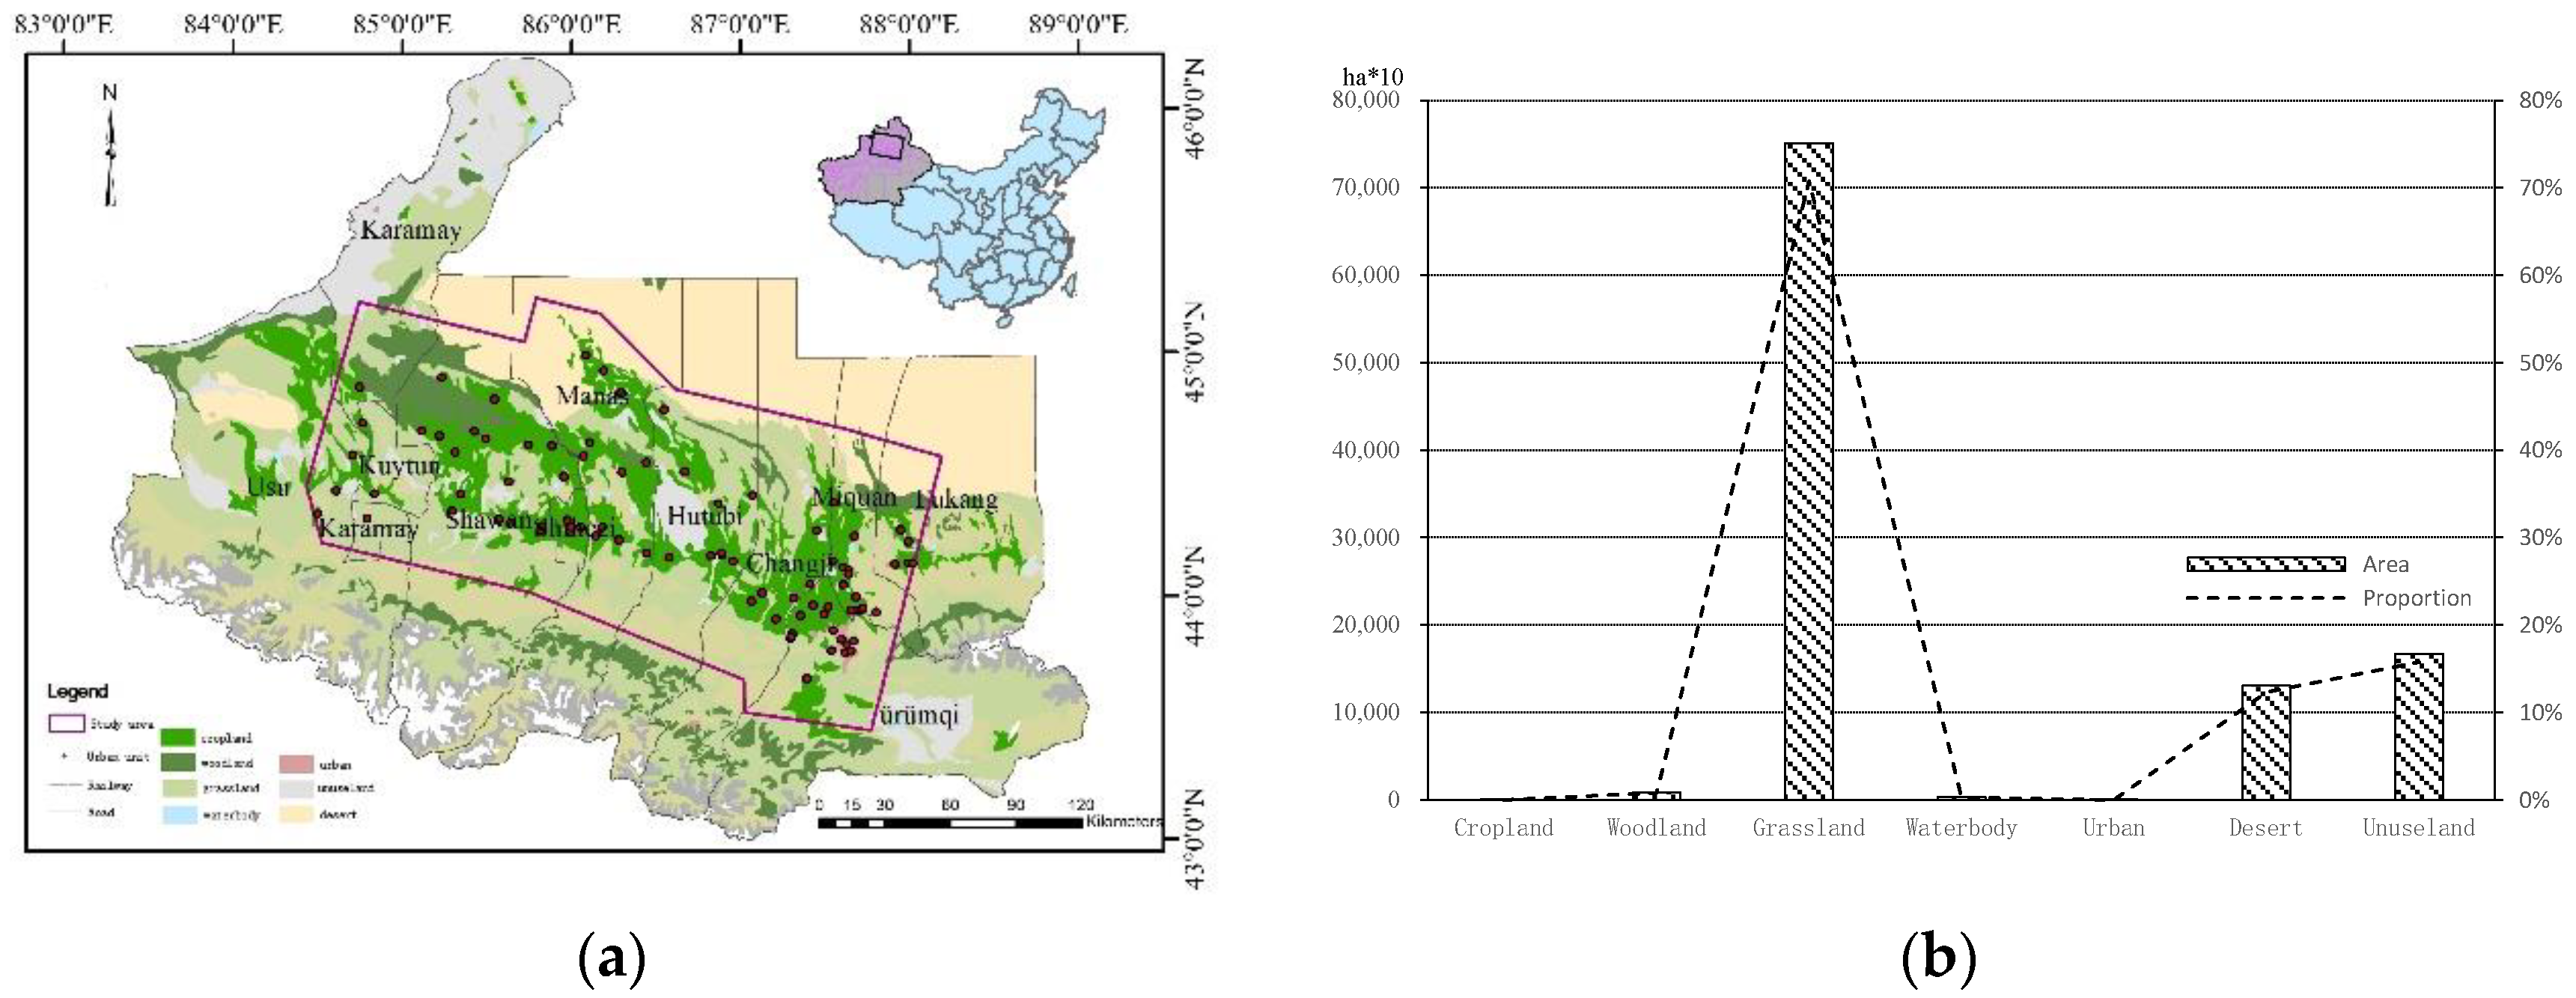
The NXEZ (or NTSSCB) is located in the hinterland of the Eurasian continent, at the geographical center of Asia (43°28′–45°45 lo, 84°45 l–88°09′9). It is a strip-shaped oasis urban zone situated on the alluvial fans that front the northern Tian Shan piedmont at the southern margin of Junggar Basin. With an approximate area of 250 km (length) × 200 km (width), the NXEZ extends from Urumqi in the east to Usu in the west (
Figure 1). The NXEZ city belt comprises 8 cities and 54 administrative towns, having the highest density of cities and urbanization levels in Xinjiang, and more than 60% of the population in the NXEZ is non-agricultural. Indeed, the density of cities is more than 10 times that of other regions in Xinjiang.
The NXEZ is the most economically developed and highly concentrated area of productivity in Xinjiang. It is a typical arid region and rapidly developing urban area in western China (
Figure 1). The NXEZ covers an area of 136,000 km
2, occupying about 8.22% of Xinjiang. Richly endowed with resources, the NXEZ supports a population of 5.6 million, representing 26.8% of the total population of the province. This region is also the most important oasis, and is the region with the highest population density and the most developed economy in Xinjiang. The GDP, industrial enterprises above a designated size, and town population of the NXEZ, accounts for 45%, 90%, and 60% of Xinjiang, respectively [
12].
Two sub-parallel administration systems prevail in Xinjiang that function simultaneously. The first is the ordinary state government hierarchy, and the second is the Xinjiang Production and Construction Corps state government hierarchy (XPCC, or Bingtuan) system. There are 65 city/town units in the study area, which belong to six cities, three counties, and four divisions. Fifty-one of them are under the jurisdiction of the XPCC and the rest belong to the administration of the ordinary state government system.
2.2. Data
2.2.1. Collection of Explanatory Variables
Driving factors not only included commonly used factors for land use change, but also involved other factors in light of the spatial-related factors of the geographic environment and socio-economic situation. In this study, the dependent variables used in the CLUE-S model include the built-up area, arable land, natural land, bare land, and water. The independent variables include DEM, slope, and basic geomorphologic type (e.g., population density, GDP and industry) (
Table 1). Census and other socio-economic statistical data were obtained for building the regional model. Driving factors were selected for logistic models of spatial land patterns of the NXEZ, including independent variable X (covariates) and dependent variable Y (land use map). There were 13 factors in X. Spatial datasets included a digital elevation model (DEM), slope, basic geomorphologic type, roads (levels 1 to 3, China highway classification), rivers, residential areas, and the national-level economic development zones. Each economic development zone in the cities shows that their effects on urbanization are very significant. The zoning map of the economic development zones was entered into the logistic regression model as a government policies factor. The other independent variables were with other spatially referenced socio-economic statistics, such as population density, GDP, and the output of primary, secondary, and tertiary industry based on township government departments (supported by the census data from 1990–2014) (
Table 1).
2.2.2. Remote Sensing Image Classification and Accuracy Assessment
Because of the limitation of data quality in the study area, and to match the image data with the existing ground measurement data (surveyed in 2007), six time series remote sensing datasets were collected. Land cover maps for the entire NXEZ at 1989, 1999, 2002, 2005, 2007, and 2013 were created using Landsat-Thematic Mapper (TM) (1989), Landsat-ETM+ (1999, 2002, 2013), CBERS (2005), and Beijing-1 micro-satellite (2007) images. Each image was geometrically registered to the master image of a SPOT panchromatic image with 10 m resolution acquired in 2004. The images were then resampled to a spatial resolution of 30 m using the nearest neighbor algorithm in order to keep the original pixel brightness value unchanged. The resulting root mean square (RMS) error of each registered image was less than 0.58 pixels.
The object-oriented method was selected for image classification over the entire study area [
40,
41,
42]. Object-oriented classification operates on image objects, rather than a single pixel. Image objects refer to homogeneous, spatially contiguous regions obtained by dividing an image.
An approach combining field survey and the interpretation of aerial photos was used to collect ground reference points. Post 2000 ortho-photographs at a scale of 1:10000 are archived in the Survey Bureau of the Xinjiang Autonomous Region. The necessary protocols and permission were offered to the author, allowing an investigation of the sampling points upon these ortho-photographs. A total of 514 sampling points were achieved, 309 of which were from 2000 to 2004, 121 from 2006, and 84 from 2007. The sample size was large enough to meet the requirements of both accuracy assessment and the construction of image interpretation keys. The classification accuracy was quite satisfactory for image classification. The overall accuracy for image classification was 89.33%, 84.74%, and 86.90%, for the years of 2002, 2005, and 2007, respectively, and the corresponding kappa coefficients was 0.88, 0.83, and 0.83, separately. These results are acceptable considering the very fine classification scheme of 10 land use categories.
3. Methodology
Because of the demand for realistic scenarios of urban expansion, intensive interest has grown for land cover change models with various spatial scales. Therefore, on one hand, urban expansion models have been built for urban region research based on the land cover change model. With this combination, land cover change models could contribute to a better understanding of the driving processes, mechanisms, and controlling factors of landscape dynamics [
38]. On the other hand, land cover change models could be applied to simulate the possible future state of the land, and also to explore land cover change scenarios. This projective capacity makes land cover change models useful tools for policymakers and spatial planning support [
43]. Land cover change model applications contain five functions: decision support, explanation, prediction, impact assessment, and prescription.
This study proposes an approach for the detection, spatial pattern analysis, multi-scenario simulation, and identification of the forces that drive urbanization in arid areas. Using multi-temporal satellite images, urban expansion patterns in the NXEZ from 1989–2013 were retrieved and investigated. Landscape ecology methods and several landscape metrics (indices), including the landscape variety index, uniformity index, landscape dominance index, landscape fragmentation index, and landscape separation index, were employed to explore the patterns of urban land change; and logistical models were used to identify the major factors influencing rapid urban expansion in the NXEZ over the study period. The CLUE-S model was used to simulate the future development of cities and towns (
Table 2).
3.1. CLUE-S Model
The CLUE-S model was developed to simulate land use changes using empirically quantified relations between land use and its driving factors in combination with dynamic modeling of competition among land use types [
30,
31]. This model is sub-divided into two distinct modules: a non-spatial demand module and a spatially explicit allocation procedure. The non-spatial module calculates the area change for all land use types at the aggregate level. Within the second part of the model, these demands are translated into land use changes at different locations within the study region using a raster-based system [
44].
3.1.1. Model Simulation
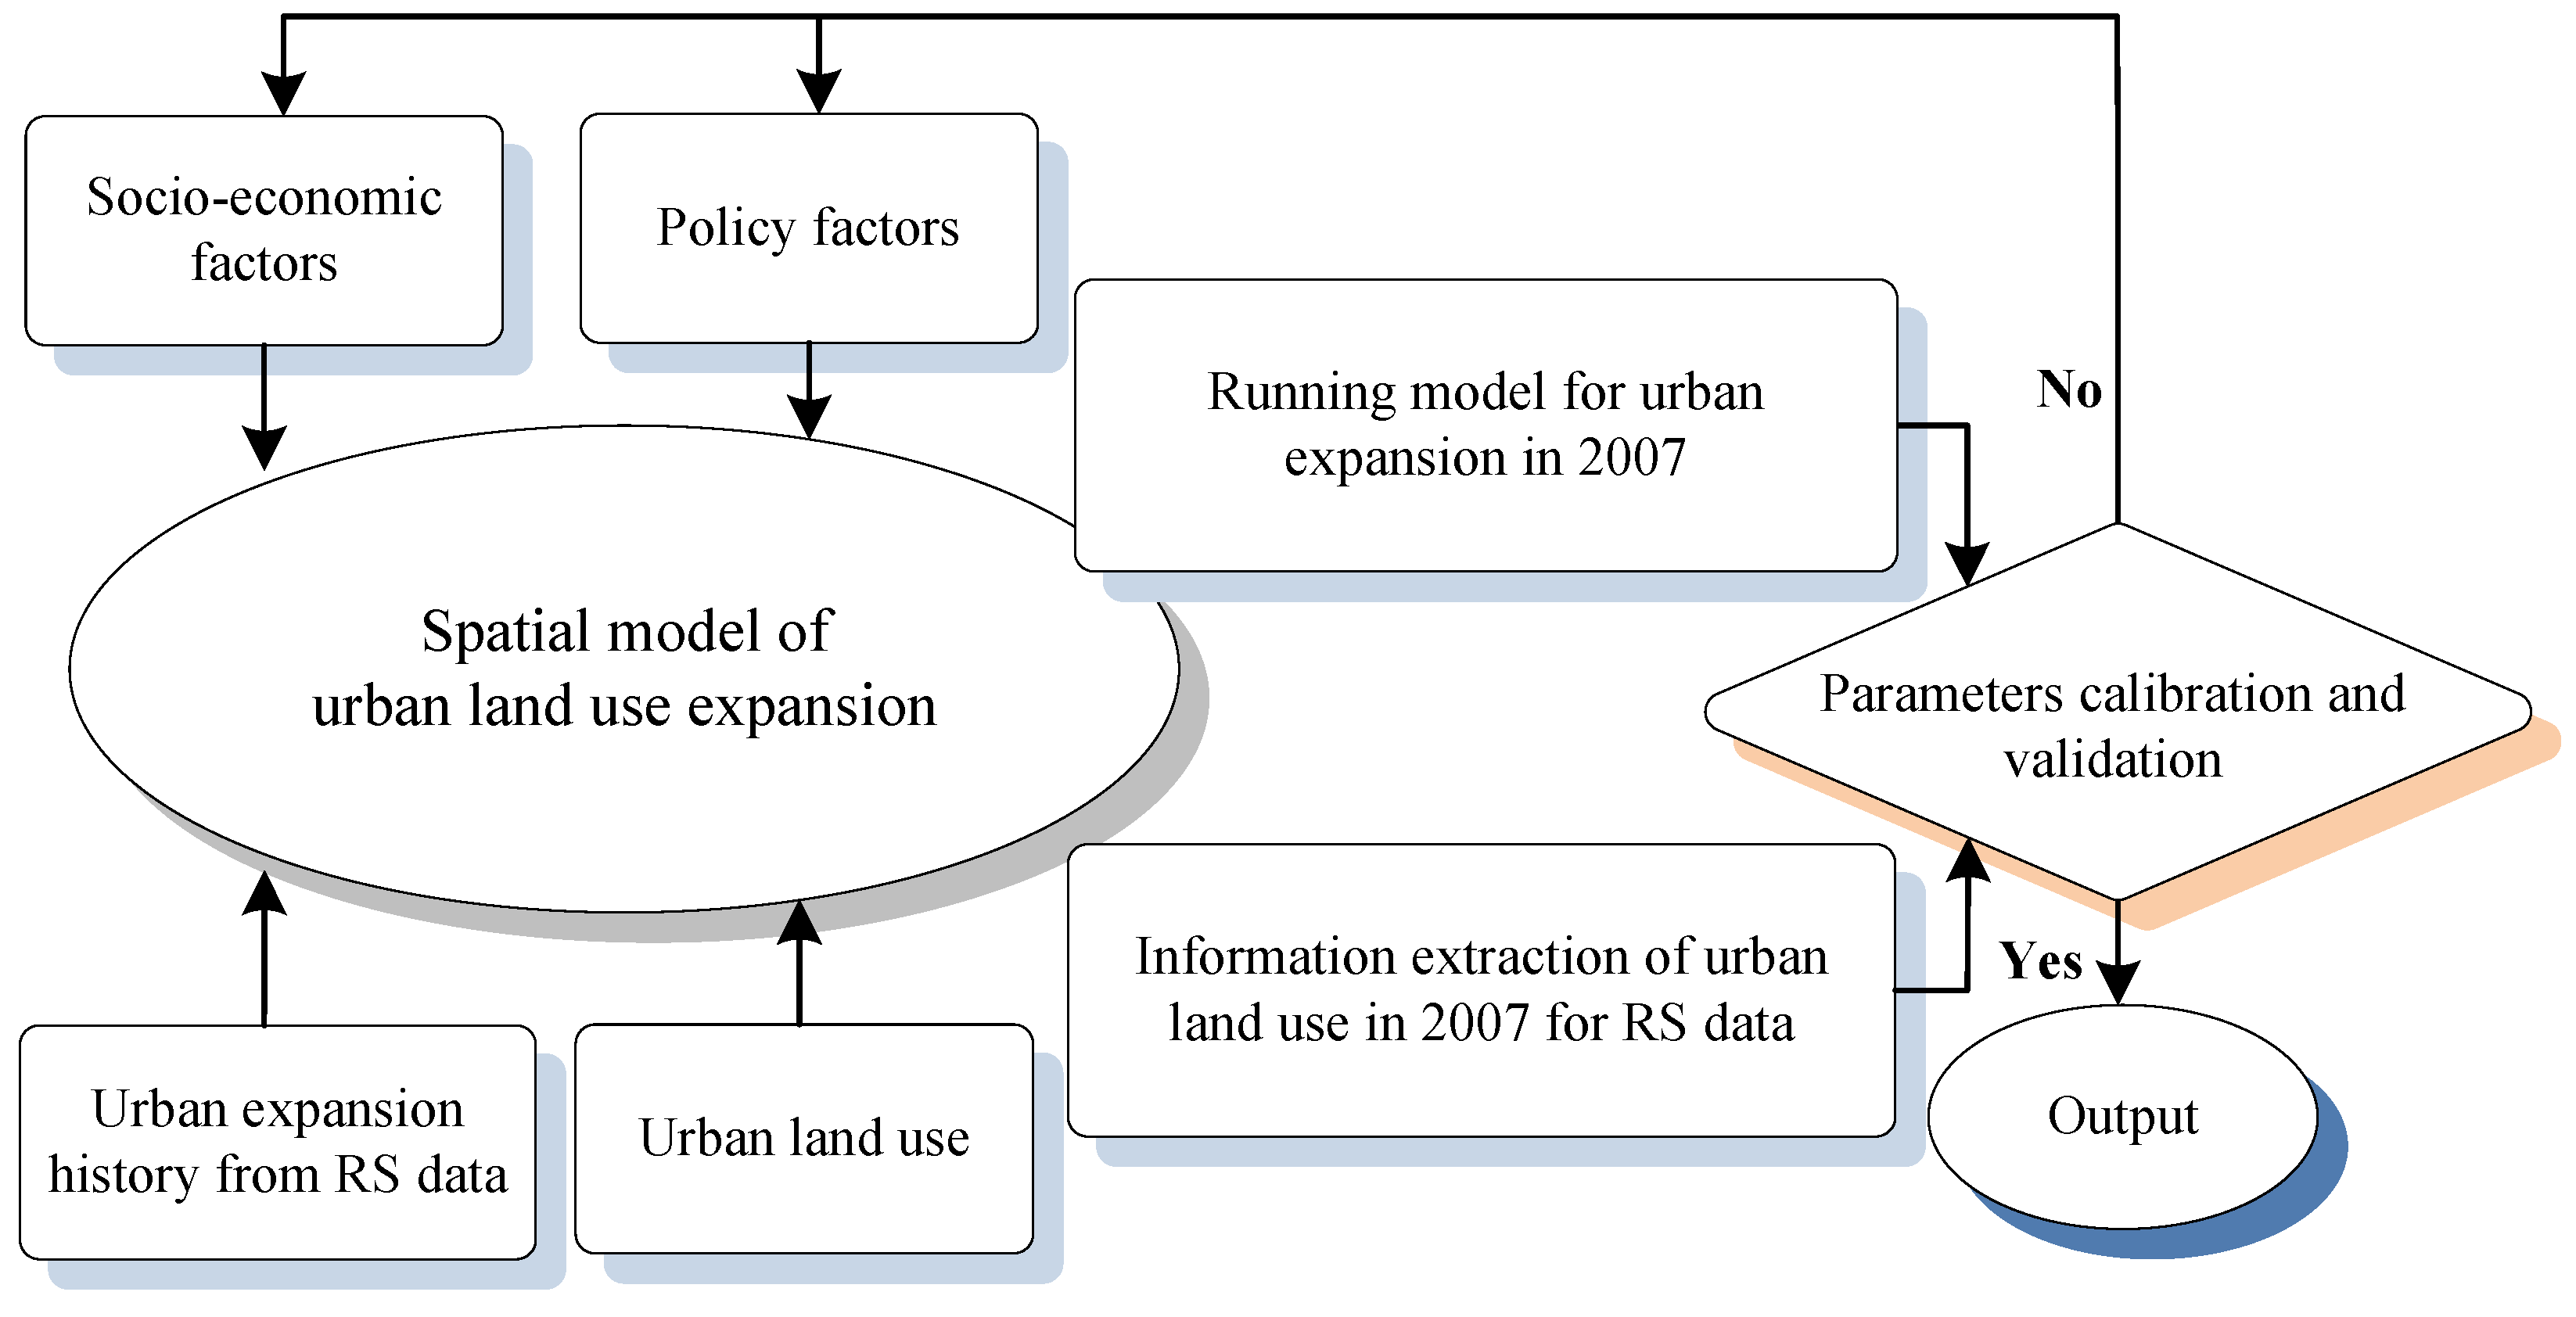
In this study, CLUE-S was run over a period of 24 years (1989–2013), taking the year 2007 as the baseline because of reliable data sources that was validated by ground truth data (
Figure 2). In this study, we have 84 field sample points in 2007 at the country town scale that are distributed at the regions with sensitivity land use and land changes. To investigate the performance of the CLUE-S model, the land changes at 2007 is obtained from the forward simulation during 1989–2007. The simulated land changes at 2007 are evaluated by the field sample points which can display the model’s performance. To investigate land changes in future, we apply the backward simulation during 2007–2013 at different scenarios. The simulation processes included data preparation, image processing, analysis, modeling, and simulation. The modeling step was composed of model calibration, model statistic accuracy analysis, and model spatial accuracy analysis. The model simulation included the scenario design, scenario simulation, and scenario analysis.
3.1.2. Specific Conversion Settings for Each Land Use Type
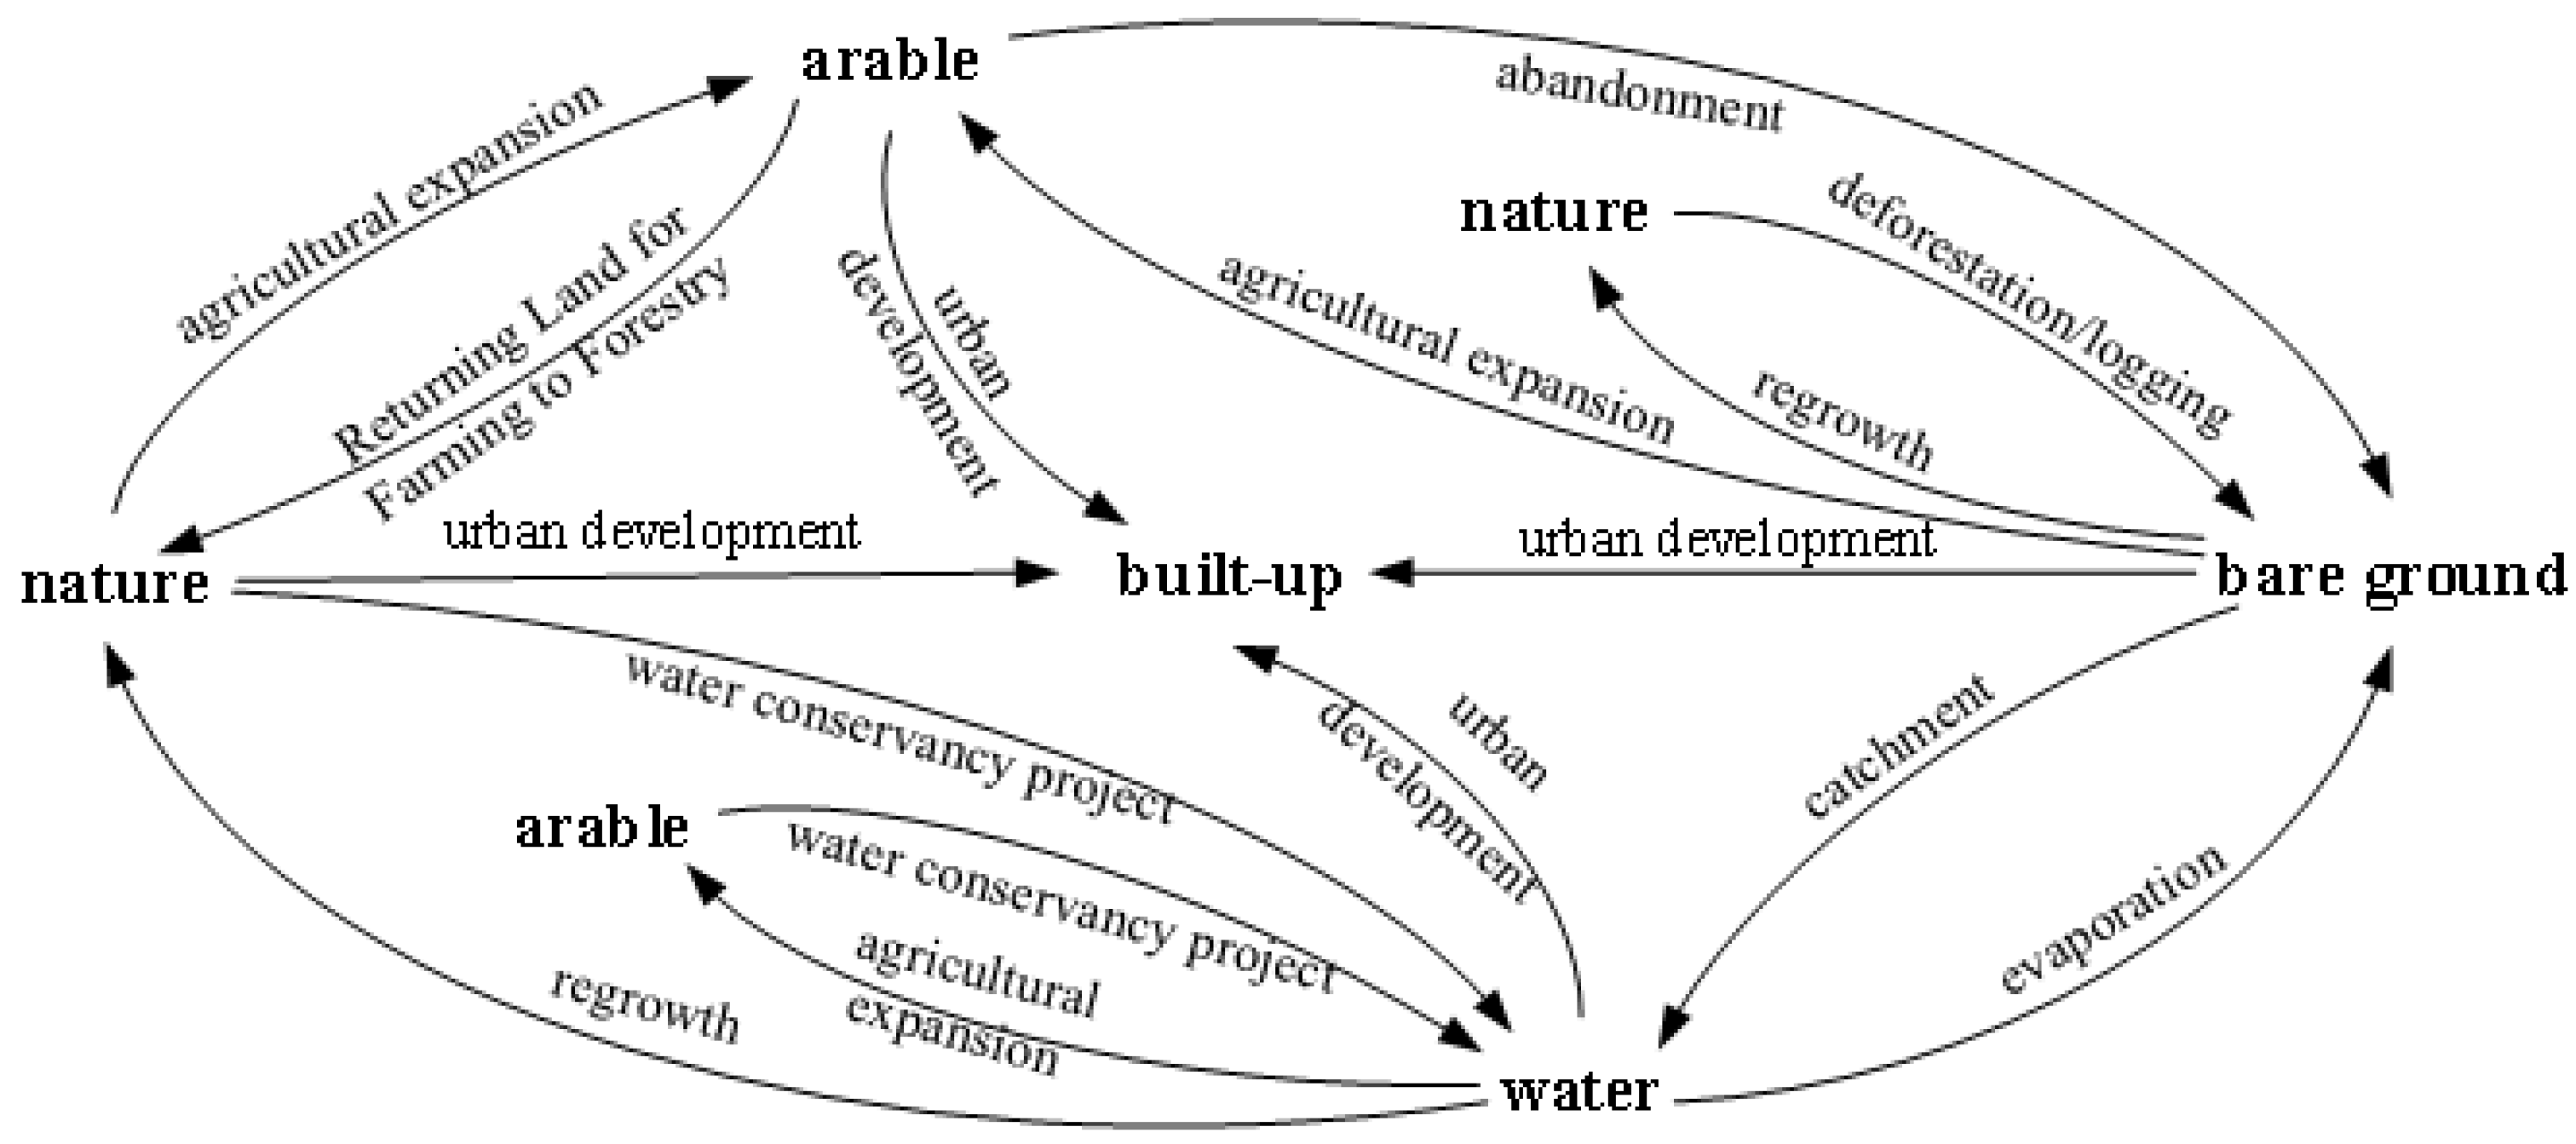
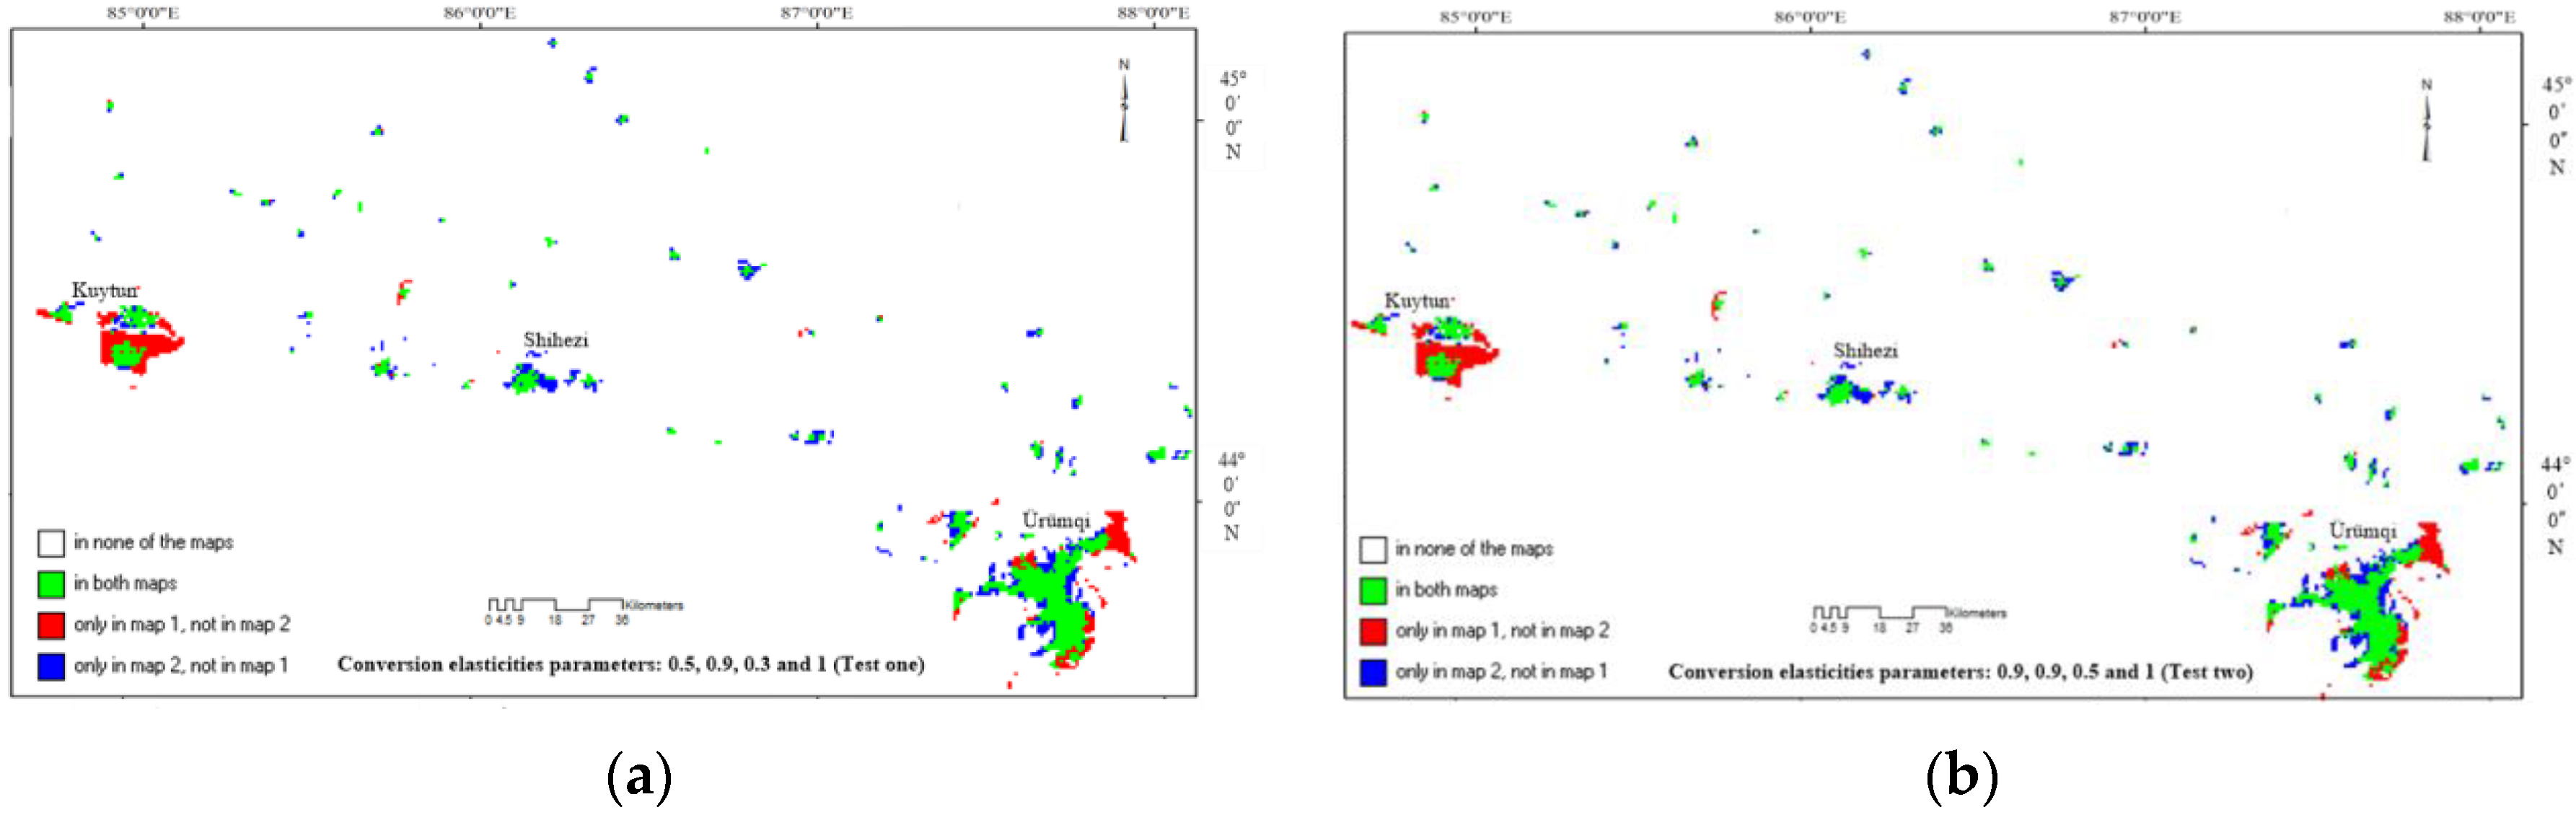
Specific conversion settings for each land use type determined the temporal dynamics of the simulations. Two sets of parameters were required to characterize the individual land use types: conversion elasticity (ELAS) and land use transition sequences. ELAS is related to the reversibility of land use change. A value needs to be specified that represents the relative elasticity toward change, ranging from 0 (easy conversion) to 1 (irreversible change). In this study, four land use types include arable land, water body, natural and built-up areas with the ELSA rates of 0.5, 0.9, 0.4, and 1, respectively, which are described as possible land use trajectories (
Figure 3). Once built-up areas are established, it is almost impossible to convert to other land use types. Thus, 90% of water in the plains is stored in reservoirs in arid regions, and their status is relatively stable. Xinjiang is dominated by agriculture and animal husbandry, despite the cropland resources being limited; however, its change trend has increased each year, and the spatial distribution is relatively stable. Natural land is easily converted to other land use types.
The specific conversion settings for each land use type are specified in a conversion matrix that represents temporal characteristics. This matrix defines the other land use types to which the present land use type may or may not be converted [
44]. The built-up areas could not be converted to any other land use types. Arable land can convert to water body and natural land use types. An inter-conversion is observed between water body and natural land use.
3.1.3. Spatial Policies and Restrictions
Spatial policies and restrictions indicate the specific areas where land use changes are restricted. Spatial policies influence the patterns of land use change. The conversions that are restricted by a certain spatial policy, or by a special development zone, are indicated in a land use conversion matrix [
44].
3.1.4. Land Use Requirements (Demand)
Land use requirements (demand) are calculated at the aggregate level (considering the entire study area as a whole) as part of a specific scenario. In this approach, land use requirements are calculated independently from the CLUE-S model [
44]. In this model, there are two steps to go through in the simulation process, namely, interpolation and extrapolation. First, we conducted the interpolation of land use change year-by-year for each year from 1989 to 2007, and from 2007 to 2013, based on the images classification results. Second, we conducted the extrapolation of future trends in land use demand by scenario analysis.
3.1.5. Location Characteristics
The preference for a particular location is empirically estimated from a set of factors that are based on the different disciplinary understandings of the determinants of land use change [
32]. Binomial logistic regression was used to define the relationships between land use types and the driving factors, which can be expressed by Equation (1):
where
= probability of the occurrence of the land use type,
= regression values, output by the regression model, and
= driving factor. Here,
is the probability of occurrence within a particular grid cell of the considered land use type at location
i, and
Xn are the location factors. The coefficients (
β) are estimated through logistic regression using the actual land use pattern as a dependent variable.
The regression results of the driving factors were tested with the receiver operating characteristic (ROC) method, which has been applied to many models that predict a homogenous category in each grid cell. When the ROC result is above 0.70, the results indicate a relatively high consistency.
3.2. Model Validation
Model validation was performed in two ways. The first method applied the goodness of fit of logistic regression models to evaluate the model performance by the relative operating characteristic), which ranges between 0.5 (completely random) and 1.0 (perfect fit) [
45]. The most important factors influencing the spatial distribution of land use were identified from the logistic regression as those with a confidence level greater than 95% and 1.0 (analyses were combined to determine the location suitability of the land use types, which were then used in the spatial allocation). Alternatively, the second approach used the Kappa index to evaluate the modeled land use types. The reliable classification from remote sensing data of 2007 that passed the accuracy assessment was employed as reference data for validation simulation results using the Kappa index.
3.3. Scenario Analyses
Two different scenario analyses were designed for urban expansion in the NXEZ: (i) land requirements of trend, and (ii) rapid urban expansion supported by policies. In the first scenario, the land requirement of trend for the scenario analysis model was based on an analysis of the overall trends of urban expansion in the NXEZ over the past 20 years. We extrapolated the trends in land use demand from 2013 into the near future (2020).
The second scenario focused on the rapid urban expansion supported by policies. Based on the development trends of urban expansion, the urban development model was employed to simulate the spatial distribution of urban development under two conditions: (1) The demand that the NXEZ upgrades to national key economic development zone status; and (2) a two-times increase in the built-up area over the next 20 years.
4. Results
4.1. Significance of Influencing Factors on Urban Expansion
Table 3 lists the statistically significant driving factors of land use based on logistic regression. In general, the spatial distributions of the four land use types were statistically well explained by the selected factors, as indicated by high ROC values (ranging from 0.75–0.84). DEM always has the significant positive contribution to the built-up areas during 1989–2013, which is explained by the positive values of β (
Table 3). Except the insignificant contribution of slope in 2005, distance to road in 2005 and 2007, and distance to town center in 2007, these three factors have the positive impacts on the built-up areas. Population has the significant negative impact on the built-up areas with the factor value of −0.001 at 2013, the impacts in the other periods are insignificant (
Table 3). GDP has negative impacts in 2002, and 2007 at the 99% confidence level. For the industries, except the significant positive impact on built-up areas, the influences of primary industry are insignificant. The second industry has the significant positive impacts at the last two years 2007 and 2013, and three negative significant impacts are observed between tertiary industry and built-up areas at 1999, 2005, and 2013 (
Table 3). The insignificant impacts of some factors (e.g., population density, primary industry, and second industry) may be explained that the human factors may have weak impacts on built-up areas, which natural factors (e.g., DEM, distance to road, and distance to town center) have the primary key roles in determining the built-up areas. These future researches will be explored in our future analysis.
The rank of significance in every year is listed in
Table 4, where “1” represents the most significant, “2” indicates the second most significant, and “0” means insignificant. This ranking suggests several states about the mechanisms of urban expansion. From 1989–2002, urban expansion was driven by six major factors: five natural and spatial factors and one human activity factor (
Table 4). The natural factors (i.e., topography, slope, river, and road) and spatial factors (i.e., town center distance) are the main constraints of urban expansion. After reforms and opening up, economic development made superfluous agricultural population transfer to the town and city. After 1999, tertiary industry became the main human factor driving town expansion, along with social and economic development. Services, real estate, and tourism are further drivers of town expansion. This indicates that the overall economic strength of urban areas in the NXEZ have passed into a new stage. Primary, secondary, and tertiary industry had already initiated a chain effect on urban development. Moreover, economic development had become the primary impetus of urban extension. In 2013, three human factors—population, secondary industry, and tertiary industry—jointly influenced town expansion (
Table 4). The scale effect of population in the NXEZ had begun to appear in the developing of towns. Interaction between the three human factors showed that the population’s demand of industry and services had increased. With a greater rural population moving to the cities, the effect accelerated the development of urban agglomerations. The five natural factors again became constraints for urban expansion. This situation suggests that the easily exploited areas decreased because of an increase in construction difficulty and the costs of town expansion.
4.2. Detection of Land Use Changes
Land use change in the NXEZ were quantified by classification maps of remote sensing data in 1989, 1999, 2002, 2005, 2007, and 2013.
Table 5 and
Table 6 show the CA (total area) of built-up areas that changed from 1989–2013.
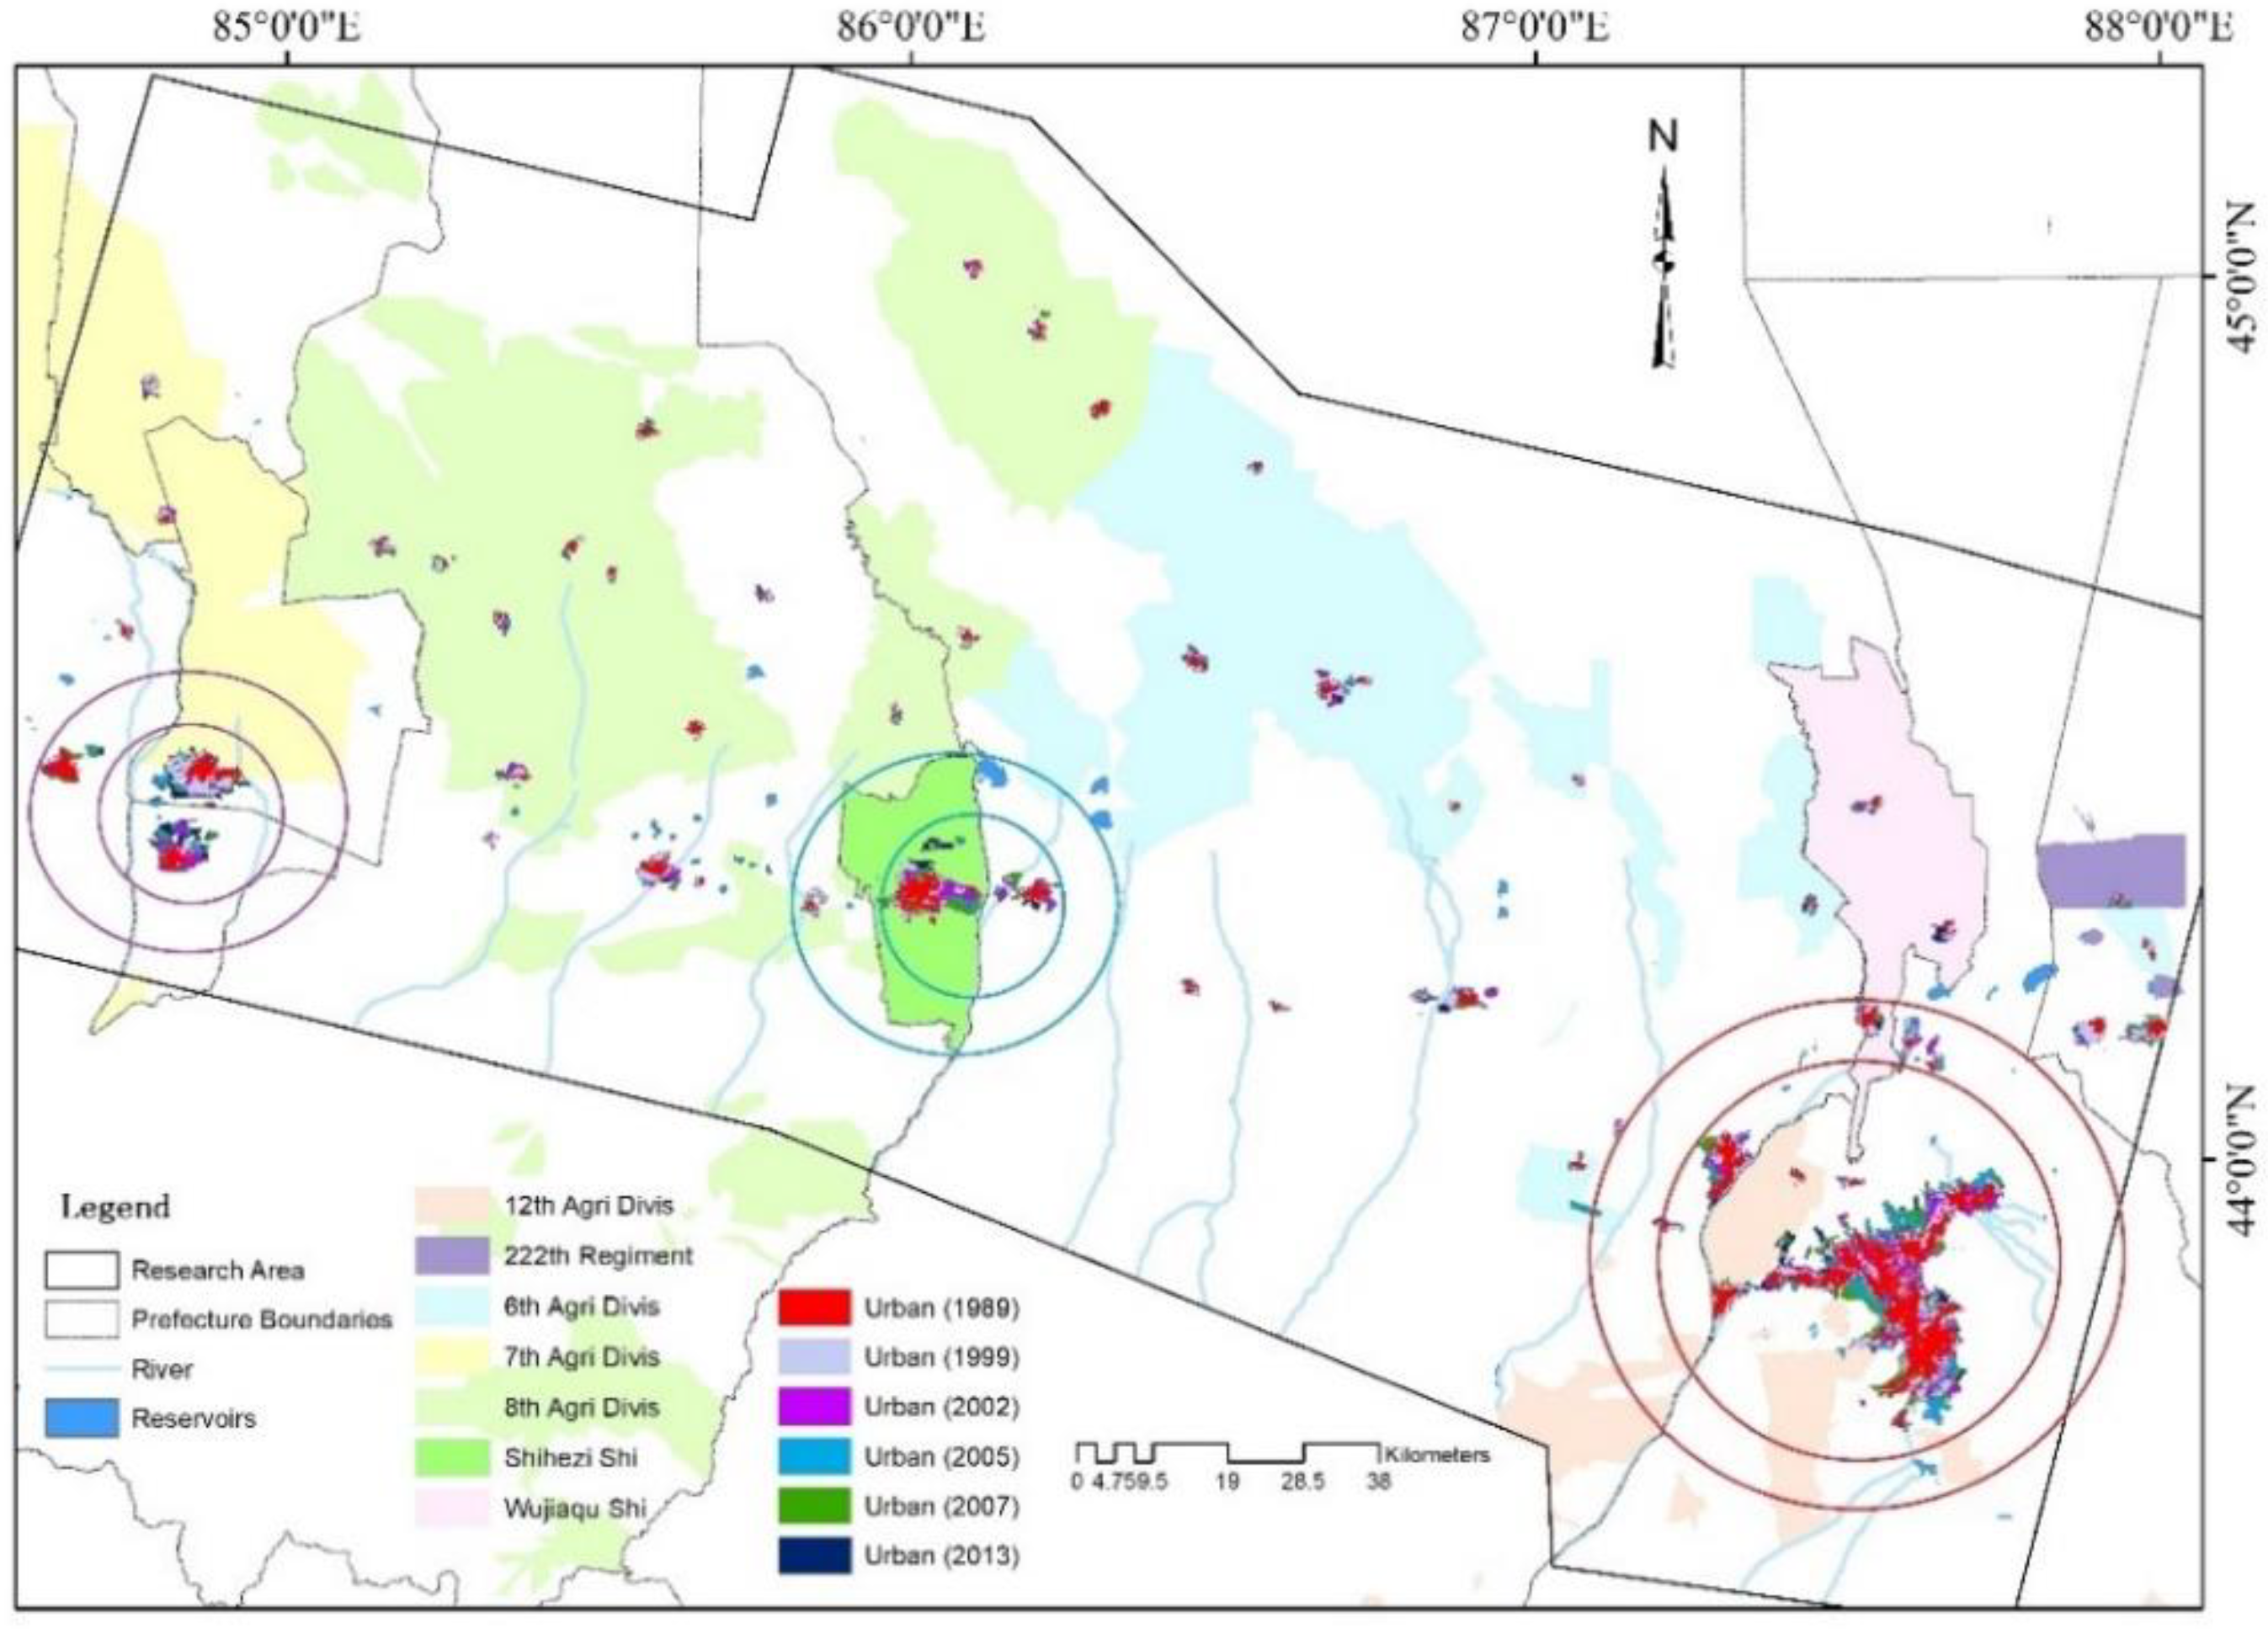
According to the administration hierarchy, land use changes in the cities and towns for the ordinary administration system and the XPCC were calculated separately. Three rapidly growing regions were identified: the subsidiary farm of XPCC’s 12th Division and Wujiaqu near Urumqi, the subsidiary farm of the XPCC’s 8th Division near Shihezi, and the subsidiary farm of the XPCC’s 7th Division near Dushanzi and Kuytun. In these regions, the urban built-up area increased by 5–10 times. The phenomenal expansion of these regions highlights the fact that the three major cities—Urumqi, Shihezi, and Dushanzi/Kuytun—have constant momentum to spur urbanization in the NXEZ.
Among the cities at the county level, Shawan County and Dushanzi City grew with the fastest speeds, recording an increase in the built-up area of about six times. This was followed by Kuytun City and Hutubi County, with growths of 4.5 to 5 times. Manas County and Fukang City lagged slightly behind, with an increase in urban area of about 3.5 times. Changji City and Urumqi City, had increases of 2 to 3 times, and Usu had an increase of around 1.5 times; these were the cities with the least urban expansion. It was shown that newly established county-level cities have been growing relatively much faster than their counterparts.
Built-up areas, once established, are difficult to convert to other land uses. As towns expand, other land use and land cover resources are occupied and converted to built-up areas. The land resources that were transferred to built-up areas from 1989–2013 are shown in
Table 7.
All of the cities and towns in the NXEZ developed on a low-altitude plain. Urban expansion progressed mainly by encroaching upon cultivated land. Of all the land converted to built-up urban areas, the largest proportion (279 km2, or 42.2%) was from arable land over the past 25 years, followed by grassland (146.8 km2, or 22.2%) and bare land (137.6 km2, or 20.9%). These three categories account for 85.3% of the total land encroached upon by urban expansion. Spatially, urban expansion in the NXEZ proceeded contiguously, i.e., the land immediately adjacent to an existing city was usually the first to be encroached upon. The expansion of Urumqi has now entered a mature stage. Urumqi is enclosed on three sides by low or moderate hills and plateaus, with a low-altitude plain on the northern side, which explains why the current expansion direction is northward. The newly rising cities, such as Changji, Shihezi, Wujiaqu, Kuytun, and Shawan, mainly rely on the conversion of cultivated land to achieve urban expansion. Petroleum and industrial cities, such as Dushanzi, are primarily dependent on the conversion of bare land in the Gobi Desert to make space for urban development. The expansion of Usu Shi is relatively slow, and the converted built-up area is roughly equally contributed by cultivated land, bare land, and grassland.
Landscape metrics were usually employed to explore the patterns of urban land changes. In this study, the total area (TA) was increased nearly three times from 244.03 km
2 at 1989 to 712.68 km
2 at 2013 which indicated the high speed urban expansion. The corresponding proportion of landscape (PLAND) and the largest patch index (LPI) was increased from 0.75 to 2.18, and from 0.34 to 0.95, respectively. In terms of the landscape fragmentation and fractal analysis, the results of the patch density (PD), perimeter-area fractal dimension (PAFRAC), and area-weighted mean patch fractal dimension index (FRAC_AM) of the built-up areas in the NXEZ are displayed in
Table 8. PD was low density with the values from 0.0027 at 1989 to 0.0035 at 2007. PAFRAC was decreased from 1.35 to 1.28, and the corresponding FRAC_AM changed from 1.16 to 1.13 (
Table 8).
Three clusters of cities are identified in the NXEZ in
Figure 4, where the dominant patches exist. These three clusters are Urumqi-Changji, Kuytun-Dushanzi-Usu (the Golden Triangle Area), and Shihezi of the XPCC. The distance between each city cluster is roughly 150 km. From
Figure 4, the arable land is increasing than the built up which is caused by the rapid population growth which needs more land to develop agriculture.
4.3. Land Use Simulation Result
A forward simulation was carried out for the period of 1989–2007, and a backward simulation was set up for the period of 2007–2013. Since the land use map of 2007 was validated by ground reference data, the simulated result was validated by the land use map for 2007 with Kappa statistical analysis. To simplify the modeling process, bare ground, grassland, and woodland were combined into one land use type termed natural land; this was decided because there are the same spatial policy restrictions in bare ground and natural land, because of human activities of agricultural expansion, such as the opening up wasteland and the re-growth of vegetation. In order to display the simulation result clearly, spatial distributions of the simulation accuracy are provided in
Figure 5 and the quantitative analyses are shown in
Table 9 based on the Kappa indices.
For the forward simulation, most areas of the land use are captured by the CLUE-S model in Urumqi, the areas in the northeast Urumqi are only displayed in map 1, not in map 2. For Shihezi city, the central areas are both in map 1 and map 2, and the surrounding areas are only in map2. The areas both in map1 and in map 2 appear in north and part south Kuytun city, and some parts of areas are only in map1 (
Figure 5a). The backward simulation has the similar spatial distributions as in the results of the forward simulation (
Figure 5b).
Kappa indices were used to validate the accuracy of the simulation results. The values of Kfuzzy ranged from 0–1. If the value was 1, it was suggested that the simulation map matched the observed map perfectly. By overlapping the observed maps, the Kappa values of the CLUE-S models were larger than 0.75. The Kappa values showed that the simulation results had considerable accuracy (
Table 9).
4.4. Scenario Analysis With CLUE-S
Two different scenario analyses were designed for urban expansion in the NXEZ: (i) land requirements of trend, and (ii) rapid urban expansion supported by policies.
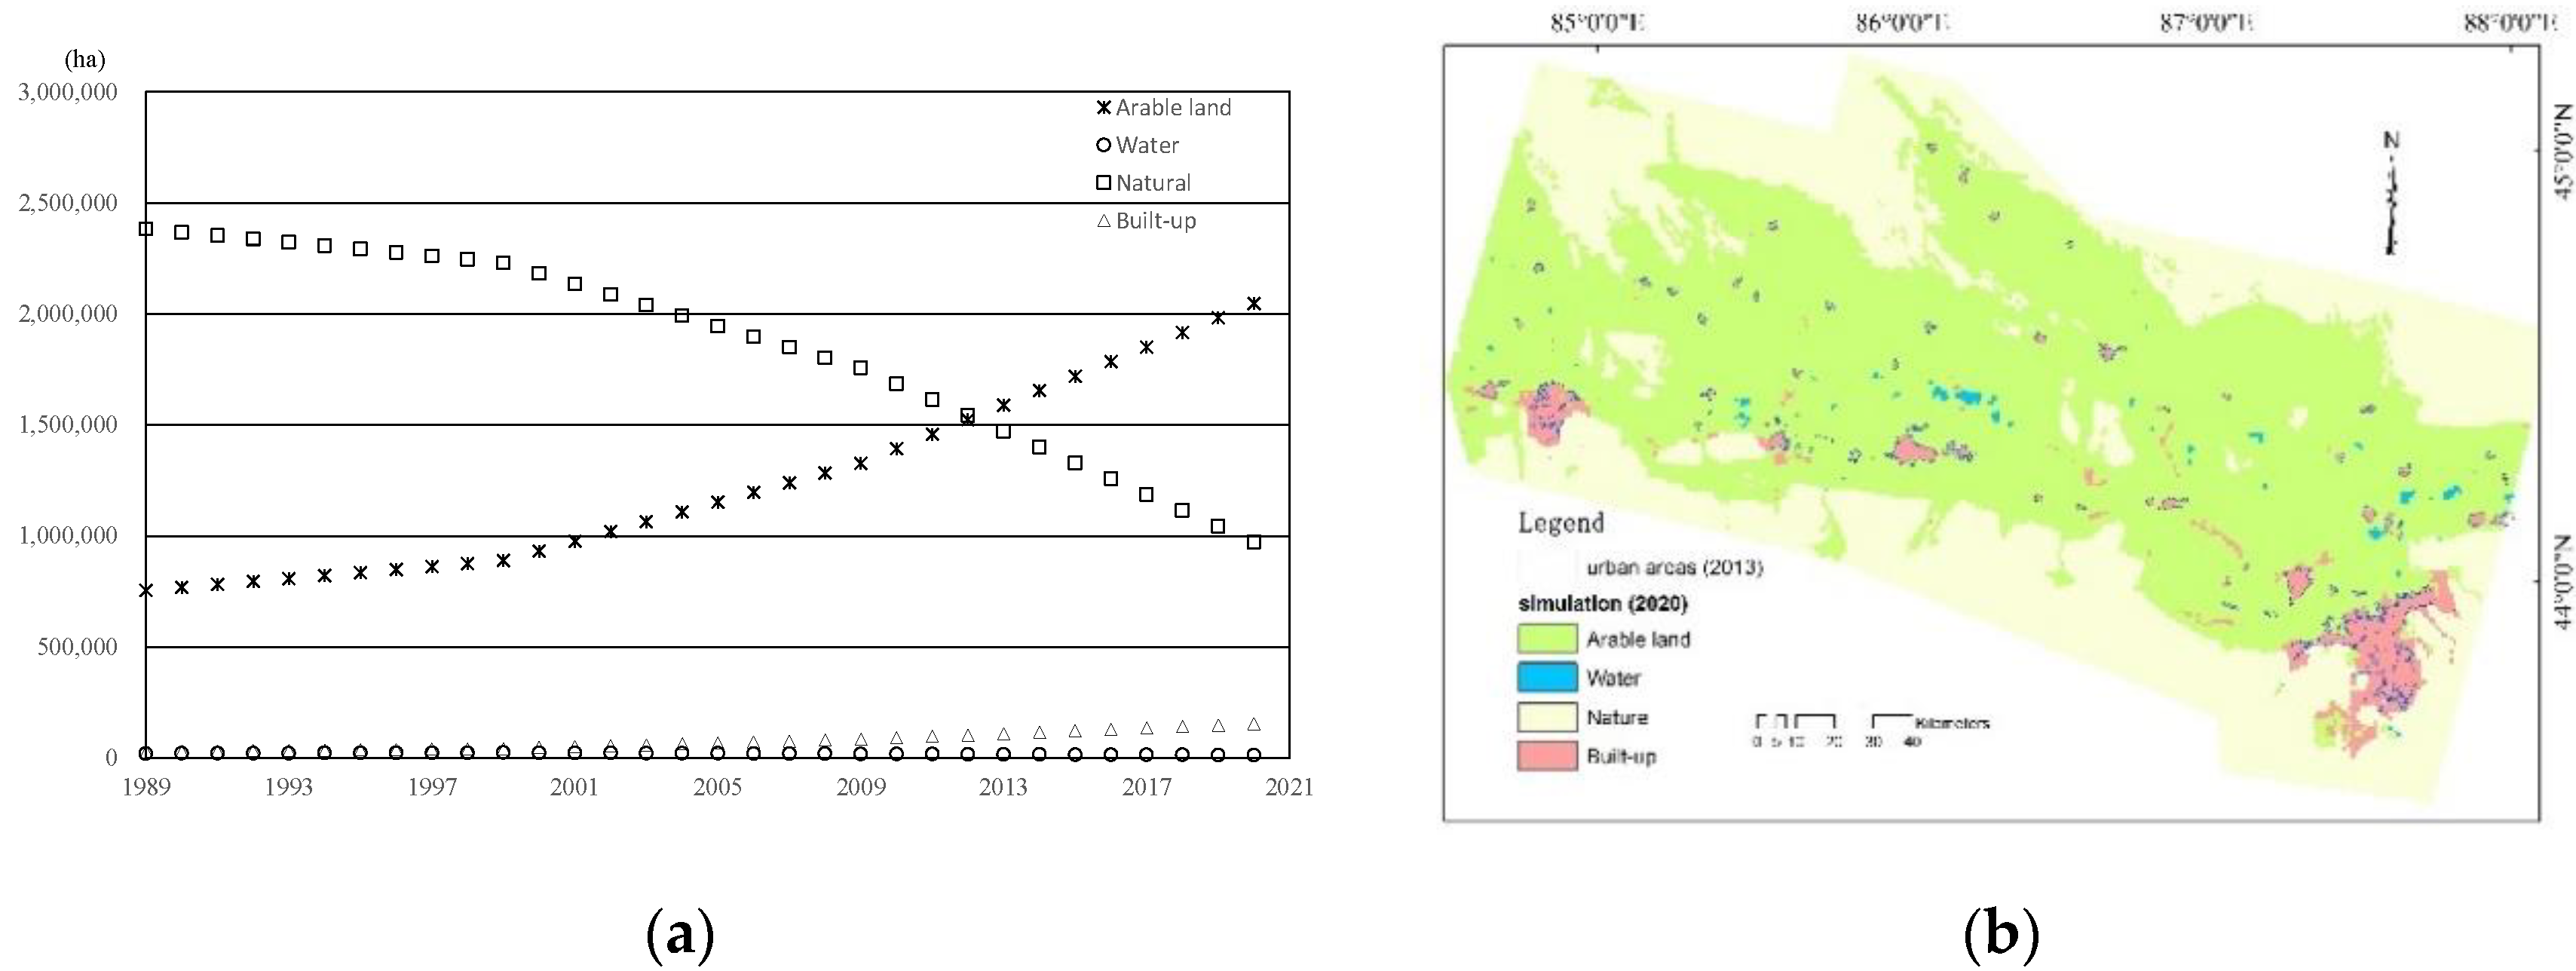
In the first scenario, the land requirement of trend for scenario analysis model was based on an analysis of the overall trends of urban expansion in the NXEZ over the past 20 years. We extrapolated the trends in land use demand into the near future from 2013–2020. Under this condition, the current trends of GDP, population, and policies, may affect the status of urban expansion after 10 years. The forecast land use demand, trends, and simulation results from 2013–2020 are shown in
Figure 6.
From the spatial data statistics of simulation results, the arable land will increase by 46.1% by the year 2020, and the built-up area will increase by 73.5%; meanwhile, bare land, grassland, and forest land will be reduced by 33.4%, and water bodies will be reduced by 40.5%. Under this condition, the current trends of GDP, population, and policies will affect the status of urban expansion after 10 years. These results suggest that the three core areas of Urumqi, Shihezi, and Kuytun should further encourage the development of contiguous towns over the next 10 years. Kuytun, Dushanzi, and Usu especially need superior policies and investment to encourage their contiguous development. Under the current policy, it is difficult for these three cities to unify Kuytun, Usu, and Dushanzi as a core area (the Golden Triangle area). The simulation results of corps farm and small towns around the core cities present different characteristics. The construction of small towns needs to be further strengthened to drive the contiguous development in the NXEZ. The corps in Xinjiang implemented the policy of the “center farm” in 2000; the core content was to emphatically develop a center farm and encourage the development of 2–3 surrounding farms. This policy is consistent with the view of strengthening the regional structure of small towns, and is worth further implementation.
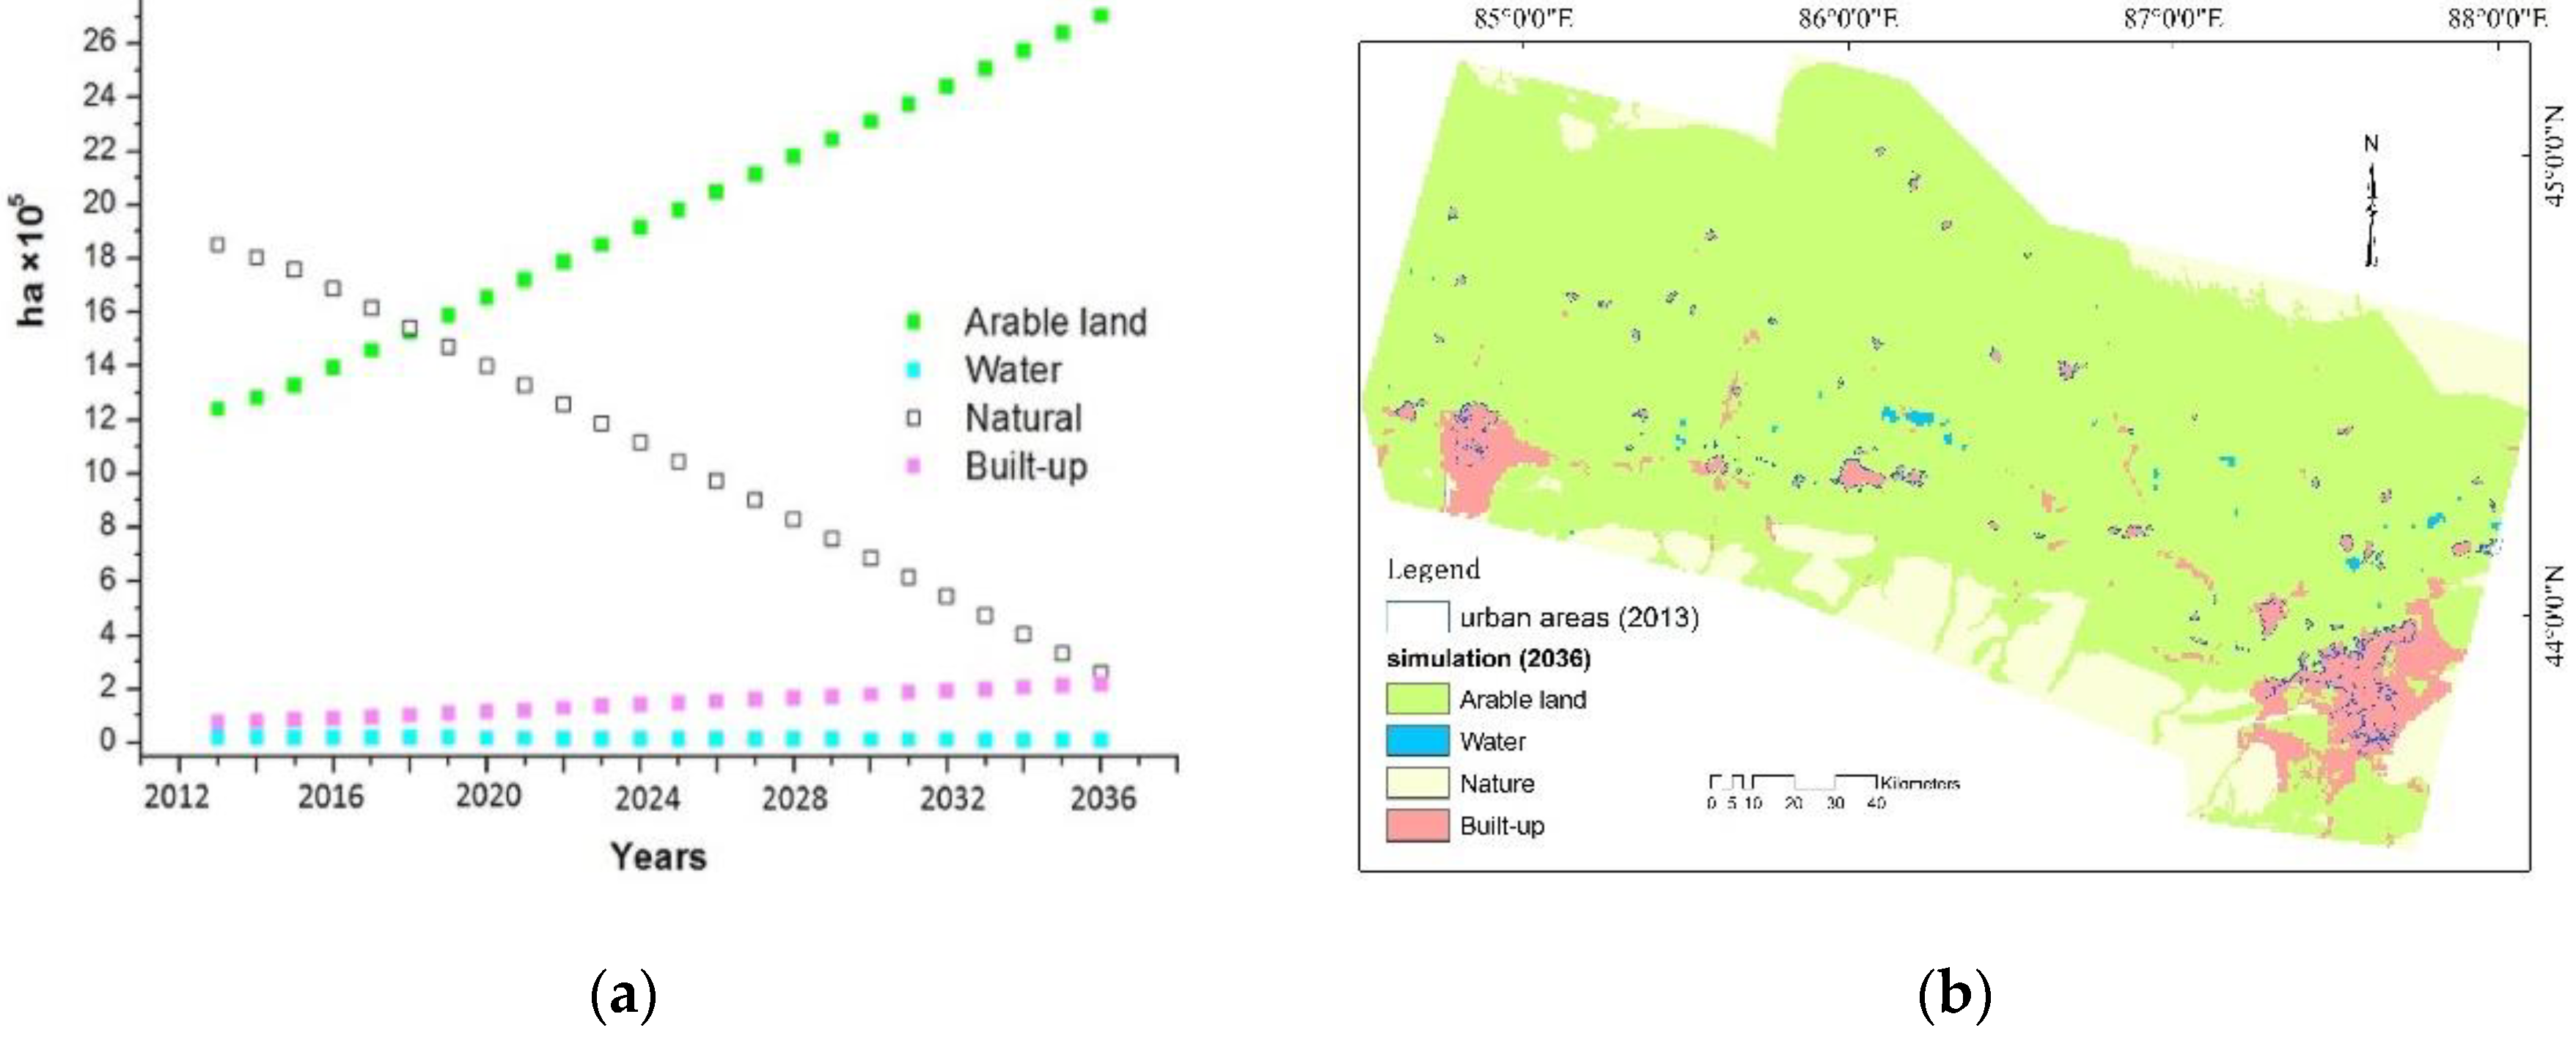
The second scenario focused on the rapid urban expansion supported by policies. Based on the development trends of urban expansion, the urban development model was employed to simulate the spatial distribution of urban development under two conditions: (1) the demand that the NXEZ upgrades to national key economic development zone status and (2) a two-times increase in the built-up area over the next 20 years. The simulation results are shown in
Figure 7.
As the simulation results in
Figure 7b show, two centers, Urumqi–Changji and Dushanzi–Kuytun, are formed as the fastest-growing city complexes. The spatial impact of metropolis will continue to be strengthened. Urumqi will soon be connected to the surrounding areas and form a rectangular spatial expansion pattern in the future. To achieve the objectives of the model simulation, policies need to satisfy two conditions. The first condition is to enhance Urumqi as a key city for the economic development in the NXEZ. The second is to develop Kuytun, Usu, and Dushanzi (the Golden Triangle area) as a core area. In such a case, this area will expand rapidly to develop a group-like structure in the NXEZ. When these two core cities are established, a symmetrical pattern of urban sprawl in the eastern and western parts of the NXEZ will be formed.
Model simulations show that the three core areas of Ürümqi, Shihezi, and Kuytun, are suggested to strengthen their ability to encourage contiguous towns over the next 10 years. Kuytun, Dushanzi, and Usu especially need superior policies and environment than they currently possess to encourage their contiguous development. Under current policy, it is difficult to unify the Golden Triangle area.
The simulation results of Corps farm and small towns showed that the construction of small towns needs to be further strengthened over the next 10 years to drive the contiguous development of towns. In recent years, the Corps implemented the policy of “center farm”, whose core content is to emphatically develop a center farm and to encourage the development of the surrounding 2–3 farms. This policy has shown beneficial effects in the NXEZ, and its urbanization experience is worth promoting and giving greater support.
5. Discussion
Compared to former studies that focused on a single city, this study conducted an investigation on the expansion of city clusters. Besides, more detailed socio-economic data at the township level, which were collected by the research team, were adopted in this study instead of statistical data at the city level. According to the results, urban expansion has been observed in the NXEZ. Natural factors are especially necessary in shaping the pattern of urban and regional development. Water supply systems, existing urban centers, and transportation networks are necessary for urban expansion. Urban expansion relies greatly on the development of water systems, and concentrates along the main roads, ultimately forming a multi-centered oasis-city coupled system. For example, the cities and towns in the NXEZ have expanded along the National Highway 312 from east to west, where the three large metropolitan areas of Urumqi, Shihezi, and Kuytun have developed rapidly. Lesser towns and rural settlements of relatively small size are generally scattered in the peripheral areas.
In recent years, the NXEZ suffers from severe water shortages. As urban expansion accelerates, water resources will be placed under increasing pressure, and regional water shortages may occur. Although this region employed the most efficient water-saving irrigation methods, its massive irrigation agriculture may influence future economic development modes.
The driving forces are essential bases in the model simulations. This is because the driving factors employed in the multi-scenario simulation were derived from historical data, and the results were highly dependent on historical trends. However, the results reveal that changes in the human driving force was significant. It is necessary to conduct future studies on the interaction between change processes of driving forces, policy, and investment, and to combine the social-economic-ecological model with the CLUE-S model.
Future urban development planning constitutes to the boundary conditions of the spatial simulation model. Currently, the NXEZ lacks a complete urban planning system, and the present study focused on the methods for urban spatial simulation. Future topics for investigation include changes in the scale and density of population, economic development forecasts, structural changes of primary, secondary, and tertiary industries, and the conversion of arable land, unused land, and grassland to urban areas. Additionally, combining the social and economic dynamics system model and the spatial simulation model may provide a basis for future urban planning.
Climate change has a remarkable effect on temperature and precipitation, and consequently on water resources and ecosystems in the NXEZ. This study treated these factors as static constraints by using their average values. Future studies need to focus on the dynamic coupling of the climate–hydrology model, ecology model, and spatial simulation model.
To further study the changing dynamics of the urban geospatial process, RS and GIS were adopted to simulate city growth and urban sprawl. Both historical (years 1987–2000) maps and forecasting simulations of urban geospatial growth and sprawl (2001–2015) were conducted [
46]. Generally, dynamic models are more suitable for studying the process of urban land use change, while empirical/statistical models can complement dynamic simulation models to effectively analyze driving factors. Thus, to solve a specific practical problem effectively, a model with a higher level of interdisciplinary integration is needed. From the foregoing review, it is clear that urban expansion is currently an important component of LUCC studies. Change detection, driving factors analysis, and modeling are at the heart of this strand of research.
The evaluation of desertification and land transformation in arid areas should be placed within a state change-land use change (SC-LUS) framework that considers desertification as a state changes occurring within the context of particular land uses [
47]. The state change can cause or be caused by shifts between rangeland, cropland, and urban land uses. However, the interaction between urban sprawl and the limited natural resources in the harsh environment reach a compromise in a very complex way. The state change is an apparent shift in ecosystem processes in response to changing environmental conditions [
48]. Natural factors are especially important in shaping the pattern of urban and regional development. Climate change impacts temperature and precipitation in the arid areas, and thus impacts water resources and ecosystems. Urban expansion in arid areas relies on the development of water supply systems, and concentrates along the main roads, ultimately forming a multi-centered oasis–city coupled system. Relatively, the utilization status has been affecting urban development and urban system structure in the constraint range.
6. Conclusions
In this study, a CLUE-S model was built to simulate the pattern of urban expansion in the arid zone of China at the township level. Moreover, the driving factors of urban expansion and the characteristics of urbanization were revealed for the purpose of sustainable development. Simulation of urban expansion in the NXEZ shows that high-resolution remote sensing data and GIS technology are effective tools, while the CLUE-S model provides a comprehensive methodological framework to study the land use change and its environmental effects. Multi-scenario simulations were constructed to investigate the future urban development in the NXEZ. The urban expansion in the arid zone still have no complete description and systematic planning in the study. It is necessary to combine the social-economic-ecological model with the CLUE-S model, and to improve the accuracy of the interaction between driving forces, policy, and investment. Future studies will focus on the dynamic coupling of the climate-hydrology model, ecology model, and spatial simulation model.
This study demonstrated that logistic models are an appropriate tool for the analysis of the driving forces underlying urban expansion. The results indicate that, although it is one of the fastest growing urban areas in China, the NXEZ is still in a premature developing region compared to the city clusters in eastern China. Before 1999, the driving force of urban expansion was primary industry, which mainly included agriculture and agro-processing industries. Up to 2007, service-oriented tertiary industries became the major driving force. Then, in recent years, secondary industries became an important driving force of urban expansion. These findings indicate that the industrial base and the level of economic development in the NXEZ are still relatively weak, and have not yet taken a strong leading role. Currently, the driving role of urban population in urban expansion is still limited. If the industry and population become the main driving factors for urban expansion, the economy in the study area will enter a new stage of leap-forward development.
There are still several challenges that need to be addressed for the NXEZ and other typical arid areas. During the past 20 years, cities in the arid region experienced very rapid development, with the driving forces strongly connected to policy. How to effectively quantify the policy factors is an essential component of any future study. The status of water resources and the capacities of the ecosystem act as a bottleneck in the development of cities in the arid regions of China. How to integrate the city model, the water resources model, and the regional ecological model is of great significance.


