Abstract
Drought is one of the most destructive natural hazards and results in negative effects on the environment, agriculture, economics, and society. A meteorological drought originates from atmospheric components, while a hydrological drought is influenced by properties of the hydrological cycle and generally induced by a continuous meteorological drought. Several studies have attempted to explain the cross dependencies between meteorological and hydrological droughts. However, these previous studies did not consider the propagation of drought classes. Therefore, in this study, to consider the drought propagation concept and to probabilistically assess the meteorological and hydrological drought classes, characterized by the Standardized Precipitation Index (SPI) and Standardized Runoff Index (SRI), respectively, we employed the Markov Bayesian Classifier (MBC) model that combines the procedure of iteration of feature extraction, classification, and application for assessment of drought classes for both SPI and SRI. The classification results were compared using the observed SPI and SRI, as well as with previous findings, which demonstrated that the MBC was able to reasonably determine drought classes. The accuracy of the MBC model in predicting all the classes of meteorological drought varies from 36 to 76% and in predicting all the classes of hydrological drought varies from 33 to 70%. The advantage of the MBC-based classification is that it considers drought propagation, which is very useful for planning, monitoring, and mitigation of hydrological drought in areas having problems related to hydrological data availability.
1. Introduction
Drought is one of the most destructive natural hazards because it has negative impacts on the environment, agriculture, economics, and society, and occurs in most climatic zones over the world [1,2,3]. Many efforts have been made worldwide in the planning, monitoring, and mitigation of drought due to its impacts and complex nature. Droughts can be generally classified into four closely related categories: meteorological, agricultural, hydrological, and socioeconomic [4]. Among these drought types, meteorological drought is mainly dependent on deficient precipitation, while agricultural and hydrological drought are influenced by properties of the hydrological cycle and may generally be induced by a continuous meteorological drought [5,6]. Moreover, evaluation of prolonged and severe hydrological drought can directly influence irrigation/residential water supply and hydropower generation, which can ultimately affect the country’s agriculture and economy. As a result, it is necessary to develop an effective technique for accurate assessment and characterization of drought.
Drought indices are commonly employed to monitor drought severity quantitatively. The most commonly used indices to monitor meteorological drought include the Palmer Drought Severity Index (PDSI), Standardized Precipitation Index (SPI), and Standardized Precipitation Evapotranspiration Index (SPEI), while the Streamflow Drought Index (SDI), Standardized Streamflow Index (SSI), and Standardized Runoff Index (SRI) are mostly used for monitoring hydrological drought, and the Soil Moisture Drought Index (SMDI), Crop Specific Drought Index (CSDI), and Crop Moisture Index (CMI) are used to monitor agricultural drought [1,2,7,8,9,10]. Meanwhile, different authors developed various techniques and methods for the estimation of different types of droughts. For example, Alizadeh and Nikoo [11] developed a fusion-based estimation for meteorological drought using remote sensing data, Feng et al. [12] integrated remote sensing and machine-learning tools for the estimation of agricultural drought, Kędzior and Zawadzki [13] used soil moisture and ocean salinity satellite data for agricultural drought monitoring, and Strnad et al. [14] used an index-flood model for hydrological drought assessment. Besides these studies, different statistical and probabilistic models have been developed to investigate drought characteristics. For instance, copula-based statistical models were used to estimate drought risk [15,16], Mann–Kendall test-based trend analysis models were employed for drought classification [17], Markov chain models were used to find the transition probabilities of drought states [18], and Bayesian network models were recently developed to assess and forecast drought severity [19,20,21,22].
However, the quantification of hydrological drought requires specific consideration due to its dependence on both atmospheric and terrestrial components. A meteorological drought originates from atmospheric components, and its effect transforms into terrestrial components, which may cause commencement of hydrological drought. Therefore, the study to investigate relationships between meteorological and hydrological drought characteristics is important for accurate assessment of hydrological drought. Limited studies have attempted to explain the cross dependencies between meteorological and hydrological droughts. Van Loon et al. [23] and Niu et al. [24] examined spatio-temporal changes in the characteristics of meteorological and hydrological droughts using hydrological simulations. Wen et al. [25], Al-Faraj and Scholz [26], Huang et al. [27], and Zhang et al. [28] utilized correlation analysis to investigate more reliable relationships between meteorological and hydrological droughts. Trajković, et al. [29] identified the spatio-temporal distribution of hydrological and meteorological drought in South Morava, Jesus et al. [30] studied the occurrence and relationship of meteorological and hydrological drought in the Doce River basin in Brazil, and Zhao et al. [31] performed a frequency analysis of meteorological and hydrological drought over North America. Nevertheless, the shortcoming of these studies is that they did not consider the propagation of drought classes. The understanding of propagation of drought classes is complex due to the varying natures of regions, seasons, and time scales [5,24,32]. For instance, Huang et al. [32], Liu et al. [33], Zhao et al. [34], and Wu et al. [35] focused on estimating the lag time between meteorological and hydrological droughts. Shin et al. [36] investigated the probability of propagation over South Korea, while Sattar and Kim [37] compared propagation rates by employing two different meteorological drought indices. Sattar et al. [38] focused on the impact of climate change on drought propagation in South Korea. Jehanzaib et al. [39] also investigated the effect of climate change on drought propagation using multi-model ensemble projections. These studies incorporated the drought propagation features in their work that revealed the importance of propagation in monitoring and mitigating drought.
Considering the limitations on the modeling of drought propagation, the novelty of this study is to employ a hidden Markov model as a dynamic Bayesian classifier for continuous assessment of meteorological and hydrological drought classes taking the propagation of drought classes. The objectives of this work are (1) to find the propagation probability of all the drought classes (i.e., meteorological to hydrological), which will give us an understanding of the propagation percentage of the different classes in the study area; (2) to probabilistically assess different classes of meteorological and hydrological drought using SPI and SRI, respectively; and (3) to identify the propagation of drought classes using a Markov Bayesian classifier.
2. Research Area and Data
South Korea ranks high among countries facing water scarcity problems and experiencing serious droughts since the late 1990s [40]. There are five large river basins in South Korea, namely, Han River, Nakdong River, Geum River, Seomjin River, and Yeongsan River. The Han River provides main sources of water for drinking, industry, irrigation, and hydropower generation to the capital and metropolitan areas, as shown in Figure 1. The Han River basin is further subdivided into 24 different sub-basins; the identification number, elevation, and stream network of these sub-basins are shown in Figure 1. For our study purpose, we selected four sub-basins marked with red colors in Figure 1 (enlarged figure). Climatic conditions of the selected four sub-basins are almost similar but hydrological conditions may vary depending upon factors like elevation, slope, and urbanization. These attributes of four selected sub-basins are different that may affect the hydrological cycle or hydrological conditions of the area [41]. Therefore, the selection of these sub-basins may provide a diverse spatial pattern of drought propagation. The drainage areas covered by sub-basins #1003, #1010, #1012, and #1018 are 2483.8 km2, 1587.4 km2, 1852 km2, and 1537.2 km2, respectively, and average annual precipitation varies from 1186 mm to 1291mm [42].
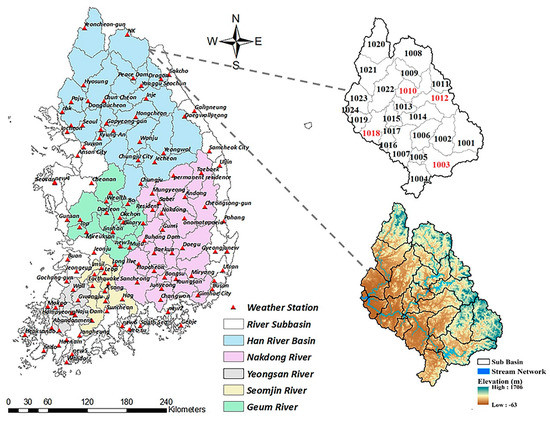
Figure 1.
Location of the Han River basin, with the sub-basin ID number, elevation, and stream network.
Precipitation and runoff data of the period 1967 to 2013 were used for investigating the meteorological and hydrological drought characteristics. Precipitation data were obtained from the Korea Meteorological Administration (https://web.kma.go.kr) for all meteorological stations within the selected sub-basins. For runoff data, the government authorities installed several gauges but firstly the data available was station-based and we needed basin-based data; secondly, the data available was discrete data with a limited period of time, which was not enough to compute the drought characteristics accurately and to train our model. Therefore, different simulated models were used for estimation of runoff for the sub-basins and the most famous and widely adopted models are the PRMS and TANK models. In our study, runoff data were generated for the same period as the precipitation data by using the TANK model, which is the most widely used model in South Korea for rainfall–runoff modelling [43]. Many studies verified the application of the TANK model for runoff simulation. For example, Song et al. [44] proved the accuracy of the TANK model in simulation of runoff at ungauged watersheds in South Korea, and Jaiswal et al. [45] evaluated the accuracy of the TANK model in simulating runoff in Australian watersheds.
3. Materials and Methods
3.1. Calculation of Standardized Drought Indices
The SPI is a very popular and commonly used drought index to quantify meteorological drought, which is recommended by the World Meteorological Organization (WMO). The fundamental advantage of SPI is its simplicity and ability to calculate drought severity at multiple time scales. Due to the multi-scale properties, the SPI can be used to monitor short- and long-term rainfall deficits, which can be applied for monitoring agricultural and hydrological drought. To calculate the SPI, daily precipitation data were first aggregated into a specific time scale and then a gamma distribution was fitted to the data, as is accepted in many previous studies [37,46,47]. After that, the data were transformed into a standard normal distribution with a mean of zero and standard deviation of one. The SPI represents the deviation of precipitation values from their mean, and positive values indicate surplus precipitation, while negative values represent deficit precipitation.
Following the development of the SPI, Shukla and Wood [7] proposed the SRI to characterize and monitor hydrological drought using runoff data. Similar to the SPI, the SRI is calculated by fitting a lognormal distribution [37,47], and is transformed into a standard normal variate with a mean of zero and standard deviation of one. Positive values of SRI indicate surplus runoff from the mean value, while negative values indicate deficit or drought conditions. Classification of wet and drought conditions based on the SPI and SRI is given in Table 1 [46].

Table 1.
Classification of wet and drought condition based on the Standardized Precipitation Index (SPI), Standardized Runoff Index (SRI), and Markov Bayesian Classifier (MBC).
3.2. Estimation of Propagation Probability
The concept of propagation was used in this study to probabilistically assess the different classes of drought. Since hydrological drought is a slower developing phenomenon, a propagation probability matrix provides a clear visualization of the relationships of different classes of different drought types at a given time step. To estimate the propagation probability of different classes of droughts in this study, we employed a conditional probability approach to estimate the propagation probability of each class defined in Table 1, i.e., {1, 2, 3, 4, 5} from the SPI to SRI. Equation (1) estimated the conditional probability for propagation of each class.
where Ch and Cm are the classes to which the hydrological and meteorological drought belong, respectively, as mentioned in Table 1.
3.3. Markov Bayesian Classifier (MBC)
The Markov Bayesian Classifier is a probability classifier based on Bayes’ rule, the dynamics of which are governed by a hidden Markov chain. We considered five classes according to Table 1, and a vector Y ϵ Rn of the data was allocated to either of these classes. Formally, there is a pair Z = (Y, J), where Y is a random vector, and J is a random variable that assigns class information to Y, i.e., J: Ω → {1, 2, 3, 4, 5}, where Ω is the sample space. We observed only Y, where J is hidden. Thus, a rule (function) is needed to assign an observed vector Y as accurately as possible. We assumed at this stage that the mean and covariance matrices, ui and vi of the classes, are known.
The next task is to derive a classifier that assigns a probability to the event that an observation is from class i. Denoting the prior P(J = i) by p(i), the class (posterior) probabilities for the observed y can be calculated by Bayes’ rule.
where P(y|J = i) is the conditional probability of class i. Further, when P(J = i|Y = y) is known, the Bayesian classifier allocates y to r, g(y) = r. Class probabilities express uncertainty: the closer the probability estimate is to one or to zero, the less uncertainty there is in a decision. The classifier defined in Equation (2) could be static. However, our aim was to form a dynamic probability classifier that also describes the dependence between observations when dealing with time series data, Zt = (Yt, Jt). The normality assumption of the classes now takes the form of Yt ~ N(ujt, vjt).
To model time dependence in a mathematically tractable way, we postulated that Jt could be described as a homogenous Markov chain, where the data generating process has five hidden classes. For each class, the likelihood of various observations is one of the five multi-normal densities. A Markov chain generates switching between classes. When in class i, the process is said to be working in regime i. These Markov probabilities are collected into the Markov matrix P = pij. The model is now defined by the regime distribution and the Markov matrix. When class priors at t−1, Pi (t−1) are known, the regime (posterior) probabilities for a given yt are
Equations (2) and (3) define the Markov Bayesian Classifier (MBC). The introduced model is a special case of a hidden Markov model (HMM), and Yt is an observed time series depending on an unobserved Markov chain Jt. We collected the data from 1967–2013; the data from 1967–2000 were used for training the model, and the data from 2001–2013 were used for application of the model. The parameters of the classes were estimated using the attributes of the SPI and SRI, which were further used for classification. By following the propagation concept, the probabilistic assessment of each class of drought based on SPI and SRI of current month t depends on the probability value of the SPI drought classes at previous month t−1. For example, the probability of occurrence of different classes of drought based on SPI and SRI in March depends on the probability of the SPI classes in February. The probability value for each class can be obtained by iterating Equation (4).
where X = [J, K] represents both the SPI and SRI drought classes. P(Xt+1 = i|Yt) is the probability of both the SPI and SRI drought classes in the next time step given the probability of the SPI drought classes in the current time step Jt. Pij is the transition probability matrix for both the SPI and SRI classes in the next time step conditioned on the SPI classes in the current time step.
4. Results and Discussion
4.1. Relationship between SPI and SRI
In this study, we selected a three-month time scale for both SPI and SRI to reflect the seasonal characteristics of both drought types. To demonstrate that the time scale selection was correct, a Pearson correlation analysis was performed [35]. The estimation of the correlation coefficient between the two drought indices was very important and beneficial for the setup of MBC. Because we are going to analyze the propagation of drought classes from SPI to SRI, if the SPI and SRI were poorly correlated with each other, the model results may not be accurate [48]. Sattar and Kim [37] evaluated the relationship between SPI/SRI and SPEI/SRI for the Han River basin and found high values of the correlation coefficient between them. Similarly, Sattar et al. [47] also found high values of the correlation coefficient between the SPI and the SRI for historical and future periods under the Representative Concentration Pathway (RCP) 8.5 climate change scenario. It is clear from Figure 2 that, in our study, the correlation coefficient between the SPI and SRI is significant in all the selected sub-basins, varying from 0.77 to 0.88.
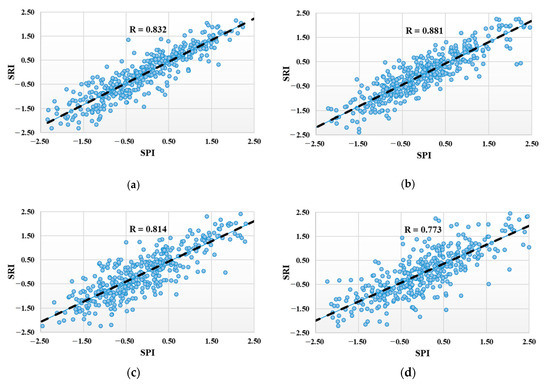
Figure 2.
Relationship between the Standardized Precipitation Index (SPI) and Standardized Runoff Index (SRI) in the selected sub-basins. (a) Sub-basin #1003, (b) Sub-basin #1010, (c) Sub-basin #1012, (d) Sub-basin #1018. #: number.
Based on the criterion used to define drought classes in Table 1, we compared the SPI and SRI to investigate the propagation relationship between them. Figure 3 clearly illustrates temporal evolution of SPI and SRI and provides a symbolic example of propagation of different classes from the SPI to SRI in the sub-basin #1003. The different combination of colors represents different classes. This comparative analysis between the SPI and SRI showed a very good explanation of the drought classes propagation features. For example, some marked areas of Figure 3 illustrate that during 1968, 1971, 1973–1975, 1977, 1981–1983, 1988, and 1996, moderate, severe, and extreme classes of SPI were propagated into moderate, severe, and extreme classes of SRI. In comparison to the previous work on propagation in South Korea, Shin et al. [20] also found propagation of meteorological to hydrological drought at different time scales and concluded the propagated events in the year 1977, 1980–1982, 1988, 1992, 1994, 1996, 2001, and 2014–2015.
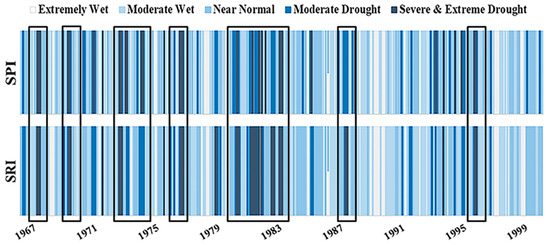
Figure 3.
Temporal evolution of the SPI and SRI during 1967–2000 at the sub-basin #1003, and an example of propagation of drought classes from SPI to SRI.
4.2. Propagation Probability of Drought Classes
We understood from Figure 3 that there was a strong linkage between the SPI and SRI in terms of propagation of different classes of meteorological to hydrological drought, so quantification of this linkage in terms of probability of each class from the SPI to SRI is necessary for further analysis. The propagation probability of each class for the selected sub-basins based on Equation (1) is shown in Figure 4. From Figure 4, it can be seen that when all the sub-basins have extremely wet classes of SPI, they have high probabilities that the SRI also has extremely wet classes and lower probabilities to have moderate wet classes. If the SPI has a moderate wet class, then there is a high probability that the SRI also has a moderate wet class and lower probability to have a near normal class in all sub-basins. Likewise, when there is near normal class for SPI, there is high probability that the SRI may have a near normal class and lower probability to have moderate wet and moderate drought class for all sub-basins. In addition, when the SPI has a moderate drought class, there is a high probability that the SRI will have a near normal class and a lower probability to transform into a moderate as well as severe and extreme class of drought for all sub-basins. Lastly, for the SPI to have a severe and extreme drought class, then there is a high probability that the SRI will have a severe and extreme drought class in sub-basin #1003; in sub-basin #1010 it has an equal probability to have a near normal class as well as severe and extreme class of SRI; and in sub-basin #1012 and #1018 it has a high probability to propagate into a moderate drought class of SRI. From Figure 4, it is clear that the propagation probability values of all classes from SPI to SRI have different values in all sub-basins.
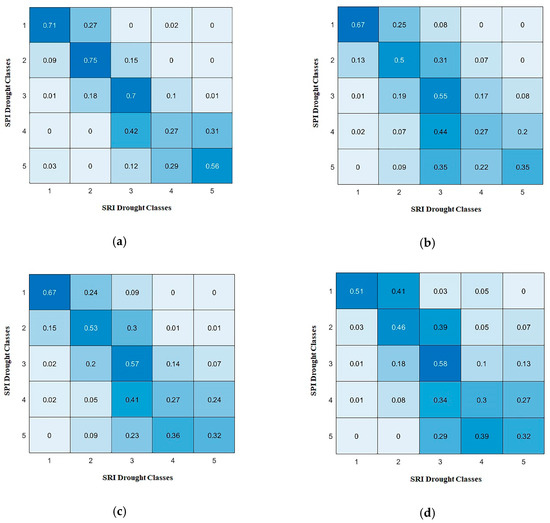
Figure 4.
Propagation probability of each class of drought from SPI to SRI during 1967–2000. (a) Sub-basin #1003, (b) Sub-basin #1010, (c) Sub-basin #1012, (d) Sub-basin #1018.
The variation in these propagation probability values and drought classes was due to the complex nature of hydrological cycle. From Figure 1, it can be seen that the elevation and stream network is different for all selected sub-basins and, furthermore, the vegetation, land-use, and land-cover characteristics of these sub-basins are also different. It is confirmed from previous studies that soil moisture conditions, topography, vegetation cover, and groundwater level of the catchment area affect the transformation of meteorological conditions [34]. These factors can cause a different propagation probability and different condition of drought classes. Sattar et al. [38] found that the propagation rate varied spatially in the Han River basin for historical and future periods. Sattar et al. [47] also concluded that the propagation rate varied spatially all over South Korea. Our results are also consistent with these previous findings in terms of the spatial pattern of propagation.
4.3. Assessment of Drought Classes
In this section, we demonstrated the MBC results for assessing the drought classes of SPI and SRI based on propagation. Equations (2) and (3) provide a detailed description of the parameter values and the probability of each class for the training period of 1967–2000. The nature of a dynamic Markov chain provides a reasonable description of the transition probability matrix for each month of the year, yielding twelve transition probability evaluations. We assumed here that the current time is t and class values are known at every point in the past up to t. When we now try to look from the past into the future, the situation turns into a genuine HMM problem. Moreover, the MBC assumes that the dynamic process follows the first-order Markov chain process, i.e., each class of the month is dependent on the previous class of the month, and the transition probability of each class is independent of time in a dynamic process.
The results of the MBC model for classification of the SPI at Xt+1 based on the probability of classes in each previous month Jt for the application period 2001–2013 are shown in Figure 5. The differently colored bars indicate the different classes, and their lengths indicate the corresponding probability value of the class. From the findings shown in Figure 5, if we compared the dry classes only, the observed SPI indicated with a black line shows that in sub-basin #1003 dry classes were observed in months of the year 2001, 2005, 2006, and 2010, while the MBC results indicated that moderate to high probabilities of dry classes were mostly observed in months of the year 2004, 2005, 2007, 2009, 2010, 2011, and 2012. In sub-basin # 1010, the dry classes were observed from SPI in the months of the year 2001, 2005, 2007, 2010, and 2011, and as compared to MBC, the dry classes with different probability values were observed in the months of the year 2001, 2005, 2007, 2012, and 2013. Similarly, in sub-basin #1012, the dry classes were observed from SPI in the months of the year 2001, 2002, 2003, 2004, 2005, 2006, 2010, 2011, and 2012, and in comparison to MBC, the dry classes with different probability values were observed in the months of the year 2001, 2002, 2004, 2005, 2007, 2012, and 2013. Lastly, in sub-basin # 1018, the dry classes were observed from the SPI in the months of the year 2001, 2002, 2006, 2007, and 2012, and as compared to MBC, the dry classes with different probability values were observed in the months of the year 2001, 2002, 2004, 2007, 2010, 2012, and 2013.
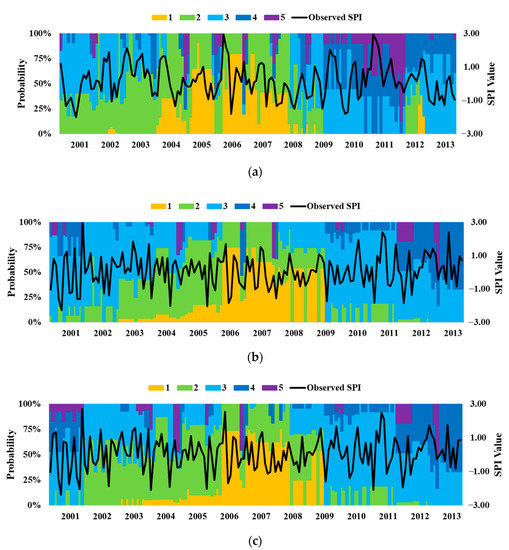
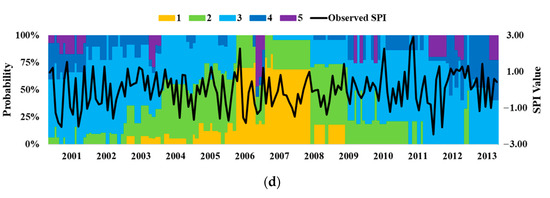
Figure 5.
Probabilistic distribution of the different classes of meteorological drought assessed through MBC during 2001–2013 and compared with the observed SPI. (a) Sub-basin #1003, (b) Sub-basin #1010, (c) Sub-basin #1012, (d) Sub-basin #1018.
We further employed the MBC to assess classes of SRI at Xt+1 based on the propagation probability of the SPI classes in a previous month Jt for the application period 2001–2013. The results are shown in Figure 6. The MBC for a given time step was set as the most likely drought class with a high probability value. Similar to the above evaluation, we compared the classification results of the MBC with the observed SRI, specifically for dry classes of drought. In sub-basin #1003, dry classes were observed in months of the year of 2001, 2009, 2010, and 2013, while the MBC results indicated that dry classes of moderate to high probabilities were mostly observed in months of the year 2001, 2006, 2007, 2009, 2010, 2011, 2012, and 2013. In sub-basin #1010, the dry classes were observed from SRI in the months of the year 2001, 2007, and 2013, and for MBC, the dry classes with different probability values were observed in the months of the year 2001, 2002, 2004, 2007, 2012, and 2013. Similarly, in sub-basin #1012, the dry condition was observed from SRI in the months of the year 2001, 2007, and 2010, and as compared to MBC, the dry classes with different probability values were observed in the months of the year 2001, 2002, 2005, 2006, 2007, 2012, and 2013. Lastly, in sub-basin #1018, the dry conditions were observed from the SRI in the months of the year 2001, 2005, and 2008, and in comparison to MBC, the dry classes with different probability values were observed in the months of the year 2001, 2002, 2005, 2012, and 2013.
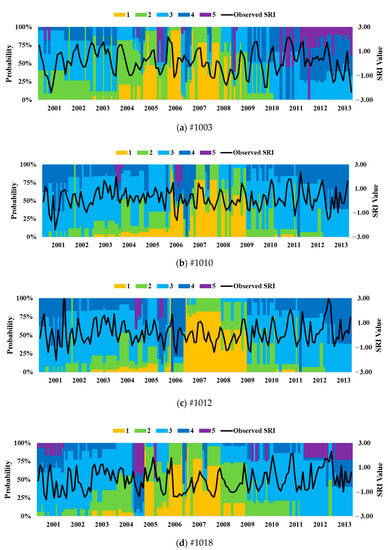
Figure 6.
Probabilistic distribution of different classes of hydrological drought assessed through MBC during 2001–2013 and compared with the observed SRI. (a) Sub-basin #1003, (b) Sub-basin #1010, (c) Sub-basin #1012, (d) Sub-basin #1018.
From previous studies, the drought events observed in the Han River basin were in different months of the year 2004, 2006, 2007, 2008, 2009, 2012, and 2013 [21,41,49]. The comparison results of the MBC with the observed SPI, SRI, and previous studies, revealed that classification results of the MBC match most of the time with the observed SPI, SRI, and the previous findings in predicting the classes. However, in some years, the MBC failed to predict the expected classes of drought, and another shortcoming is that the start and end time of the classes also vary in comparison to SPI and SRI. However, the SPI and SRI provided a probability of one for an optimal class and probability of zero for all other classes while the MBC was classified with the associated probability for each class, which is indicated by the height of the bars in different colors. We also investigated spatial variation in probability values of each class in all sub-basins. For example, Figure 6a shows a Class 5 observed with a high probability value in sub-basin #1003 in the years 2011–2012, while the Class 5 values were rare or a low probability value in the other sub-basins.
4.4. Performance Evaluation of the MBC
We employed confusion matrices as shown in Table 2 to evaluate the probabilistic classification results. A confusion matrix gives a better idea of the accuracy of the MBC in predicting the frequency of each class in terms of matches to the frequency of actual classes determined by the observed SPI and SRI. The frequency of occurrence of each class for the MBC was compared with the actual classes of the observed SPI and SRI. Table 2 shows that the MBC presented the most matches with the observed SPI and SRI in determining all classes. Further, to quantify this confusion matrix result, we estimated the accuracy and precision from the confusion matrix for each class. The accuracy and precision of the classification can be determined by taking the ratio of the frequency of the predicted class to the frequency of the actual class, and by taking the ratio of the frequency of the predicted class to the sum of the frequency of the predicted classes, respectively.

Table 2.
The frequency of each drought class classified by the MBC and standardized drought indices.
Table 3 and Table 4 shows that the accuracy and precision results are quite satisfactory for classification of both the SPI and SRI drought classes. In the case of SPI, the accuracy estimated for Class 1 varied from 52% to 62%; for Class 2 from 60% to 68%; for Class 3 from 63 % to 76%; for Class 4 from 50% to 58%; and for Class 5 from 36% to 50%. Similarly, in comparison with the SRI, the accuracy in estimating classes by the MBC varied for Class 1 from 50 % to 63%; for Class 2 from 46% to 70%; for Class 3 from 59% to 67%; for Class 4 from 45% to 67%; and for Class 5 from 33% to 50%. Generally, from Table 3 and Table 4, the accuracy and precision results indicated that the model shows fair performance in classifying all classes in all the sub-basins. In comparison to previous studies, which only focused in characterizing individual drought types and to those that utilized the propagation concept to compare the features of two drought types, our results are a step forward from those findings, as we utilized these features to predict the classes of hydrological drought based on the meteorological drought classes. Therefore, the overall results of our study specify that the MBC was reasonable in predicting the onset and end of drought events, and can be utilized for monitoring and management of short-term drought risk.

Table 3.
Accuracy and precision of the MBC in the classification of meteorological drought classes.

Table 4.
Accuracy and precision of the MBC in the classification of hydrological drought classes.
5. Conclusions
In this study, we utilized the concept of propagation of drought classes to probabilistically assess the meteorological and hydrological drought classes represented by the standardized precipitation index (SPI) and standardized runoff index (SRI), respectively. We proposed an iteration of feature extraction, classification, and application for assessment of both the SPI and SRI drought classes. The observed SPI and SRI were used to extract the different features of the drought classes, and classification was performed for each month using a Bayesian model. The dynamic model Markov chain model provided reasonable descriptions of the meteorological and hydrological drought classes. We referred to the proposed model as a Markov Bayesian Classifier (MBC). Overall, the results revealed high probability values of the propagation percentage of the different classes from SPI to SRI, as are further employed in the MBC. The classification results of the MBC were compared with the observed SPI, SRI, and previous studies, demonstrating that the results of the MBC match the observed SPI, SRI, and previous findings most of the time when predicting the classes. However, in some years, MBC failed to predict the expected classes of drought, and another shortcoming is that the start and end time of the classes also vary in comparison to SPI and SRI. The accuracy of the MBC model in predicting all the classes of meteorological drought varies from 36 to 76% and in predicting all the classes of hydrological drought varies from 33 to 70%. Similarly, the precision of the MBC model in predicting all the classes of meteorological drought varies from 42 to 86% and in predicting all the classes of hydrological drought varies from 24 to 85%. However, the SPI and SRI provided a probability of one for an optimal class and probability of zero for all other classes, while the MBC was classified with the associated probability for each class. The MBC-based drought assessment model can easily be generalized to other study areas. The benefit of this model is that it considers the drought propagation, which is beneficial for areas having problems related to hydrological data availability. Besides the benefit, the limitations of the study are that the model is utilized for monitoring short-term prediction of drought, and the results and techniques developed need to be verified for long-term prediction of drought in future studies. Further, as drought propagation is a very complex phenomenon, there is a need to include more variables in studies for more accuracy in the results. The runoff data used in this study is simulated data; for better results, the data from modern tools, such as remote sensing, can also be utilized.
Author Contributions
Conceptualization, T.-W.K.; methodology, M.N.S.; validation, M.J.; formal analysis, M.N.S.; investigation, H.-H.K.; resources, M.J.; data curation, J.E.K.; writing—original draft preparation, M.N.S.; writing—review and editing, T.-W.K.; project administration, T.-W.K. All authors have read and agreed to the published version of the manuscript.
Funding
This work is supported by the Water Management Research Program of Korea Ministry of Environment (MOE) (Grant no. 79616) and Korea National Research Foundation (Grant no. 2020R1A2C1012919).
Acknowledgments
The authors would like to acknowledge the Higher Education Commission (HEC) of Pakistan for granting a scholarship to Muhammad Nouman Sattar and Muhammad Jehanzaib to pursue their PhD degree.
Conflicts of Interest
The authors declare no conflict of interest.
References
- Mishra, A.K.; Singh, V.P. A review of drought concepts. J. Hydrol. 2010, 391, 202–216. [Google Scholar] [CrossRef]
- Vicente-Serrano, S.M.; López-Moreno, J.I.; Beguería, S.; Lorenzo-Lacruz, J.; Azorin-Molina, C.; Morán-Tejeda, E. Accurate computation of a streamflow drought index. J. Hydrol. Eng. 2011, 17, 318–332. [Google Scholar] [CrossRef]
- Wang, Z.; Li, J.; Lai, C.; Zeng, Z.; Zhong, R.; Chen, X.; Zhou, X.; Wang, M. Does drought in China show a significant decreasing trend from 1961 to 2009? Sci. Total Environ. 2017, 579, 314–324. [Google Scholar] [CrossRef] [PubMed]
- Wilhite, D.A.; Glantz, M.H. Understanding the drought phenomenon: The role of definitions. Water Int. 1985, 10, 111–120. [Google Scholar] [CrossRef]
- Wu, J.; Chen, X.; Yao, H.; Gao, L.; Chen, Y.; Liu, M. Non-linear relationship of hydrological drought responding to meteorological drought and impact of a large reservoir. J. Hydrol. 2017, 551, 495–507. [Google Scholar] [CrossRef]
- Botterill, L.C.; Fisher, M. Beyond Drought: People, Policy and Perspectives; CSIRO PUBLISHING: Clayton, Australia, 2003. [Google Scholar]
- Shukla, S.; Wood, A.W. Use of a standardized runoff index for characterizing hydrologic drought. Geophys. Res. Lett. 2008, 35. [Google Scholar] [CrossRef]
- Hollinger, S.; Isard, S.; Welford, M. A vew soil moisture drought index for predicting crop yields. In Proceedings of the Preprints, Eighth Conference on Applied Climatology, American Meteorological Society, Anaheim, CA, USA, 17–22 January 1993; Volume 17, pp. 187–190. [Google Scholar]
- Meyer, S.; Hubbard, K. Extending the crop-specific drought index to soybean. In Proceedings of the Preprints, Ninth Conference on Applied Climatology, Dallas, TX, USA, 15–20 January 1995; American Meteor Society: Anaheim, CA, USA, 1995; pp. 258–259. [Google Scholar]
- Palmer, W.C. Keeping track of crop moisture conditions, nationwide: The new crop moisture index. J. Weather. 1968, 21, 156–161. [Google Scholar] [CrossRef]
- Alizadeh, M.R.; Nikoo, M.R.J. A fusion-based methodology for meteorological drought estimation using remote sensing data. Remote Sens. Environ. 2018, 211, 229–247. [Google Scholar] [CrossRef]
- Feng, P.; Wang, B.; Li Liu, D.; Yu, Q. Machine learning-based integration of remotely-sensed drought factors can improve the estimation of agricultural drought in South-Eastern Australia. J. Agric. Syst. 2019, 173, 303–316. [Google Scholar] [CrossRef]
- Kędzior, M.; Zawadzki, J. SMOS data as a source of the agricultural drought information: Case study of the Vistula catchment, Poland. J. Geoderma 2017, 306, 167–182. [Google Scholar] [CrossRef]
- Strnad, F.; Moravec, V.; Markonis, Y.; Máca, P.; Masner, J.; Stočes, M.; Hanel, M. An index-flood statistical model for hydrological drought assessment. Water 2020, 12, 1213. [Google Scholar] [CrossRef]
- Yu, J.; Choi, S.-J.; Kwon, H.-H.; Kim, T.-W. Assessment of regional drought risk under climate change using bivariate frequency analysis. Stoch. Environ. Res. Risk Assess. 2018, 32, 3439–3453. [Google Scholar] [CrossRef]
- Nguyen-Huy, T.; Deo, R.C.; Mushtaq, S.; Kath, J.; Khan, S. Copula statistical models for analyzing stochastic dependencies of systemic drought risk and potential adaptation strategies. Stoch. Environ. Res. Risk Assess. 2019, 33, 1–21. [Google Scholar] [CrossRef]
- Santos, C.A.G.; Neto, R.M.B.; da Silva, R.M.; dos Santos, D.C. Innovative approach for geospatial drought severity classification: A case study of Paraíba State, Brazil. Stoch. Environ. Res. Risk Assess. 2019, 33, 545–562. [Google Scholar] [CrossRef]
- Banik, P.; Mandal, A.; Rahman, M.S. Markov chain analysis of weekly rainfall data in determining drought-proneness. Discret. Dyn. Nat. Soc. 2002, 7, 231–239. [Google Scholar] [CrossRef]
- Madadgar, S.; Moradkhani, H. Spatio-temporal drought forecasting within Bayesian networks. J. Hydrol. 2014, 512, 134–146. [Google Scholar] [CrossRef]
- Shin, J.Y.; Ajmal, M.; Yoo, J.; Kim, T.-W. A Bayesian network-based probabilistic framework for drought forecasting and outlook. Adv. Meteorol. 2016. [Google Scholar] [CrossRef]
- Chen, S.; Muhammad, W.; Lee, J.-H.; Kim, T.-W. Assessment of probabilistic multi-index drought using a dynamic naive Bayesian classifier. Water Resour. Manag. 2018, 32, 4359–4374. [Google Scholar] [CrossRef]
- Ropero, R.F.; Nicholson, A.E.; Aguilera, P.A.; Rumí, R. Learning and inference methodologies for hybrid dynamic Bayesian betworks: A case study for a water reservoir system in Andalusia, Spain. Stoch. Environ. Res. Risk Assess. 2018, 32, 3117–3135. [Google Scholar] [CrossRef]
- Van Loon, A.; Van Huijgevoort, M.; Van Lanen, H. Evaluation of drought propagation in an ensemble mean of large-scale hydrological models. Hydrol. Earth Syst. Sci. 2012, 16, 4057–4078. [Google Scholar] [CrossRef]
- Niu, J.; Chen, J.; Sun, L. Exploration of drought evolution using numerical simulations over the Xijiang (West River) basin in South China. J. Hydrol. 2015, 526, 68–77. [Google Scholar] [CrossRef]
- Wen, L.; Rogers, K.; Ling, J.; Saintilan, N. The impacts of river regulation and water diversion on the hydrological drought characteristics in the Lower Murrumbidgee River, Australia. J. Hydrol. 2011, 405, 382–391. [Google Scholar] [CrossRef]
- Al-Faraj, F.A.; Scholz, M. Assessment of temporal hydrologic anomalies coupled with drought impact for a transboundary river flow regime: The Diyala watershed case study. J. Hydrol. 2014, 517, 64–73. [Google Scholar] [CrossRef]
- Huang, Q.; Sun, Z.; Opp, C.; Lotz, T.; Jiang, J.; Lai, X. Hydrological drought at Dongting Lake: Its detection, characterization, and challenges associated with Three Gorges Dam in Central Yangtze, China. Water Resour. Manag. 2014, 28, 5377–5388. [Google Scholar] [CrossRef]
- Zhang, B.; He, C.; Burnham, M.; Zhang, L. Evaluating the coupling effects of climate aridity and vegetation restoration on soil erosion over the Loess Plateau in China. Sci. Total Environ. 2016, 539, 436–449. [Google Scholar] [CrossRef] [PubMed]
- Trajković, S.; Gocić, M.; Misic, D.; Milanovic, M. Spatio-temporal distribution of hydrological and meteorological droughts in the South Morava Basin. In Natural Risk Management and Engineering; Springer: Berlin/Heidelberg, Germany, 2020; pp. 225–242. [Google Scholar] [CrossRef]
- Jesus, E.T.d.; Amorim, J.d.S.; Junqueira, R.; Viola, M.R.; Mello, C.R. Meteorological and hydrological drought from 1987 to 2017 in Doce River Basin, Southeastern Brazil. Braz. J. Water Resour. 2020, 25. [Google Scholar] [CrossRef]
- Zhao, C.; Brissette, F.; Chen, J.; Martel, J.-L. Frequency change of future extreme summer meteorological and hydrological droughts over North America. J. Hydrol. 2020, 584, 124316. [Google Scholar] [CrossRef]
- Huang, S.; Li, P.; Huang, Q.; Leng, G.; Hou, B.; Ma, L. The propagation from meteorological to hydrological drought and its potential influence factors. J. Hydrol. 2017, 547, 184–195. [Google Scholar] [CrossRef]
- Liu, L.; Hong, Y.; Bednarczyk, C.N.; Yong, B.; Shafer, M.A.; Riley, R.; Hocker, J.E. Hydro-climatological drought analyses and projections using meteorological and hydrological drought indices: A case study in Blue River Basin, Oklahoma. Water Resour. Manag. 2012, 26, 2761–2779. [Google Scholar] [CrossRef]
- Zhao, L.; Lyu, A.; Wu, J.; Hayes, M.; Tang, Z.; He, B.; Liu, J.; Liu, M. Impact of meteorological drought on streamflow drought in Jinghe River Basin of China. Chin. Geogr. Sci. 2014, 24, 694–705. [Google Scholar] [CrossRef]
- Wu, J.; Chen, X.; Gao, L.; Yao, H.; Chen, Y.; Liu, M. Response of hydrological drought to meteorological drought under the influence of large reservoir. Adv. Meteorol. 2016. [Google Scholar] [CrossRef]
- Shin, J.Y.; Chen, S.; Lee, J.-H.; Kim, T.-W. Investigation of drought propagation in South Korea using drought index and conditional probability. Terr. Atmos. Ocean. Sci. 2018, 29. [Google Scholar] [CrossRef]
- Sattar, M.N.; Kim, T.-W. Probabilistic characteristics of lag time between meteorological and hydrological droughts using a Bayesian model. Terr. Atmos. Ocean. Sci. 2018, 29, 1–12. [Google Scholar] [CrossRef]
- Sattar, M.N.; Kim, J.E.; Lee, J.H.; Kim, T.W. Probabilistic analysis of drought propagation over the Han River Basin under climate change. J. Korean Soc. Civil. Eng. 2019, 39, 155–163. [Google Scholar] [CrossRef]
- Jehanzaib, M.; Sattar, M.N.; Lee, J.H.; Kim, T.W. Investigating effect of climate change on drought propagation from meteorological to hydrological drought using multi-model ensemble projections. Stoch. Environ. Res. Risk Assess. 2020, 34, 7–21. [Google Scholar] [CrossRef]
- Kim, C.J.; Park, M.J.; Lee, J.H. Analysis of climate change impacts on the spatial and frequency patterns of drought using a potential drought hazard mapping approach. Int. J. Clim. 2014, 34, 61–80. [Google Scholar] [CrossRef]
- Ahn, S.R.; Kim, S.J. Assessment of integrated watershed health based on the natural enviornment, hydrology, water quality, and aquatic ecology. Hydrol. Earth Syst. Sci. 2017, 21, 5583–5602. [Google Scholar] [CrossRef]
- Yoon, S.K.; Kim, J.S.; Lee, J.H.; Moon, Y.I. Hydrometeorological variability in the Korean Han River Basin and its sub-watersheds during different El Niño phases. Stoch. Environ. Res. Risk Assess. 2013, 27, 1465–1477. [Google Scholar] [CrossRef]
- Paik, K.; Kim, J.H.; Kim, H.S.; Lee, D.R. A conceptual rainfall-runoff model considering seasonal variation. Hydrol. Process. Int. J. 2005, 19, 3837–3850. [Google Scholar] [CrossRef]
- Song, J.H.; Her, Y.; Suh, K.; Kang, M.-S.; Kim, H. Regionalization of a rainfall-runoff model: Limitations and potentials. Water 2019, 11, 2257. [Google Scholar] [CrossRef]
- Jaiswal, R.; Ali, S.; Bharti, B. Comparative evaluation of conceptual and physical rainfall–runoff models. J. Appl. Water Sci. 2020, 10, 1–14. [Google Scholar] [CrossRef]
- McKee, T.B.; Doesken, N.J.; Kleist, J. The relationship of drought frequency and duration to time scales. In Proceedings of the 8th Conference on Applied Climatology, Anaheim, CA, USA, 17–22 January 1993; American Meteorological Society: Boston, MA, USA, 1993; pp. 179–183. [Google Scholar]
- Sattar, M.N.; Lee, J.Y.; Shin, J.Y.; Kim, T.W. Probabilistic characteristics of drought propagation from meteorological to hydrological drought in South Korea. Water Resour. Manag. 2019, 33, 2439–2452. [Google Scholar] [CrossRef]
- AghaKouchak, A.; Farahmand, A.; Melton, F.; Teixeira, J.; Anderson, M.; Wardlow, B.D.; Hain, C. Remote sensing of drought: Progress, challenges and opportunities. Rev. Geophys. 2015, 53, 452–480. [Google Scholar] [CrossRef]
- Maeng, S.; Azam, M.; Kim, H.; Hwang, J. Analysis of changes in spatio-temporal patterns of drought across South Korea. Water 2017, 9, 679. [Google Scholar] [CrossRef]
© 2020 by the authors. Licensee MDPI, Basel, Switzerland. This article is an open access article distributed under the terms and conditions of the Creative Commons Attribution (CC BY) license (http://creativecommons.org/licenses/by/4.0/).