Assessment of the Components and Sources of Acid Deposition in Northeast Asia: A Case Study of the Coastal and Metropolitan Cities in Northern Taiwan


Abstract
1. Introduction
2. Methodology
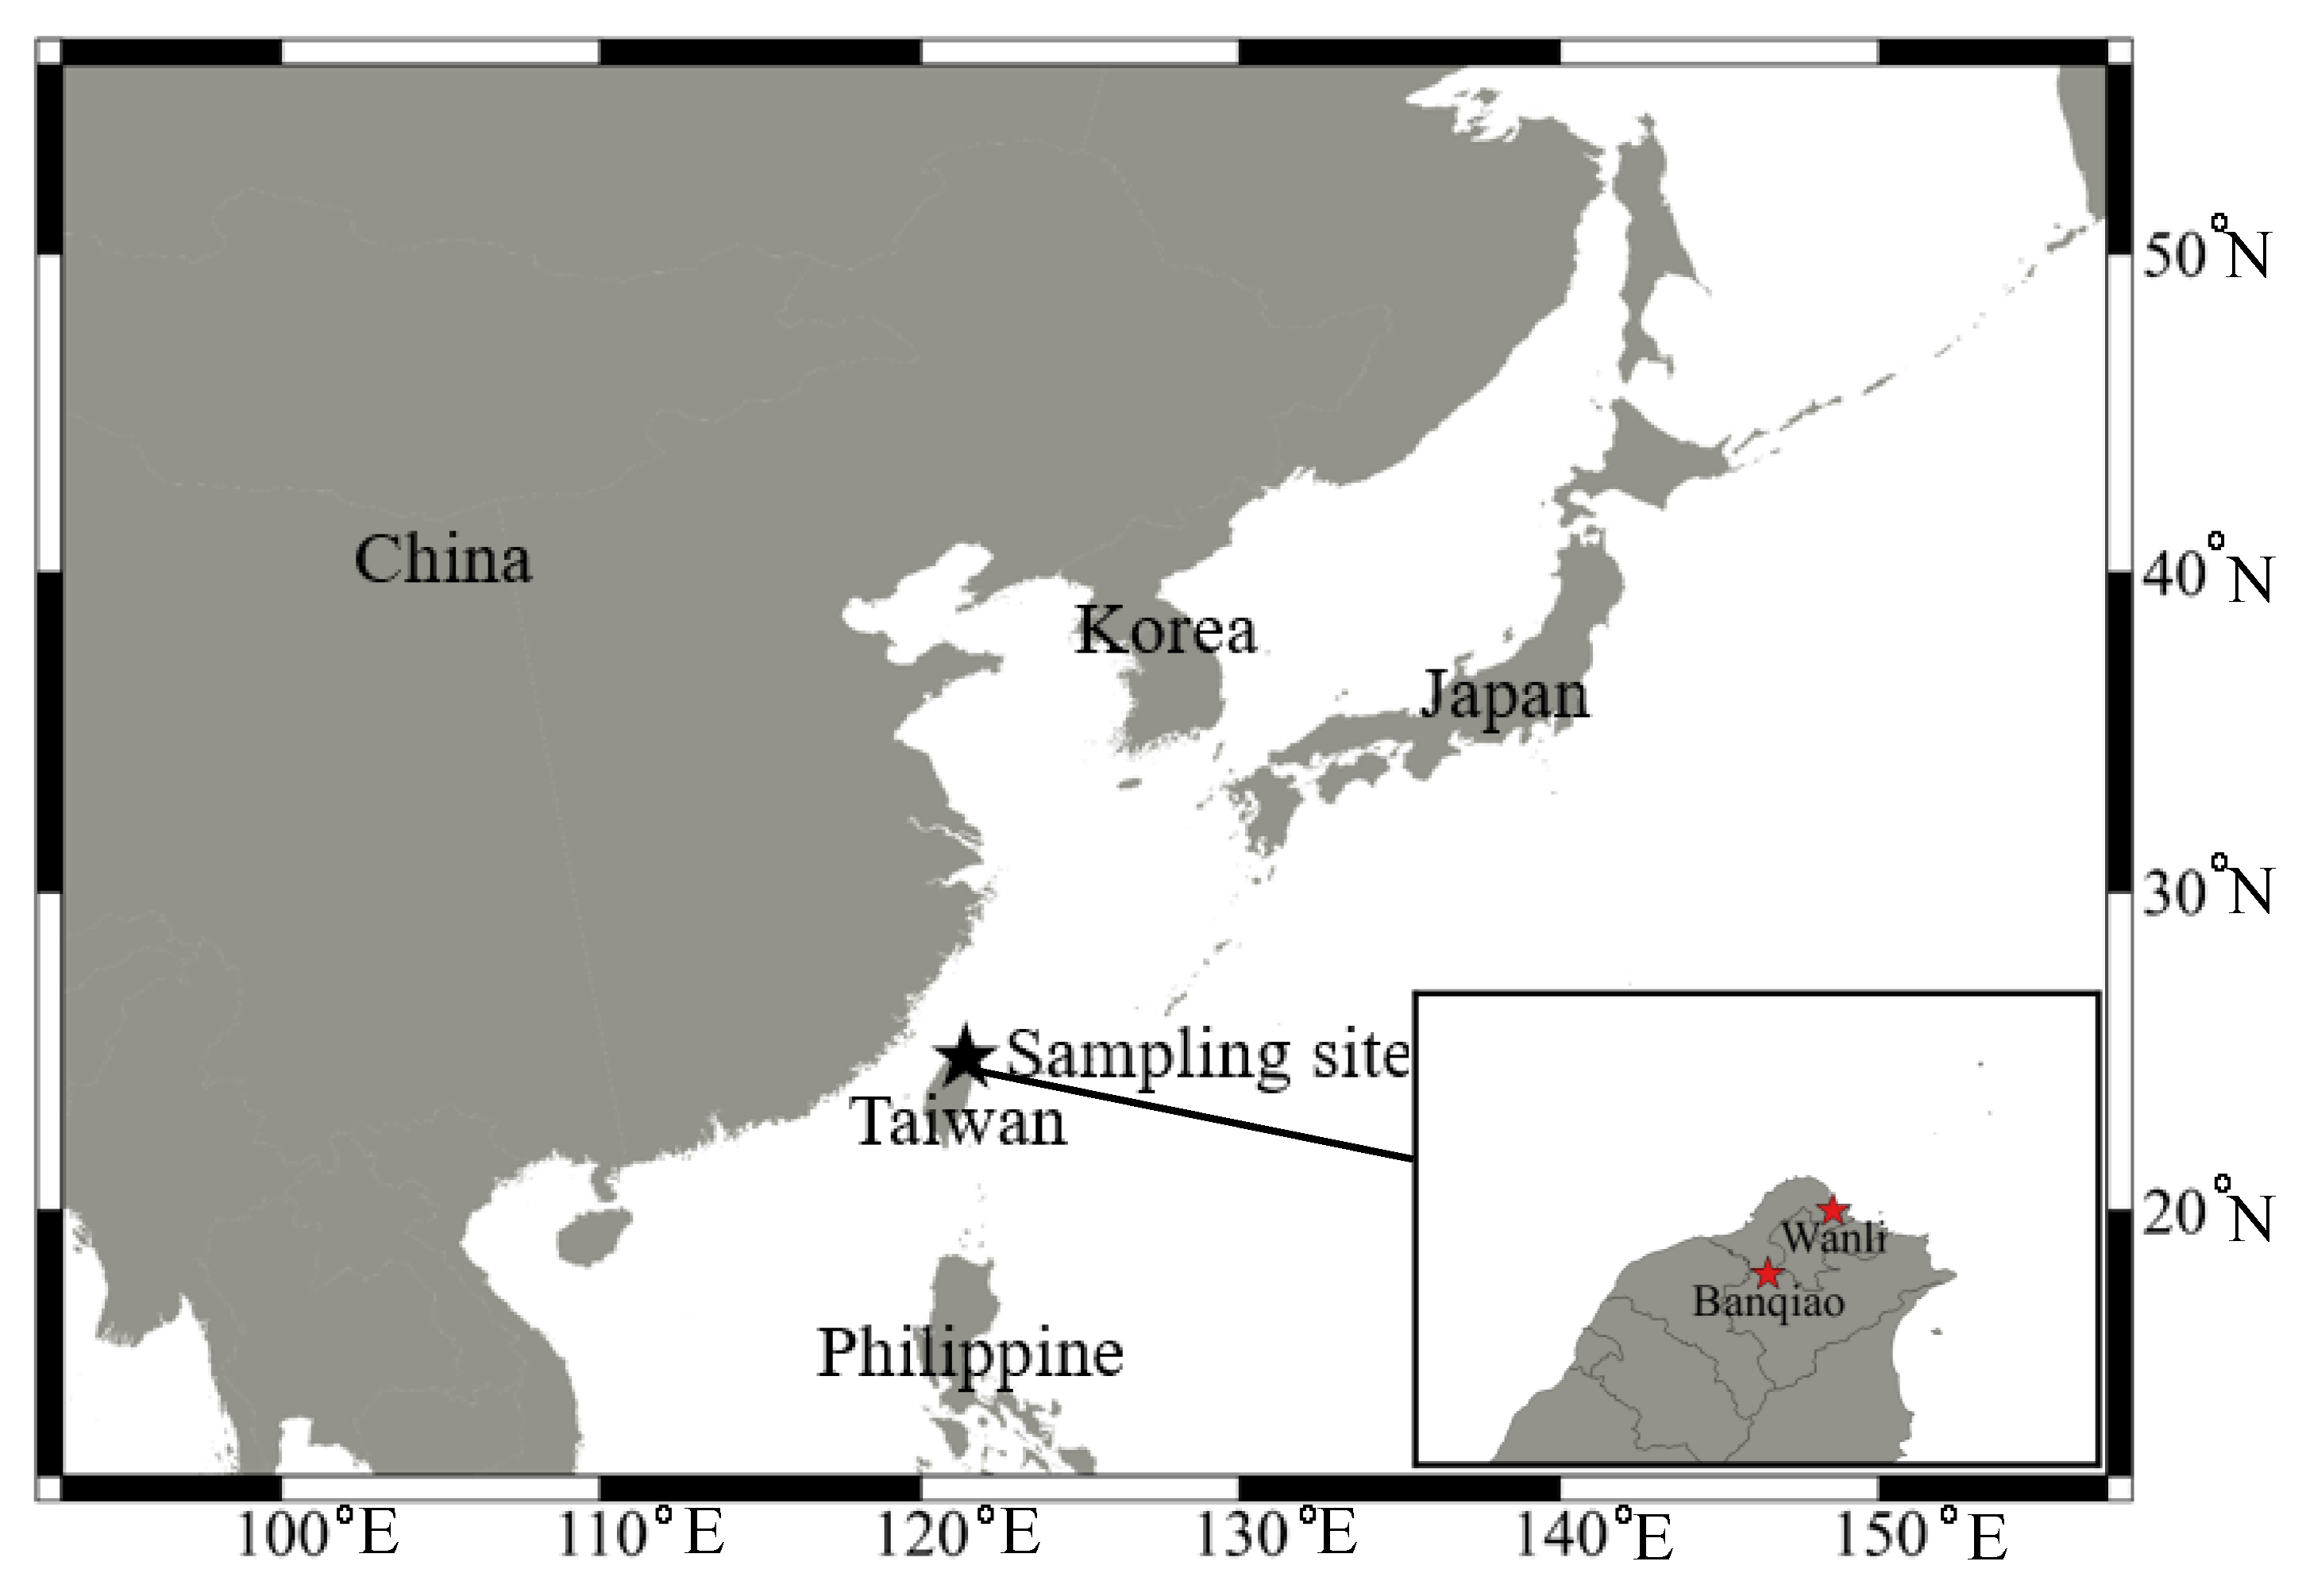
2.1. Sampling Location and Sample Analysis
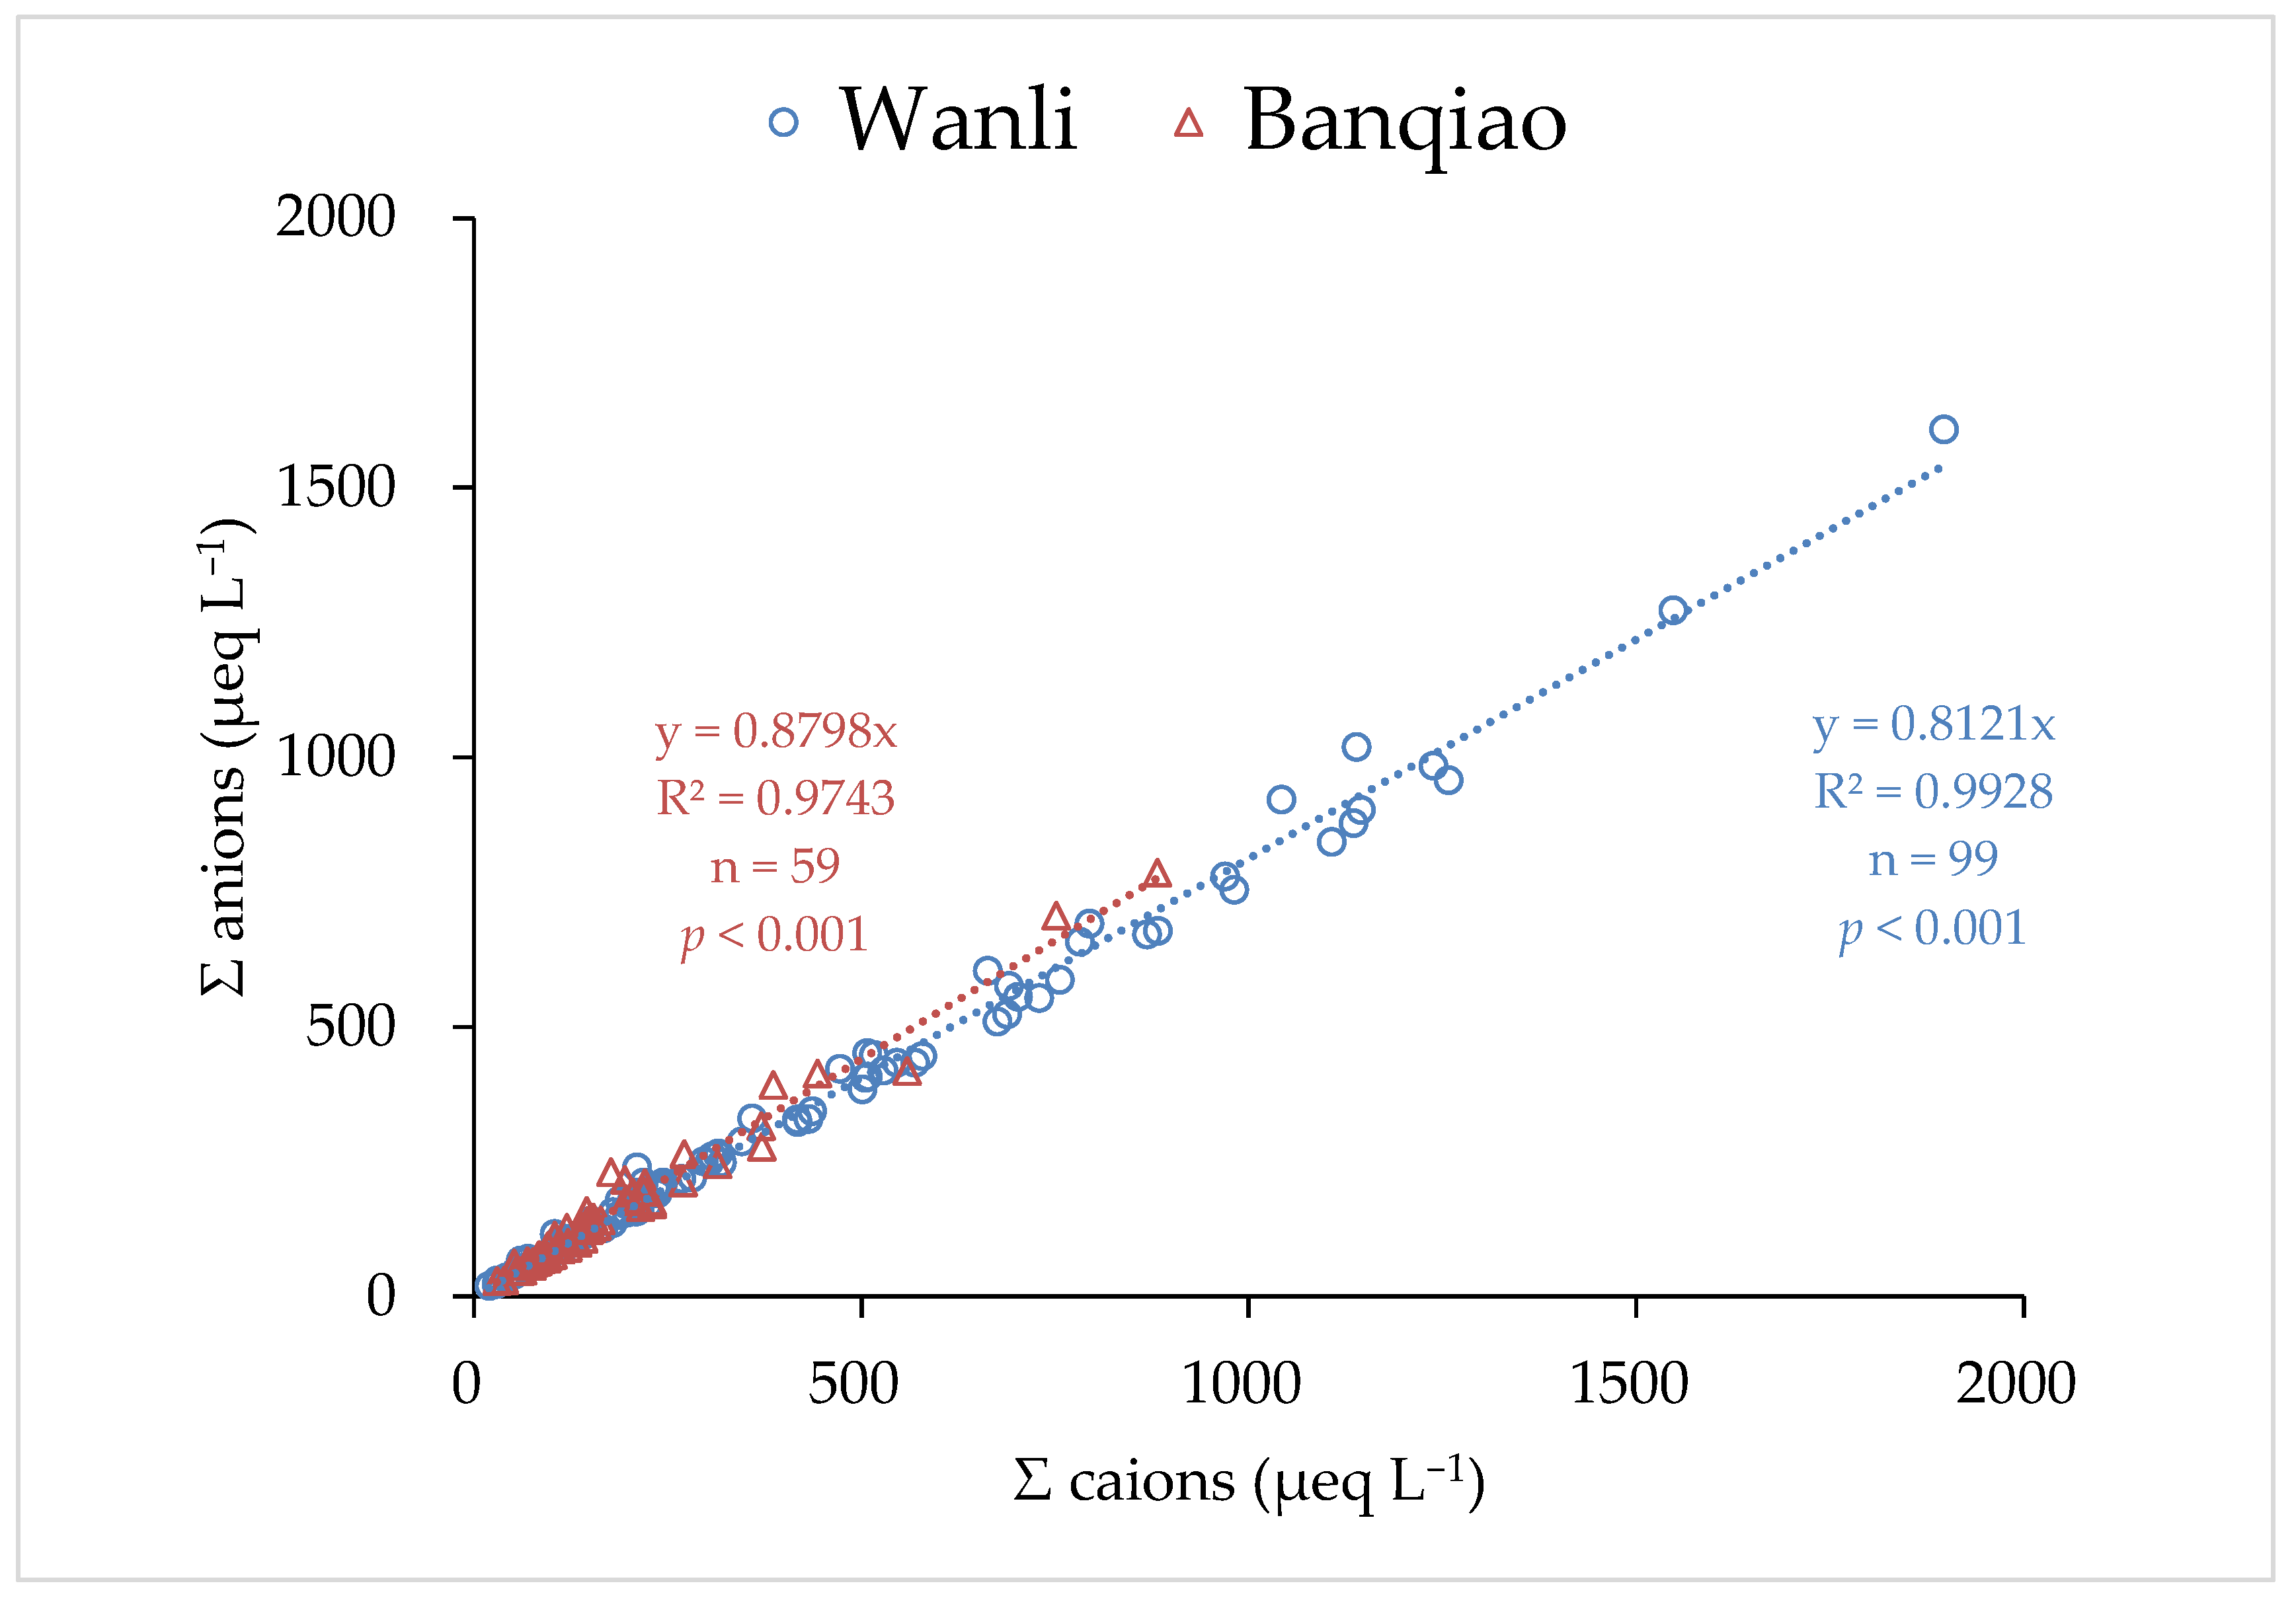
2.2. Quality Assurance Measures
2.3. Major Ion Reference Indexes
2.3.1. Enrichment Factor (EF) and Source Fraction
2.3.2. Correlation and Principal Component Analysis
3. Results and Discussion
3.1. Variation of pH and Chemical Composition of Rainwater
3.2. Enrichment Factors and Relative Source Contributions
3.3. Neutralization and Alkalization of Rainwater
3.4. Correlation Analysis and PCA
4. Conclusions
Author Contributions
Funding
Acknowledgments
Conflicts of Interest
References
- Khan, M.F.; Maulud, K.N.A.; Latif, M.T.; Chung, J.X.; Amil, N.; Alias, A.; Nadzir, M.S.M.; Sahani, M.; Mohammad, M.; Jahaya, M.F.; et al. Physicochemical factors and their potential sources inferred from long-term rainfall measurements at an urban and a remote rural site in tropical areas. Sci. Total Environ. 2018, 613, 1401–1416. [Google Scholar] [CrossRef] [PubMed]
- Anil, I.; Alagha, O.; Blaisi, N.I.; Mohamed, I.A.; Barghouthi, M.H.; Manzar, M.S. Source Identification of Episodic Rain Pollutants by a New Approach: Combining Satellite Observations and Backward Air Mass Trajectories. Aerosol Air Qual. Res. 2019, 19, 2827–2843. [Google Scholar] [CrossRef]
- Kulshrestha, U.C.; Kulshrestha, M.J.; Sekar, R.; Sastry, G.S.R.; Vairamani, M. Chemical characteristics of rainwater at an urban site of south-central India. Atmos. Environ. 2003, 37, 3019–3026. [Google Scholar] [CrossRef]
- Chen, Y.X.; Chen, H.Y.; Wang, W.; Yeh, J.X.; Chou, W.C.; Gong, G.C.; Tsai, F.J.; Huang, S.J.; Lin, C.T. Dissolved organic nitrogen in wet deposition in a coastal city (Keelung) of the southern East China Sea: Origin, molecular composition and flux. Atmos. Environ. 2015, 112, 20–31. [Google Scholar] [CrossRef]
- Anil, I.; Alagha, O.; Karaca, F. Effects of transport patterns on chemical composition of sequential rain samples: Trajectory clustering and principal component analysis approach. Air Qual. Atmos. Health 2017, 10, 1193–1206. [Google Scholar] [CrossRef]
- Meng, Y.; Zhao, Y.L.; Li, R.; Li, J.L.; Cui, L.L.; Kong, L.D.; Fu, H.B. Characterization of inorganic ions in rainwater in the megacity of Shanghai: Spatiotemporal variations and source apportionment. Atmos. Res. 2019, 222, 12–24. [Google Scholar] [CrossRef]
- Keresztesi, Á.; Birsan, M.; Nita, I.; Bodor, Z.; Szép, R. Assessing the neutralisation, wet deposition and source contributions of the precipitation chemistry over Europe during 2000–2017. Environ. Sci. Eur. 2019, 31, 50. [Google Scholar] [CrossRef]
- Grennfelt, P.; Engleryd, A.; Forsius, M.; Hov, Ø.; Rodhe, H.; Cowling, E. Acid rain and air pollution: 50 years of progress in environmental science and policy. Ambio 2020, 49, 849–864. [Google Scholar] [CrossRef]
- Chen, H.Y.; Chen, L.D. Importance of anthropogenic inputs and continental-derived dust for the distribution and flux of water-soluble nitrogen and phosphorus species in aerosol within the atmosphere over the East China Sea. J. Geophys. Res. 2008, 113. [Google Scholar] [CrossRef]
- Zhou, X.D.; Xu, Z.F.; Liu, W.J.; Wu, Y.; Zhao, T.; Jiang, H.; Zhang, X.; Zhang, J.Y.; Zhou, L.; Wang, Y.C. Chemical composition of precipitation in Shenzhen, a coastal mega-city in South China: Influence of urbanization and anthropogenic activities on acidity and ionic composition. Sci. Total Environ. 2019, 662, 218–226. [Google Scholar] [CrossRef]
- Smith, R.A. Air and Rain: The Beginnings of a Chemical Climatology; Longmans, Green, and Company: London, UK, 1872. [Google Scholar]
- Galloway, J.N. Acidification of the World: Natural and Anthropogenic. Water Air Soil Pollut. 2001, 130, 17–24. [Google Scholar] [CrossRef]
- EANET. Data Report on the Acid Deposition in the East Asian Region 2015. 2016. Available online: https://monitoring.eanet.asia/document/public/index (accessed on 13 December 2018).
- Keene, W.C.; Pszenny, A.A.; Galloway, J.N.; Hawley, M.E. Sea-salt corrections and interpretation of constituent ratios in marine precipitation. J. Geophys. Res. Atmos. 1986, 91, 6647–6658. [Google Scholar] [CrossRef]
- Kulshrestha, U.C.; Sarkar, A.K.; Srivastava, S.S.; Parashar, D.C. Investigation into atmospheric deposition through precipitation studies at New Delhi (India). Atmos. Environ. 1996, 30, 4149–4154. [Google Scholar] [CrossRef]
- Al-Momani, I.F.; Güllü, G.; Ölmez, I.; Eler, Ü.; Örtel, E.; Sirin, G.; Tuncel, G. Chemical composition of eastern Mediterranean aerosol and precipitation: Indications of long-range transport. Pure Appl. Chem. 1997, 69, 41–46. [Google Scholar] [CrossRef]
- Taylor, S.R. Abundance of chemical elements in the continental crust: A new table. Geochim. Cosmochim. Acta. 1964, 28, 1273–1285. [Google Scholar] [CrossRef]
- Cao, Y.Z.; Wang, S.; Zhang, G.; Luo, J.; Lu, S. Chemical characteristics of wet precipitation at an urban site of Guangzhou, South China. Atmos. Res. 2009, 94, 462–469. [Google Scholar] [CrossRef]
- Lu, X.; Li, L.Y.; Li, N.; Yang, G.; Luo, D.; Chen, J. Chemical characteristics of spring rainwater of Xi’an city, NW China. Atmos. Environ. 2011, 45, 5058–5063. [Google Scholar] [CrossRef]
- Balasubramanian, R.; Victor, T.; Chun, N. Chemical and statistical analysis of precipitation in Singapore. Water Air Soil Pollut. 2001, 130, 451–456. [Google Scholar] [CrossRef]
- Possanzini, M.; Buttini, P.; Di Palo, V. Characterization of a rural area in terms of dry and wet deposition. Sci. Total Environ. 1988, 74, 111–120. [Google Scholar] [CrossRef]
- Alagha, O.; Tuncel, G. Evaluation of air quality over the black sea major ionic composition of rainwater. Water Air Soil Pollut. Focus. 2003, 3, 89–98. [Google Scholar] [CrossRef]
- Behera, S.N.; Sharma, M. Investigating the potential role of ammonia in ion chemistry of fine particulate matter formation for an urban environment. Sci. Total Environ. 2010, 408, 3569–3575. [Google Scholar] [CrossRef]
- Chu, S.H. PM2.5 episodes as observed in the speciation trends network. Atmos. Environ. 2004, 38, 5237–5246. [Google Scholar] [CrossRef]
- Lee, R.J.; Nicewander, W.A. Thirteen ways to look at the correlation coefficient. Am. Stat. 1988, 42, 59–66. [Google Scholar]
- Jolliffe, C.; Cousins, L.; Javahery, G. Method and Apparatus for Detecting Positively Charged and Negatively Charged Ionized Particles. U.S. Patent 7,728,292, 1 June 2010. [Google Scholar]
- Xu, Z.; Wu, Y.; Liu, W.J.; Liang, C.S.; Ji, J.P.; Zhao, T.; Zhang, X. Chemical composition of rainwater and the acid neutralizing effect at Beijing and Chizhou city, China. Atmos. Res. 2015, 164, 278–285. [Google Scholar] [CrossRef]
- Huang, K.; Zhuang, G.; Xu, C.; Wang, Y.; Tang, A. The chemistry of the severe acidic precipitation in Shanghai, China. Atmos. Res. 2008, 89, 149–160. [Google Scholar] [CrossRef]
- Tiwari, S.; Hopke, P.K.; Thimmaiah, D.; Dumka, U.C.; Srivastava, A.K.; Bisht, D.S.; Rao, P.S.; Chate, D.M.; Srivastava, M.K.; Tripathi, S.N. Nature and sources of ionic species in precipitation across the indo-gangetic plains, India. Aerosol Air Qual. Res. 2016, 16, 943–957. [Google Scholar] [CrossRef]
- Al-Momani, I.F.; Ataman, O.Y.; Anwari, M.A.; Tuncel, S.; Köse, C.; Tuncel, G. Chemical composition of precipitation near an industrial area at Izmir, Turkey. Atmos. Environ. 1995, 29, 1131–1143. [Google Scholar] [CrossRef]
- Al-Momani, I.F.; Tuncel, S.; Eler, Ü.; Örtel, E.; Sirin, G.; Tuncel, G. Major ion composition of wet and dry deposition in the eastern Mediterranean basin. Sci. Total Environ. 1995, 164, 75–85. [Google Scholar] [CrossRef]
- Zhang, M.; Wang, S.; Wu, F.; Yuan, X.; Zhang, Y. Chemical compositions of wet precipitation and anthropogenic influences at a developing urban site in southeastern China. Atmos. Res. 2007, 84, 311–322. [Google Scholar] [CrossRef]
- Xiao, J. Chemical composition and source identification of rainwater constituents at an urban site in Xian. Environ. Earth Sci. 2016, 75, 1–12. [Google Scholar] [CrossRef]
- Szép, R.; Bodor, Z.; Miklóssy, I.; Niță, I.A.; Oprea, O.A.; Keresztesi, Á. Influence of peat fires on the rainwater chemistry in intra-mountain basins with specific atmospheric circulations (Eastern Carpathians, Romania). Sci. Total Environ. 2019, 647, 275–289. [Google Scholar] [CrossRef]
- Yatkin, S.; Adali, M.; Bayram, A. A study on the precipitation in Izmir, Turkey: Chemical composition and source apportionment by receptor models. J. Atmos. Chem. 2016, 73, 241–259. [Google Scholar] [CrossRef]
- Rao, P.S.P.; Tiwari, S.; Matwale, J.L.; Pervez, S.; Tunved, P.; Safai, P.D.; Srivastava, A.K.; Bisht, D.S.; Singh, S.; Hopke, P.K. Sources of chemical species in rainwater during monsoon and non-monsoonal periods over two mega cities in India and dominant source region of secondary aerosols. Atmos. Environ. 2016, 146, 90–99. [Google Scholar] [CrossRef]
- Wu, Y.; Xu, Z.; Liu, W.; Zhao, T.; Zhang, X.; Jiang, H.; Yu, C.; Zhou, L.; Zhou, X. Chemical compositions of precipitation at three non-urban sites of Hebei Province, North China: Influence of terrestrial sources on ionic composition. Atmos. Res. 2016, 181, 115–123. [Google Scholar] [CrossRef]
- Szép, R.; Mateescu, E.; Niță, A.; Birsan, M.V.; Bodor, Z.; Keresztesi, Á. Effects of the Eastern Carpathians on atmospheric circulations and precipitation chemistry from 2006 to 2016 at four monitoring stations (Eastern Carpathians, Romania). Atmos. Res. 2018, 214, 311–328. [Google Scholar] [CrossRef]
- Zunckel, M.; Saizar, C.; Zarauz, J. Rainwater composition in northeast Uruguay. Atmos. Environ. 2003, 37, 1601–1611. [Google Scholar] [CrossRef]
- Herut, B.; Starinsky, A.; Katz, A.; Rosenfeld, D. Relationship between the acidity and chemical composition of rainwater and climatological conditions along a transition zone between large deserts and Mediterranean climate, Israel. Atmos. Environ. 2000, 34, 1281–1292. [Google Scholar] [CrossRef]
- Tiwari, S.; Chate, D.M.; Bisht, D.S.; Srivastava, M.K.; Padmanabhamurty, B. Rainwater chemistry in the North Western Himalayan Region, India. Atmos. Res. 2012, 104-105, 128–138. [Google Scholar] [CrossRef]
- Harrison, R.M.; Pio, C.A. Size-differentiated composition of inorganic atmospheric aerosols of both marine and polluted continental origin. Atmos. Environ. 1983, 17, 1733–1738. [Google Scholar] [CrossRef]
- Chate, D.M.; Devara, P.C.S. Acidity of raindrop by uptake of gases and aerosol pollutants. Atmos. Environ. 2009, 43, 1571–1577. [Google Scholar] [CrossRef]
- Roy, A.; Chatterjee, A.; Tiwari, S.; Sarkar, C.; Das, S.K.; Ghosh, S.K.; Raha, S. Precipitation chemistry over urban, rural and high altitude Himalayan stations in eastern India. Atmos. Res. 2016, 181, 44–53. [Google Scholar] [CrossRef]
- Kumar, R.; Rani, A.; Singh, S.P.; Kumari, K.M.; Srivastava, S.S. A long term study on chemical composition of rainwater at Dayalbagh, a suburban site of semiarid region. J. Atmos. Chem. 2002, 41, 265–279. [Google Scholar] [CrossRef]
- Seinfeld, J.H. Atmospheric chemistry and physics of air pollution. Environ. Sci. Technol. 1986, 20, 863. [Google Scholar] [CrossRef] [PubMed]
- Niu, H.; He, Y.; Lu, X.X.; Shen, J.; Du, J.; Zhang, T.; Pu, T.; Xin, H.; Chang, L. Chemical composition of rainwater in the Yulong Snow Mountain region, Southwestern China. Atmos. Res. 2014, 144, 195–206. [Google Scholar] [CrossRef]
- Rao, W.; Han, G.; Tan, H.; Jin, K.; Wang, S.; Chen, T. Chemical and Sr isotopic characteristics of rainwater on the Alxa Desert Plateau, North China: Implication for air quality and ion sources. Atmos. Res. 2017, 193, 163–172. [Google Scholar] [CrossRef]
- Li, Y.C.; Zhang, M.; Shu, M.; Ho, S.S.H.; Liu, Z.F.; Wang, X.X.; Zhao, X.Q. Chemical characteristics of rainwater in Sichuan basin, a case study of Ya’an. Environ. Sci. Pollut. Res. 2016, 23, 13088–13099. [Google Scholar] [CrossRef]
- European Environmental Agency (EEA). Air Quality in Europe—2015 Report; EEA: Copenhagen, Denmark, 2015. [Google Scholar]
- Kim, M.K.; Lee, J.S.; Jung, G.B.; Ko, B.G.; Kwon, S.I.; Kim, M.Y.; So, K.H.; Yun, S.G. Chemical characterization of rainwater over Suwon region during farming and non-farming periods. J. Agric. Chem. Environ. 2013, 2, 1–7. [Google Scholar] [CrossRef][Green Version]
- Wang, H.; Han, G. Chemical composition of rainwater and anthropogenic influences in Chengdu, Southwest China. Atmos. Res. 2011, 99, 190–196. [Google Scholar] [CrossRef]
- Tiwari, S.; Srivastava, M.K.; Bisht, D.S. Chemical composition of rainwater in Panipat, an industrial city in Haryana. Indian J. Radio Space Phys. 2008, 37, 443–449. [Google Scholar]
- Lara, L.B.; Artaxo, P.; Martinelli, L.A.; Victoria, R.L.; Camargo, P.B.; Krusche, A.; Ayers, G.P.; Ferraz, E.S.B.; Ballester, M.V. Chemical composition of rainwater and anthropogenic influences in the Piracicaba River Basin, Southeast Brazil. Atmos. Environ. 2001, 35, 4937–4945. [Google Scholar] [CrossRef]
- Budhavant, K.B.; Rao, P.S.P.; Safai, P.D.; Ali, K. Influence of local sources on rainwater chemistry over Pune region, India. Atmos. Res. 2011, 100, 121–131. [Google Scholar] [CrossRef]


| Locations | Sampling Period | SO42− | nss-SO42− | NO3− | Cl− | NH4+ | Na+ | K+ | Ca2+ | nss-Ca2+ | Mg2+ | H+ | pH | Rainfall | |
|---|---|---|---|---|---|---|---|---|---|---|---|---|---|---|---|
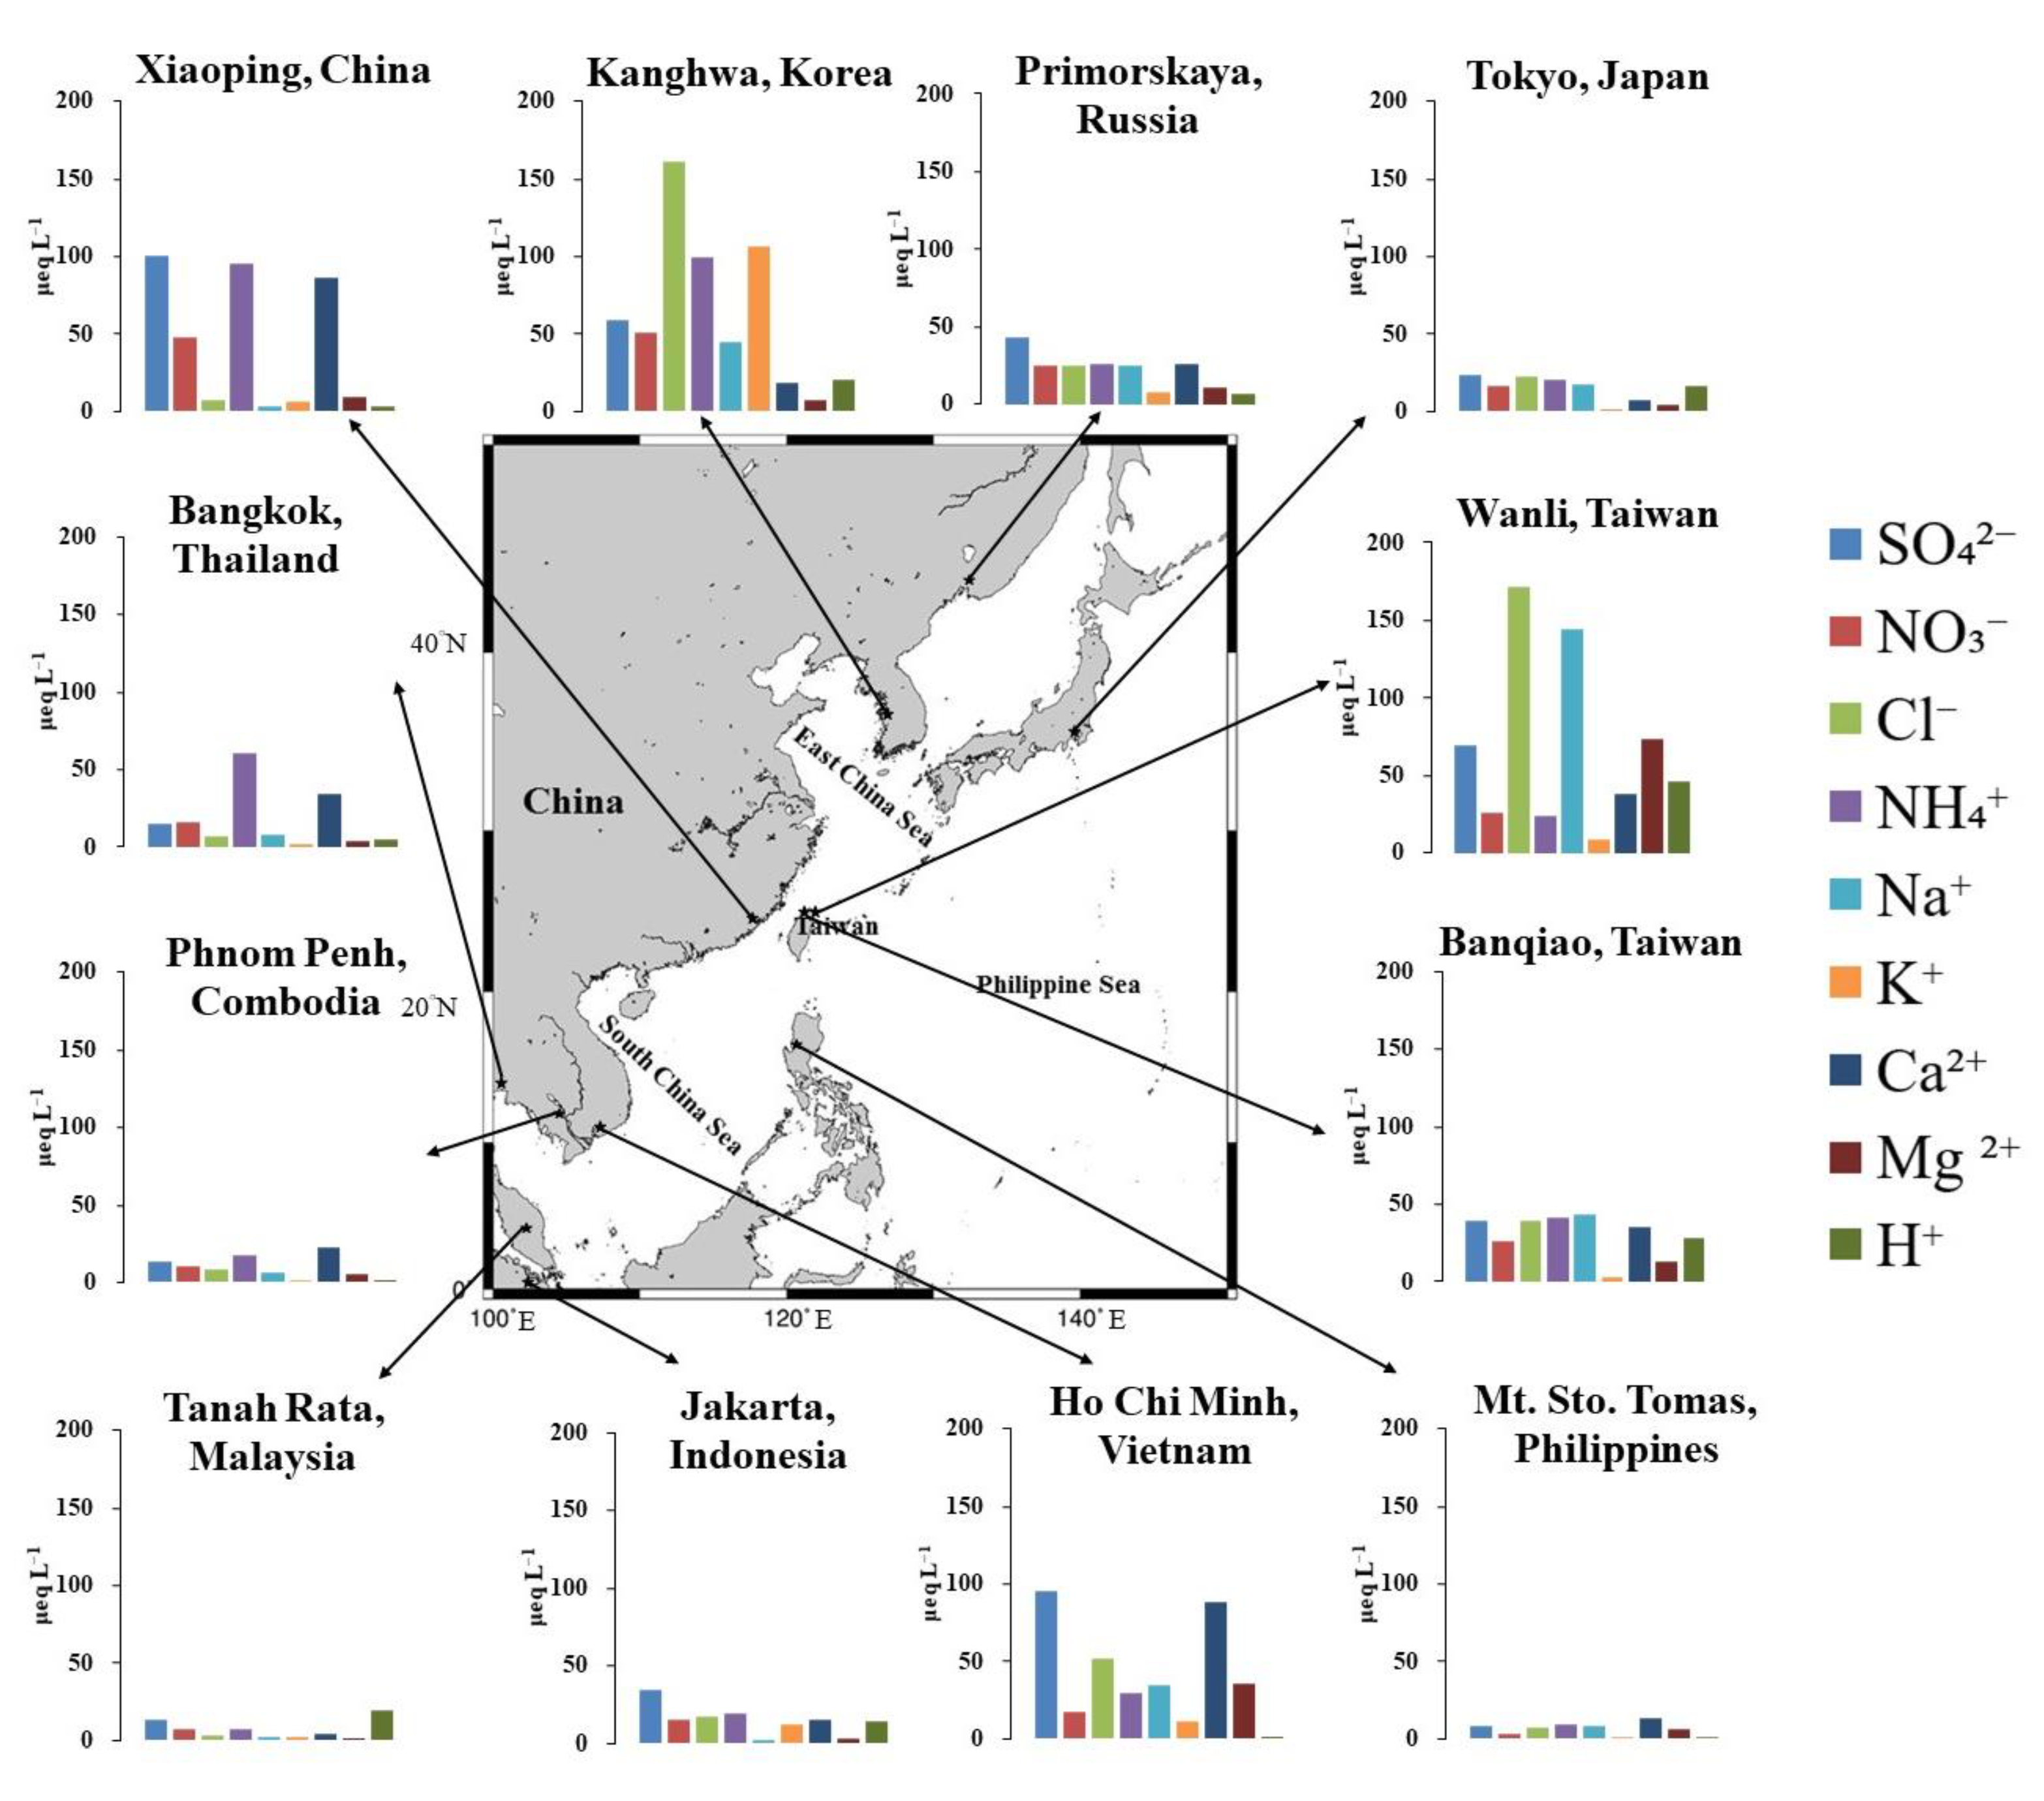
| Primorskaya, Russia | Rural | 2015 | 42.77 | 39.78 | 25.41 | 25.45 | 25.73 | 24.79 | 7.79 | 26.21 | 25.14 | 11.23 | 6.90 | 5.16 | 1157 |
| Tokyo, Japan | Urban | 2015 | 23.41 | 21.24 | 16.27 | 22.16 | 20.13 | 18.04 | 0.64 | 7.12 | 6.34 | 4.90 | 16.35 | 4.79 | 1641 |
| Kanghwa, Korea | Rural | 2015 | 58.78 | 53.35 | 50.46 | 161.32 | 99.02 | 45.02 | 106.41 | 19.04 | 17.11 | 7.21 | 20.21 | 4.69 | 589 |
| Xiaoping, China | Urban | 2015 | 100.56 | 100.12 | 47.42 | 7.78 | 95.15 | 3.61 | 5.99 | 86.06 | 85.91 | 9.59 | 3.81 | 5.42 | 1557 |
| Mt. Sto. Tomas, Philippines | Rural | 2015 | 8.04 | 6.99 | 3.49 | 7.79 | 9.57 | 8.71 | 1.63 | 13.69 | 13.32 | 6.89 | 1.10 | 5.96 | 6108 |
| Bangkok, Thailand | Urban | 2015 | 15.05 | 14.09 | 16.16 | 7.36 | 60.74 | 7.97 | 1.75 | 33.89 | 33.55 | 3.79 | 5.09 | 5.29 | 1593 |
| Ho Chi Minh, Vietnam | Urban | 2015 | 95.19 | 91.02 | 17.97 | 52.03 | 29.44 | 34.57 | 12.02 | 88.51 | 87.02 | 35.79 | 0.78 | 6.11 | 1420 |
| Phnom Penh, Combodia | Urban | 2015 | 14.08 | 13.33 | 10.36 | 9.01 | 18.06 | 6.28 | 1.98 | 23.20 | 22.93 | 5.11 | 0.72 | 6.14 | 1103 |
| Tanah Rata, Malaysia | Rural | 2015 | 13.72 | 13.39 | 7.63 | 3.75 | 7.54 | 2.74 | 2.37 | 3.99 | 3.89 | >0.6 | 19.14 | 4.72 | 2684 |
| Jakarta, Indonesia | Urban | 2015 | 34.21 | 32.54 | 15.27 | 17.10 | 18.94 | 2.01 | 12.54 | 14.94 | 14.85 | 3.61 | 14.44 | 4.84 | 2807 |
| This Study | |||||||||||||||
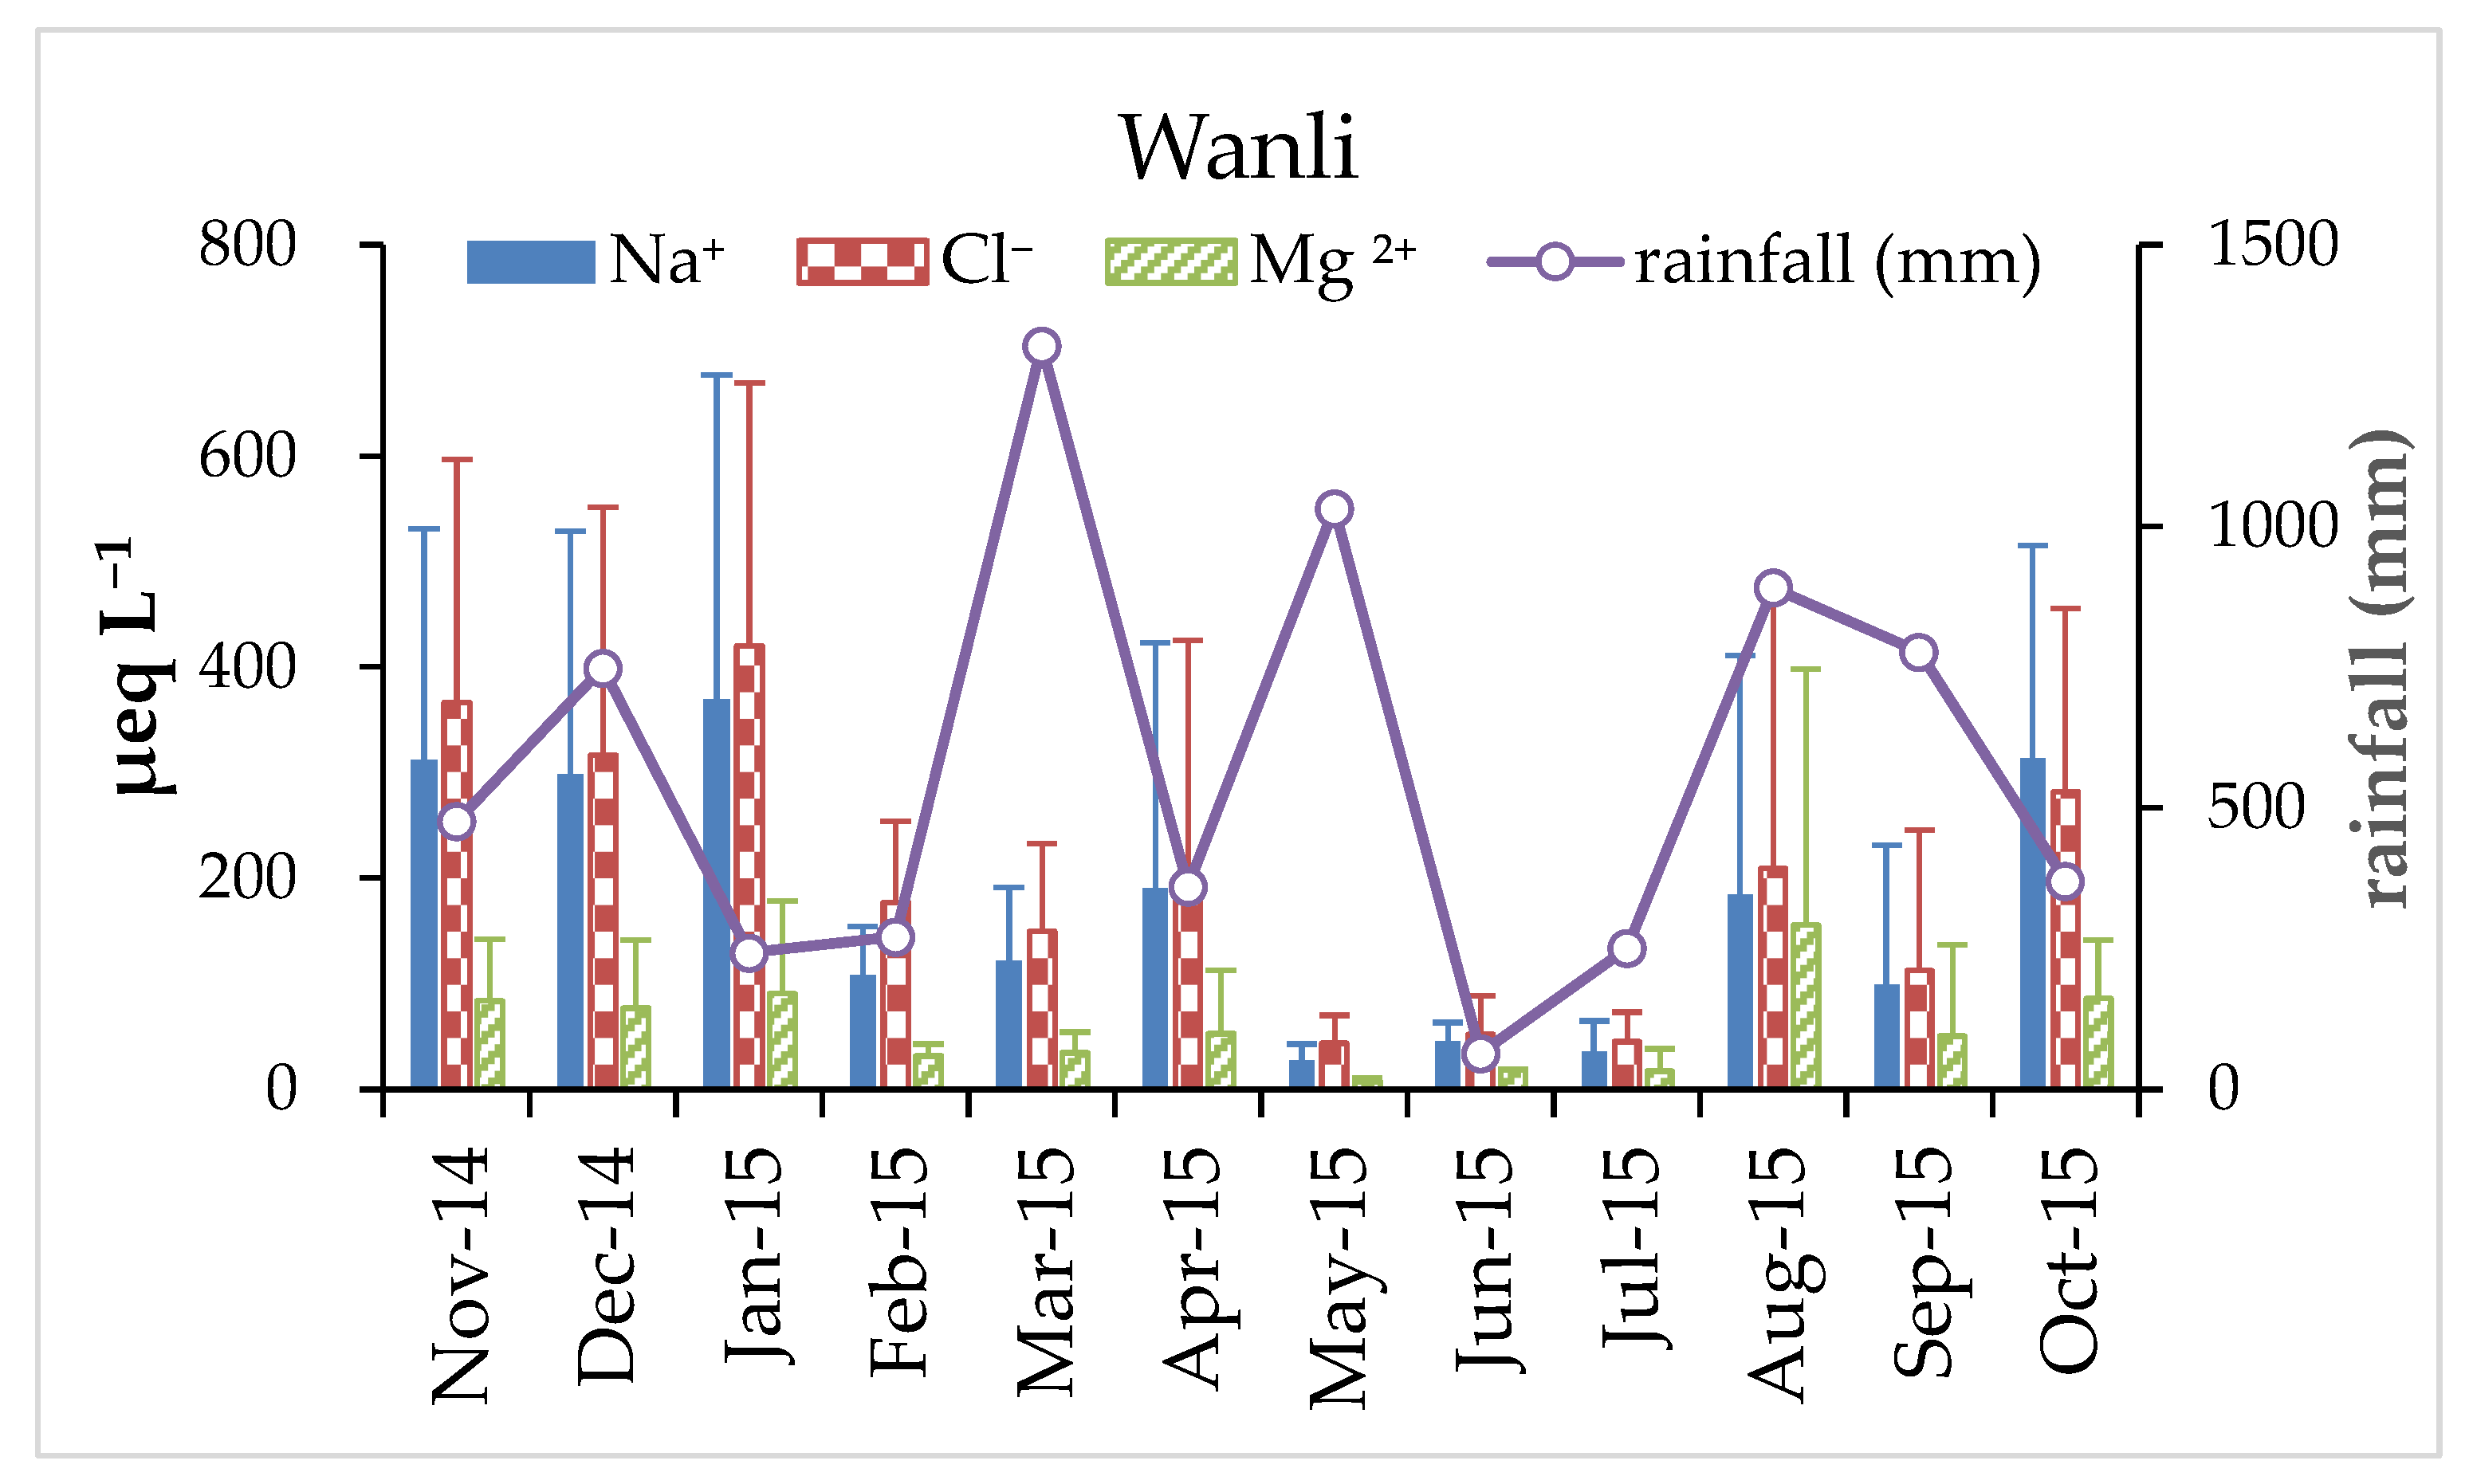
| Wanli, Taiwan | Costal | 11/2014–10/2015 | 69.42 | 52.00 | 25.96 | 171.79 | 23.89 | 144.72 | 8.35 | 38.61 | 32.30 | 73.26 | 46.51 | 4.63 | 6790 |
| Banqiao, Taiwan | Urban | 11/2014–10/2015 | 44.01 | 40.44 | 34.98 | 33.65 | 31.37 | 29.68 | 2.99 | 25.76 | 24.46 | 12.83 | 28.63 | 4.58 | 3873 |
| EFm | EFc | |||||||||
|---|---|---|---|---|---|---|---|---|---|---|
| Cl− | K+ | Ca2+ | Mg2+ | SO42− | Cl− | K+ | Na+ | Mg2+ | SO42− | |
| Primorskaya, Russia | 0.88 | 14.28 | 24.03 | 2.00 | 14.26 | >100 | 0.59 | 1.66 | 0.76 | 85.88 |
| Tokyo, Japan | 1.06 | 1.62 | 8.97 | 1.20 | 10.73 | >100 | 0.18 | 4.45 | 1.23 | >100 |
| Kanghwa, Korea | 3.09 | >100 | 9.61 | 0.71 | 10.79 | >100 | 11.09 | 4.16 | 0.68 | >100 |
| Xiaoping, China | 1.86 | 75.43 | >100 | 11.70 | >100 | 30.12 | 0.14 | 0.07 | 0.20 | 61.50 |
| Mt. Sto. Tomas, Philippines | 0.77 | 8.48 | 35.73 | 3.48 | 7.63 | >100 | 0.24 | 1.12 | 0.90 | 30.90 |
| Bangkok, Thailand | 0.80 | 9.97 | 96.61 | 2.09 | 1.89 | 72.39 | 0.10 | 0.41 | 0.20 | 23.37 |
| Ho Chi Minh, Vietnam | 1.30 | 15.80 | 58.19 | 4.56 | 22.76 | >100 | 0.27 | 0.69 | 0.72 | 56.60 |
| Phnom Penh, Combodia | 1.24 | 14.35 | 84.00 | 3.59 | 18.54 | >100 | 0.17 | 0.48 | 0.39 | 31.95 |
| Tanah Rata, Malaysia | 1.18 | 39.25 | 33.10 | 0.96 | 41.34 | >100 | 1.18 | 1.21 | 0.27 | >100 |
| Jakarta, Indonesia | 7.32 | >100 | >100 | 7.90 | >100 | >100 | 1.67 | 0.24 | 0.43 | >100 |
| This Study | ||||||||||
| Wanli, Taiwan | 1.02 | 2.62 | 6.06 | 2.23 | 3.96 | >100 | 0.43 | 6.59 | 0.90 | 94.63 |
| Banqiao, Taiwan | 0.98 | 4.57 | 19.73 | 1.90 | 12.26 | >100 | 0.23 | 2.02 | 0.77 | 89.92 |
| Wanli | Banqiao | |||||
|---|---|---|---|---|---|---|
| Marine | Crust | Anthorpogenic | Marine | Crust | Anthorpogenic | |
| SSF(%) | CF(%) | AF(%) | SSF(%) | CF(%) | AF(%) | |
| Na+ | 84.82 | 15.18 | 50.61 | 49.39 | ||
| Ca2+ | 16.49 | 83.51 | 5.07 | 94.93 | ||
| Mg2+ | 44.84 | 29.57 | 25.59 | 52.50 | 47.50 | |
| K+ | 38.12 | 61.88 | 21.86 | 78.14 | ||
| Cl− | 97.72 | 0.07 | 2.21 | 99.77 | 0.23 | |
| SO42− | 25.22 | 1.06 | 73.72 | 8.16 | 1.11 | 90.73 |
| NO3− | 0.30 | 99.70 | 0.15 | 99.85 | ||
| FA | NF(X+) | NF(X2+) | NP/AP | |||
|---|---|---|---|---|---|---|
| NH4+ | K+ | Mg2+ | Ca2+ | |||
| Wanli | 0.60 | 0.18 | 0.06 | 0.70 | 0.37 | 0.72 |
| Banqiao | 0.38 | 0.27 | 0.03 | 0.12 | 0.23 | 0.74 |
| Wanli n = 99 | |||||||||||||||
| H+ | 1 | 0.132 | 0.770 ** | 0.033 | 0.077 | 0.782 ** | −0.031 | −0.065 | −0.023 | 0.022 | −0.037 | H+ | |||
| H+ | 1 | CI− | H+ | 1 | 0.209 * | 0.972 ** | 0.994 ** | 0.126 | 0.679 ** | 0.953 ** | 0.968 ** | 0.959 ** | 0.959 ** | CI− | |
| CI− | 0.253 | 1 | NO3− | CI− | 1 | 0.132 | 0.195 | 0.895 ** | 0.002 | 0.023 | 0.103 | 0.115 | 0.089 | NO3− | |
| NO3− | 0.637 ** | 0.457 ** | 1 | SO42− | NO3− | 1 | 0.974 ** | 0.055 | 0.657 ** | 0.989 ** | 0.991 ** | 0.999 ** | 0.988 ** | SO42− | |
| SO42− | 0.465 ** | 0.696 ** | 0.878 ** | 1 | Na+ | SO42− | 1 | 0.088 | 0.648 ** | 0.956 ** | 0.971 ** | 0.960 ** | 0.962 ** | Na+ | |
| Na+ | 0.171 | 0.907 ** | 0.549 ** | 0.815 ** | 1 | NH4+ | Na+ | 1 | −0.051 | −0.053 | 0.025 | 0.046 | 0.016 | NH4+ | |
| NH4+ | 0.498 ** | 0.206 | 0.782 ** | 0.629 ** | 0.232 | 1 | K+ | NH4+ | 1 | 0.661 ** | 0.666 ** | 0.654 ** | 0.665 ** | K+ | |
| K+ | 0.073 | 0.405 ** | 0.010 | 0.000 | 0.117 | −0.019 | 1 | Mg2+ | K+ | 1 | 0.989 ** | 0.989 ** | 0.990 ** | Mg2+ | |
| Mg2+ | 0.246 | 0.802 ** | 0.690 ** | 0.903 ** | 0.933 ** | 0.349 ** | −0.043 | 1 | Ca2+ | Mg2+ | 1 | 0.988 ** | 0.999 ** | Ca2+ | |
| Ca2+ | 0.255 | 0.547 ** | 0.654 ** | 0.745 ** | 0.541 ** | 0.573 ** | 0.086 | 0.620 ** | 1 | nss-SO42− | Ca2+ | 1 | 0.987 ** | nss-SO42− | |
| nss-SO42− | 0.499 ** | 0.632 ** | 0.902 ** | 0.995 ** | 0.751 ** | 0.676 ** | −0.021 | 0.863 ** | 0.752 ** | 1 | nss-Ca2+ | nss-SO42− | 1 | nss-Ca2+ | |
| nss-Ca2+ | 0.251 | 0.484 ** | 0.632 ** | 0.701 ** | 0.468 ** | 0.579 ** | 0.078 | 0.558 ** | 0.996 ** | 0.715 ** | 1 | nss-Ca2+ | |||
| Banqiao n = 59 | |||||||||||||||
| Variable | Wanli | Banqiao | |||
|---|---|---|---|---|---|
| Factor 1 | Factor 2 | Factor 1 | Factor 2 | Factor 3 | |
| nss-SO42− | 0.984 | −0.030 | 0.968 | −0.097 | −0.096 |
| NO3− | 0.156 | 0.962 | 0.882 | −0.336 | 0.064 |
| Mg2+ | 0.979 | −0.129 | 0.879 | 0.314 | −0.288 |
| CI− | 0.985 | 0.061 | 0.752 | 0.585 | 0.158 |
| Na+ | 0.981 | 0.037 | 0.807 | 0.518 | −0.176 |
| NH4+ | 0.073 | 0.970 | 0.667 | −0.580 | 0.157 |
| nss-Ca2+ | 0.984 | −0.060 | 0.795 | −0.131 | 0.042 |
| K+ | 0.737 | −0.140 | 0.089 | 0.424 | 0.875 |
| Eigenvalue | 5.378 | 1.937 | 6.678 | 1.575 | 1.101 |
| Variance (%) | 67.220 | 24.210 | 60.710 | 14.319 | 10.008 |
| Possible source | Marine | Anthropogenic | Mixed | Marine | Crust |
© 2020 by the authors. Licensee MDPI, Basel, Switzerland. This article is an open access article distributed under the terms and conditions of the Creative Commons Attribution (CC BY) license (http://creativecommons.org/licenses/by/4.0/).
Share and Cite
Chen, H.-Y.; Hsu, L.-F.; Huang, S.-Z.; Zheng, L. Assessment of the Components and Sources of Acid Deposition in Northeast Asia: A Case Study of the Coastal and Metropolitan Cities in Northern Taiwan. Atmosphere 2020, 11, 983. https://doi.org/10.3390/atmos11090983
Chen H-Y, Hsu L-F, Huang S-Z, Zheng L. Assessment of the Components and Sources of Acid Deposition in Northeast Asia: A Case Study of the Coastal and Metropolitan Cities in Northern Taiwan. Atmosphere. 2020; 11(9):983. https://doi.org/10.3390/atmos11090983
Chicago/Turabian StyleChen, Hung-Yu, Ling-Fei Hsu, Shih-Zhe Huang, and Long Zheng. 2020. "Assessment of the Components and Sources of Acid Deposition in Northeast Asia: A Case Study of the Coastal and Metropolitan Cities in Northern Taiwan" Atmosphere 11, no. 9: 983. https://doi.org/10.3390/atmos11090983
APA StyleChen, H.-Y., Hsu, L.-F., Huang, S.-Z., & Zheng, L. (2020). Assessment of the Components and Sources of Acid Deposition in Northeast Asia: A Case Study of the Coastal and Metropolitan Cities in Northern Taiwan. Atmosphere, 11(9), 983. https://doi.org/10.3390/atmos11090983