Article

Apportioning Smoke Impacts of 2018 Wildfires on Eastern Sierra Nevada Sites

1
Forest Service, Northern Region, Regional Office, United States Department of Agriculture, Missoula, MT 59801, USA
2
Forest Service, Pacific Southwest Region, Remote Sensing Lab, United States Department of Agriculture, McClellan, CA 95652, USA
3
Forest Service, Pacific Northwest Research Station, United States Department of Agriculture, Seattle, WA 98013, USA
4
Air Quality Research Center, University of California, Davis, CA 95616, USA
*
Author to whom correspondence should be addressed.
Atmosphere 2020, 11(9), 970; https://doi.org/10.3390/atmos11090970
Submission received: 29 July 2020 / Revised: 4 September 2020 / Accepted: 9 September 2020 / Published: 11 September 2020

Abstract

:
The summer of 2018 saw intense smoke impacts on the eastern side of the Sierra Nevada in California, which have been anecdotally ascribed to the closest wildfire, the Lions Fire. We examined the role of the Lions Fire and four other, simultaneous large wildfires on smoke impacts across the Eastern Sierra. Our approach combined GOES-16 satellite data with fire activity, fuel loading, and fuel type, to allocate emissions diurnally per hour for each fire. To apportion smoke impacts at key monitoring sites, dispersion was modeled via the BlueSky framework, and daily averaged PM2.5 concentrations were estimated from 23 July to 29 August 2018. To estimate the relative impact of each contributing wildfire at six Eastern Sierra monitoring sites, we layered the multiple modeled impacts, calculated their proportion from each fire and at each site, and used that proportion to apportion smoke from each fire’s monitored impact. The combined smoke concentration due to multiple large, concurrent, but more distant fires was on many days substantially higher than the concentration attributable to the Lions Fire, which was much closer to the air quality monitoring sites. These daily apportionments provide an objective basis for understanding the extent to which local versus regional fire affected Eastern Sierra Nevada air quality. The results corroborate previous case studies showing that slower-growing fires, when and where managed for resource objectives, can create more transient and manageable air quality impacts relative to larger fires where such management strategies are not used or feasible.

1. Introduction

In the United States, air quality has improved dramatically over the past four decades because of federal rules limiting emissions [1]. However, wildfires contribute to high levels of air pollution and visibility impairment in the West, threatening to undo these air quality improvements [2]. Furthermore, they are expected to increase in frequency, size, and severity as the climate continues to change [3,4]. Smoke from wildland fires is a complex mixture that often varies spatially and temporally, and fine particulate matter (PM2.5) has been identified as the best single indicator of human health impacts [5,6,7]. Epidemiological studies have associated wildland fire-specific PM2.5 with an increased risk of respiratory morbidity in the elderly subpopulation in the West [8]. Given the association between wildland fire smoke and public health [9,10], land management and regulatory agencies have increasingly important roles in maintaining both healthy ecological systems and human health, requiring a clear understanding of the impact of fire management on air quality.
A key challenge in aligning fire management strategies with public health is to assess tradeoffs among a suite of fire management approaches for unplanned ignitions, which include full suppression, confine/contain strategies, manage with burning, and monitoring. These approaches are not mutually exclusive and are sometimes used in tandem at specific points. Recent research suggests that ecologically beneficial fire can be a critical tool for mitigating extreme wildfires [11], and that full suppression fire tactics do not reduce smoke exposure [12]. Although consensus is growing that ecologically beneficial fire reduces long-term smoke impacts compared to full suppression only tactics, there is debate about the efficacy for air quality benefits of adding fire to an existing unplanned ignition under favorable dispersion conditions; this is colloquially known as the ‘push–pull’ strategy. Long et al., 2017 [13] found that ‘push–pull’ tactics can reduce exposure to smoke. However, a case study of two comparable fires, one with a high level of manipulation and one without, found a reduction in emissions from the manipulation, but the manipulation did not subsequently limit smoke exposure [14]. Air quality impacts from smoke can be assessed through compliance standards; Schweizer et al., 2017 used the U.S. Environmental Protection Agency (EPA) National Ambient Air Quality Standards (NAAQS) 24 h PM2.5 standard (35 μg/m3) to provide a broad evaluation of smoke impacts when comparing ecologically beneficial fire versus other fire management strategies [15,16].
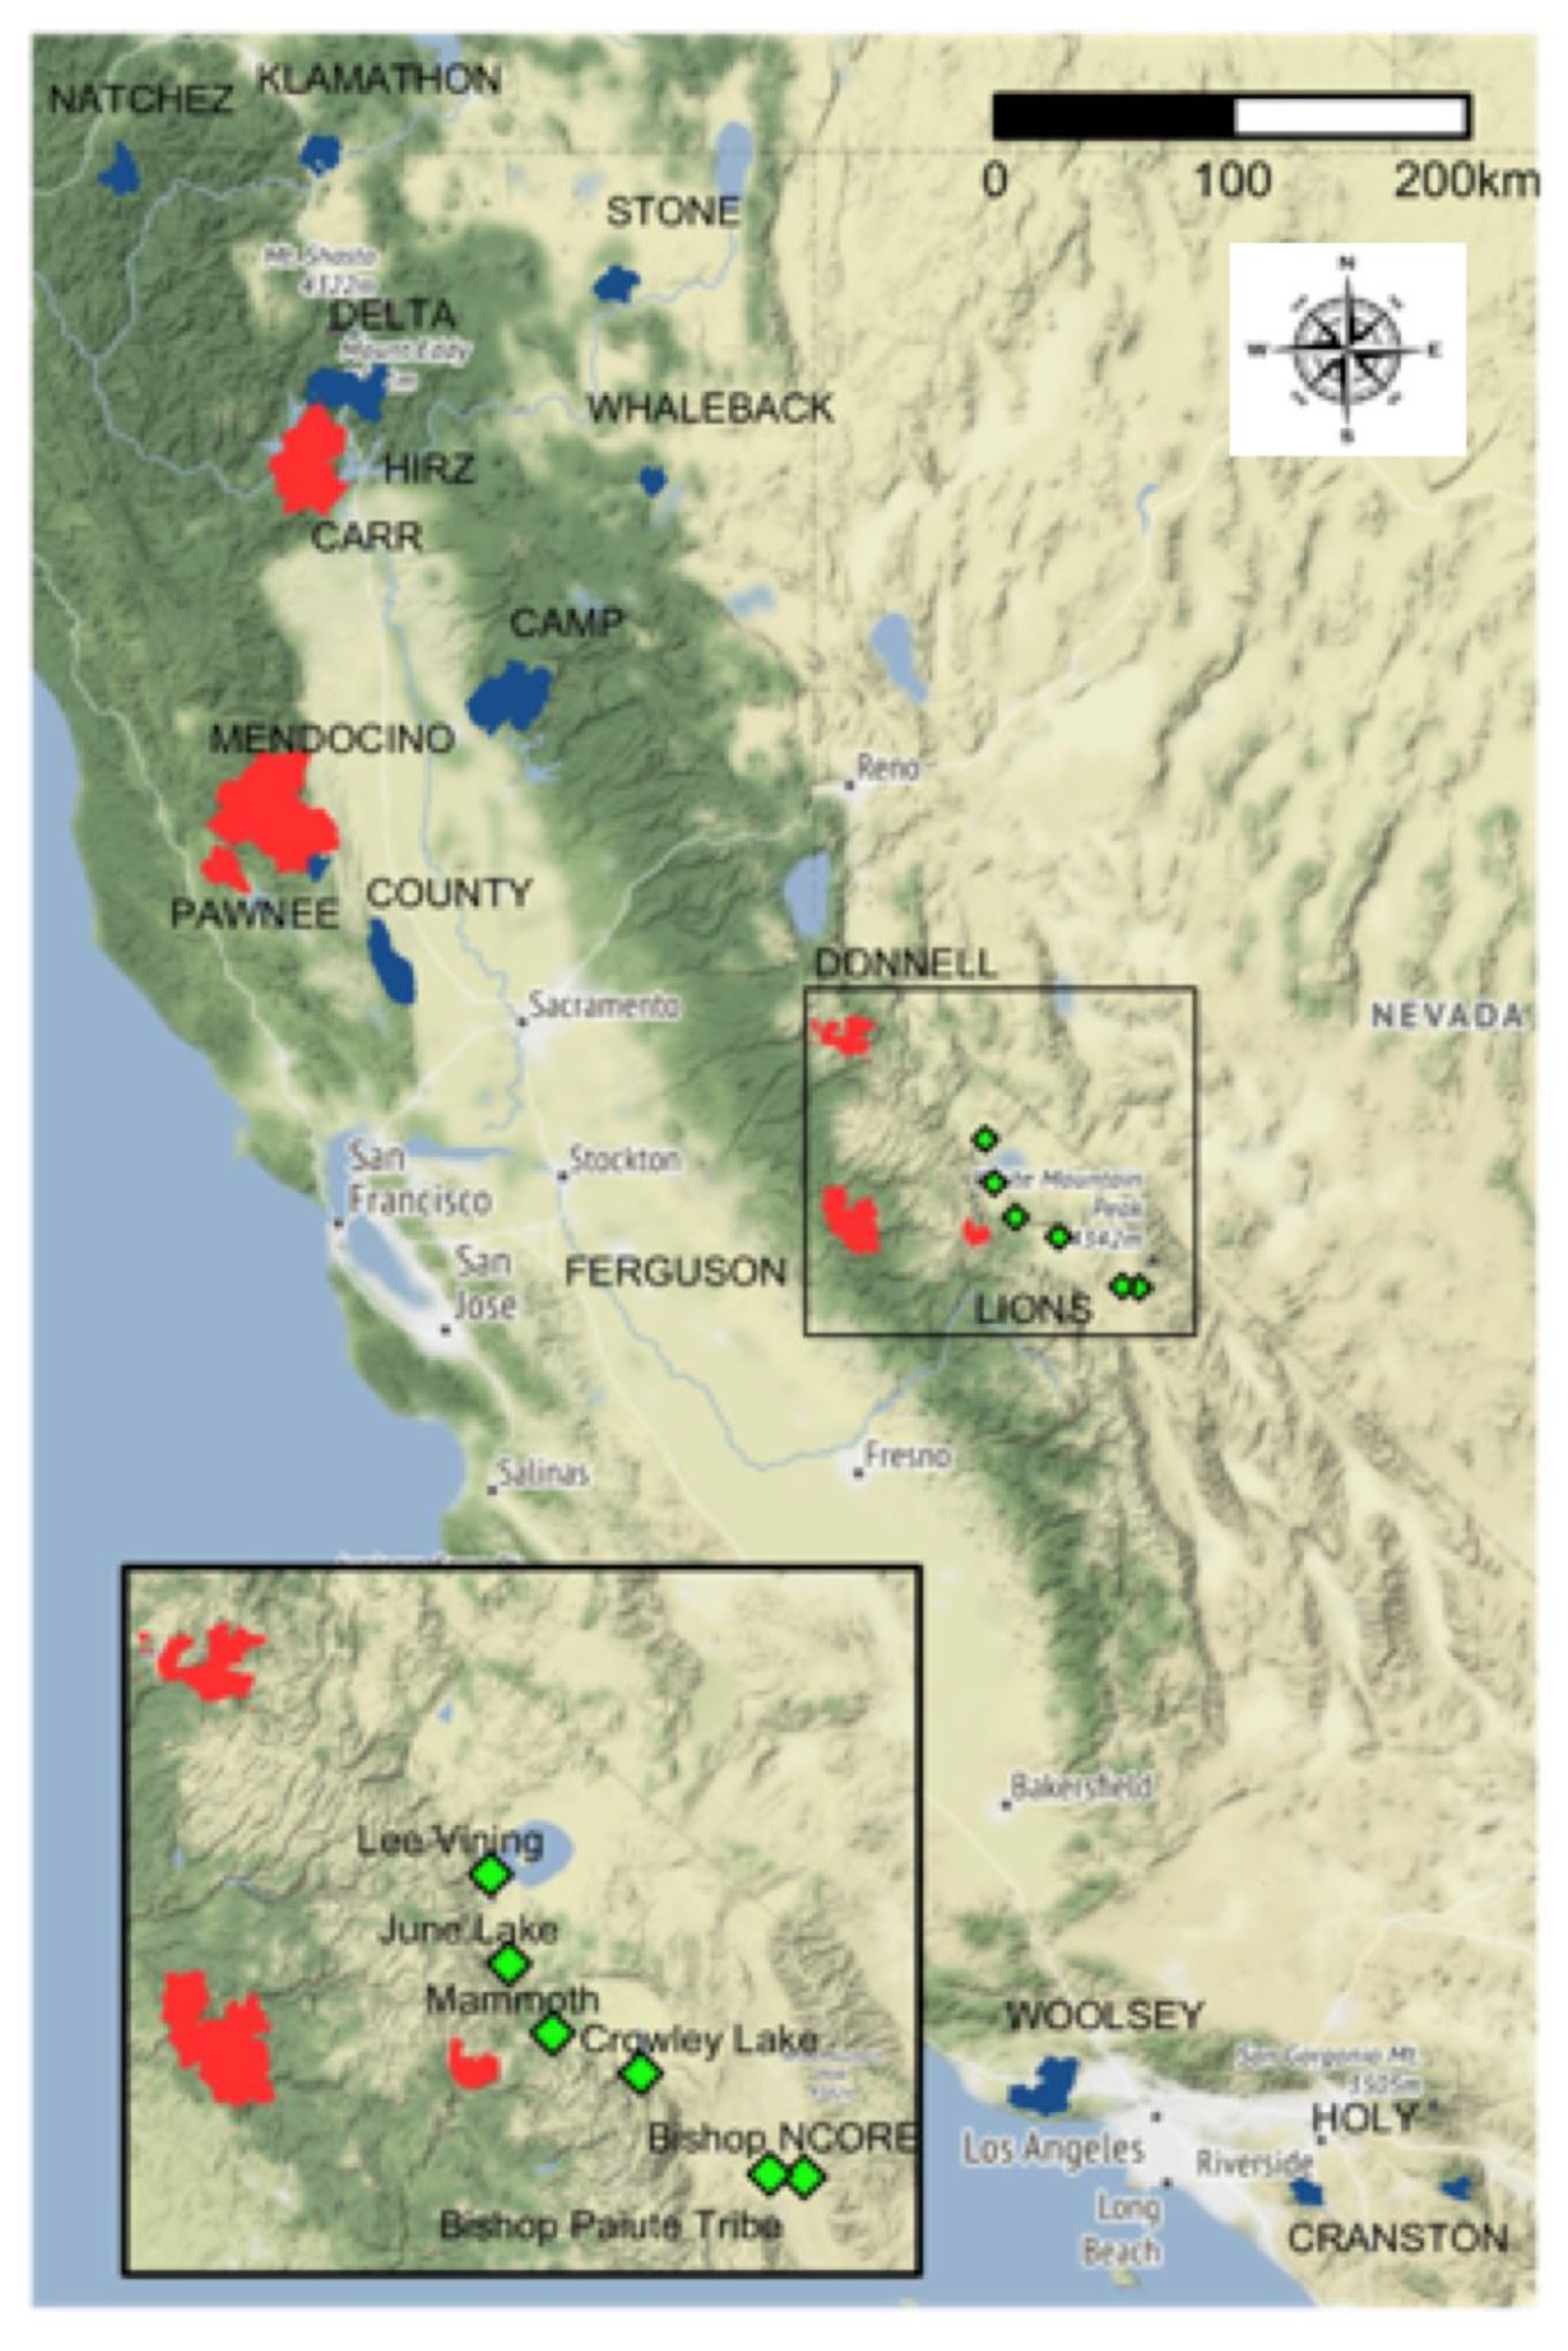
The summer of 2018 saw some of the most intense and longest-lasting smoke impacts ever observed on the eastern side of the Sierra Nevada in California (Figure 1), with many days in the Unhealthy and Very Unhealthy EPA Air Quality Index (AQI) categories. These impacts were anecdotally ascribed to the most proximal wildfire, the Lions Fire. However, there were several simultaneous, large wildfires burning in heavy fuels in the Sierra Nevada to the north, south, and west of regional air quality monitoring sites (Figure 2). For some periods of summer 2018, the Lions Fire was managed for multiple objectives, including resource benefits, while full suppression tactics were mainly used for other large California wildfires. For many days, visible satellite imagery showed that smoke emissions and transport from some of the more distant fires were potentially influencing these Eastern Sierra air quality monitoring sites (Figure 1).
Emission calculations are a first step in identifying the potential influence of smoke; however, simply calculating emissions does not indicate the relative contribution of one fire versus another, because dispersion often matters more than absolute emissions in determining concentration at a given site [13]. Furthermore, the fate and transport of emitted pollutants from a given fire often varies widely on a daily or even hourly basis, requiring a high temporal resolution estimate of both emissions and dispersion efficiency. The Eastern Sierra has both a mountain barrier and the steepest orographic gradient in the contiguous United States [17]. Generally, thermally driven valley winds blow up-valley during the daytime and down-valley during the nighttime, with prevailing northwesterly ground-level winds [18]. Saide et al., 2015 [19] found that nocturnal emissions are underestimated compared to typical diurnal profiles in most modeling systems, especially in California [20,21].
The purpose of this study is to examine the relative contributions, or apportionments, of multiple simultaneous wildfires to air quality in Eastern Sierra, California, in the summer of 2018, as measured by magnitude of PM2.5 by day at several monitoring sites. This study utilizes novel remote sensing techniques to define fire activity and allocate emissions diurnally to then explicitly model wildland fire smoke transport and dispersion. This technique provides a useful method to predict and evaluate the tradeoffs between fire emissions and fuel management strategies. The improved emission estimates will be applied to a relevant case study, where wildland fire PM2.5 impacts are estimated from several simultaneous sources using in situ monitoring data (Figure 2). A detailed analysis grounded in a case study within a single region could provide useful insights for broader operational smoke management strategies. We hypothesized that, although the Lions Fire was the closest fire to the Eastern Sierra monitoring sites, multiple fires also affected monitored air quality.

2. Methods

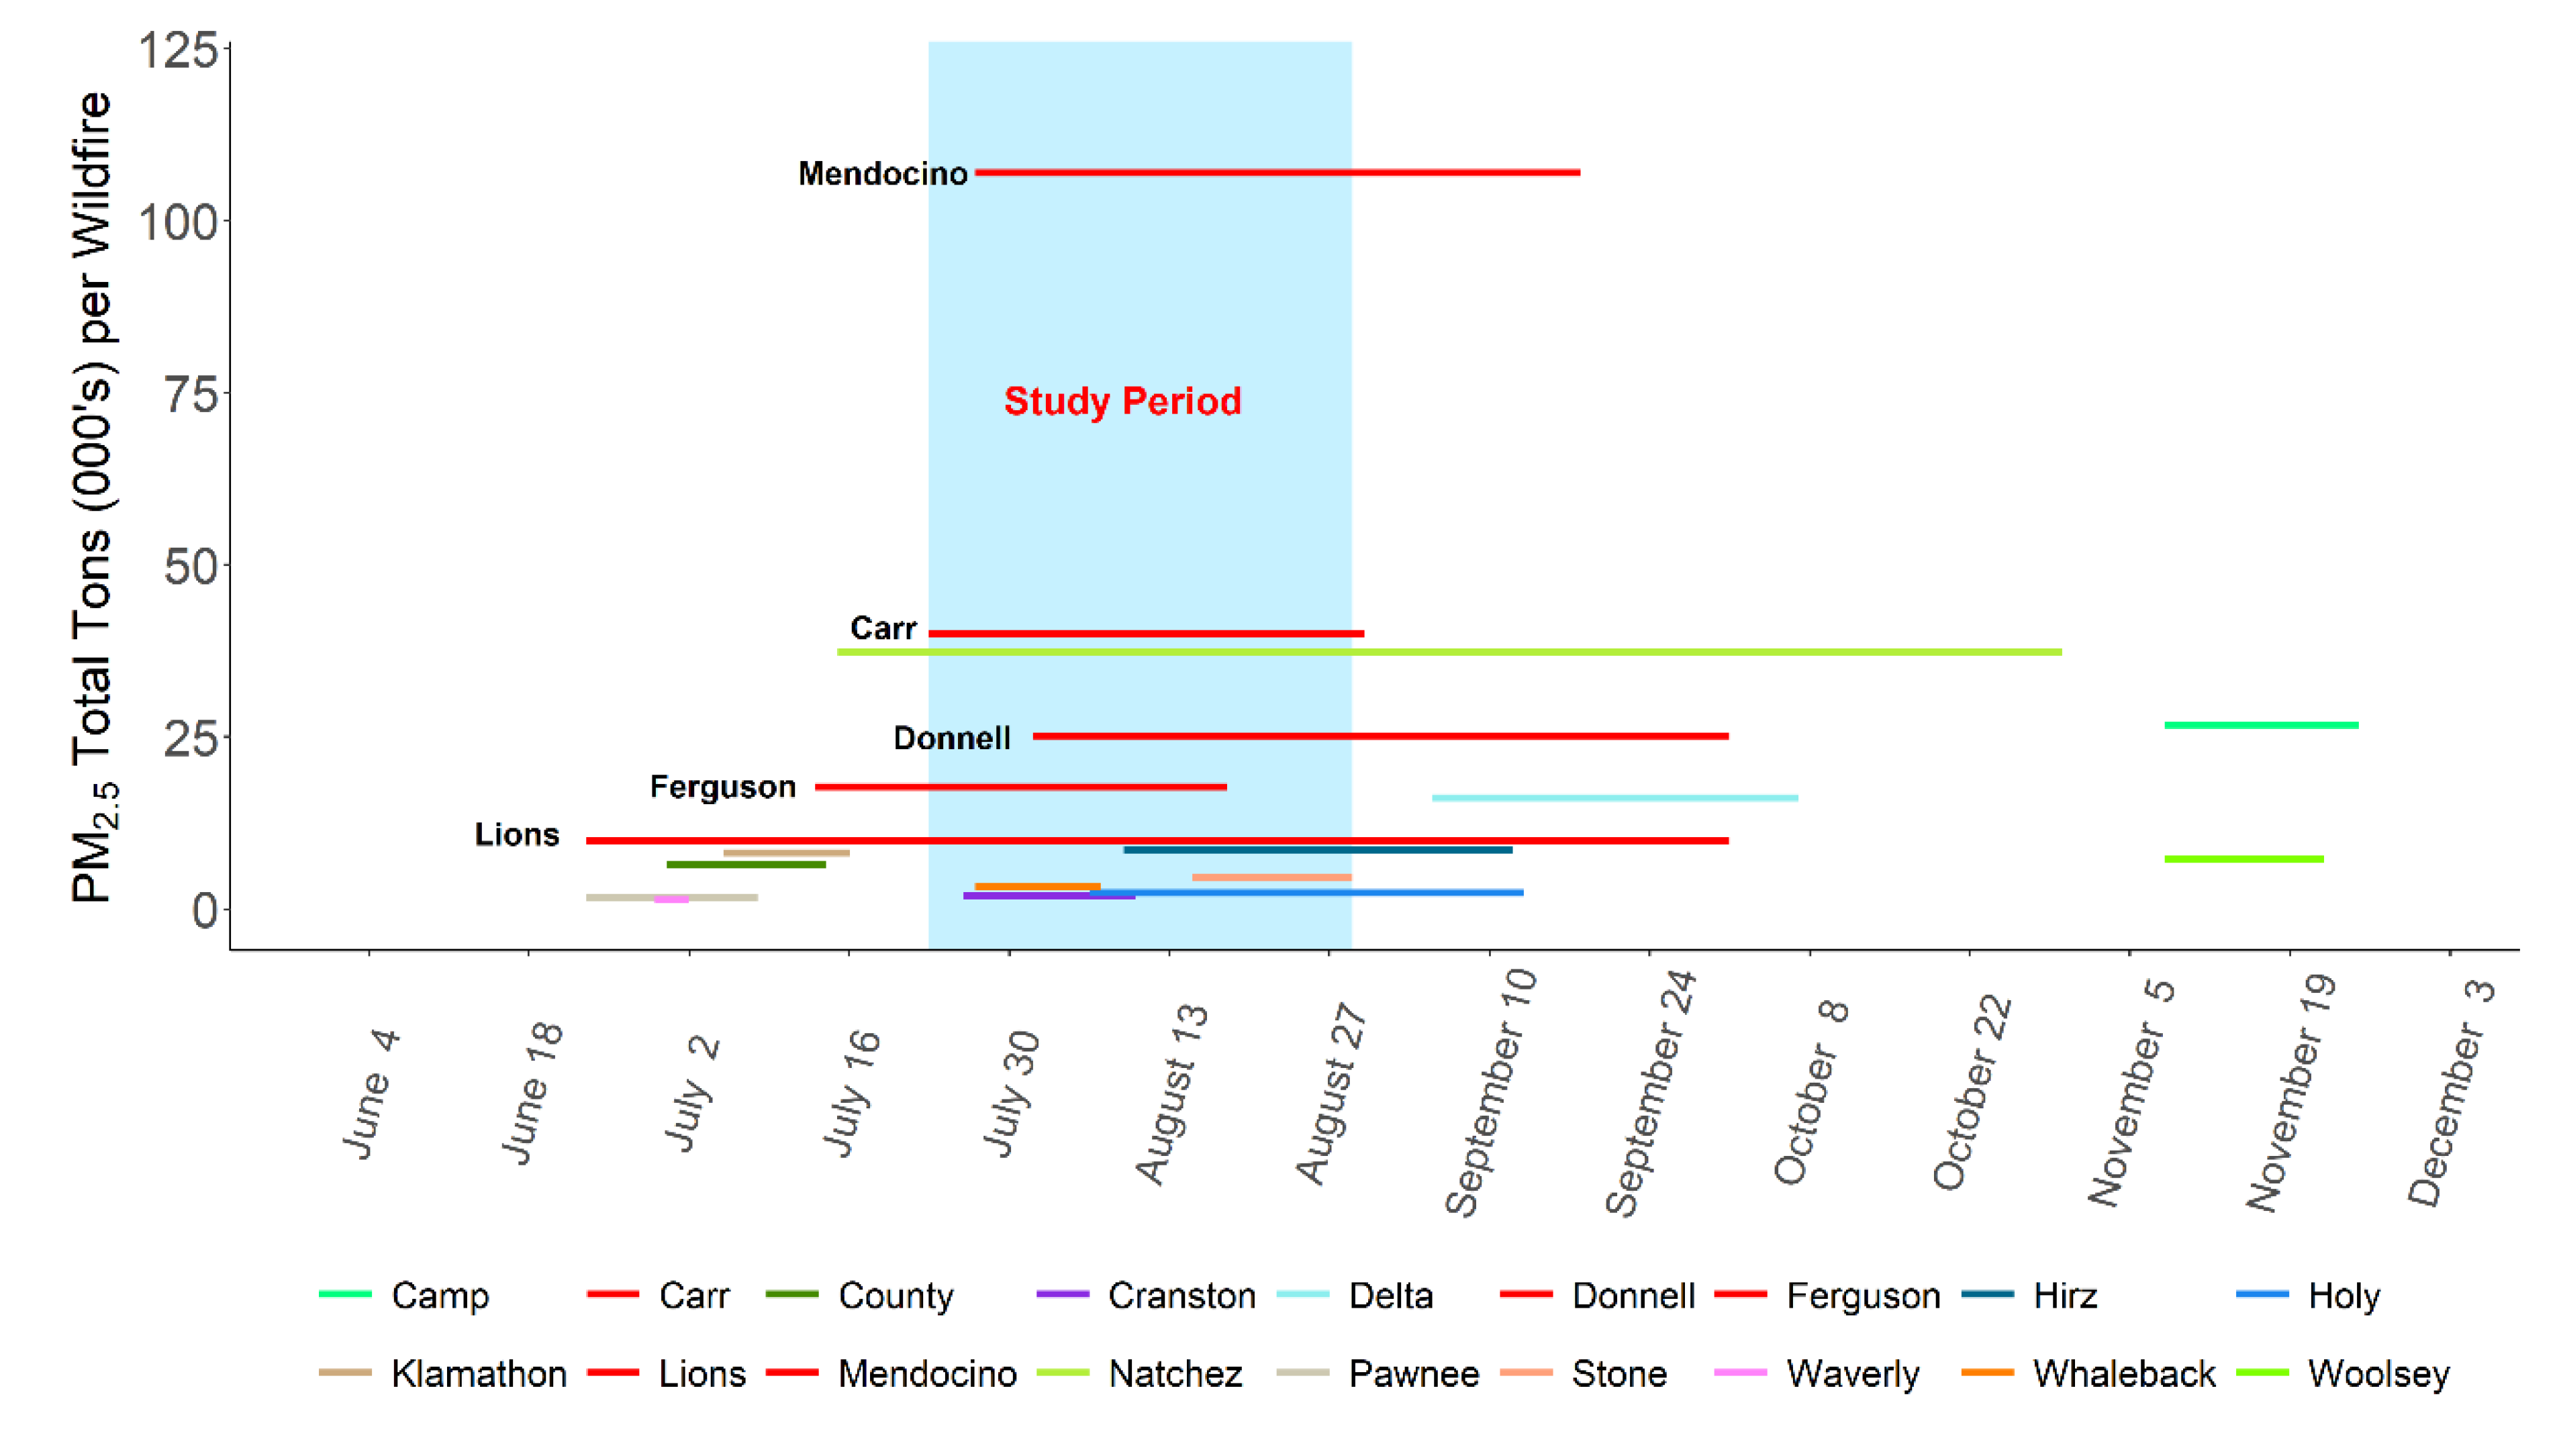
Unprecedented PM2.5 concentrations were observed in the eastern Sierra Nevada in July and August 2018. Several permanent and temporary air quality monitoring stations recorded multiple days at or above Unhealthy levels (≥55.5 μg/m3), as measured by the 24 h EPA AQI. Monitored data were analyzed from 23 July through 29 August 2018to coincide with the most severe PM2.5 episodes (Figure 3). Smoke impacts were assessed on a relative basis between monitors and between fires throughout the study period, as well as on a subset of consecutive high-impact days to assess both cumulative contributions and contributions on the worst air quality days. The relative apportionment of smoke concentrations approach used in this study is not intended nor appropriate for regulatory compliance purposes for several reasons: comparing between the Federal Reference Method (FRM) and non-FRM monitors and using modeled data present challenges to directly assessing smoke impacts in the context of NAAQS. However, to help assess the relative smoke impacts between fires and between monitoring sites, we defined a Threshold of Concern (TOC) as a modeled value of > 35 μg/m3.
The study area included large wildland fires throughout California and used air quality monitors within Mono and Inyo Counties, California, in Eastern Sierra. Hourly and daily average concentrations of PM2.5 were downloaded in R 4.0.0 [22] using the PWFSLSmoke Package [23], which compiles air quality monitoring data from a combination of sources. Data were available from 12 permanent and temporary monitors within Mono and Inyo Counties. Six monitors were excluded from analysis because of insufficient data during the study dates. Six monitoring sites were selected for analysis: Bishop NCORE (Site ID: 060270002), Bishop Paiute Tribe (Site ID: 060271023), Crowley Lake (Site ID: lon_.118.742_lat_37.567_usfs.1055), June Lake (Site ID: MMGBU1000_01), Lee Vining (Site ID: 060510005), and Mammoth (Site ID: 060510001).
Five fires—the Lions, Ferguson, Mendocino Complex, Carr, and Donnell Fires—were selected for analysis, because their fire activity coincided with the observed period of high levels of PM2.5 monitored in the study area. Fire activity and emissions data were obtained from an existing dataset that used GOES-16 satellite fire detections [24] and the BlueSky smoke modeling framework (BSF; [25]).
The GOES-16 5-minute Fire Detection and Characterization (FDC) product was used to report both individual fire detections per pixel and estimated emissions. The FDC provides observations of Fire Radiative Power (FRP) at 5-minute intervals at a 2 km resolution at nadir (3–4 km in California). FRP estimates were aggregated to produce hourly fire activity per pixel. Daily emission estimates were calculated for each pixel location using BSF, which relies on mapped fuel loadings from the Fuel Characteristic Classification System (FCCS; [26]) and the CONSUME fuel consumption model [27]. Daily acres burned was calculated using the final GEOMAC fire perimeter scaled to a daily basis by the GOES-16 fire activity. These daily estimates of per-pixel fire emissions were then allocated to the hourly time profile derived from the GOES-16 FDC product. This approach had been applied to the eighteen 2018 California wildfires of more than 12,000 acres and is best suited to larger wildfires due to the spatial resolution of the FDC product. For fires of less than 12,000 acres, we used MODIS and VIIRS fire detection data [28]. The Lions Fire burned approximately 13,000 acres; therefore, we used both approaches: we investigated the VIIRS/MODIS dataset, and we augmented the GOES-16 detections with fire locations from MODIS/VIIRS on days that GOES-16 did not detect fire activity.
Using these data, we modeled near-surface 1 h PM2.5 concentration (μg/m3) using the HYSPLIT [29] model at a 2 km resolution using Weather Research Forecast (WRF) meteorology from the Desert Research Institute (DRI) operational meteorological forecasting system [30]. Dispersion was modeled for each of the five fires, and 24 h average PM2.5 concentration was recorded from the second-highest pixel within a 5 km radius of each of the six monitoring sites. The smoke contribution per fire was determined by taking the modeled fractions and multiplying by the observed PM2.5 value. Smoke model performance in terms of the Pearson correlation ranged from 0.34 at Crowley Lake to 0.72 at Mammoth, similar to results of other studies [31,32].

3. Results

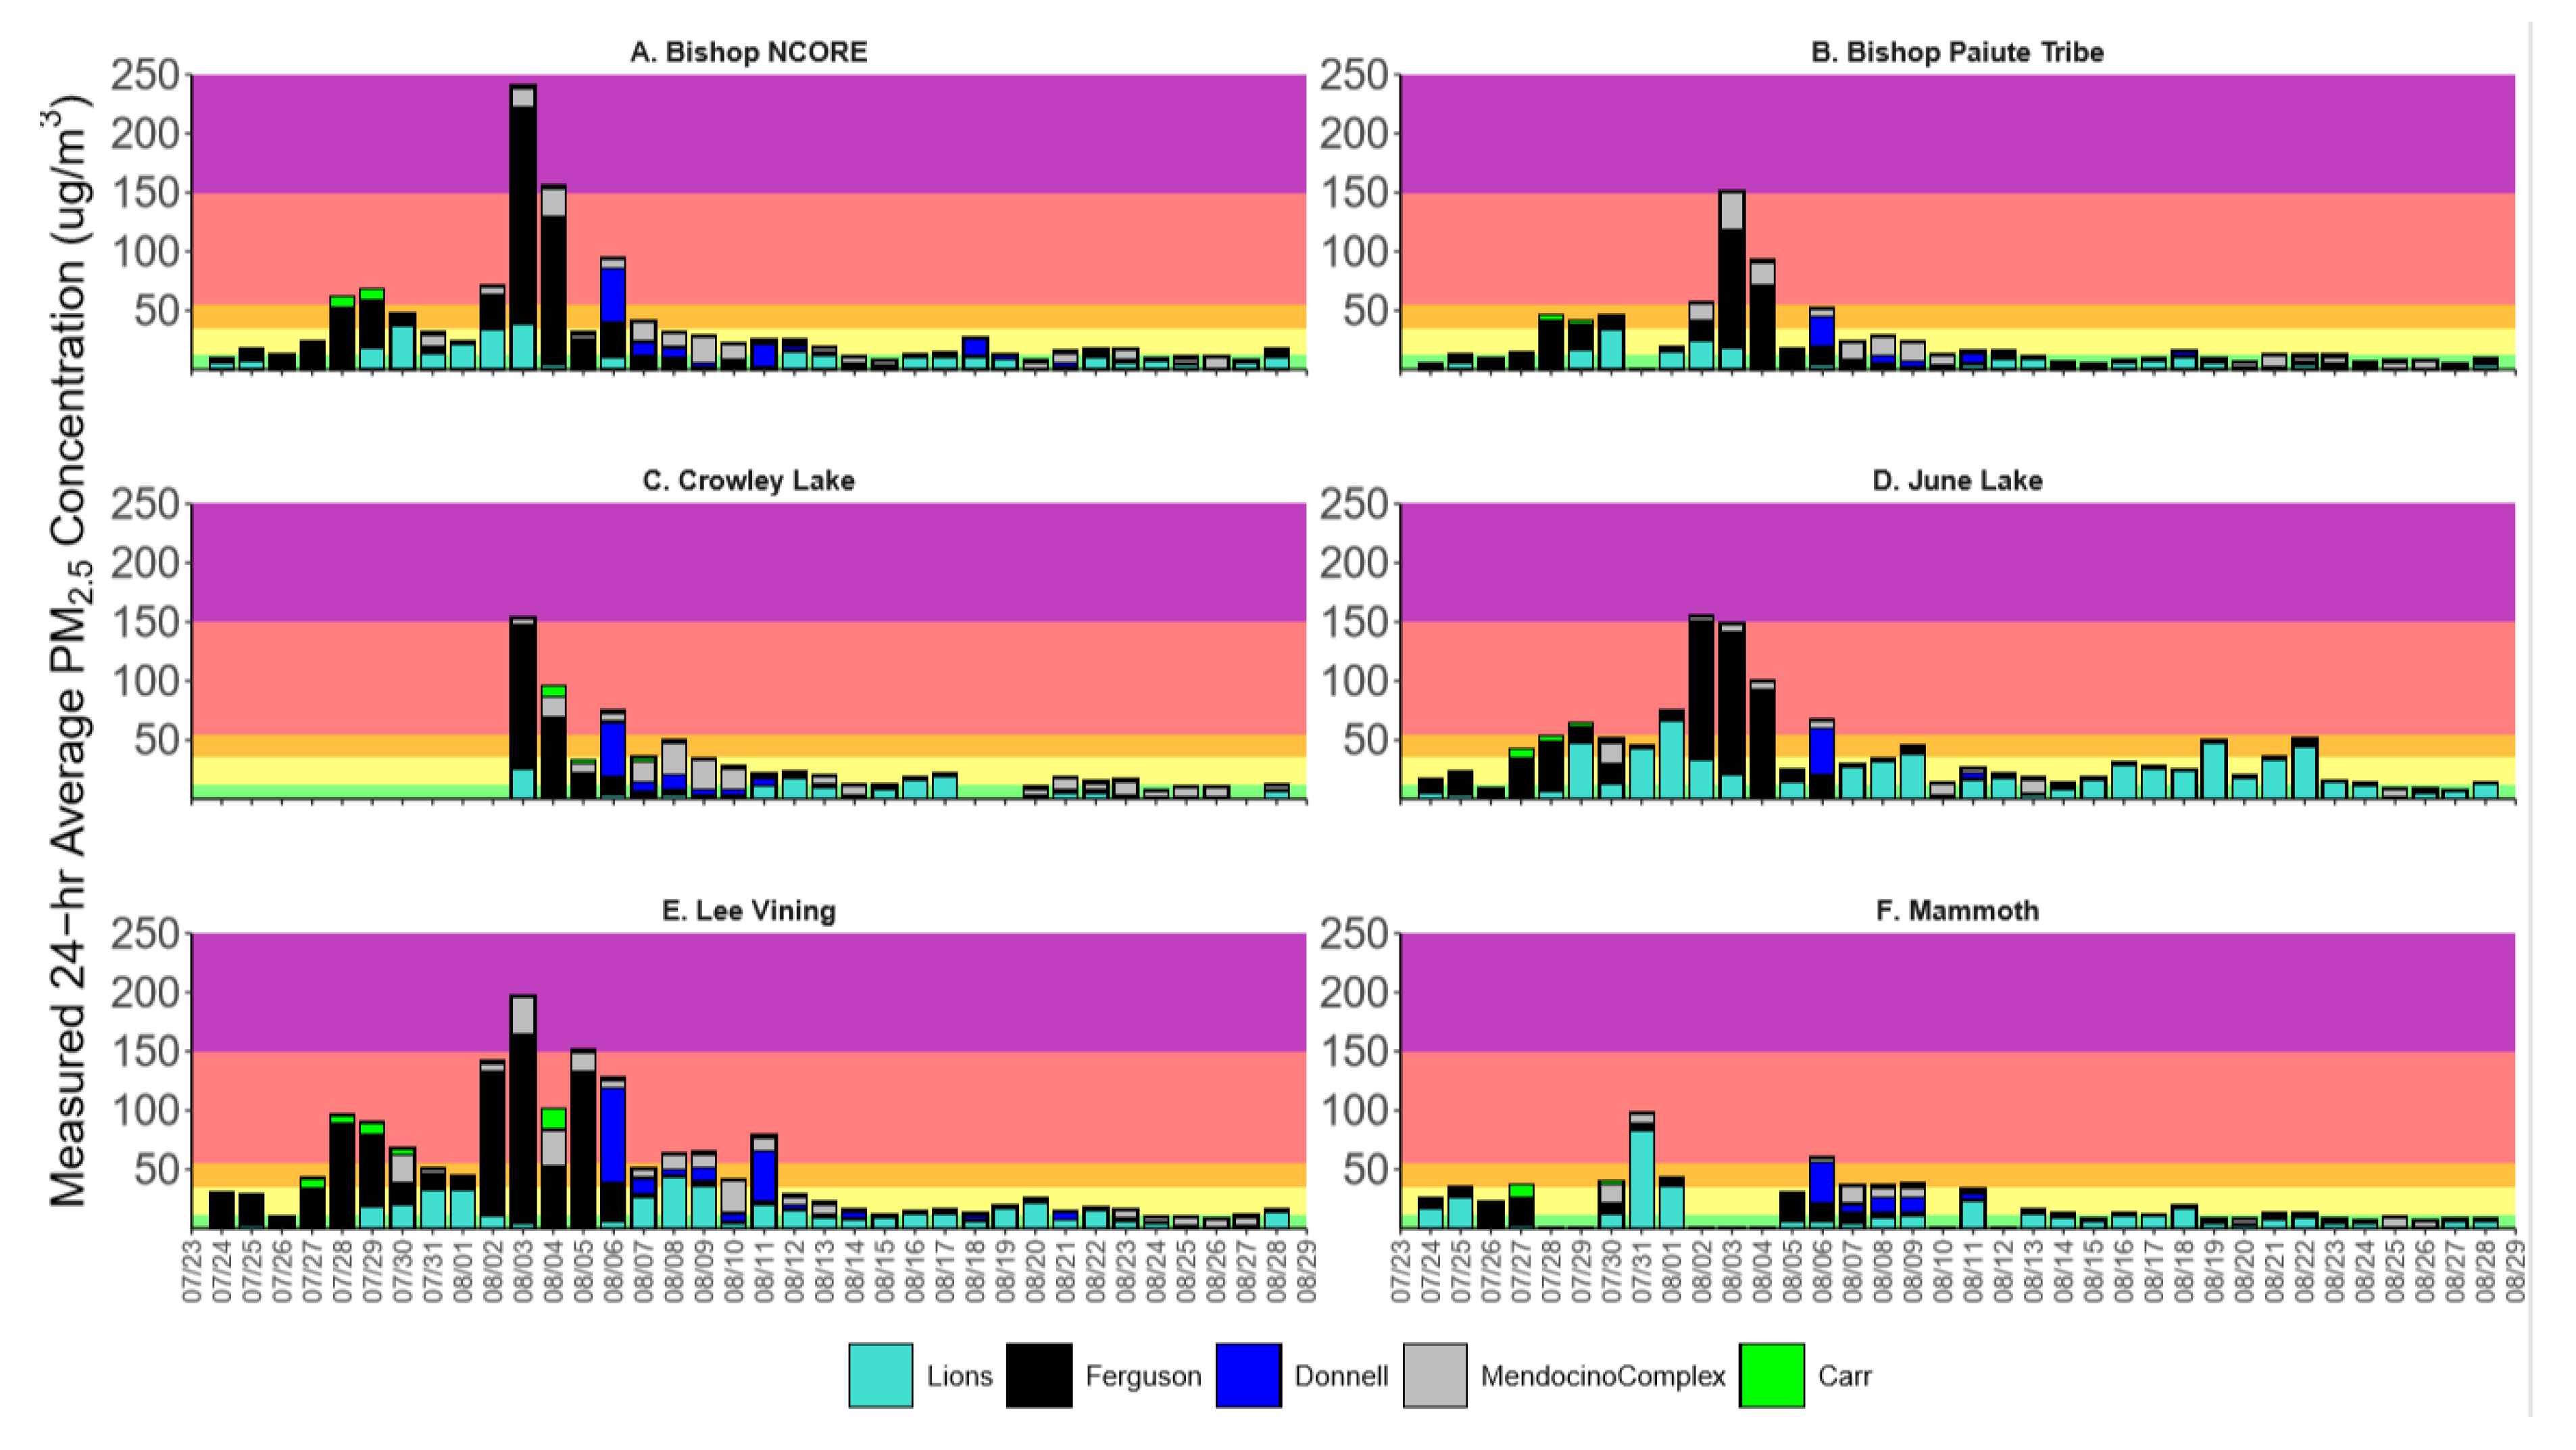
Figure 4 and Table 1 show the PM2.5 apportionment per fire per day at the six Eastern Sierra Nevada monitoring sites. Overall, the six Eastern Sierra air quality monitoring sites showed similar patterns in source apportionment and magnitudes of PM2.5 throughout the study period. Bishop NCORE had the single highest 24 h monitored PM2.5 concentration and Lee Vining had the most prolonged smoke episode: 2 August through 6 August showed monitored PM2.5 concentrations at or exceeding the Unhealthy AQI. Both recordings were driven by the combined influence of multiple distant fires, not the Lions Fire, which was the closest. The Lions Fire contributed relatively less to monitored PM2.5 concentrations than the combined influence of the other four fires, and its contribution was most notable at the Mammoth and June Lake monitoring sites. The Donnell Fire had its most significant PM2.5 impact across all monitoring stations on only one day (8 June 2018).
Modeled source apportionment of total monitored PM2.5 throughout the study period was attributed mainly to a combined influence of the Ferguson (38%), Lions (33%), and Mendocino Complex (17%) fires. The Carr and Donnell fires together minimally contributed to total monitored smoke throughout the study period (combined less than 15%). The Lions Fire had 16 site-days where modeled data apportioned PM2.5 concentrations at or above the TOC, referred to as TOC-days, with half of these site-days occurring at the June Lake monitoring site. All other fires individually contributed to 25 TOC-days (Ferguson 19 site-days, Donnell 6 site-days). The Lions Fire TOC-days were mainly in the Unhealthy for Sensitive Groups (USG, average PM2.5 on TOC-days 43.9 μg/m3) range, while the Ferguson Fire TOC-days were mainly in the Unhealthy (average PM2.5 on TOC-days 92.5 μg/m3) range. The Lions Fire TOC-days occurred intermittently throughout the study period while the Ferguson exceedances were concentrated during the high impact smoke period in early August. Although the Carr Fire alone never contributed to a TOC-day, the Donnell Fire alone would have exceeded the TOC on six separate occasions, with the highest single day 24 h average PM2.5 concentration of 80 μg/m3 at Lee Vining. However, outside of the 6 August impacts from the Donnell Fire, neither the Carr nor Donnell fires were large sources of wildland fire PM2.5 in the Eastern Sierras.
Monitoring data showed similar patterns of PM2.5 concentrations across all six Eastern Sierra sites. The highest observed 24 h average PM2.5 concentration occurred on 3 August for four of the six sites; of the four sites on 3 August, the Bishop NCORE monitor had the highest monitored concentration (~250 μg/m3), and the modeling apportioned that mainly to the Ferguson Fire (182 μg/m3), with smaller contributions from the Lions (39 μg/m3) and Mendocino Complex fires (19 μg/m3). Also on this day, emissions from the Ferguson and Lions fires each resulted in PM2.5 concentrations greater than the modeled TOC. The June Lake monitor had the highest number of TOC-days, 13; the average daily PM2.5 contribution per fire during these smoke episodes was mainly from the Ferguson (92 μg/m3), Lions (45 μg/m3), and Donnell (40 μg/m3) Fires. Mammoth, the monitoring site closest to the Lions Fire (~15 km), missed several key days of data. However, the Lions Fire was the primary source of fire PM2.5 throughout the study period (average daily PM2.5 contribution 10 μg/m3), although its contribution exceeded the TOC on only one day. June Lake, the second-closest monitoring site to the Lions Fire (~24 km), showed consistent impacts from both the Lions (19 μg/m3 daily average PM2.5 contribution) and Ferguson (14 μg/m3 daily average PM2.5 contribution) Fires.
The highest monitored smoke impacts across all six air quality monitors occurred during 2–4 August 2018, where five of the six monitors reported PM2.5 concentrations in the Very Unhealthy AQI range. The Mammoth monitoring site missed several days of data from this key early August smoke episode period. During this period of high-impact smoke concentrations, the Ferguson Fire contributed the highest average apportionment of PM2.5 across all Eastern Sierra monitors (80 μg/m3), followed by the Mendocino Complex Fire (14 μg/m3) and the Lions Fire (13 μg/m3). The Lions Fire alone only had one TOC-day (June Lake, 1 August); on the other hand, the Ferguson Fire alone had 12 TOC-days during this high-impact period. During this period, the monitors closest to the Lions Fire were not the most affected by the fire: the highest average PM2.5 contribution across all Eastern Sierra monitoring sites was apportioned to the Ferguson Fire.

4. Discussion

This analysis explored the spatial and temporal patterns in monitored PM2.5 concentrations at six air quality monitoring sites in Eastern Sierra, California, and apportioned smoke impacts between five simultaneous large wildfires. The results support our hypothesis that several large fires contributed to the poor air quality according to the Eastern Sierra monitors. The pattern of relatively more transient smoke impacts from the Lions Fire, which at times was managed for resource benefit, concurs with previous studies of smoke impacts when resource objectives are the primary fire management strategies [13,14]. Such strategies align with air quality goals, because resource objectives require the kind of moderate fire behavior and slow growth that limit daily emissions, and limited daily emissions often result in limited smoke impacts downwind in all but the most direct or unfavorable dispersion scenarios. Although relatively more transient when viewed across all Eastern Sierra monitoring sites within the study period, the Lions Fire impacts were more intense at the June Lake site (one of the sites closest to the fire). This is important for future operational fire and smoke management activities in the Lions Fire vicinity.
This study reinforces that neither proximity to fires nor emissions from fires are alone sufficient to understand and predict smoke impacts. Dispersion and modeling, especially in the context of multiple, interacting fire plumes, are also necessary [13] to disentangle sources and their relative importance. For example, the fire located farthest from the Eastern Sierra air quality monitoring sites (Carr) did not significantly contribute to the smoke concentrations (it alone never exceeded NAAQS). However, the Mendocino Complex Fire, the second furthest fire from the Eastern Sierra monitoring sites, contributed near equal proportions of smoke as the Lions Fire during the highest-impact days, even though the estimated emissions for Lions Fire were nearly an order of magnitude lower.
The strengths of this study include (1) the use of in situ air monitoring data representative of the region and (2) the strength of the relationship between monitored and modeled emissions. Remotely sensed fire detections provided a temporally precise diurnal allocation of emissions, and combined with dispersion modeling, created a hybrid approach for improving apportionment of PM2.5 across multiple fires. These results, however, are subject to several limitations, most notably, the closest monitor to the Lions Fire, the Mammoth site, lacked data from several key dates during the period of greatest smoke impact, and the incomplete data do not allow a robust analysis of smoke apportionment. Although this incomplete dataset apportions the majority of PM2.5 to the Lions Fire, we speculate that, if the Mammoth monitor mirrored the patterns observed across the other five monitoring sites, the Ferguson and Mendocino Complex Fires would probably have been influencers. This does not change our conclusion that the Lions Fire had less of an impact on Eastern Sierra air quality than did the combined influence of multiple distant fires. Additionally, although the Lions Fire smoke impacts are typical of other resource objective fires, further assessments of the impacts of resource objective fires can help this paper’s results, which are specific to a case study, become more widely applicable outside of the Eastern Sierra Nevada.
The modeled emissions tended to underestimate PM2.5 relative to the monitored values, probably because of fuel heterogeneity [33], plume injection height [34], and wind field bias/errors [35]. Uncertainty and natural variability in all these components ranged from a factor of two to an order of magnitude impact on modeled PM2.5 concentrations. We adjusted (increased) modeled PM2.5 values to account for other background sources of PM2.5 (e.g., dust, mobile, and residential sources) by 7 μg/m3; this yielded an optimal comparison between modeled and observed data, with 65% of the modeled/observed data pairs within a factor of two of each other. The remaining 35% of differences were approximately equally split between model under- and overestimation. Several efforts have been made to improve source attribution of PM2.5 and wildland fire PM2.5 [36], using photochemical modeling approaches. Huang et al., 2020 [37] combined CMAQ with HYSPLIT dispersion modeling to apportion smoke impacts in a computationally efficient manner. However, their focus on prescribed burn diurnal profiles may not be applicable to unplanned ignitions.

5. Conclusions

This study used novel satellite-based methods to objectively resolve and apportion impacts from multiple interacting fire plumes during a particularly intense period of smoke impacts in Eastern Sierra, California, in the summer of 2018. We explored the spatial and temporal patterns in monitored PM2.5 concentrations at six Eastern Sierra air quality monitoring sites. We apportioned impacts at each of those sites from five fires, using a combination of remote sensing and modeling tools in the BlueSky Framework. Although the Lions Fire was closest to the regional air quality monitors, our results support our original hypothesis that it had a smaller impact on Eastern Sierra air quality than the larger, more distant wildfires, which contributed the majority of the smoke. Key to that apportionment was the hybrid remote sensing of fire detection, using a more temporally precise diurnal allocation of emissions, combined with dispersion modeling. This allocation distinguished between the confounding and persistent smoke impacts of the larger, more distant, and historically large California wildfires during this intense smoke episode and the remaining smoke impacts from the local wilderness wildfire, the Lions Fire. This study showcases an approach for better elucidating the smoke-related consequences of wildfire management tactics and strategies as they evolve and adjust dynamically across time and space, by modeling and apportioning individual smoke impacts.

Author Contributions

Conceptualization, S.M. and L.T.; methodology, S.M., L.T., and S.O.; formal analysis, S.M. and S.O.; data curation, S.M. and S.O.; software, S.R.; writing—original draft preparation, S.M.; writing—review and editing, S.M., L.T., S.O., and S.R.; visualization, S.M. and S.O.; supervision, L.T.; project administration, S.M.; funding acquisition, S.O. All authors have read and agreed to the published version of the manuscript.

Funding

The NASA Health and Air Quality Applied Sciences Team (NASA grant number NNH16AD18I) supported the work of S. O’Neill and S. Raffuse creating the fire emission inventory based on VIIRS, MODIS and GOES-16 FDC fire detections.

Acknowledgments

The authors thank Patricia Loesche for providing an external review and subsequent comments and copy-editing to improve the paper. The authors also thank Amy Marsha for GIS expertise in creating figures.

Conflicts of Interest

The authors declare no conflict of interest. The funders had no role in the design of the study; in the collection, analyses, or interpretation of data; in the writing of the manuscript, or in the decision to publish the results.

References

  1. Meng, J.; Li, C.; Martin, R.V.; Donkelaar, A.; Hystad, P.; Brauer, M. Estimated long-term (1981–2016) concentrations of ambient fine particulate matter across North America from chemical transport modeling, satellite remote sensing, and ground-based measurements. Environ. Sci. Technol. 2019, 53, 5071–5079. [Google Scholar] [CrossRef] [PubMed] [Green Version]
  2. McClure, C.D.; Jaffe, D.A. U.S. particulate matter air quality improves except in wildfire-prone areas. Proc. Natl. Acad. Sci. USA 2018, 115, 7901–7906. [Google Scholar] [CrossRef] [PubMed] [Green Version]
  3. Spracklen, D.V.; Mickley, L.J.; Logan, J.A.; Hudman, R.C.; Yevich, R.; Flannigan, M.D.; Westerling, A.L. Impacts of climate change from 2000 to 2050 on wildfire activity and carbonaceous aerosol concentrations in the western United States. J. Geophys. Res. 2009, 114. [Google Scholar] [CrossRef]
  4. Westerling, A.L.; Hidalgo, H.G.; Cayan, D.R.; Swetnam, T.W. Warming and Earlier Spring Increase Western U.S. Forest Wildfire Activity. Science 2006, 313, 940–943. [Google Scholar] [CrossRef] [Green Version]
  5. Naeher, L.P.; Brauer, M.; Lipsett, M.; Zelikoff, J.T.; Simpson, C.D.; Koenig, J.Q.; Smith, K.R. Woodsmoke heath effects: A review. Inhal. Toxicol. 2007, 19, 67–106. [Google Scholar] [CrossRef]
  6. Barregard, L.; Sällsten, G.; Gustafson, P.; Andersson, L.; Johansson, L.; Basu, S.; Stigendal, L. Experimental exposure to woodsmoke particles in healthy humans: Effects on markers of inflammation, coagulation, and lipid peroxidation. Inhal. Toxicol. 2006, 18, 845–853. [Google Scholar] [CrossRef]
  7. Keywood, M.D.; Ayers, G.P.; Gras, J.L.; Gillett, R.W.; Cohen, D.D. Size distribution and sources of aerosol in Launceston, Australia, during winter 1997. J. Air Waste Manag. Assoc. 2000, 50, 418–427. [Google Scholar] [CrossRef] [Green Version]
  8. Liu, J.C.; Wilson, A.; Mickley, L.J.; Dominici, F.; Ebisu, K.; Wang, Y.; Sulprizio, M.P.; Peng, R.D.; Yue, X.; Son, J.Y.; et al. Wildfire-specific fine particulate matter and risk of hospital admissions in urban and rural counties. Epidemiology 2017, 28, 77–85. [Google Scholar] [CrossRef] [Green Version]
  9. Jaffe, D.A.; O’Neill, S.M.; Larkin, N.K.; Holder, A.L.; Peterson, D.L.; Halofsky, J.E.; Rappold, A.G. Wildfire and prescribed burning impacts on air quality in the United States. J. Air Waste Manag. Assoc. 2020, 70, 583–615. [Google Scholar] [CrossRef]
  10. Reisen, F.; Duran, S.M.; Flannigan, M.; Elliot, C.; Rideout, L. Wildife smoke and public health risk. Int. J. Wildland Fire 2015, 24, 1029–1044. [Google Scholar] [CrossRef]
  11. North, M.; Stephens, S.; Collins, B.; Agee, J.; Aplet, G.; Franklin, J.; Fulé, P. Reform forest fire management: Agency incentives undermine policy effectiveness. Science 2015, 349, 1280–1281. [Google Scholar] [CrossRef] [PubMed]
  12. Schweizer, D.; Preisler, H.K.; Cisneros, R. Assessing relative differences in smoke exposure from prescribed, managed, and full suppression wildland fire. Air Qual. Atmos. Health 2018, 12, 87–95. [Google Scholar] [CrossRef]
  13. Long, J.W.; Tarnay, L.W.; North, M.P. Aligning smoke management with ecological and public health goals. J. For. 2017, 116, 76–86. [Google Scholar] [CrossRef]
  14. Schwezier, D.; Cisneros, R.; Navarro, K. The effectiveness of adding fire for air quality benefits challenged: A case study of increased fine particulate matter from wilderness fire smoke with more active fire management. For. Ecol. Manag. 2019, 458. [Google Scholar] [CrossRef]
  15. USEPA. National Ambient Air Quality Standards (40 CFR part 50). Available online: https://www.epa.gov/criteria-air-pollutants/naaqs-table (accessed on 8 May 2020).
  16. Schwezier, D.; Cisneros, R.; Traina, S.; Ghezzehei, T.A.; Shaw, G. Using National Ambient Air Quality Standards for fine particulate matter to assess regional wildland fire smoke and air quality management. J. Environ. Manag. 2017, 201, 345–356. [Google Scholar] [CrossRef]
  17. Zhong, S.; Li, J.; Whiteman, C.D.; Bian, X.; Yao, W. Climatology of high wind events in the Owens Valley, California. Mon. Weather Rev. 2008, 136, 3536–3552. [Google Scholar] [CrossRef] [Green Version]
  18. Fujioka, F.M.; Roads, J.O.; Chen, S.C. Climatology. In Oxidant Air Pollution Impacts in the Montane Forests of Southern California. Ecological Studies (Analysis and Synthesis); Miller, P.R., McBride, J.R., Eds.; Springer: New York, NY, USA, 1999; Volume 134. [Google Scholar] [CrossRef]
  19. Saide, P.E.; Peterson, D.A.; da Silva, A.; Anderson, B.; Ziemba, L.D.; Diskin, G.; Sachse, G.; Hair, J.; Butler, C.; Fenn, M.; et al. Revealing important nocturnal and day-to-day variations in fire smoke emissions through a multiplatform inversion. Geophys. Res. Lett. 2015, 42, 3609–3618. [Google Scholar] [CrossRef] [Green Version]
  20. Li, F.; Zhang, X.; Roy, D.; Kondragunta, S. Estimation of biomass-burning emissions by fusing the fire radiative power retrievals from polar-orbiting and geostationary satellites across the conterminous United States. Atmos. Environ. 2019, 211, 274–287. [Google Scholar] [CrossRef]
  21. Mass, C.F.; Ovens, D. The northern California wildfires of 8–9 October 2017: The role of a major downslope wind event. Bull. Am. Meteor. Soc. 2019, 100, 235–256. [Google Scholar] [CrossRef]
  22. RStudio Team. RStudio: Integrated Development for R. RStudio; PBC: Boston, MA, USA, 2020; Available online: http://www.rstudio.com/ (accessed on 9 September 2020).
  23. Callahan, J.; Martin, H.; Pease, S.; Miller, H.; Dingels, Z.; Aras, R.; Hagg, J.; Kim, J.; Thompson, R.; Yang, A. PWFSLSmoke: Utilities for Working with Air Quality Monitoring Data. R Package: Version 1.2.111, 2019. The Comprehensive R Archive Network. Available online: http://cran.r-project.org/web/packages/PWFSLSmoke/index.html (accessed on 20 March 2020).
  24. O’Neill, S.M.; Raffuse, S. High temporal resolution satellite fire detection data provide important improvements in smoke forecasting for large wildfires. Eos 2020, submitted. [Google Scholar]
  25. Larkin, N.K.; O’Neill, S.M.; Solomon, R.; Raffuse, S.; Strand, T.; Sullivan, D.C.; Krull, C.; Rorig, M.; Peterson, J.; Ferguson, S.A. The BlueSky smoke modeling framework. Int. J. Wildland Fire 2009, 18, 906–920. [Google Scholar] [CrossRef] [Green Version]
  26. Ottmar, R.D.; Sandberg, D.V.; Riccardi, C.L.; Prichard, S.J. An overview of the Fuel Characteristic Classification System—Quantifying, classifying, and creating fuelbeds for resource planning. Can. J. For. Res. 2007, 37, 2383–2393. [Google Scholar] [CrossRef]
  27. Prichard, S.J.; Kennedy, M.C.; Wright, C.S.; Cronan, J.B.; Ottmar, R.D. Predicting forest floor and woody fuel consumption from prescribed burns in southern and western pine ecosystems of the United States. For. Ecol. Manag. 2017, 405, 328–338. [Google Scholar] [CrossRef] [Green Version]
  28. O’Neill, S.M.; Diao, M.; Raffuse, S.; Wilkins, J.; Al-Hamdan, M.Z.; Freedman, F.; Barik, M.; Jia, Y.; Tong, D.; Zou, Y.; et al. An inter-comparison study on PM2.5 emissions in 2017 northern California wildfires. J. Air Waste Manag. Assoc. 2020, submitted. [Google Scholar]
  29. Draxler, R.R.; Hess, G.D. An overview of the HYSPLIT_4 modelling system for trajectories, dispersion and deposition. Aust. Met. Mag. 1998, 47, 295–308. [Google Scholar]
  30. Brown, T.J.; Kahyaoglu-Koracin, J. CANSAC-CEFA Operations and Products for the California and Nevada Smoke and Air Committee. CEFA Report 07-01. 2007. Available online: http://cefa.dri.edu/Publications/publications_home.php (accessed on 27 July 2020).
  31. Wilkins, J.L.; Pouliot, G.; Foley, K.; Appel, W.; Pierce, T. The impact of US wildland fires on ozone and particulate matter: A comparison of measurements and CMAQ model predictions from 2008 to 2012. Int. J. Wildland Fire 2018, 27, 684–698. [Google Scholar] [CrossRef]
  32. Zou, Y.; O’Neill, S.M.; Larkin, N.K.; Alvarado, E.C.; Solomon, R.; Mass, C.; Liu, Y.; Odman, M.T.; Shen, H. Machine learning-based integration of high-resolution wildfire smoke simulations and observations for regional health impact assessment. Int. J. Environ. Res. Public Health 2019, 16, 2137. [Google Scholar] [CrossRef] [PubMed] [Green Version]
  33. Drury, S.A.; Larkin, N.S.; Strand, T.T.; Huang, S.; Strenfel, S.J.; Banwell, E.M.; O’Brien, T.E.; Raffuse, S.M. Intercomparison of fire size, fuel loading, fuel consumption, and smoke emissions estimates on the 2006 Tripod fire, Washington, USA. Fire Ecol. 2014, 10, 56–83. [Google Scholar] [CrossRef]
  34. Herron-Thorpe, F.L.; Mount, G.H.; Emmons, L.K.; Lamb, B.K.; Jaffe, D.A.; Wigder, N.L.; Chung, S.H.; Zhang, R.; Woelfle, M.D.; Vaughan, J.K. Air quality simulations of wildfires in the Pacific Northwest evaluated with surface and satellite observations during the summers of 2007 and 2008. Atmos. Chem. Phys. 2014, 14, 12533–12551. [Google Scholar] [CrossRef] [Green Version]
  35. Garcia-Menendez, F.; Hu, Y.T.; Odman, M.T. Simulating smoke transport from wildland fires with a regional-scale air quality model: Sensitivity to uncertain wind fields. J. Geophys. Res. Atmos. 2013, 118, 6493–6504. [Google Scholar] [CrossRef]
  36. Baker, K.; Woody, M.; Tonnesen, G.; Hutzell, B.; Pye, H.; Beaver, M.; Pouliot, G.; Pierce, T. Contribution of regional-scale fire events to ozone and PM2.5 air quality estimated by photochemical modeling approaches. In Atmospheric Environment; Elsevier Science Ltd.: New York, NY, USA, 2016; Volume 140, pp. 539–554. [Google Scholar]
  37. Huang, R.; Qin, M.; Hu, Y.; Russell, A.G.; Odman, M.T. Apportioning prescribed fire impacts on PM2.5 among individual fires through dispersion modeling. Atmos. Environ. 2020, 223. [Google Scholar] [CrossRef]
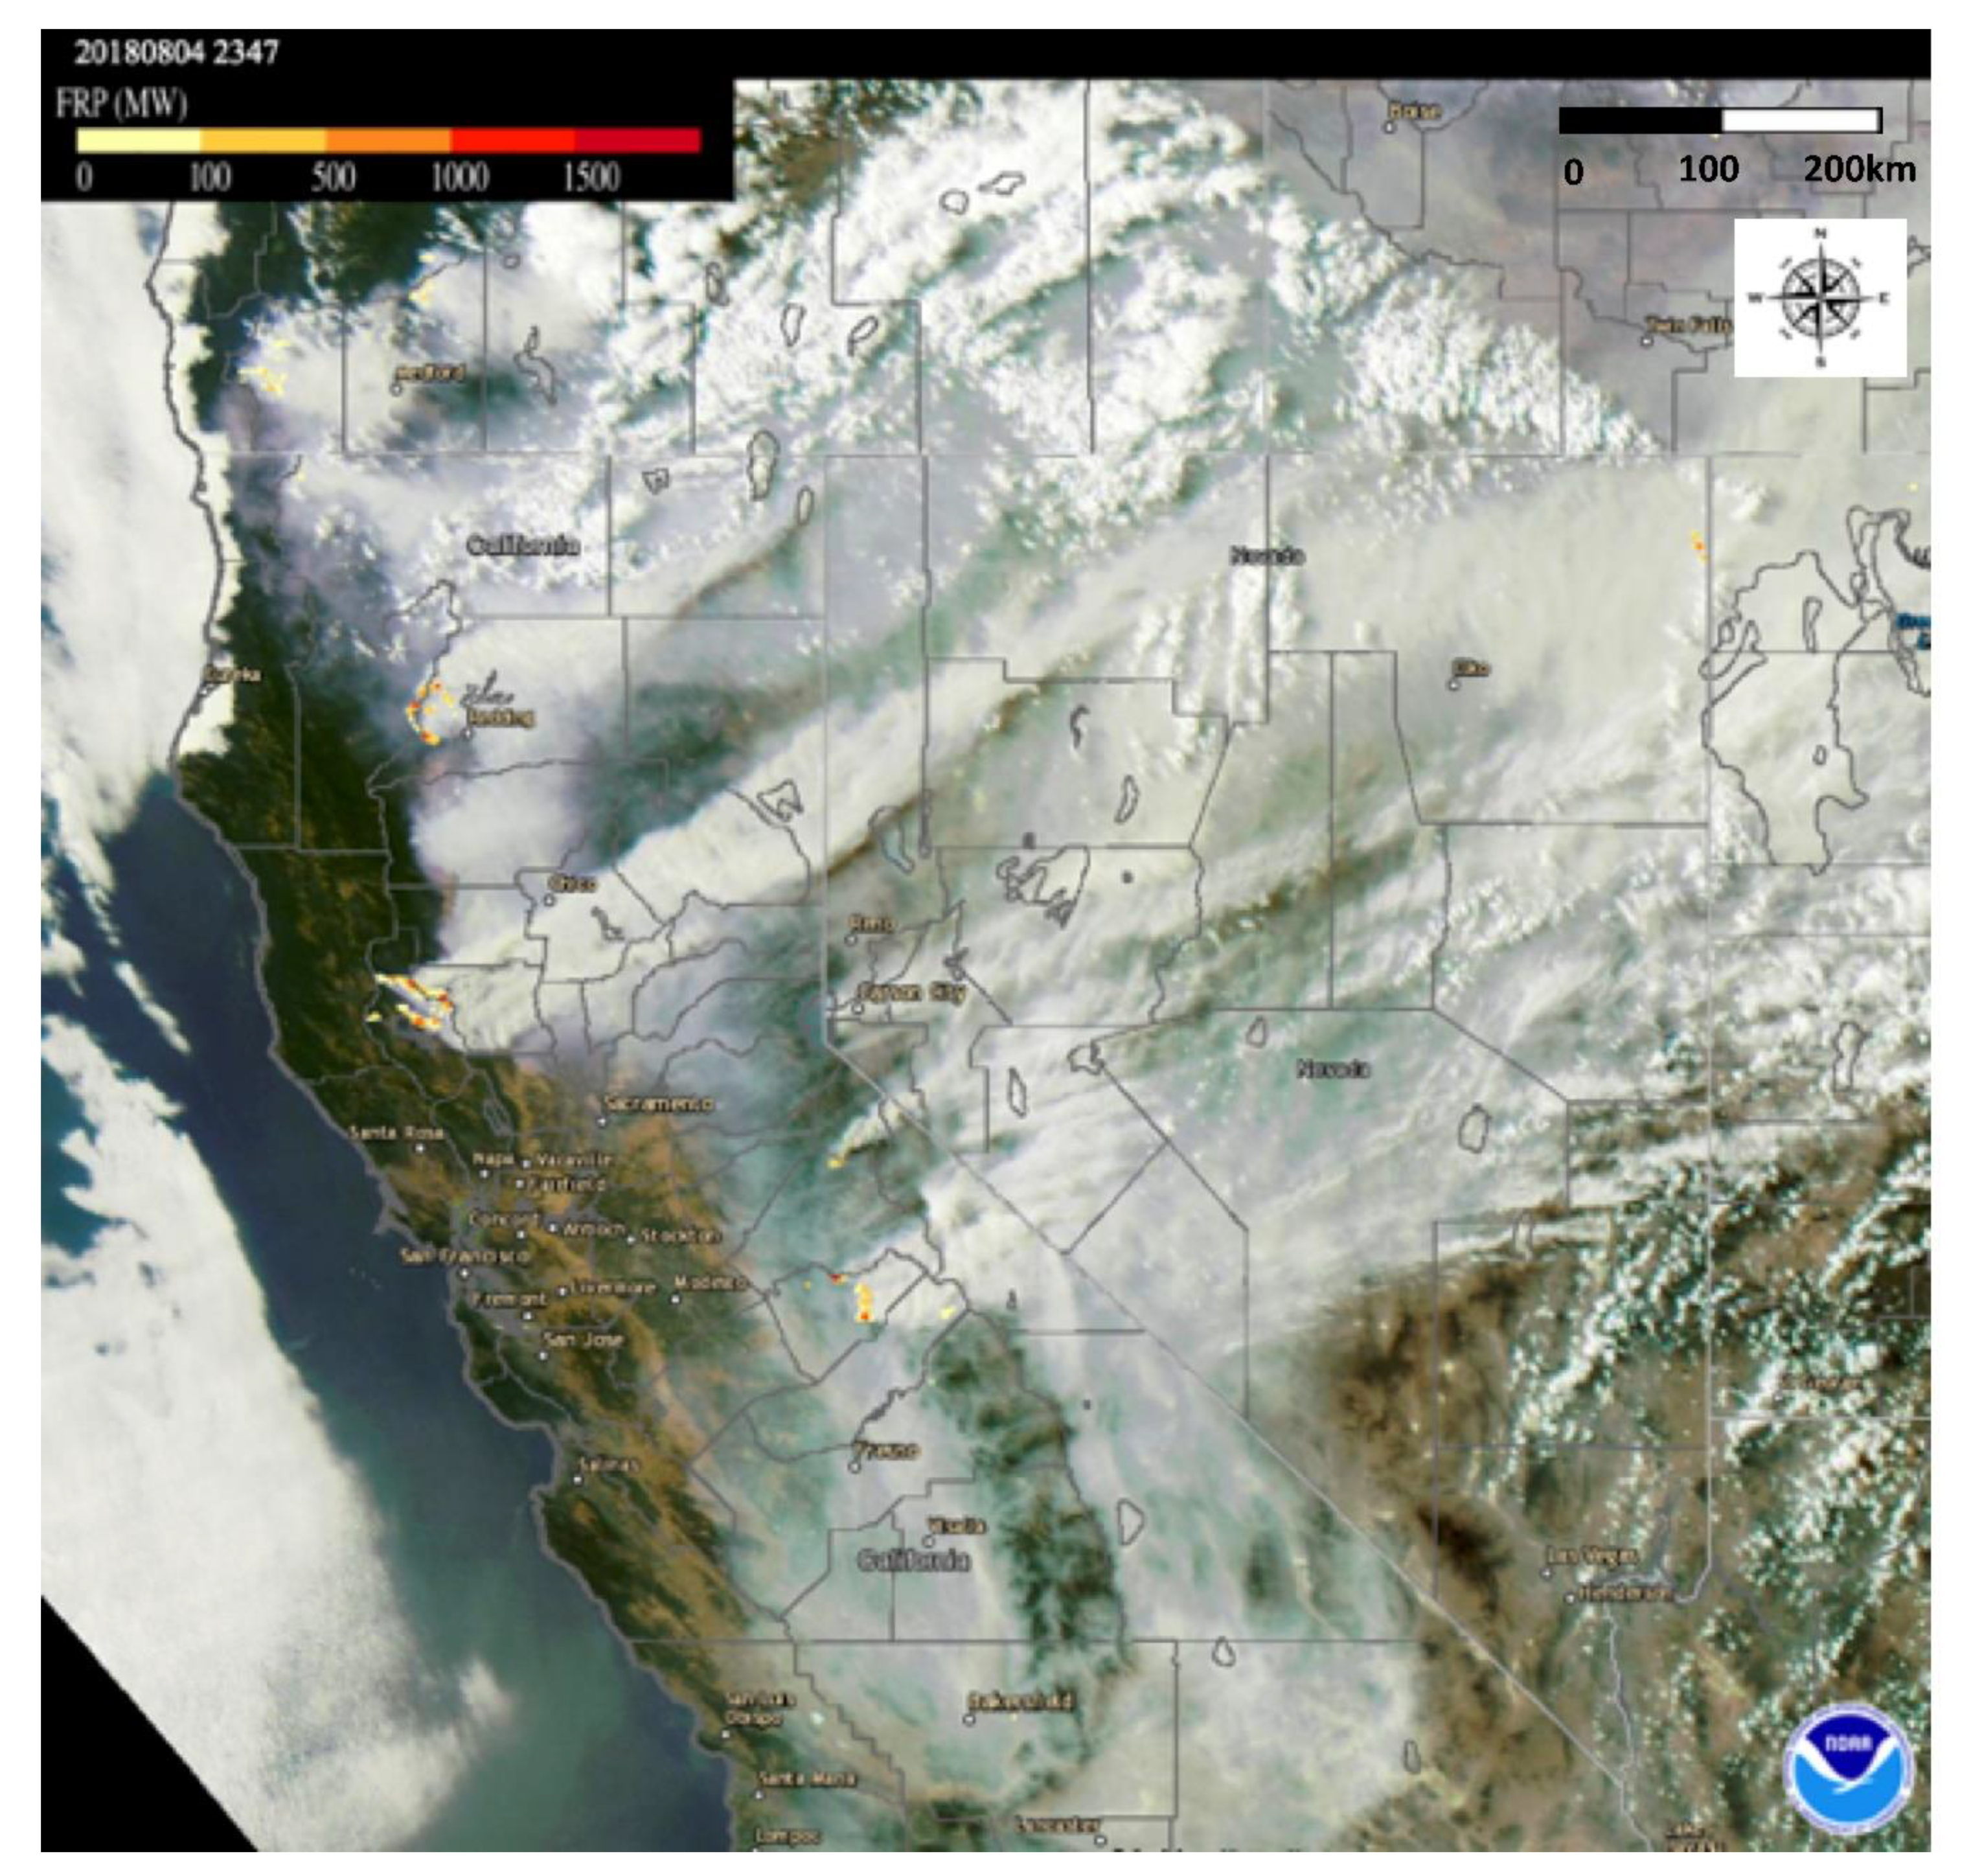
Figure 1. Visible smoke plume from the GOES-16 satellite at 2347 UTC and fire radiative power from the VIIRS instrument aboard Suomi-NPP on August 4 2018. Image from NOAA AerosolWatch.
Atmosphere 11 00970 g001
Figure 2. Location of wildland fires greater than 12,000 acres in California in 2018. Red fill: Fires included in this study; green diamonds: The six air quality monitoring sites. Source: United States Department of Agriculture, Forest Service.
Atmosphere 11 00970 g002
Figure 3. Estimated total emissions (PM2.5 total tons per wildfire) and the active time of fire spread per fire between 4 June and 3 December 2018, for 18 fires. Fires included in this study have red lines. The study period (time period in which smoke apportionment modeling was performed) is shaded in light blue.
Atmosphere 11 00970 g003
Figure 4. Apportionment of measured 24 h average PM2.5 concentration, 23 July–29 August 2018 by fire (Lions, Ferguson, Donnell, Mendocino Complex, Carr) at each of the six monitoring sites (Bishop NCORE, Bishop Paiute Tribe, Crowley Lake, June Lake, Lee Vining, Mammoth). Background color indicates U.S. Environmental Protection Agency (EPA) Air Quality Index (AQI) category; Green: Good, Yellow: Moderate, Orange: Unhealthy for Sensitive Groups, Red: Unhealthy, and Purple: Very Unhealthy.
Atmosphere 11 00970 g004
Table 1. Comparisons of modeled smoke apportionment and impacts per air quality monitoring site and per fire. Individual data points are rounded to the nearest whole number.
Monitoring SitesAll SitesBishop NCOREBishop Paiute TribeCrowley LakeJune LakeLee ViningMammoth
Days of Quality Data * 383724383831
Mean PM2.5 (μg/m3) during study period (23 July–29 August)
Fire NameLions11967191210
Ferguson121591014214
Donnell3324152
Mendocino56510373
Carr1111121
All Fires **30342219374619
Mean PM2.5 (μg/m3) during highest impact period (2–4 August)
Fire NameLions13261413195NA
Ferguson811126294110111NA
Donnell000000NA
Mendocino14172313724NA
Carr211516NA
All Fires **12415510183134146NA
Days of PM2.5 (μg/m3) 24 h Exceeding TOC (>35 μg/m3)
Fire NameLions16310822
Ferguson19432460
Donnell6101121
Mendocino0000000
Carr0000000
Mean PM2.5 (μg/m3) during TOC-days (>35 μg/m3)
Fire NameLions443735NA454059
Ferguson9399699492100NA
Donnell4845NA47406236
MendocinoNANANANANANANA
CarrNANANANANANANA
* Number of days during the study period in which PM2.5 24 h average air quality monitoring data passed EPA completeness criteria. ** Mean PM2.5 concentration (μg/m3) for summation of all five fires included in this study.