Article

Numerical Simulation Analysis of the Impact of Urbanization on an Extreme Precipitation Event over Beijing–Tianjin–Hebei, China

1
Laboratory of Cloud-Precipitation Physics and Severe Storms, Institute of Atmospheric Physics, Chinese Academy of Sciences, Beijing 100029, China
2
Huangshanshi Meteorology Bureau, Huangshan 245000, China
3
College of Earth Science, University of Chinese Academy of Sciences, Beijing 100049, China
4
Key Laboratory of Meteorological Disaster, Ministry of Education/Joint International Research Laboratory of Climate and Environment Change/Collaborative Innovation Center on Forecast and Evaluation of Meteorological Disasters, Nanjing University of Information Science and Technology, Nanjing 210044, China
5
Southern Marine Science and Engineering Guangdong Laboratory (Zhuhai), Zhuhai 519082, China
*
Author to whom correspondence should be addressed.
Atmosphere 2020, 11(9), 945; https://doi.org/10.3390/atmos11090945
Submission received: 13 July 2020 / Revised: 30 August 2020 / Accepted: 1 September 2020 / Published: 4 September 2020
(This article belongs to the Section Meteorology)

Abstract

:
In this study, an extreme rainstorm that occurred in the Beijing–Tianjin–Hebei (BTH) region in China on 19–20 July 2016 is simulated and analyzed using the Weather Research and Forecasting model, coupled with a multilayer urban canopy scheme, to reveal the impact of urbanization on the extreme precipitation process in the region. The results show that the urban heat island effect (that is, surface warming and an increased near-ground sensible heat flux, which leads to increased vertical motion and atmospheric instability layer strengthening) plays a dominant role in the urban modification of rainfall during the early stages of urbanization, resulting in an increase of 6–10 mm in average hourly precipitation in urban and downwind areas. With the further development of urbanization in the BTH region, particularly in the big cities of Beijing and Tianjin, the large-scale expansion of the urban surface reduces the surface moisture, the evaporation of surface water from the ground, and the height of the atmospheric boundary layer, leading to an urban dry island effect brought about by the lack of near-surface water vapor, which inhibits an increase in precipitation. The positive effect of the urban heat island on precipitation was offset by the urban dry island effect, so the increase in precipitation in the urban areas was not obvious, but an increased range of 8–10 mm was noted. The existence of large cities changes the position of the strong upward movement of air, and convective upward movement is more likely to occur between the suburbs. With the further expansion of the underlying surface of the adjacent cities of Beijing and Tianjin, the upward movement between the two cities coincides, leading to an obvious increase in precipitation between the two cities.

1. Introduction

In recent decades, with the development of urbanization in China, especially the formation of urban clusters, the energy balance and dynamic–thermodynamic characteristics of urban areas have changed, and these changes have corresponding effects on the regional atmospheric planetary boundary layer, atmospheric circulation, and climate. The Beijing–Tianjin–Hebei (BTH) region is one of China’s three major urban groups and also a center for political, cultural, sporting, diplomatic, and other activities. Storms and flood disasters in the region often result in large numbers of casualties and huge economic losses, and have a serious international impact. With the rapid development of urbanization, extreme precipitation in the BTH region has become more frequent, and heavy rainfall continues to have an important impact on the formation of urban flooding [1]. Therefore, studying the development mechanism of rainstorm systems in the BTH region under the influence of urbanization is of great scientific significance and has practical application value for improving the forecasting of heavy rainfall in the rapidly urbanizing BTH region, especially heavy rain that causes urban flooding.
As early as 1921, Horton [2] found that thunderstorms appeared to be more frequent in urban areas. The effects of urban environments on precipitation were first manifested after the replacement of vegetation and soil with impermeable concrete, resulting in the absorption and storage of more heat in urban areas than in rural areas. As a result, urban areas absorb more solar radiation during the day, some of which is stored as geothermal energy. During the night, stored heat is released, warming the lower atmosphere and creating a heat island effect. The increase in temperature produces a thermal disturbance in the pressure and wind fields, which enhances the instability of the atmosphere. In addition, the increase in the heat flux from the urban surface is conducive to the generation of convection. Furthermore, the increase in surface roughness caused by the city tends to enhance the convergence of wind. All these positive physical mechanisms related to the urban modification of rainfall can explain the observed enhancement of precipitation, convection, and lightning over and downwind of cities [3].
Many previous observational and modeling studies have indicated that urbanization processes might initiate and enhance convective activity, resulting in increased summer precipitation, particularly over and downwind of cities [4,5,6,7]. Bornstein and Lin [8] found that urban-induced convergence triggers thunderstorms during the day in summer, using observations from the Atlanta Ground Weather Station. Some recent studies have documented significant increasing trends in the frequency of heavy rainfall over intensely urbanized regions [9,10,11]. At the same time, analysis of other climate indicators, such as the frequency of lightning activity [12] and low-level cloud [13], also supports the findings of increased precipitation in urban areas. In the past decade, an increasing number of researchers have analyzed the process of urban precipitation in more detail using numerical simulations. Shem and Shepherd [14] found that, compared with nonurban conditions, the simulated rainfall for the windy 20–50 km zone east of Atlanta increased by 10% using numerical sensitivity tests. Using numerical simulations, Lin et al. [15] found that the typical precipitation system in northern Taiwan tends to be stronger in urban regions than in nonurban regions. Liu et al. [16] used the Modified Single Layer Urban Canopy Model of Peking University (UCMPKU) model coupled with the mesoscale meteorological Weather Research and Forecasting (WRF) model to study the occurrence and development mechanism of heavy rainfall in Beijing on 21 July 2012. They found that the relatively strong heat flux from the urban surface heated the lower atmosphere, which increased the instability of the lower atmospheric boundary layer and subsequently facilitated the triggering of convection, resulting in a risk of increased rainfall. In addition, the urban heat island effect may interact with valley, land, and sea winds to alter the local circulation, thereby affecting precipitation [17]. Liu et al.’s [18] research on the regional thermal environment showed that solar radiation and precipitation are closely related to UHI intensity across this region. At present, the urban contribution to precipitation can be summarized as follows. (1) The urban heat island effect and increased surface roughness enhance low-level convergence, increasing atmospheric vertical motion and even precipitation [19,20]. (2) The increased surface heat sensitivity facilitates the triggering and development of convective systems [21,22,23]. (3) Urbanization results in thermal disturbances in the pressure and wind fields, enhancing the intrusion of sea or lake winds and promoting vertical motion [24,25]. (4) Urban areas can change the intensity, composition, and structure of approaching thunderstorms [26].
However, the urban environment also has an inhibitory effect on precipitation. Kaufmann et al. [27] analyzed the space–time relationship between precipitation and urban land use and concluded that the regional surface hydrological changes associated with urbanization would reduce local precipitation. Guo et al. [28] found that, as urban areas rapidly expanded, the simulated cumulative precipitation generated by strong convective precipitation systems throughout the region would also decrease. Meanwhile, Zhang et al. [29] used coupled mesoscale weather–surface–urban models and different urban land-use change scenarios to create numerical simulations of two representative summer heavy rainfall events. The results showed that the urban effect contributed to the general reduction of precipitation in the windy region. On the basis of multiyear simulations, Georgescu [30] found that the decrease in evaporation due to the urbanization effect reduced the amount of water vapor flux, resulting in a 12% reduction in total precipitation. In addition, Wang et al. [31] conducted a high-resolution regional climate modeling analysis of China’s three largest urban clusters and found that urban-related processes may reduce the rainfall in urban areas and change regional precipitation patterns to some extent. The inhibition effect of urban precipitation is due to the extensive expansion of the surface of the permeable city hindering the storage of water in vegetation and soil, the precipitation in urban areas being largely removed in the form of runoff, and the change in the effectiveness of the urban lower mat in the surface water storage reducing the evaporation from the surface, resulting in water vapor depressions in the urban atmospheric boundary layer. Therefore, the decrease in water shortage in urban areas may inhibit the development of convection and even precipitation.
Previous studies on the impact of urbanization have been based on the urban influence on precipitation, and there has been little discussion about the different effects on precipitation at different stages of urbanization. The exploration of the climate of urbanization-affected regions has been based on numerical simulation experiments. While most studies have used a single-layer urban canopy scheme [32,33], Wang [34] used a multilayer urban canopy scheme to simulate the high-density building environment in Chongqing, and found that this scheme showed a better simulation performance than the single-layer canopy scheme. To study the impact of the development of the BTH urban cluster on precipitation in this area, this study uses the mesoscale meteorological WRF model coupled with the multilayer urban canopy scheme. The numerical simulation of the extreme precipitation that occurred in the BTH region on 19–20 July 2016 is analyzed to explore the effect of different urbanization stages on the precipitation process, to improve the understanding of the extreme precipitation process in the BTH region.

2. Data and Methods

2.1. Case Selection

An extreme rainstorm occurred in the BTH region on 19–20 July 2016. The duration of this heavy precipitation event was relatively long, the total amount of precipitation was large, and the scope was wide. The total amount of precipitation exceeded the 21 July 2012 Beijing heavy rainfall event, and the average precipitation in Beijing alone reached 210.7 mm, and in urban areas 274 mm, resulting in serious urban flooding. The event was due to an extreme precipitation process. In terms of the background circulation for this event, there was an “east high–west low” configuration, which is typical of North China [35]. In addition, the trough at 500 hPa, the low vortex at 700 hPa, and the high and low jets matched, and the northward lift of the subtropical high prevented the eastward movement of the low vortex in North China, resulting in the stagnation of the low vortex in the BTH region [36]. The localization of this precipitation meant that the extremes were very high; although the occurrence of heavy precipitation depends on the background circulation, the underlying surface will also have an important impact on the occurrence of local extreme precipitation. This requires further research.

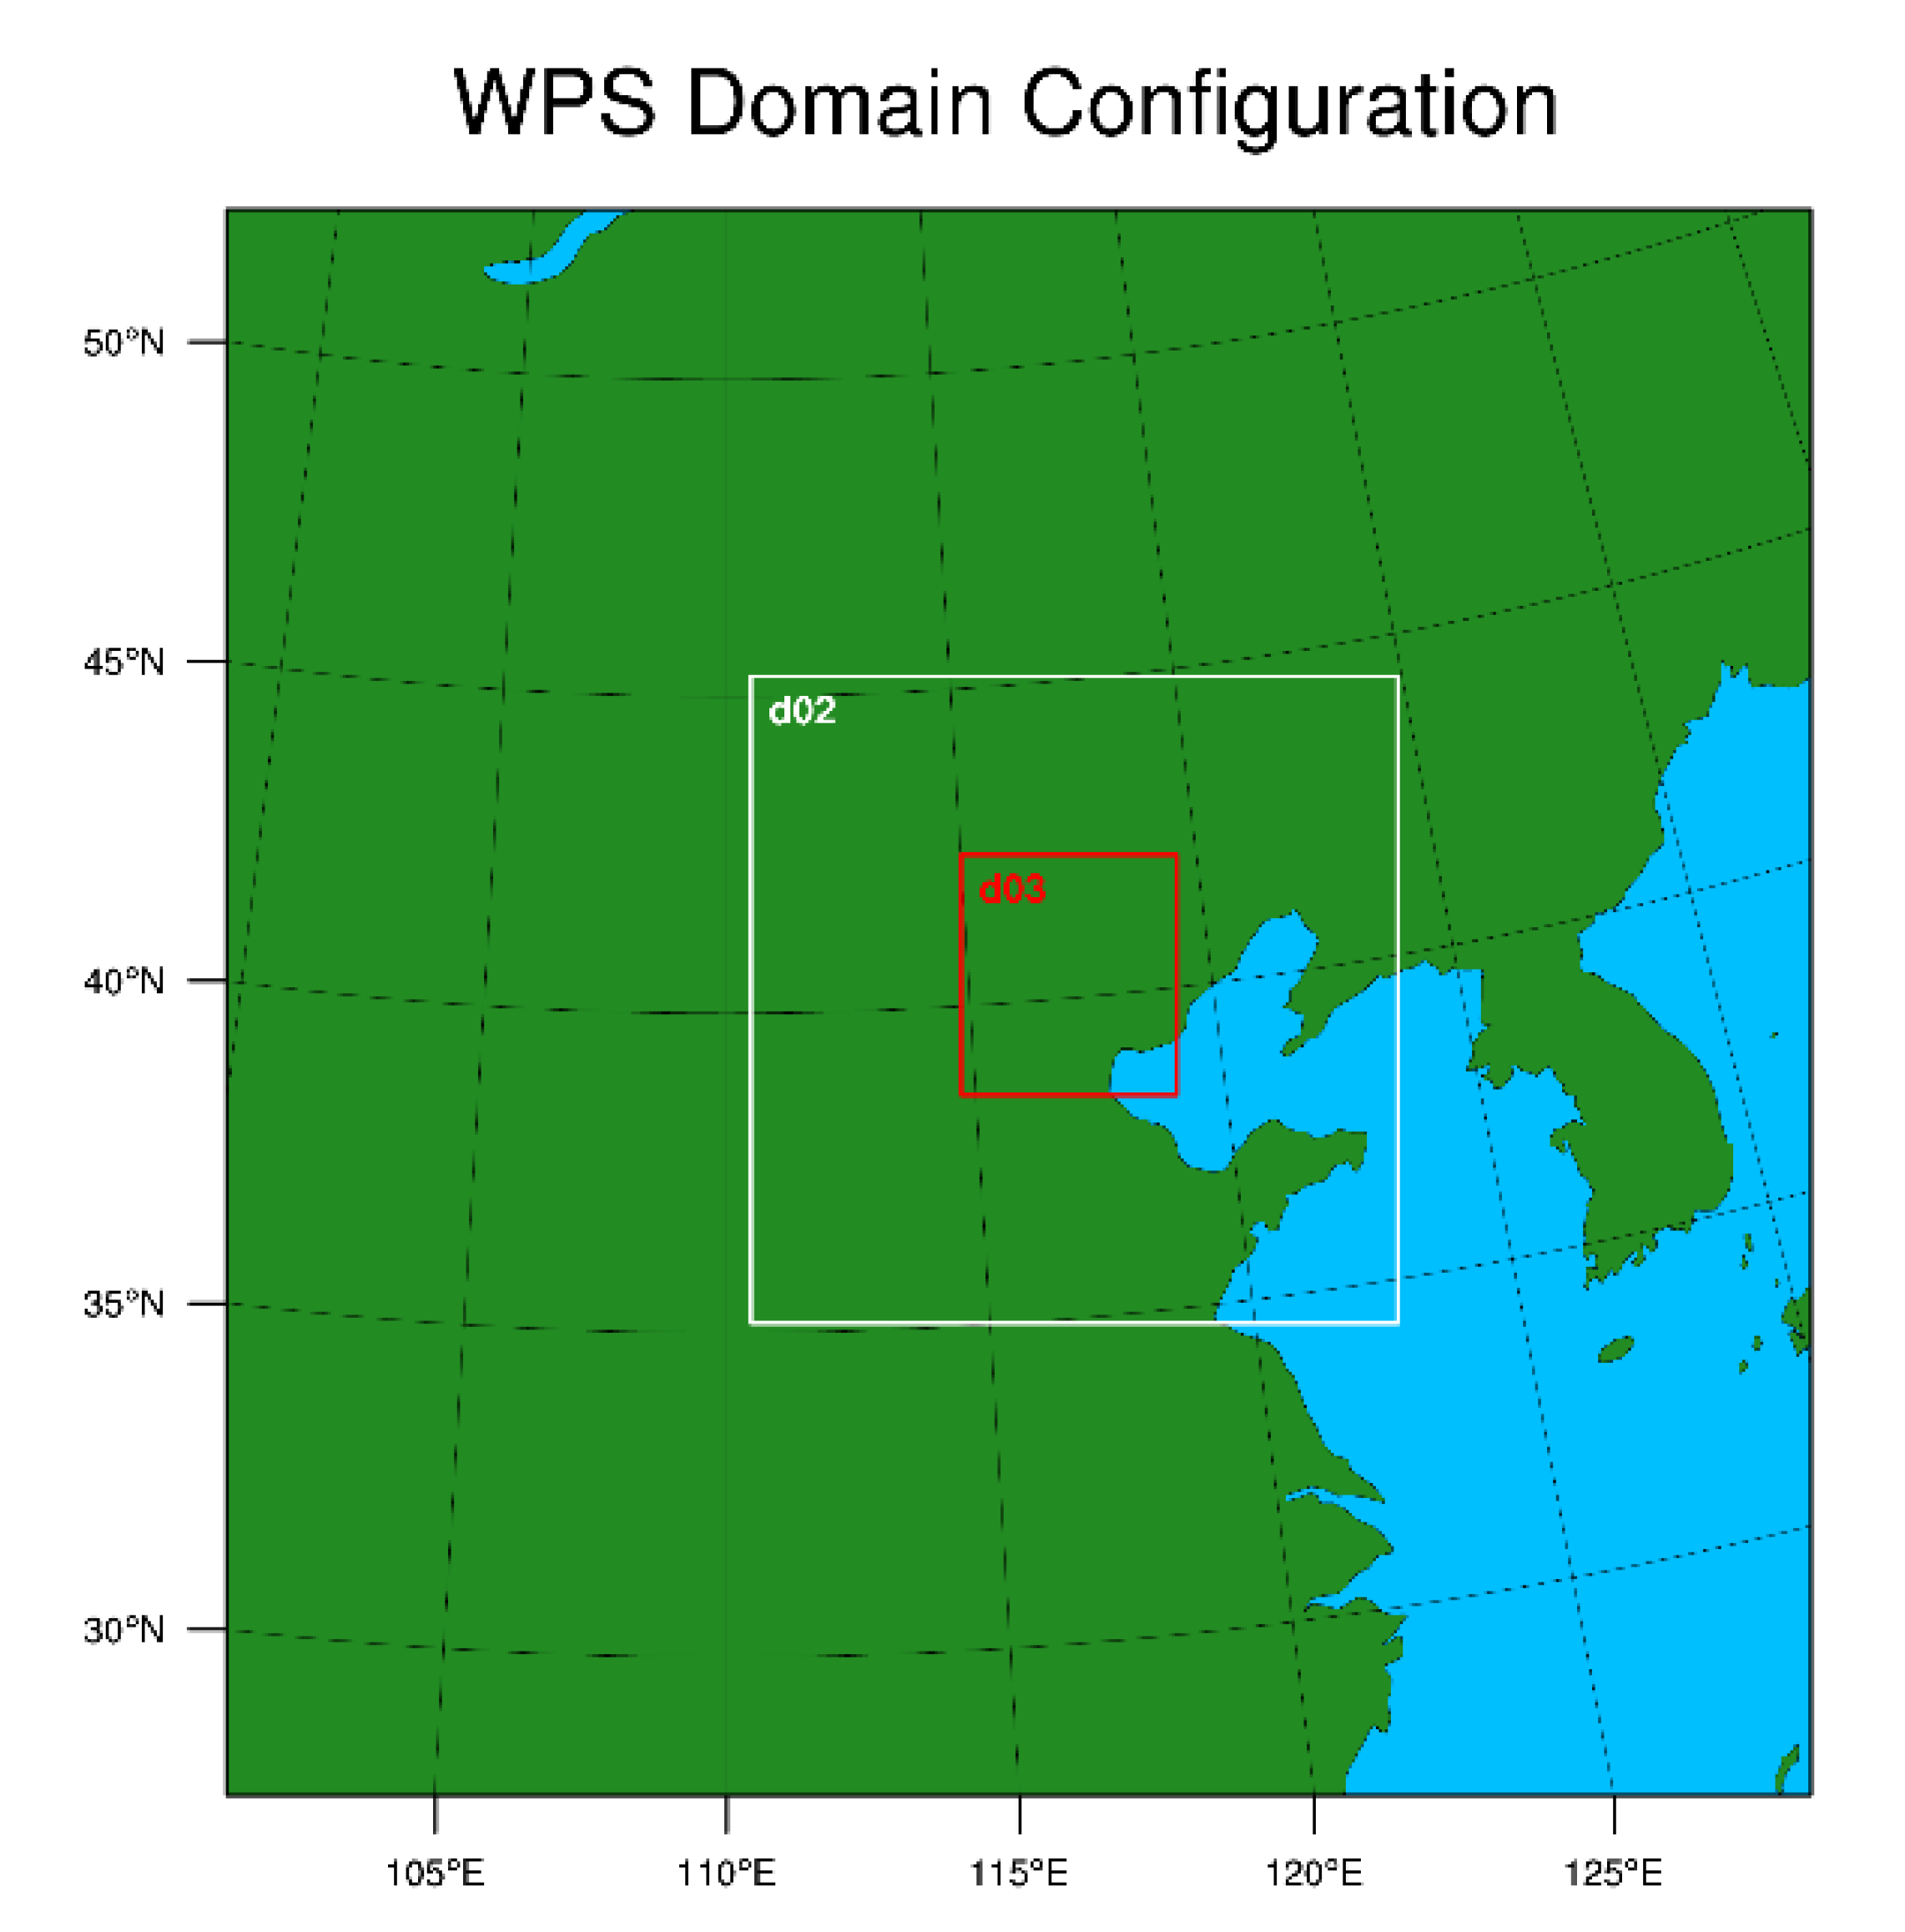
2.2. Model Description and Experimental Design

The model used in this study is version 3.9.0 of the WRF model. The multilayer urban canopy mode (BEP) was switched on in the model to represent the urban boundary layer physics. Initial and boundary conditions for the large-scale atmospheric conditions were provided by six-hourly 1° × 1°. In the simulation, the data on the type of land on the underlying surface were surface-type data obtained from the inversion of MODIS (Moderate Image Spectra Radiometer) in 2006 and 2016 (resolution: 500 m) [37]. Table 1 shows the model settings and parameterization schemes used in this study. The simulation was implemented with triple-nested grids at resolutions of 9, 3, and 1 km for three domains (D1, D2, and D3) (Figure 1), and there were 32 layers in the vertical direction. The following parameterization schemes were used for the physical processes: the Purdue–Lin microphysics scheme, the Kain–Fritsh cumulus parameterization scheme [38], the Bougeault–Lacarrere (Boulac) planetary boundary layer scheme [39], the Mesoscale Model version 5 (MM5) Monin–Obukhov surface-layer scheme, and the Noah land surface model [40] coupled with the multilayer urban canopy model (BEP) [41]. The simulations ran from 12:00 UTC on 19 July 2016 to 00:00 UTC on 21 July 2016, which included the entire precipitation period, with the first six hours of the simulation being the adjustment time for the model and the smallest area covering the urban areas of Beijing and Tianjin and most of the surrounding areas.
Three experiments were designed to simulate the different responses of this rainstorm to urbanization (Table 2). Test 1 (No urban) eliminated all urban land-cover fractions and changed other land-cover fractions proportionately. Test 2 (Urban06) updated the urban land-cover fractions using the land-use data for 2006. Test 3 (Urban16) updated the urban land-cover fractions using the land-use data from 2016. As Test 3 is the control experiment, the verification of the simulation results is based on this experiment. Except for the difference in the surface land-use type, the model settings for the three experiments are the same. The land-use type of the underlying surface in area D3 in the three experiments is shown in Figure 2.

3. Results

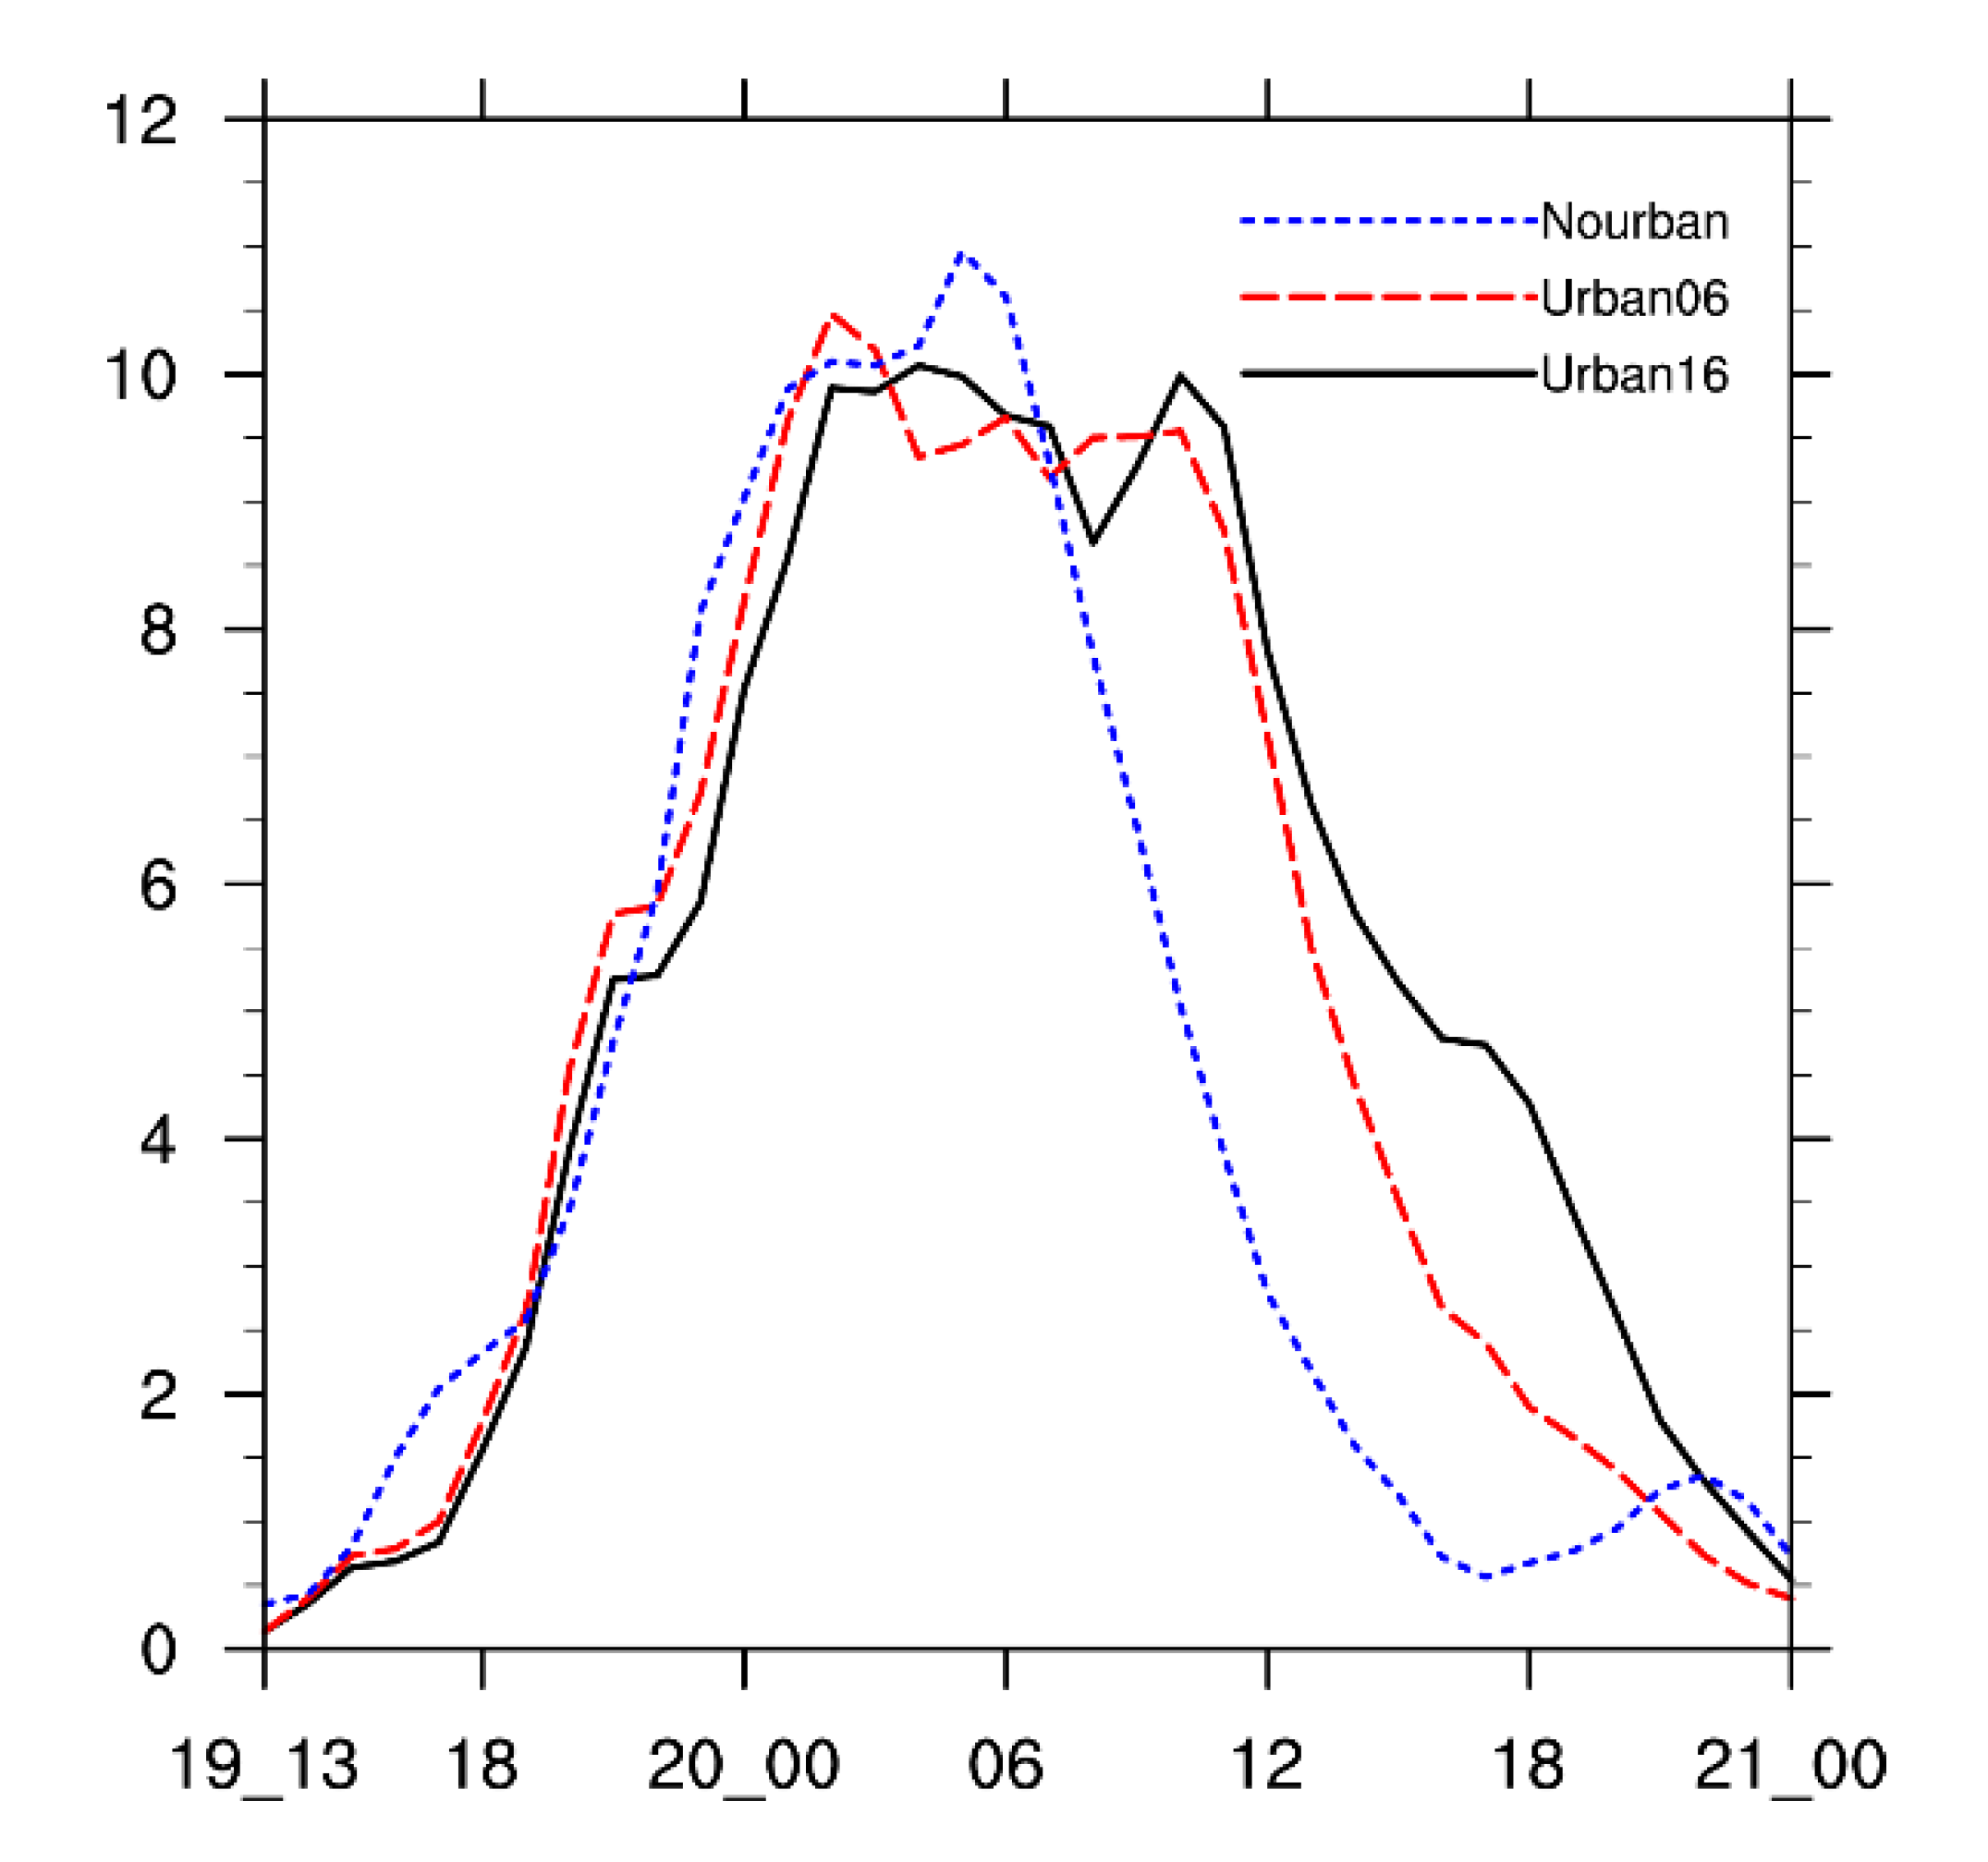
3.1. Simulated Precipitation

Figure 3 shows the observed and simulated 6 h accumulated precipitation from 02:00 UTC to 08:00 UTC on 30 July 2016. The Urban16 test simulation results (Figure 3d) are basically consistent with the observed precipitation (Figure 3a). In the Urban16 test, for most of the areas in Beijing and Tianjin, the 6 h accumulated precipitation is more than 50 mm in the heavy precipitation stage. One extreme precipitation area is located in the South of Beijing, and the range and intensity of the precipitation is consistent with the observations (Figure 3d). Therefore, the performance of the model in simulating the precipitation is satisfactory. Comparing the simulation results for the other three experiments confirms that the information regarding the underlying surface in the model can improve the accuracy of the simulation results.

3.2. Simulation Results Analysis

On the basis of the three simulations with different urban land-use modifications for the 20 July rainstorm in the BTH region, we analyzed the response of the summer precipitation to urban coverage and density. Figure 4a shows the difference between the Urban06 test and the No urban test precipitation. It can be seen that, in the eastern part of Beijing and the western side of Tianjin, the average hourly precipitation increased by 6–10 mm. The difference between the Urban16 test and the No urban test is similar to the difference between the Urban06 test and the No urban test. However, the precipitation increase is in a more concentrated area, closer to the urban area of Beijing, and stronger. In addition, there was also a smaller range of precipitation enhancement area between the two cities of Beijing and Tianjin. The simulated precipitation of the Urban06 test shows that, after modification of the land surface with relatively low urban development, the precipitation tends to be more widely distributed and enhanced. However, with the continuous development of urbanization, when the coverage and density of cities reaches a certain extent (such as the Urban16 test), the effect of this urban increase in precipitation is not further enhanced, but leads to more localized precipitation, which is consistent with the results of Wang et al. [42], who found that the combined effects of urbanization on precipitation depended on the degree of urbanization. On this basis, we further infer that neighboring cities influence each other after the urbanization effect reaches a certain level, and jointly affect the intensity and distribution of precipitation.
Further comparing the average hourly precipitation in the three numerical tests (Figure 5), it can be seen that the difference between the three experiments is small before the precipitation peak, and with the development of the city, the value of the precipitation peak is smaller, but the duration of the heavy precipitation (more than 5 mm h−1) is longer. The period of heavy precipitation increased from 13 h in the No urban test to 17 h in the Urban06 test, which eventually increased to 19 h in the Urban16 test. This shows that, in the early stages of urban development, the period of heavy precipitation increases significantly, resulting in an increase in precipitation in urban areas and a longer period of heavy precipitation as the city expands further, which is more likely to lead to urban flooding.
To illustrate the difference in the duration of the heavy precipitation in the three experiments, we further analyzed the differences in temperature and water vapor. As there is obvious cold and warm air in the Beijing area during this precipitation event, the 22 °C isotherm near the area with the largest temperature gradient is selected to indicate the movement of cold air. In addition, as Tianjin is affected by a sea breeze, the 18 g kg−1 wet line in the area with the largest humidity gradient is selected to indicate the movement of the sea breeze. It can be seen that, at the beginning of the heavy precipitation period, the isotherms of the three experiments basically coincided (Figure 6a), and there was a significant difference after 3 h. The wind speed of the No urban test was significantly faster than that of the other two tests, followed by the Urban06 test, with the Urban16 test being the slowest, which may be due to the higher degree of urbanization and the longer duration of the heavy precipitation. In Tianjin, the prevailing wind direction is the high-humidity sea breeze on the eastern sea. At 22:00 UTC on 19 July, the three wet lines are basically the same shape as the coastline. Furthermore, in this area, obvious wind speed convergence can be seen, which reflects the progress of the sea breeze. At 01:00 UTC on 20 July, the three tests showed a significant difference in the wet line. Compared with the No urban test, the Urban16 test and the Urban06 test wet lines showed significant backward bending in the urban area. The decrease was obviously slower, which indicates that there was a good positive correlation between the area of the urban region and the duration of precipitation. That is, after the expansion of the underlying surface of Beijing and Tianjin, the northwest dry cold airflow and the eastern sea wind front water vapor transport were delayed. This delay led to an increase in the duration of precipitation in Beijing and Tianjin.

4. Potential Physical Mechanisms of Urban Expansion Affecting Precipitation

The direct, major impact of urban expansion is near-surface warming, which may enhance convective activity in urban areas. With the acceleration of urbanization, the natural underlying surface of farmland, natural vegetation, and water bodies around the city has been replaced by a large number of buildings. Owing to the different physical properties of the underlying surface of the city and the natural underlying surface, more solar radiation is absorbed during the day, the temperature increases quickly, and the temperature decrease is slow due to the reverse radiation of the atmosphere at night. In addition, artificial heat sources in the urban areas also have a significant effect on the temperature increase. Figure 7 shows the difference in the 2-m temperature between the three tests. Figure 7a shows the difference between the Urban06 test and the No urban test (called U06), and Figure 7b shows the difference between the Urban16 test and the No urban test (called U16). It can be seen that the urban area is in a warm area, the maximum temperature difference reaches 1.5 °C, and there is an obvious urban heat island. The anomalous increase in urban-induced near-surface temperature becomes more obvious with the progress of urbanization, indicating that the larger the urban area, the stronger the heating of the city under the surface, causing the air flow in the warm center of the city to rise and convection to be easily triggered. At the same time, the expansion of the city led to an increase in the sensible heat flux (Figure 7c,d). The increase in the sensible heat flux occurs not only in urban areas but also in the suburbs. This change causes significant heat flux differences at the edge of the city, causing localized spikes and cyclonic circulation in the city center and downwind zones (Figure 7c,d). In addition, this change induced by the city will also affect the downstream areas with the advection of the wind, with obvious downstream effects. The induced surface warming, the increased heat flux, and the increased surface roughness due to the change in the underlying surface of the city lead to the enhancement of local wind convergence, which will increase the precipitation.
The urban effect also affects the distribution of water vapor, resulting in differences in the water vapor between urban and suburban areas. It can be seen that the 2-m specific humidity of wetness in the cities is slightly lower than in the suburbs (Figure 8a,b). On the one hand, urban areas have less vegetation than rural areas, and the water storage capacity is poor, which is not conducive to the evaporation and maintenance of water. On the other hand, the urban underlying surface roughness is large, the turbulent motion is enhanced, and the amount of water vapor transported upwards increases, resulting in a decrease in the water vapor content near the ground in the city, which leads to an urban dry island. The area with the most obvious decrease in specific humidity corresponds to the area where the city has expanded, so the higher the degree of urbanization, the more obvious the urban dry island. Correspondingly, in this area, the height of the planetary boundary layer increases (Figure 8c,d), which may increase the mixing effect of water vapor in the lower atmosphere and cause a water shortage in the urban area, which will inhibit the precipitation to a certain extent.
In summary, on the one hand, urban expansion increases the underlying surface roughness, the turbulent motion increases, and the turbulent upward transport of water vapor increases. The urban near-surface air warming characteristics will affect the local circulation, resulting in enhanced convective activity in the area. This is reflected in the difference in precipitation between the Urban06 test and the No urban test. On the other hand, when the scale of the city reaches a certain level, it inhibits the evaporation at the surface and there is a lack of water in the urban area, which inhibits the occurrence of convective precipitation to some extent. This means the increase in precipitation in urban areas in the Urban16 test is consistent with that in the Urban06 test. Therefore, the leading role of urban development in the process of precipitation may change with the degree of urbanization.
To study the vertical distribution of meteorological parameters in the BTH region and whether the expansion of large neighboring cities such as Beijing and Tianjin have a mutual influence, we show the vertical distribution of the wind field in the afternoon (06:00 UTC on 20 July) in the three simulations, which is along the vertical section of the solid blue line in Figure 2 (Figure 9). As shown in the simulation results of the No urban test in Figure 9a, in the absence of a city, the wind field prevails from the Southeast in the direction of Tianjin, and there is a clear ascending area in the vicinity of the northwest mountains and weak sinking movement in the mountains. In the presence of the city (Figure 9b), the wind speed near the city’s near-surface layer decreases, which reflects the city’s blocking effect on the wind. In addition, the strong updraft area in Beijing moves eastward relative to the No urban test, and the intensity also slightly increases. Meanwhile, there is also an updraft area in the Tianjin urban area. Owing to the large difference in the flux between the urban and suburban areas, these two strong updrafts are located at the junction of the urban and suburban areas. With the further expansion of the city (Figure 9c), the two updraft areas located in Beijing and Tianjin are further strengthened and converged, while an obvious sinking area appears on the west side of the Beijing urban area. In addition, there is obvious closed circulation in the Southeast and Northwest of Beijing city, which explains the emergence of a precipitation increase in the area between Beijing and Tianjin in the Urban16 test. The simulation results of the three experiments show that the presence of the city has an impact on the boundary layer process and structure in the region. The presence of the city changes the position of the strong ascending motion, which is more likely to occur between the urban and suburban areas. With the further development of the two neighboring large cities, their expansion causes the ascending motion areas between the two cities to overlap, resulting in an increase in precipitation in the area.

5. Conclusions

This study used the WRF/BEP model with three different land-use maps to simulate a heavy precipitation event that occurred in the BTH region on 19–20 July 2016. The aim was to assess the effect of urbanization on the rainfall event. Through comparative analysis of the experimental results, it was found that, with the change in urban land-use distribution, the precipitation in the BTH region also changed.
(1)
In the early stage of urbanization of the BTH region, the temperature increase of about 1.5 °C caused by the urban heat island effect enhanced vertical motion; the increase in surface roughness caused the wind to converge, further enhancing the instability of the atmosphere, and the increase in surface sensible heat flux was conducive to the occurrence of convection. These urbanization effects increased the precipitation in urban and downstream areas, and especially in the suburbs. It can be seen that, in the eastern part of Beijing and the western side of Tianjin, the average hourly precipitation increased by 6–10 mm. Therefore, in the early stage of urbanization, the urban heat island effect played a leading role in precipitation.
(2)
With the further development of urbanization, especially the expansion of Beijing and Tianjin and the formation of urban agglomerations, the water storage capacity of the vegetation and soil was hindered, resulting in an urban dry island effect. The reduction of surface evapotranspiration, the increase in the boundary layer height, and the increase in the turbulent flux over the city made the stratification of the lower troposphere water vapor more uniform. The reduction of water in the central city has the potential to inhibit the development of convection and even precipitation, which may offset the positive impact of the heat island effect. The simulation comparison also reveals that the urban precipitation in Beijing was not further enhanced after the further expansion of the urban underlying surface, but an increased range of 8–10 mm was noted.
(3)
There was a good positive correlation between the area of the urban region and the duration of heavy precipitation. That is, after the expansion of the underlying surface of Beijing and Tianjin, the northwest dry cold airflow and the eastern sea wind front water vapor transport were delayed. This delay caused the precipitation system to move more slowly in urban areas, which led to an increase in the duration of heavy precipitation in Beijing and Tianjin from four to six hours.
(4)
A vertical uplift area caused by the simultaneous expansion of Beijing and Tianjin appeared between the adjacent suburbs of the two major cities. The urban underlying surface of the adjacent cities jointly affected the distribution of vertical motion. The vertical movement areas of the adjacent areas of Beijing and Tianjin were superimposed, and the vertical ascending motion was enhanced, resulting in an increase in precipitation in the area.

6. Discussion

This paper considers the impact of urbanization on rainstorms. One of the innovations is the impact of urbanization in the BTH region on precipitation. Urbanization refers to not just the impact of a city, but the impact of urban agglomerations. The novel aspects of this paper are as follows:
  • Using the latest multilayer urban canopy model, we explored the effects of different stages in the process of urbanization on precipitation, and the mutual influence between neighboring large cities after the formation of urban agglomerations.
  • The impact of urbanization after westerly air flow over the mountains was a focus. Urbanization has a more obvious impact on the advancement of cold and warm air. Tianjin is close to Bohai Bay, where heavy rains are significantly affected by sea breeze fronts. The analysis of the impact of urbanization was based on the impact of sea breeze fronts on the transport of water vapor to land. It was found that the city had an obvious blocking effect, slowing down the precipitation system and resulting in a longer precipitation duration.
However, the results of this study are only an analysis of one extreme precipitation event in the BTH region. The impact of the BTH region urbanization on precipitation needs to be verified by more observations and case studies. At the same time, the terrain of the BTH region is complex. The terrain is inclined from the Northwest to the Southeast, with mountains to the Northwest and Northeast of Beijing. The influence of urbanization on precipitation can also be regulated by the local atmospheric circulation caused by valley wind. Therefore, the analysis of the impact of BTH region urbanization and topography on rainfall has yet to be confirmed. In addition, we need to improve the model to more accurately simulate the thermal environment of the city, like how Liu [43] pointed out that Multiple Endmember Spectral Mixture Analysis (MESMA)-derived urban vegetation fractional cover (VFC) produced more accurate urban heat fluxes. Moreover, owing to the rapid urbanization process and large-scale industrial activities, a large number of artificial aerosols have been discharged into the atmosphere in recent decades, resulting in serious air pollution in the BTH cities, and the change in urban rainfall due to aerosols is still unknown. Future work should analyze urban precipitation from the perspective of urbanization and the impact of aerosols, promoting cross-disciplinary analysis of precipitation research and a deeper understanding of precipitation mechanisms.

Author Contributions

Methodology, Y.-s.Z. and X.-y.S.; formal analysis, J.Z.; writing—original draft preparation, J.Z.; writing—review and editing, Y.-s.Z. and J.Z. All authors have read and agreed to the published version of the manuscript.

Funding

This work was supported by the National Key Research and Development Project of China (Grant 2018YFC1505705), the National Natural Science Foundation of China (41975137, 41875074, 41975054 and 41475054), the Strategic Priority Research Program of the Chinese Academy of Sciences (XDA20100304), and the National Key Research and Development Program of China (2019YFC1510400).

Acknowledgments

The authors are grateful to two anonymous reviewers for their insightful comments, which led to a significant improvement of manuscript.

Conflicts of Interest

The authors declare no conflict of interest.

References

  1. Zhang, W.L.; Cui, X.P. Main progress of torrential rain researches in North China during the past 50 years. Torrential Rain Disasters 2012, 31, 384–391. (In Chinese) [Google Scholar]
  2. Horton, R.E. Thunderstorm-breeding spots. Mon. Weather Rev. 1921, 49, 193–206. [Google Scholar] [CrossRef]
  3. Shepherd, J.M. A review of current investigations of urban-induced rainfall and recommendations for the future. Earth Interact. 2005, 9, 1–27. [Google Scholar] [CrossRef] [Green Version]
  4. Huff, F.A.; Changnon, S.A.J. Precipitation Modification by Major Urban Areas. Bull. Am. Meteorol. Soc. 2010, 54, 1220–1233. [Google Scholar] [CrossRef]
  5. Changnon, S.A. Rainfall changes in summer caused by st. Louis. Scinece 1979, 205, 402–404. [Google Scholar] [CrossRef] [PubMed]
  6. Shepherd, J.M.; Pierce, H.; Negri, A.J. Rainfall modification by major urban areas: Observations from spaceborne rain radar on the TRMM satellite. J. Appl. Meteorol. 2012, 41, 689–701. [Google Scholar] [CrossRef]
  7. Shepherd, J.M.; Burian, S.J. Detection of Urban-Induced Rainfall Anomalies in a Major Coastal City. Earth Interact. 2003, 7, 1. [Google Scholar] [CrossRef] [Green Version]
  8. Bornstein, R.; Lin, Q. Urban heat islands and summertime convective thunderstorms in Atlanta: Three cases studies. Atmos. Environ. 2000, 34, 507–516. [Google Scholar] [CrossRef]
  9. Kishtawal, C.M.; Niyogi, D.; Tewari, M.; Pielke Sr, R.A.; Shepherd, J.M. Urbanization signature in the observed heavy rainfall climatology over India. Int. J. Climatol. 2010, 30, 1908–1916. [Google Scholar] [CrossRef] [Green Version]
  10. Li, W.; Chen, G.; Chen, W.; Sha, W.; Luo, C.; Feng, Y.; Wen, Z.; Wang, B. Urbanization signatures in strong versus weak precipitation over the Pearl River Delta metropolitan regions of China. Environ. Res. Lett. 2011, 6, 049503. [Google Scholar] [CrossRef]
  11. Mitra, C.; Shepherd, J.M.; Jordan, T. On the relationship between the premonsoonal rainfall climatology and urban land cover dynamics in Kolkata city, India. Int. J. Climatol. 2012, 32, 1443–1454. [Google Scholar] [CrossRef]
  12. Steiger, S.M.; Orville, R.E. Cloud-to-ground lighting enhancement over southern Louisiana. Geophys. Res. Lett. 2003, 30, 1975. [Google Scholar] [CrossRef]
  13. Inoue, T.; Kimura, F. Numerical experiments on fair-weather clouds forming over the urban area in northern Tokyo. SOLA 2007, 3, 125–128. [Google Scholar] [CrossRef] [Green Version]
  14. Shem, W.; Shepherd, M. On the impact of urbanization on summertime thunderstorms in Atlanta: Two numerical model case studies. Atmos. Res. 2009, 92, 172–189. [Google Scholar] [CrossRef]
  15. Lin, C.Y.; Chen, W.C.; Chang, P.L.; Sheng, F.Y. Impact of the urban heat island effect on precipitation over a complex geographic environment in northern Taiwan. J. Appl. Meteorol. Climatol. 2011, 50, 339–353. [Google Scholar] [CrossRef]
  16. Liu, S.H.; Liu, Z.X.; Zheng, H.; Miao, Y.; Chen, B.; Wang, S.; Zhao, J.; Li, Y.; Zheng, Y.; Guo, L. Multi-scale atmospheric boundary-layer and land surface physics process models. Sci. Sin. Phys. Mech. Astron. 2013, 43, 1332–1355. (In Chinese) [Google Scholar] [CrossRef]
  17. Liu, S.H.; Liu, Z.X.; Li, J.; Wang, Y.; Ma, Y.; Sheng, L.; Liu, H.; Liang, F.; Xin, G.; Wang, J. Numerical Simulation of Atmospheric Local Circulation Coupling Effect in Beijing-Tianjin-Hebei Region. Sci. China Ser. D 2009, 39, 88–98. (In Chinese) [Google Scholar]
  18. Liu, K.; Li, X.; Wang, S.; Li, Y. Investigating the impacts of driving factors on urban heat islands in southern China from 2003 to 2015. J. Clean. Prod. 2020, 254, 120141. [Google Scholar] [CrossRef]
  19. Oke, T.R. The energetic basis of the urban heat island, Q.J.R. Meteorol. Soc. 1982, 108, 1–24. [Google Scholar]
  20. Shepherd, J.M.; Carter, W.M.; Manyin, M.; Messen, D.; Burian, S. The impact of urbanization on current and future coastal precipitation: A case study for Houston. Environ. Plann. 2010, 37, 284–304. [Google Scholar] [CrossRef] [Green Version]
  21. Thielen, J.; Wobrock, W.; Gadian, A.; Mestayer, P.G.; Creutin, J.D. The possible influence of urban surfaces on rainfall development: A sensitivity study in 2D in the meso-gamma scale. Atmos. Res. 2000, 54, 15–39. [Google Scholar] [CrossRef]
  22. Lin, C.Y.; Chen, W.C.; Liu, S.C.; Liou, Y.A.; Liu, G.R.; Lin, T.H. Numerical study of the impact of urbanization on the precipitation over Taiwan. Atmos. Environ. 2008, 42, 2934–2947. [Google Scholar] [CrossRef]
  23. Miao, S.; Chen, F.; Li, Q.; Fan, S. Impacts of urban processes and urbanization on summer precipitation: A case study of heavy rainfall in Beijing on 1 August 2006. J. Appl. Meteorol. Climatol. 2011, 50, 806–825. [Google Scholar] [CrossRef]
  24. Yoshikado, H. Interaction of the sea breeze with urban heat islands of different sizes and locations. J. Meteorol. Soc. Jpn. 1994, 72, 139–142. [Google Scholar] [CrossRef] [Green Version]
  25. Carter, M.; Shepherd, J.M.; Burian, S.; Jeyachandran, I. Integration of lidar data into a coupled mesoscale-land surface model: A theoretical assessment of sensitivity of urban-coastal mesoscale circulations to urban canopy parameters. J. Atmos. Ocean. Technol. 2012, 29, 328–346. [Google Scholar] [CrossRef]
  26. Niyogi, D.; Pyle, P.; Lei, M.; Arya, S.P.; Kishtawal, C.M.; Shepherd, M.; Chen, F.; Wolfe, B. Urban modification of thunderstorms: An observational storm climatology and model case study for the Indianapolis urban region. J. Appl. Meteorol. Climatol. 2011, 50, 1129–1144. [Google Scholar] [CrossRef]
  27. Kaufmann, R.K.; Seto, K.C.; Schneider, A.; Liu, Z.; Zhou, L.; Wang, W. Climate response to rapid urban growth: Evidence of a human-induced precipitation deficit. J. Clim. 2007, 20, 2299–2306. [Google Scholar] [CrossRef]
  28. Guo, X.L.; Fu, D.H.; Wang, J. Mesoscale convective precipitation system modified by urbanization in Beijing City. Atmos. Res. 2006, 82, 112–126. [Google Scholar] [CrossRef]
  29. Zhang, C.L.; Chen, F.; Miao, S.G.; Li, Q.C.; Xia, X.A.; Xuan, C.Y. Impacts of urban expansion and future green planting on summer precipitation in the Beijing metropolitan area. J. Geophys. Res. 2009, 114, D02116. [Google Scholar] [CrossRef]
  30. Georgescu, M.; Mahalov, A.; Moustaoui, M. Seasonal hydroclimatic impacts of Sun Corridor expansion. Environ. Res. Lett. 2012, 7, 034026. [Google Scholar] [CrossRef]
  31. Wang, J.; Feng, F.; Yan, Z.; Hu, Y.; Jia, G. Nested high-resolution modeling of the impact of urbanization on regional climate in three vast urban agglomerations in China. J. Geophys. Res. 2012, 117, D21103. [Google Scholar] [CrossRef] [Green Version]
  32. Kusaka, H.; Kondo, H.; Kikegawa, Y.; Kimura, F. A simple single-layer urban canopy model for atmospheric models: Comparison with multi-layer and slab models. Bound. Lay. Meteorol. 2001, 101, 329–358. [Google Scholar] [CrossRef]
  33. Kusaka, H.; Kimura, F. Coupling a single-layer urban canopy model with a simple atmospheric model: Impact on urban heat island simulation for an idealized case. J. Meteorol. Soc. Jpn. Ser. II 2004, 82, 67–80. [Google Scholar] [CrossRef] [Green Version]
  34. Wang, Y.; Wu, W.; Zhu, B. Performance comparison pf different urban canopy schemes in WRF model under Chongqing meteorological simulation. Resour. Environ. Yangtze Basin 2013, 22, 1627. (In Chinese) [Google Scholar]
  35. Tao, S.Y. Heavy Rainstorm in China; Beijing Science Press: Beijing, China, 1980; pp. 1–71. (In Chinese) [Google Scholar]
  36. Zhang, J.; Zhou, Y.S.; Shen, X.Y.; Li, X.F. Evolution of dynamic and termal structure and instability condition analysis of extreme precipitation system in Beijing-Tianjin-Hebei on 19 July 2016. Chin. J. Atmos. Sci. 2019, 43, 930–942. (In Chinese) [Google Scholar]
  37. Broxton, P.D.; Zeng, X.; Sulla-Menashe, D.; Troch, P.A. A Global Land Cover Climatology Using MODIS Data. J. Appl. Meteorol. Clim. 2014, 53, 1593–1605. [Google Scholar] [CrossRef]
  38. Kain, J.S. The Kain-Fritsch convective parameterization: An update. J. Appl. Meteorol. 2004, 43, 170–181. [Google Scholar] [CrossRef] [Green Version]
  39. Bougeault, P.; Lacarrere, P. Parameterization of orography-induced turbulence in a mesobeta-scale model. Mon. Weather Rev. 1989, 117, 1872–1890. [Google Scholar] [CrossRef]
  40. Chen, F.; Dudhia, J. Coupling an Advanced Land Surface Hydrology Model with the Penn State NCAR MM5 Modeling System. Part I: Model Implementation and Sensitivity. Mon. Weather Rev. 2001, 129, 569–585. [Google Scholar] [CrossRef] [Green Version]
  41. Martilli, A.; Clappier, A.; Rotach, M.W. An Urban Surface Exchange Parameterisation for Mesoscale Models. Bound. Lay. Meteorol. 2002, 104, 261–304. [Google Scholar] [CrossRef]
  42. Wang, J.; Feng, J.; Yan, Z. Potential sensitivity of warm season precipitation to urbanization extents: Modeling study in Beijing-Tianjin-Hebei urban agglomeration in China. J. Geophys. Res. Atmos. 2015, 120, 9408–9425. [Google Scholar] [CrossRef]
  43. Liu, K.; Su, H.; Li, X. Comparative assessment of two vegetation fractional cover estimating methods and their impacts on modeling urban latent heat flux using Landsat imagery. Remote Sens. 2017, 9, 455. [Google Scholar] [CrossRef] [Green Version]
Figure 1. Domain configuration and location of the study area.
Atmosphere 11 00945 g001
Figure 2. Land-use maps for D3 for the three experiments using the WRF/BEP model. (a) No urban test; (b) Urban06 test; (c) Urban16 test. 1—Evergreen Needleleaf; 2—Evergreen Broadleaf; 3—Deciduous Needleleaf; 4—Deciduous Broadleaf; 5—Mixed Forest; 6—Closed Shrubland; 7—Open Shrubland; 8—Woody Savanna; 9—Savannas; 10—Grassland; 11—Permanent Wetlands; 12—Cropland; 13—Urban and Built-up; 14—Cropland Mosaics; 15—Snow and Ice; 16—Bare Soil and Rocks; 17—Water Bodies; 18—Wooded Tundra; 19—Mixed Tundra; 20—Barren Tundra.
Atmosphere 11 00945 g002
Figure 3. The observed and simulated 6 h accumulated precipitation in the heavy precipitation stage from 02:00 UTC to 08:00 UTC on 20 July 2016. (a) Observed; (b) No urban test; (c) Urban06 test; (d) Urban16 test (units: mm).
Atmosphere 11 00945 g003
Figure 4. The average hourly rainfall changes from 18:00 UTC 19 July 2016 to 00:00 UTC 21 July 2016 relative to (a) Urban06 test and No urban test; (b) difference between the Urban16 test and No urban test (units: mm).
Atmosphere 11 00945 g004
Figure 5. Changes in average precipitation over time for the D3 region for the three experiments from 13:00 UTC 19 July 2016 to 00:00 UTC 21 July 2016 (units: mm).
Atmosphere 11 00945 g005
Figure 6. The 22 °C isotherm in the Urban16 test (black line), Urban06 test (blue line), and No urban test (red line): (a) 00:00 UTC on 20 July; (b) 03:00 UTC on 20 July. The 18 g kg−1 specific humidity line in the Urban16 test (black line), Urban06 test (blue line), and No urban test (red line): (c) 22:00 UTC on 19 July; (d) 01:00 UTC on 20 July. The purple shading shows the urban area of the Urban16 test.
Atmosphere 11 00945 g006
Figure 7. Changes in surface air temperature (°C) during the early period of precipitation (from 18:00 UTC on 19 July 2016 to 00:00 UTC on 20 July 2016). (a) Between the Urban06 test and No urban test; (b) between the Urban16 test and No urban test. (c,d) Same as (a,b) but for the mean surface sensible heat flux (shading; units: W m−2) and surface wind (vector; units: m s−1).
Atmosphere 11 00945 g007
Figure 8. Changes in surface specific humidity (g kg−1) during the early period of precipitation (from 18:00 UTC on 19 July 2016 to 00:00 UTC on 20 July 2016). (a) Between the Urban06 test and No urban test; (b) between the Urban16 test and No urban test. (c,d) Same as (a,b) but for the atmospheric boundary layer height (units: m).
Atmosphere 11 00945 g008
Figure 9. Cross section of vertical velocity (shading; units: Pa s−1) and wind vector along the blue line in Figure 2c on 06:00 UTC on 20 July 2016. (a) No urban test; (b) Urban06 test; (c) Urban16 test. The pink line shows the urban areas.
Atmosphere 11 00945 g009
Table 1. Weather Research and Forecasting (WRF)/multilayer urban canopy (BEP) model settings.
Model ParametersD1D2D3
Simulated time2016-07-19 12:00 UTC to 2016-07-21 00:00 UTC
Grid interval (km)9 km3 km1 km
Horizontal grids300 × 300367 × 367367 × 409
PBLBougeault–Lacarrere (BouLac)
MicrophysicsPurdue-Lin
LW radiationRRTMG
LSMNoah LSM + BEP
CumulusKain–FritschNone
Table 2. Settings for sensitivity tests.
Simulation ExperimentsTypes of Land Use
No urbanReplant the the city as farmland
Urban 06Using 2006 MODIS land-use type data
Urban 16Using 2016 MODIS land-use type data

