Chemical Characteristics of Major Inorganic Ions in PM2.5 Based on Year-Long Observations in Guiyang, Southwest China—Implications for Formation Pathways and the Influences of Regional Transport

Abstract
1. Introduction
2. Materials and Methodology
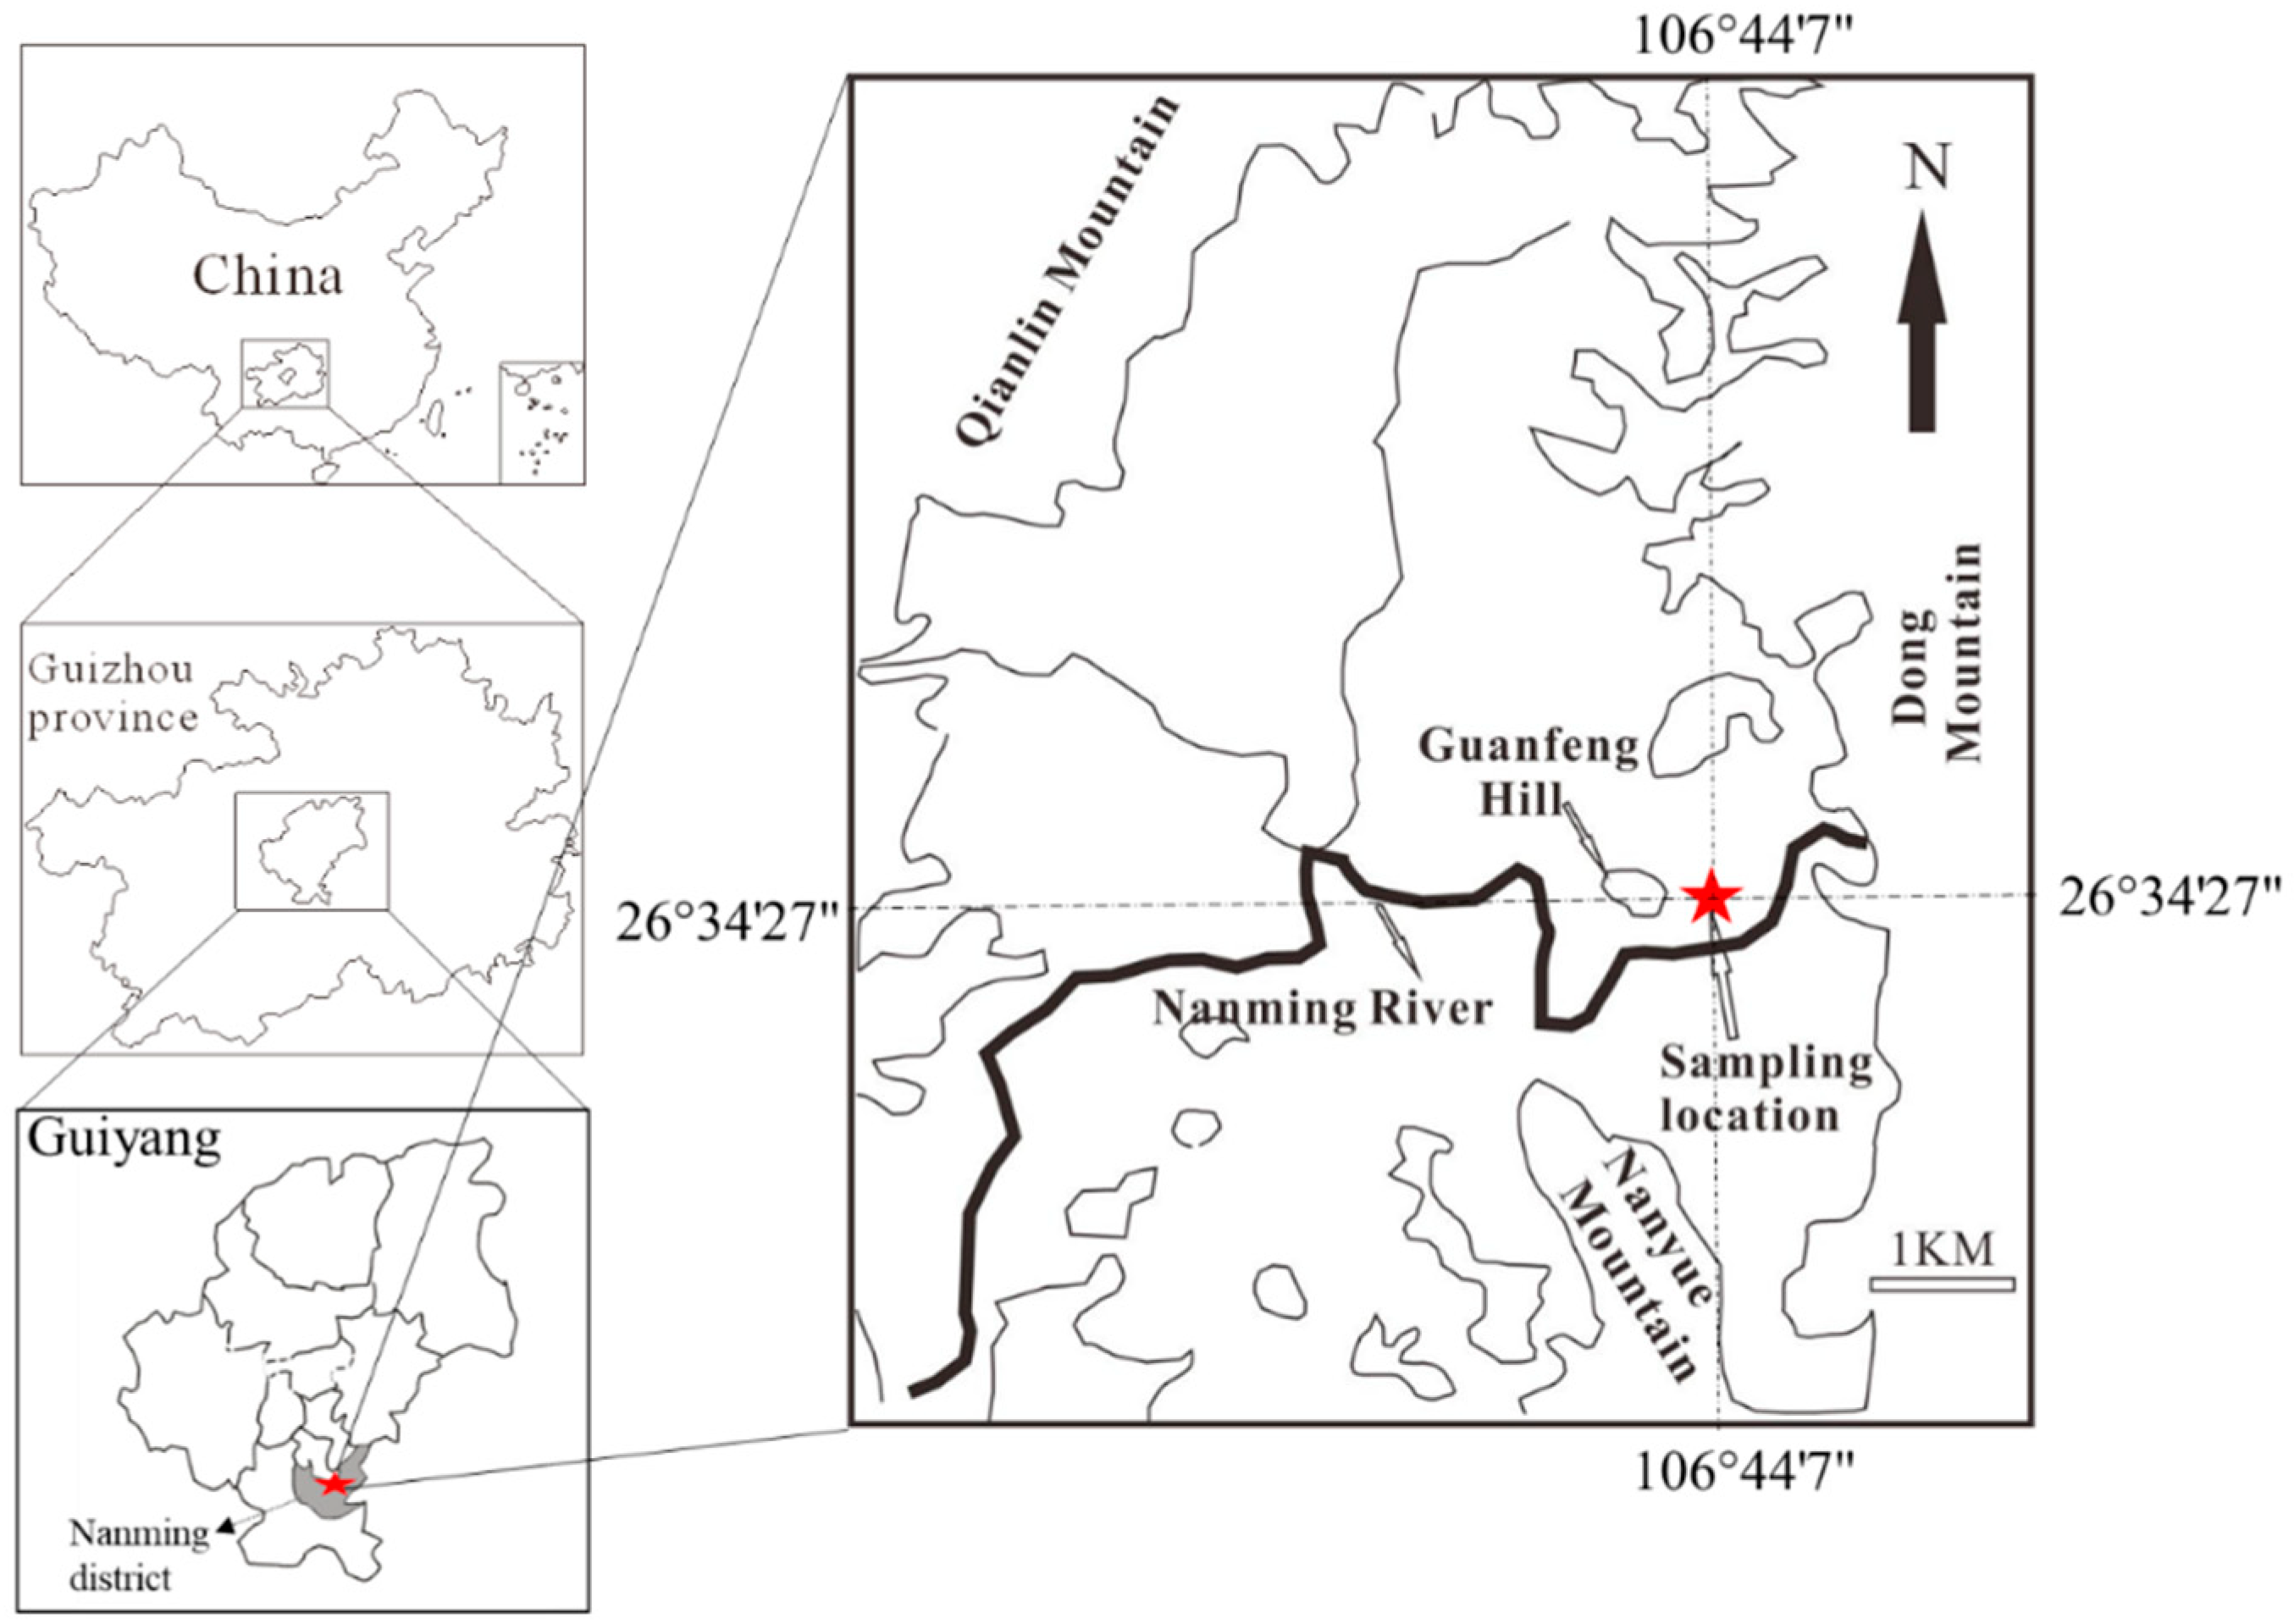
2.1. Description of the Location and Sample Collection
2.2. Chemical Analysis
2.3. The Backward Trajectories and Meteorological Data
2.4. Statistical Analyses
3. Results and Discussion
3.1. Characteristics and Seasonal Variations of PM2.5 and Major Ions
3.1.1. PM2.5
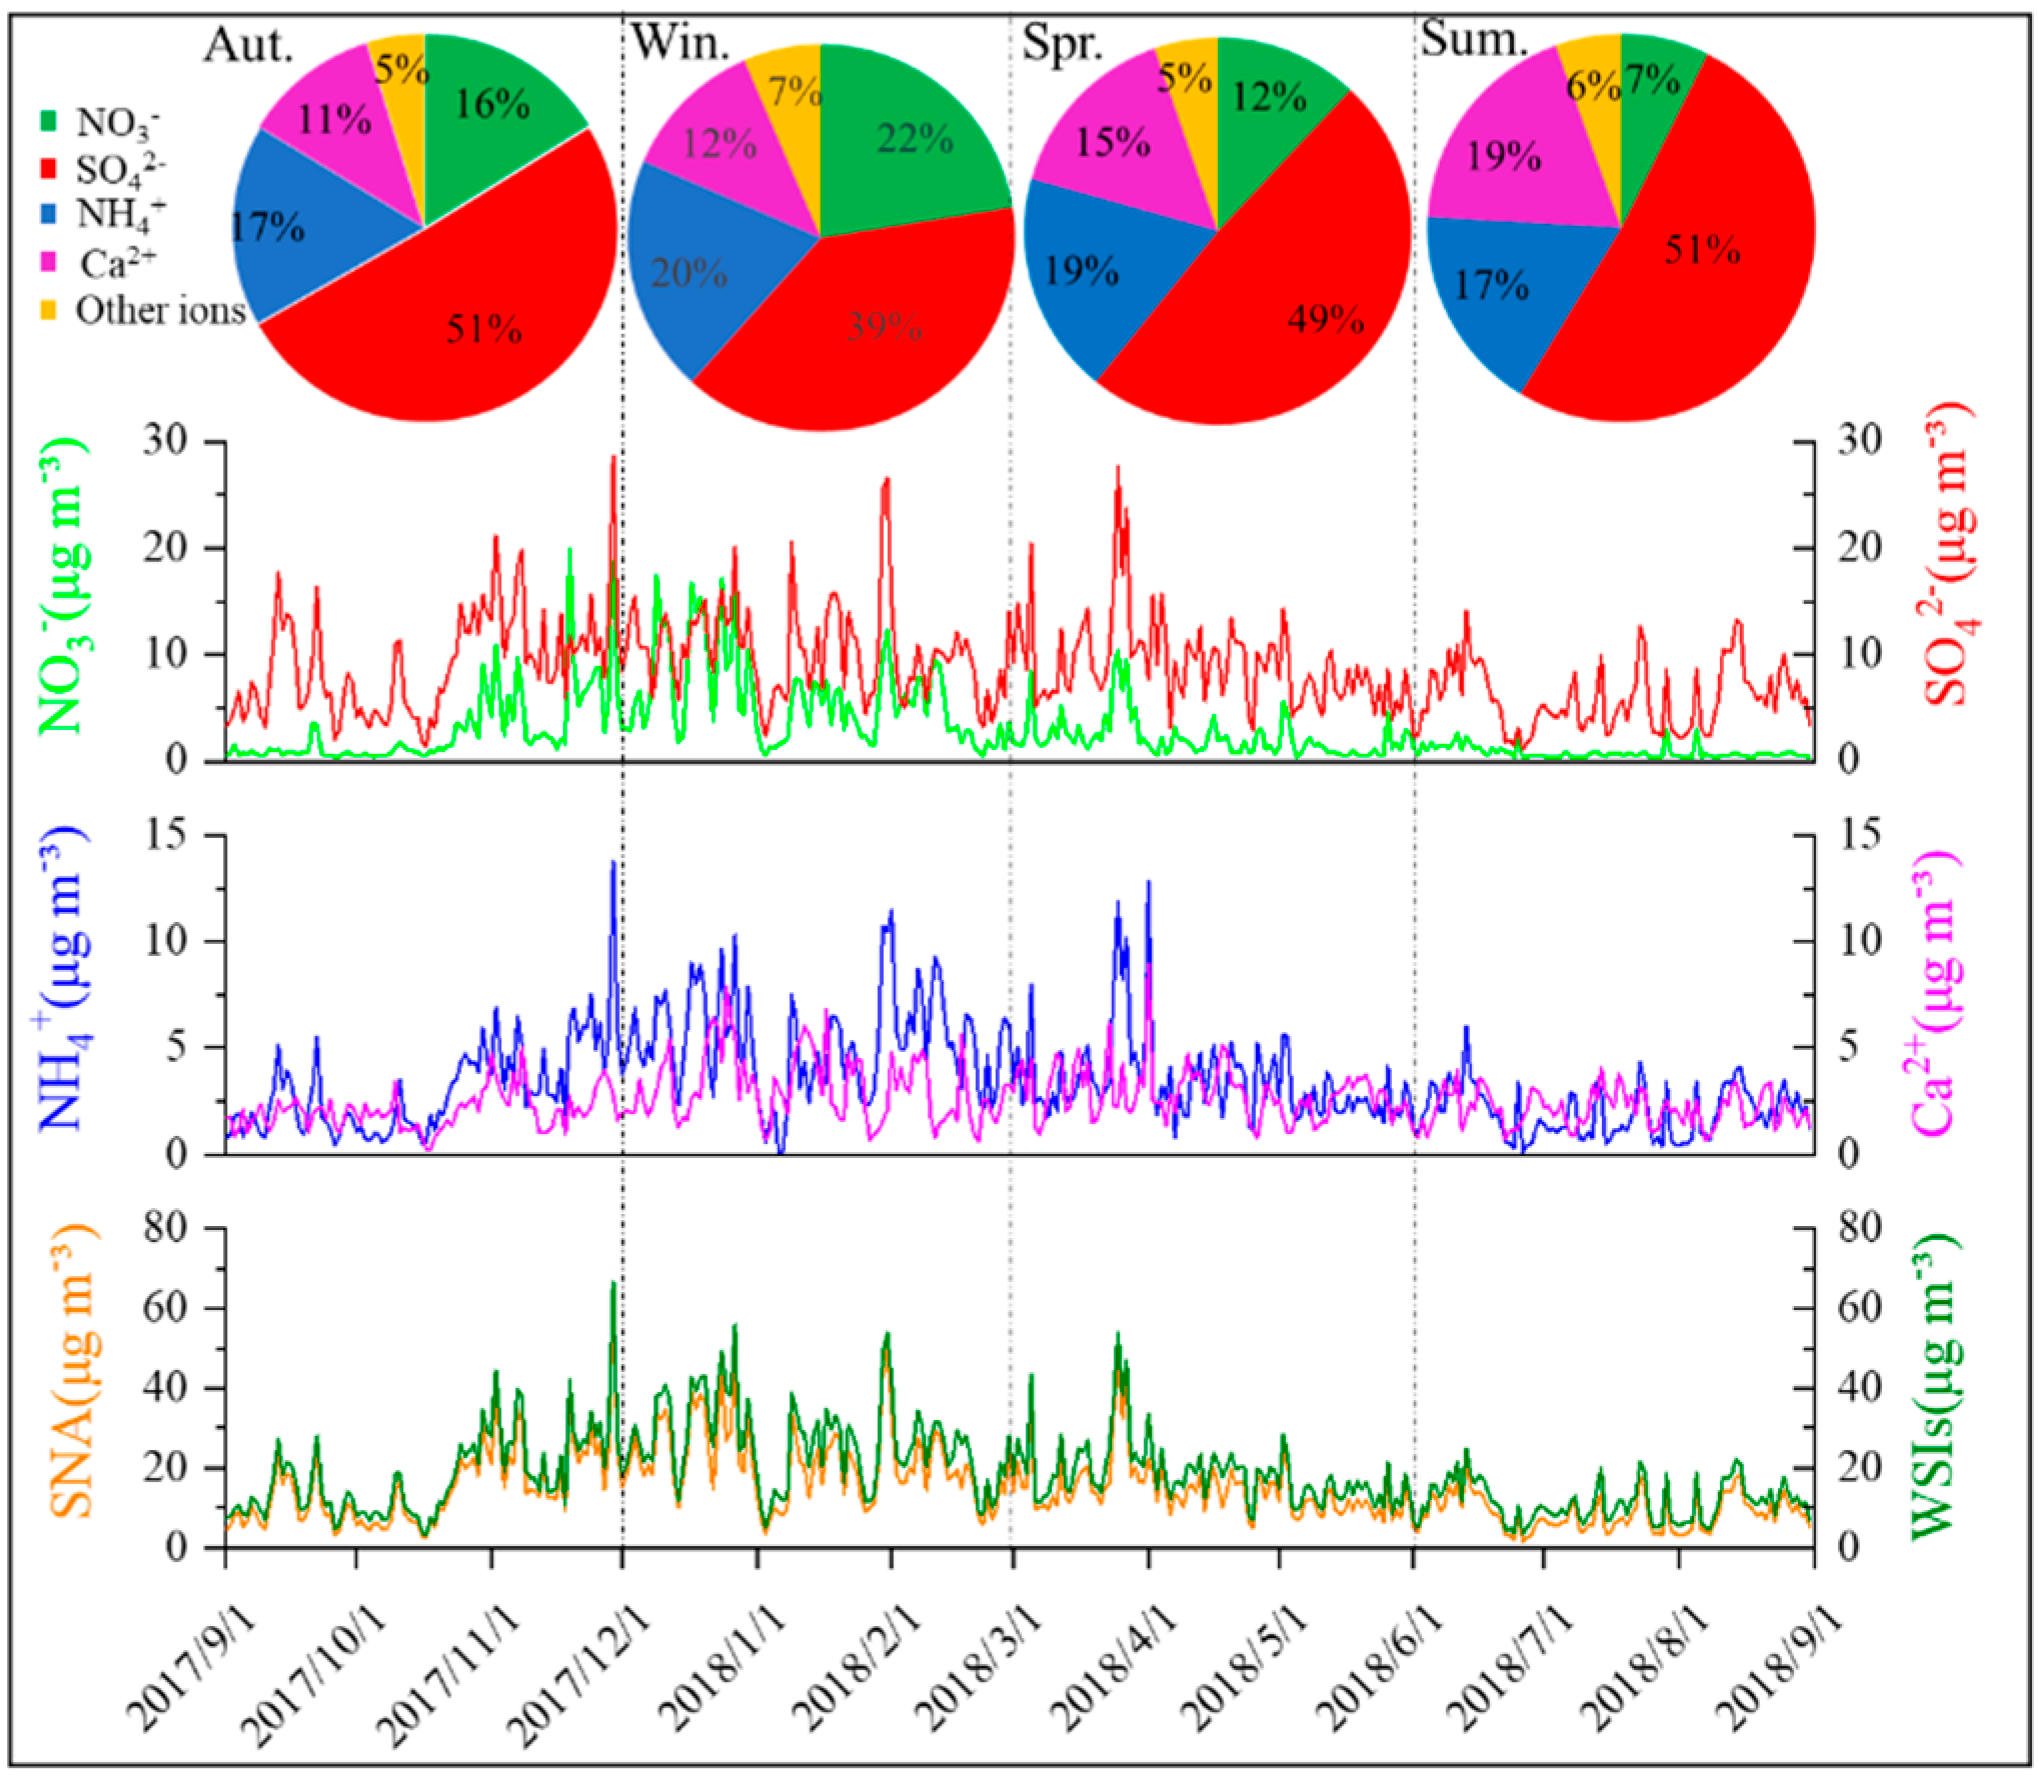
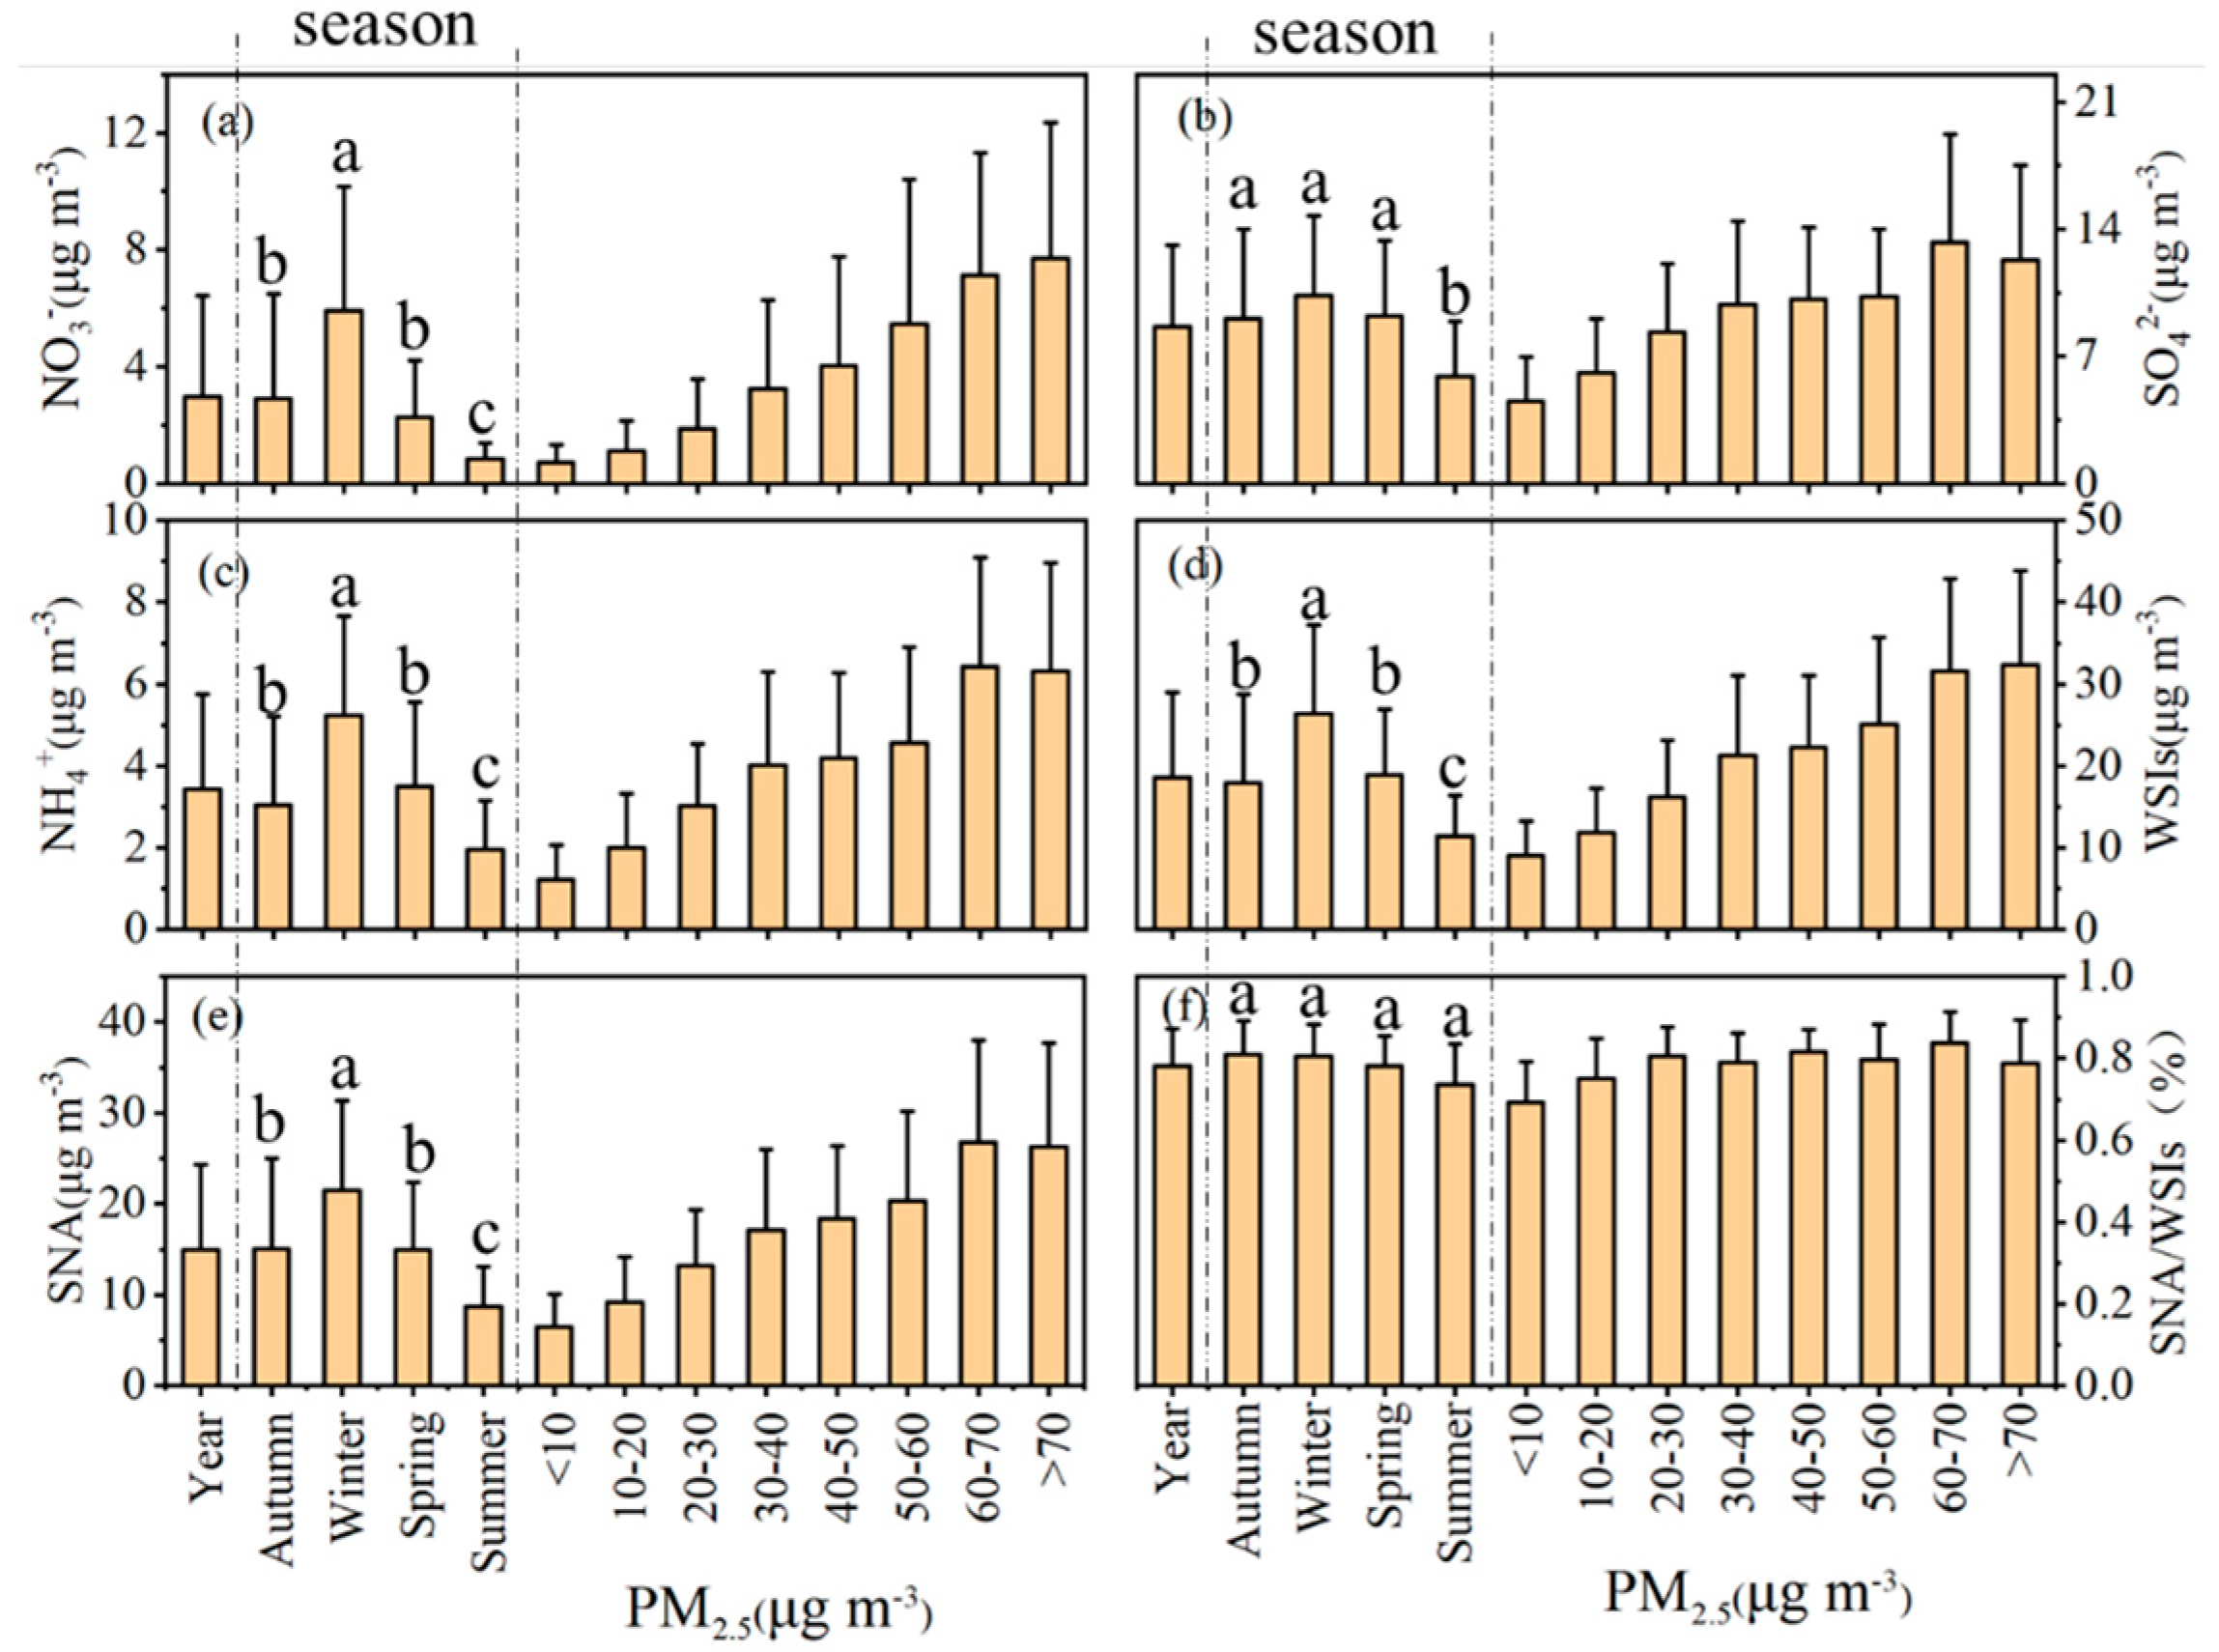
3.1.2. Major Inorganic Ions
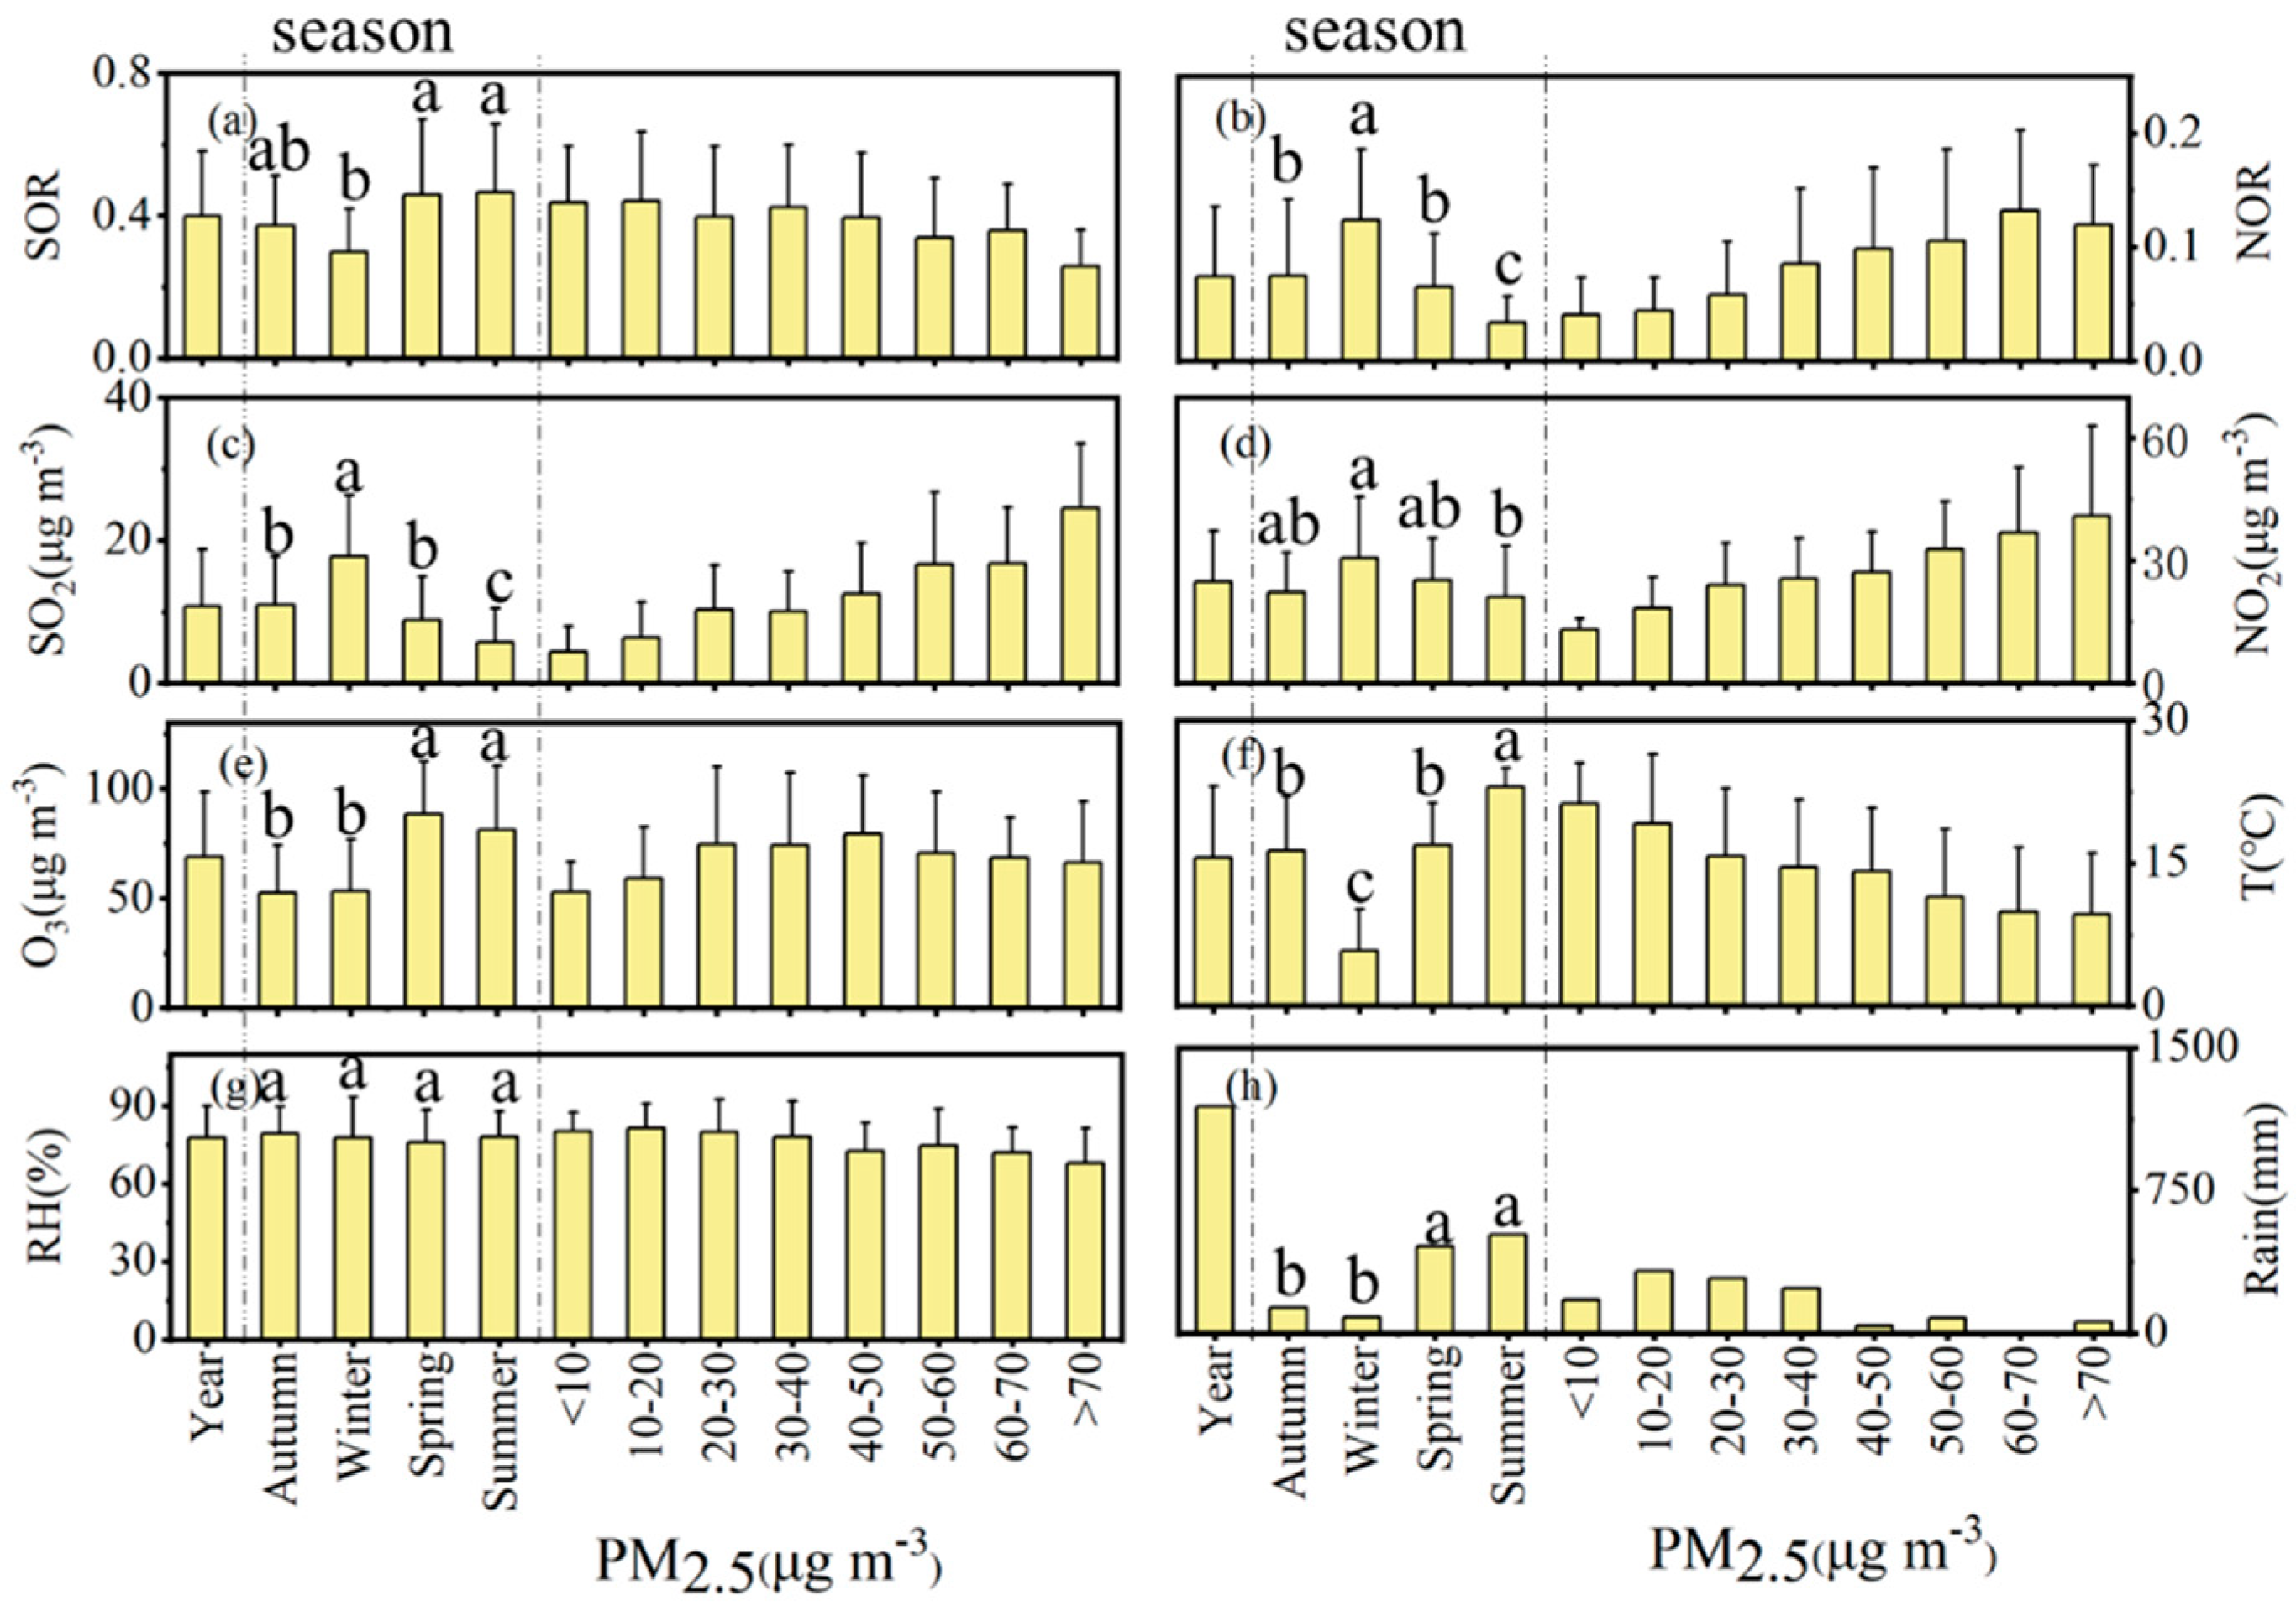
3.2. Formation Mechanisms of SO42− and NO3−
3.2.1. SO42−
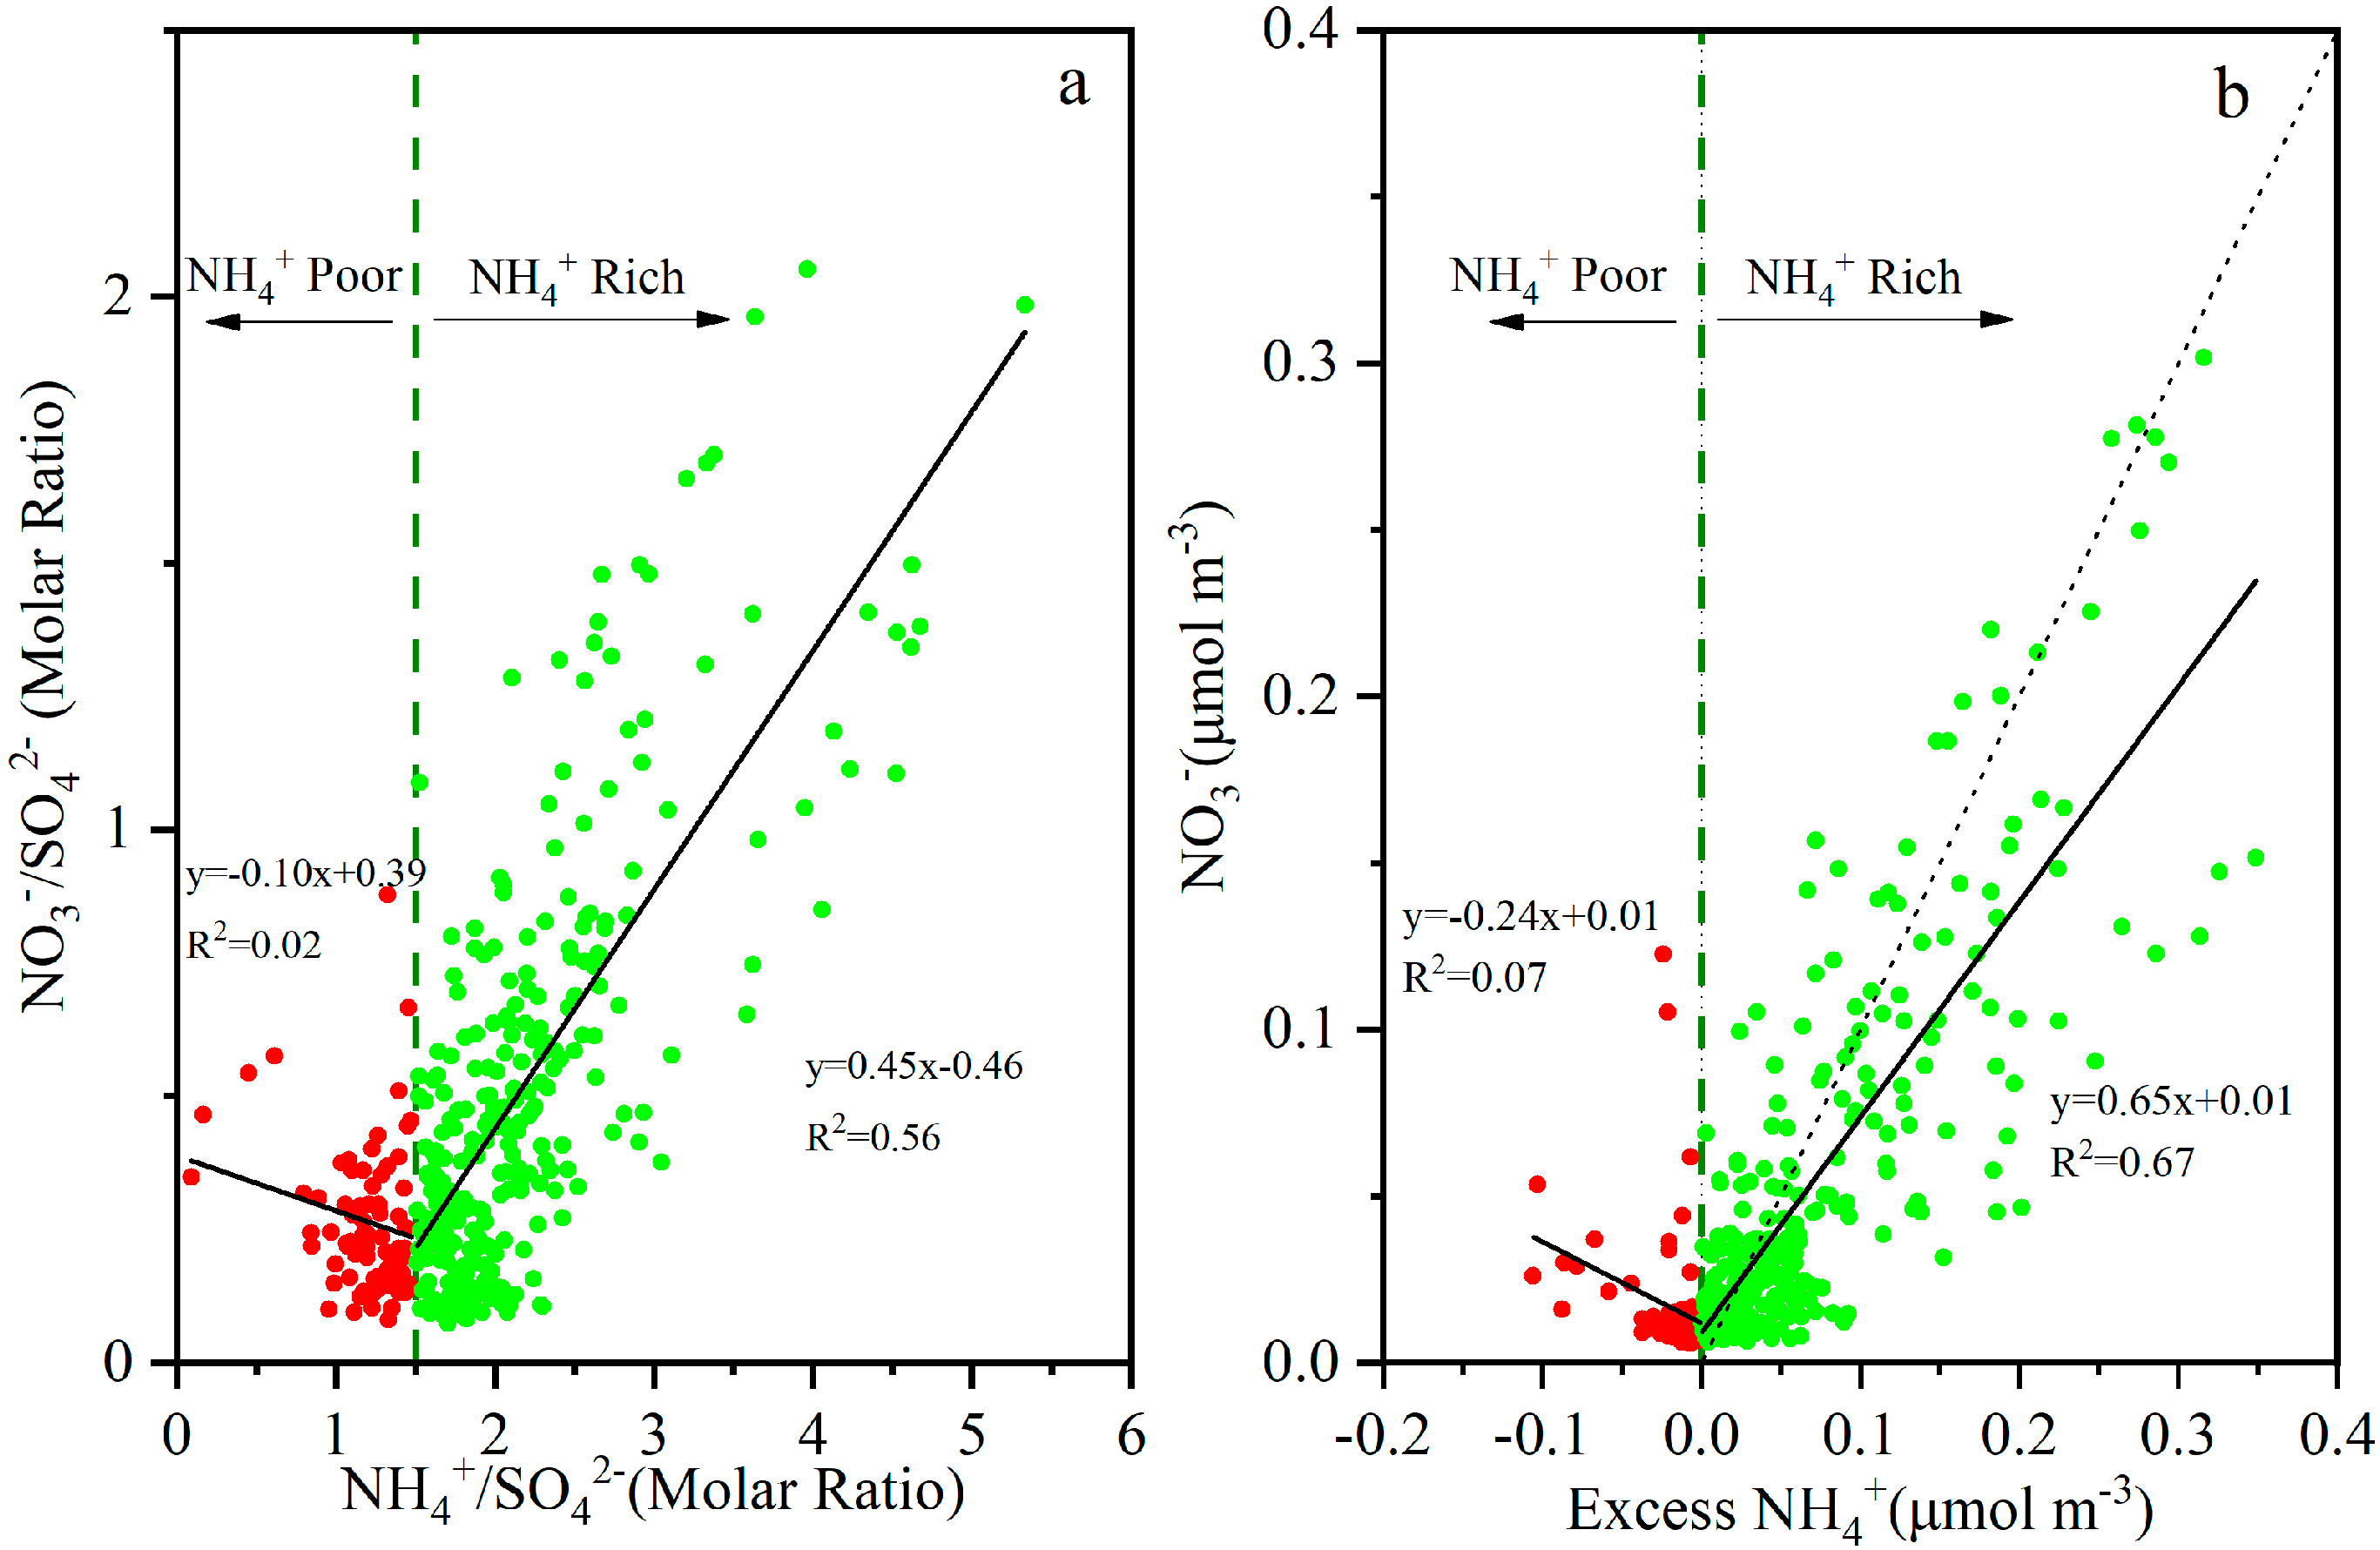
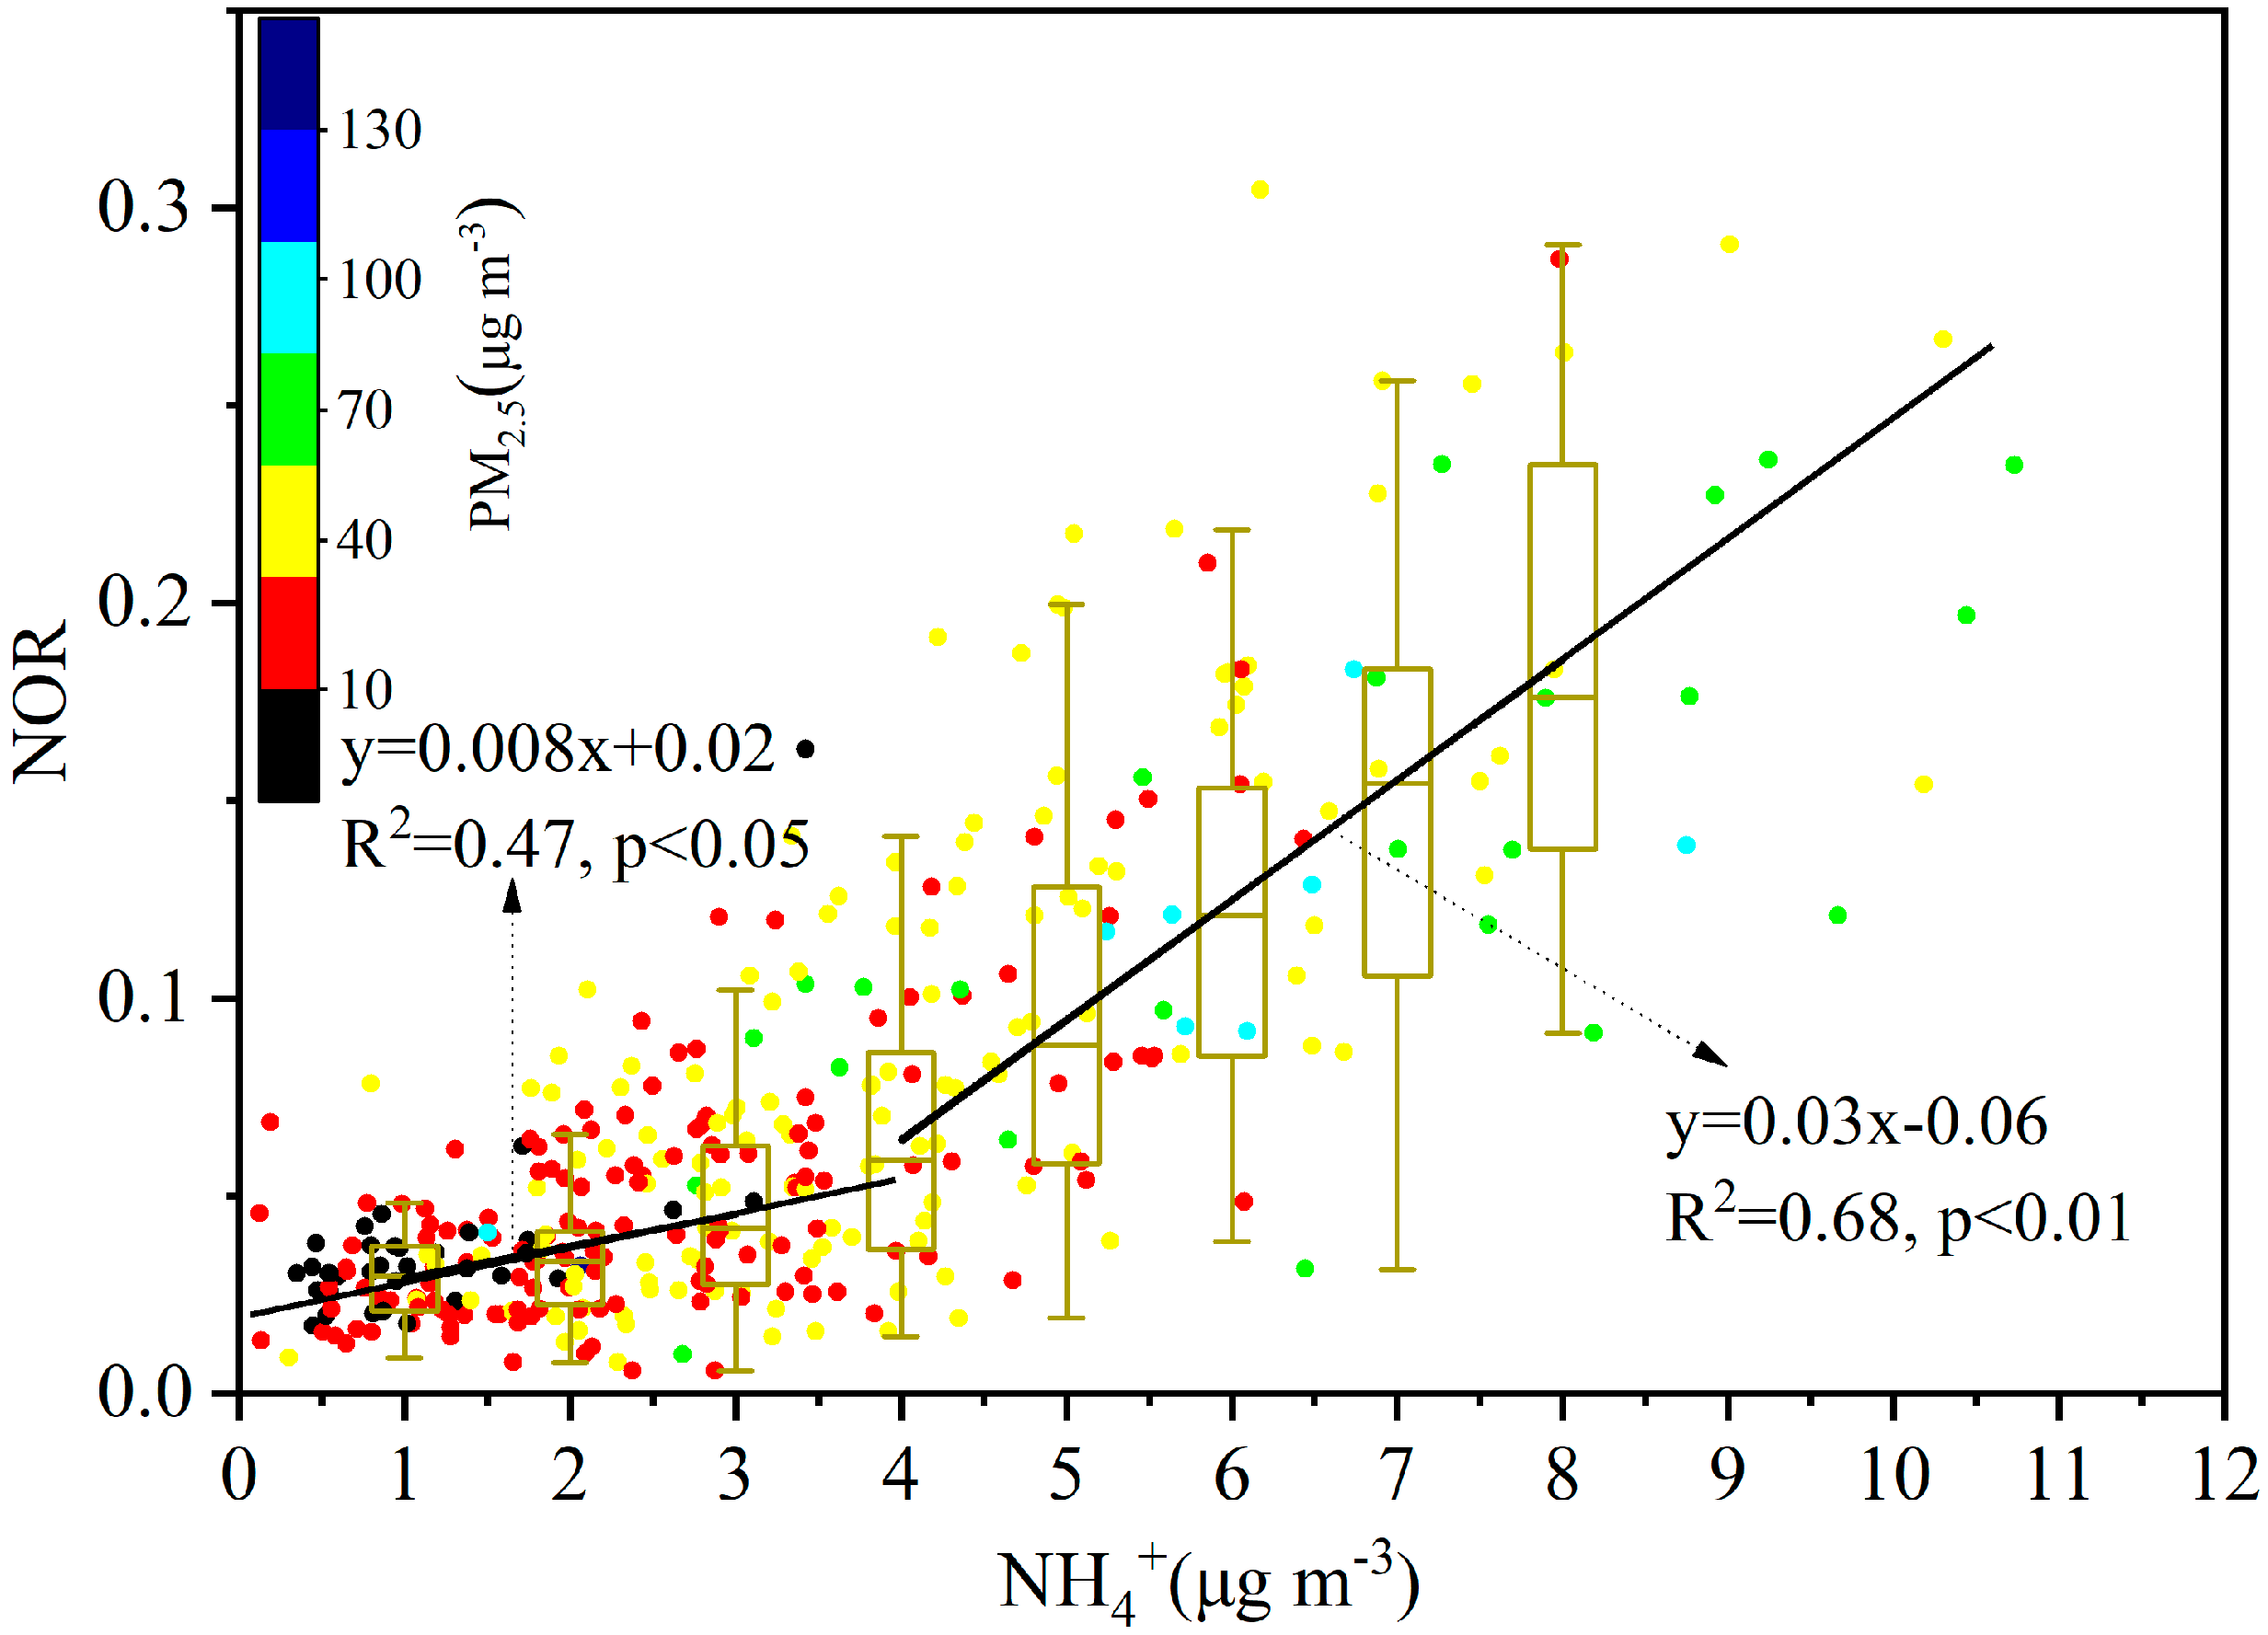
3.2.2. NO3−
3.3. The Clustering Analysis of Backward Trajectory
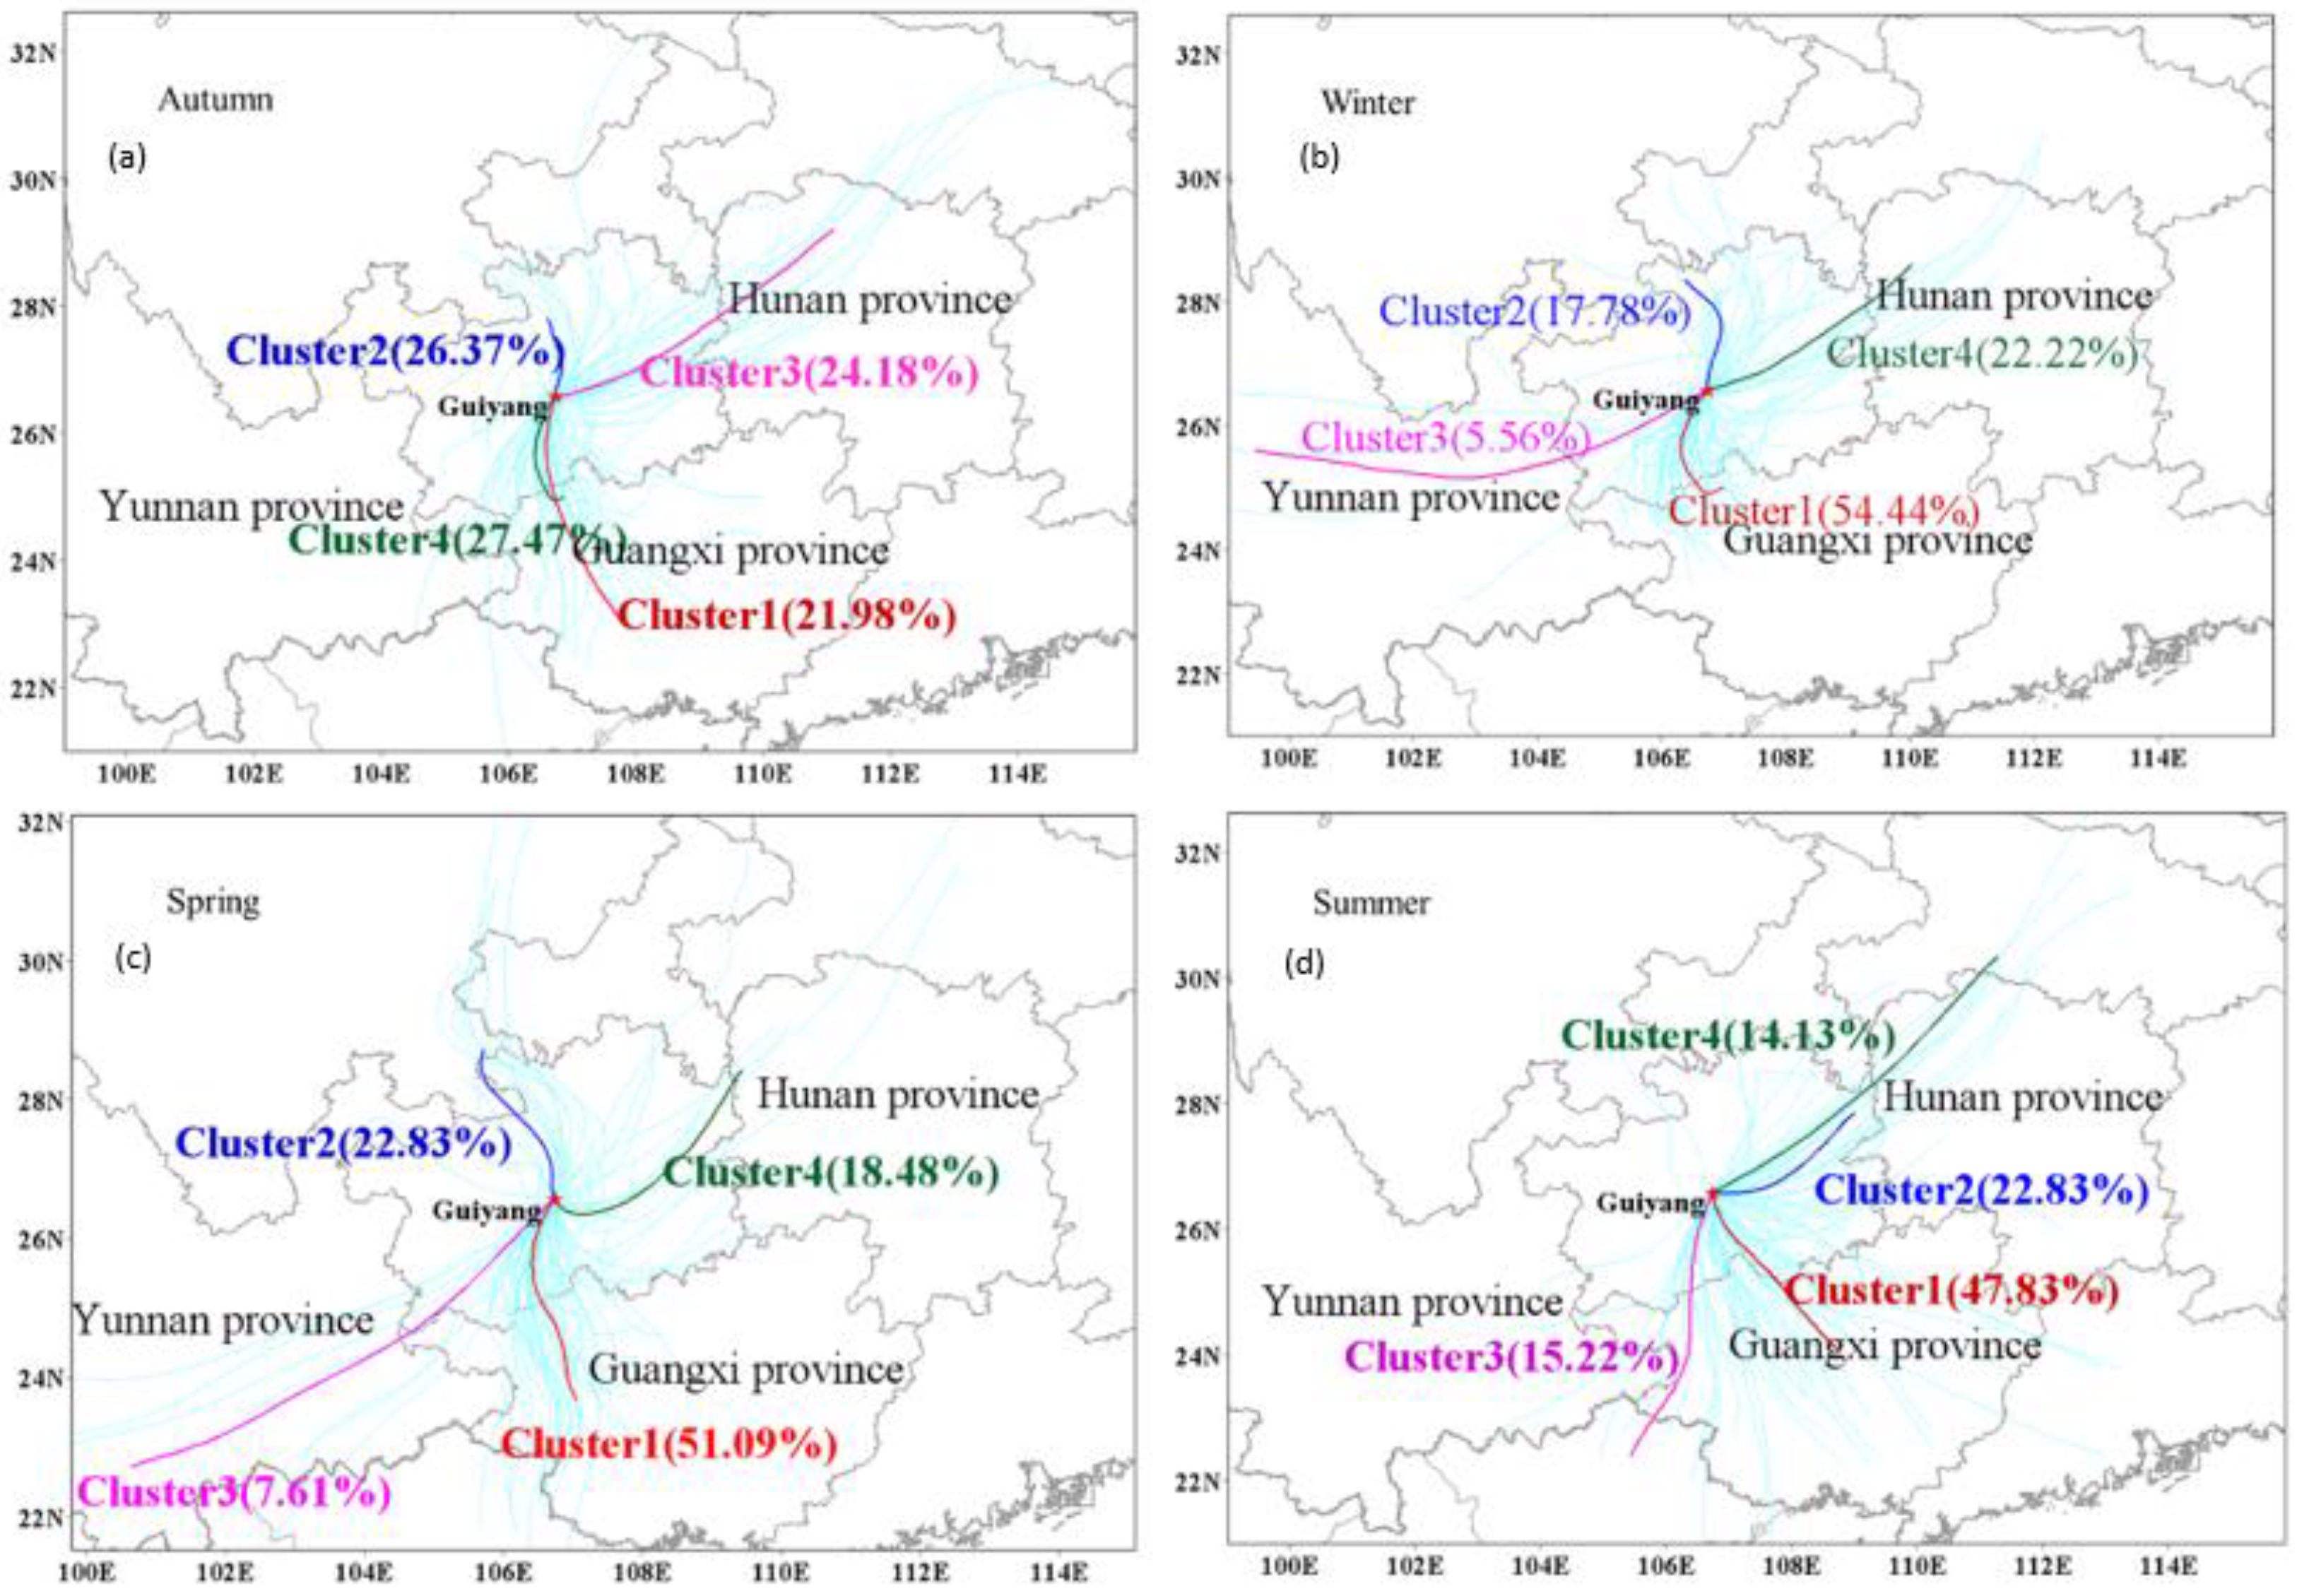
3.3.1. Trajectory Clustering
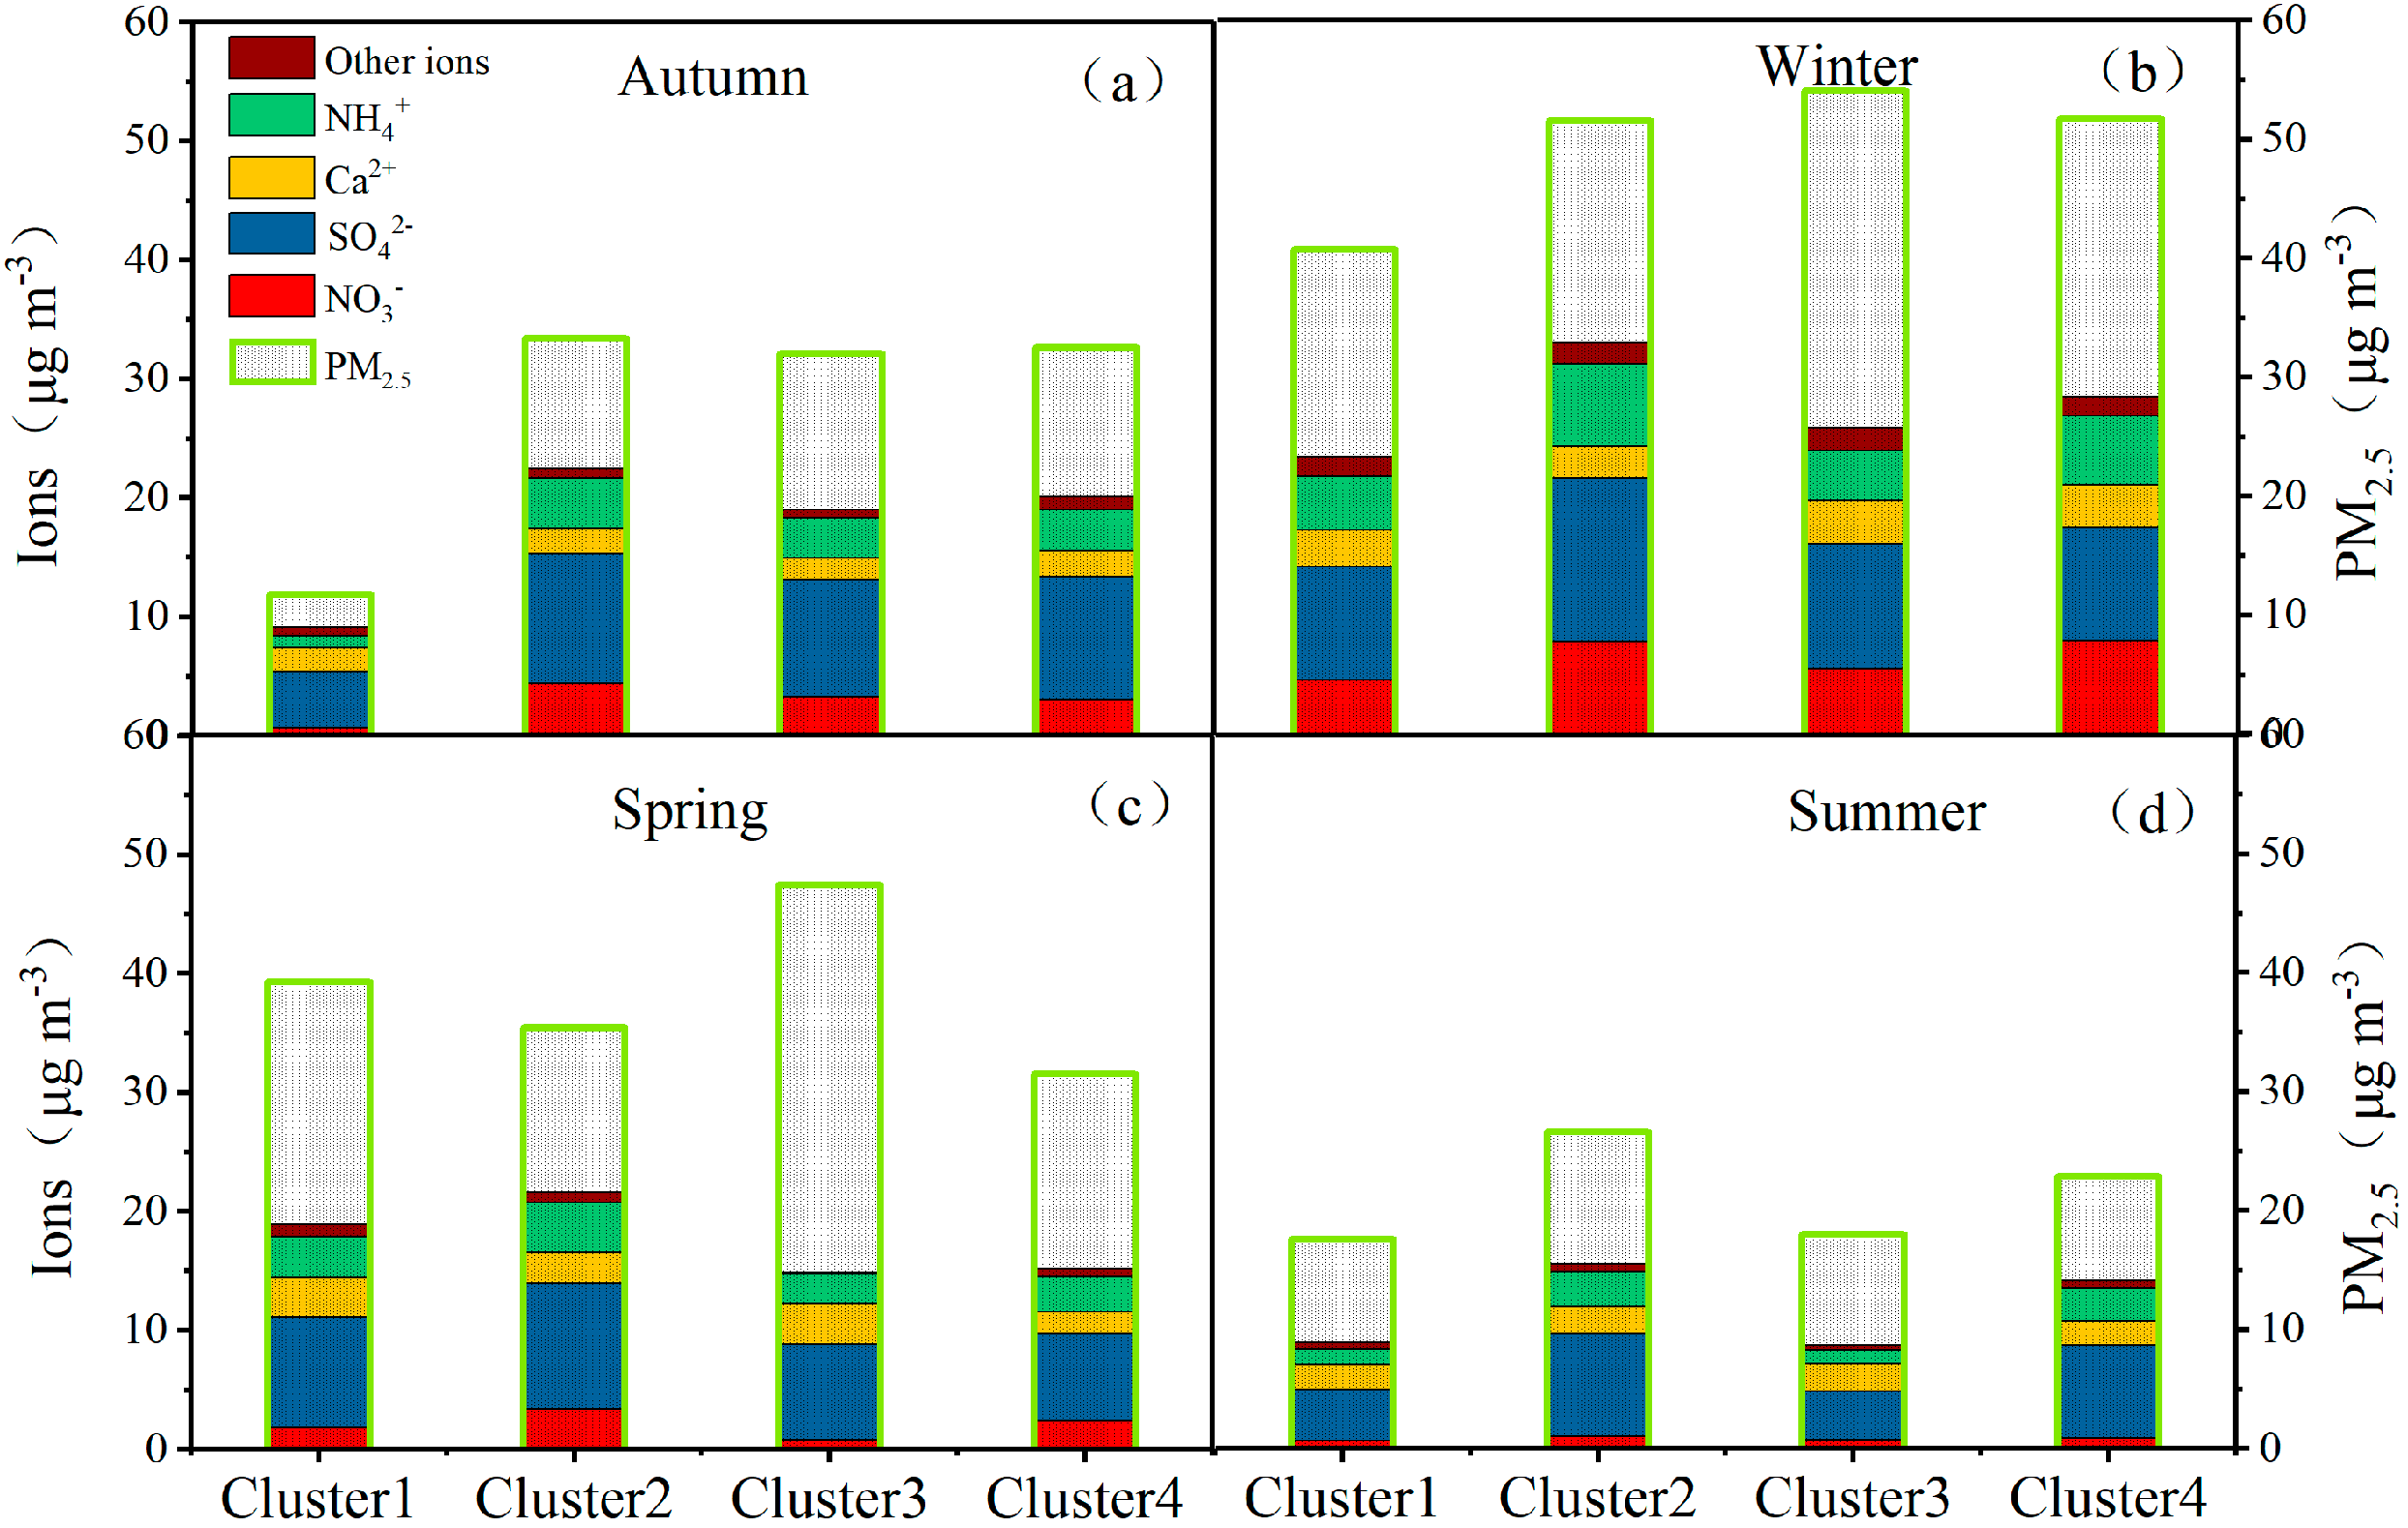
3.3.2. The Corresponding Concentrations of Species
4. Conclusions
Supplementary Materials
Author Contributions
Funding
Acknowledgments
Conflicts of Interest
References
- He, J.; Balasubramanian, R.; Burger, D.F.; Hicks, K.; Kuylenstierna, J.C.I.; Palani, S. Dry and wet atmospheric deposition of nitrogen and phosphorus in singapore. Atmos. Environ. 2011, 45, 2760–2768. [Google Scholar] [CrossRef]
- Xu, L.; Lingaswamy, A.P.; Zhang, Y.; Liu, L.; Wang, Y.; Zhang, J.; Ma, Q.; Li, W. Morphology, composition, and sources of individual aerosol particles at a regional background site of the yrd, china. J. Environ. Sci. 2019, 77, 354–362. [Google Scholar] [CrossRef] [PubMed]
- Tang, X.; Chen, X.; Tian, Y. Chemical composition and source apportionment of PM2.5—A case study from one year continuous sampling in the chang-zhu-tan urban agglomeration. Atmos. Pollut. Res. 2017, 8, 885–899. [Google Scholar] [CrossRef]
- Tao, J.; Gao, J.; Zhang, L.; Zhang, R.; Che, H.; Zhang, Z.; Lin, Z.; Jing, J.; Cao, J.; Hsu, S.C. PM2.5 pollution in a megacity of southwest China: Source apportionment and implication. Atmos. Chem. Phys. 2014, 14, 8679–8699. [Google Scholar] [CrossRef]
- Zhang, F.; Cheng, H.-R.; Wang, Z.-W.; Lv, X.-P.; Zhu, Z.-M.; Zhang, G.; Wang, X.-M. Fine particles (PM2.5) at a cawnet background site in central china: Chemical compositions, seasonal variations and regional pollution events. Atmos. Environ. 2014, 86, 193–202. [Google Scholar] [CrossRef]
- Zhang, R.; Jing, J.; Tao, J.; Hsu, S.-C.; Wang, G.; Cao, J.; Lee, C.S.L.; Zhu, L.; Chen, Z.; Zhao, Y. Chemical characterization and source apportionment of PM2.5 in beijing: Seasonal perspective. Atmos. Chem. Phys. Discuss. 2013, 13, 9953–10007. [Google Scholar] [CrossRef]
- He, K.; Zhao, Q.; Ma, Y.; Duan, F.; Yang, F.; Shi, Z.; Chen, G. Spatial and seasonal variability of PM2. 5 acidity at two Chinese megacities: Insights into the formation of secondary inorganic aerosols. Atmos. Chem. Phys. 2012, 12, 1377–1395. [Google Scholar] [CrossRef]
- Xu, J.S.; Xu, M.X.; Snape, C.; He, J.; Behera, S.N.; Xu, H.H.; Ji, D.S.; Wang, C.J.; Yu, H.; Xiao, H. Temporal and spatial variation in major ion chemistry and source identification of secondary inorganic aerosols in northern Zhejiang province, China. Chemosphere 2017, 179, 316–330. [Google Scholar] [CrossRef]
- Pathak, R.K.; Wu, W.S.; Wang, T. Summertime PM2.5 ionic species in four major cities of China: Nitrate formation in an ammonia-deficient atmosphere. Atmos. Chem. Phys. 2008, 9, 1711–1722. [Google Scholar] [CrossRef]
- Tian, M.; Wang, H.B.; Chen, Y.; Yang, F.M.; He, K.B. Characteristics of aerosol pollution during heavy haze events in Suzhou, China. Atmos. Chem. Phys. 2015, 16, 7357–7371. [Google Scholar] [CrossRef]
- Tao, J.; Zhang, L.; Zhang, R.; Cao, J. A review of current knowledge concerning PM2.5 chemical composition, aerosol optical properties, and their relationships across China. Atmos. Chem. Phys. 2017, 17, 1–70. [Google Scholar] [CrossRef]
- Jeong, J.-H.; Shon, Z.-H.; Kang, M.; Song, S.-K.; Kim, Y.-K.; Park, J.; Kim, H. Comparison of source apportionment of PM2.5 using receptor models in the main hub port city of east Asia: Busan. Atmos. Environ. 2017, 148, 115–127. [Google Scholar] [CrossRef]
- Liu, B.; Na, S.; Dai, Q.; Mei, R.; Sui, B.; Bi, X.; Feng, Y. Chemical composition and source apportionment of ambient PM2.5 during the non-heating period in Taian, China. Atmos. Res. 2016, 170, 23–33. [Google Scholar] [CrossRef]
- Huang, X.; Zhang, J.; Luo, B.; Wang, L.; Tang, G.; Liu, Z.; Song, H.; Zhang, W.; Yuan, L.; Wang, Y. Water-soluble ions in PM2.5 during spring haze and dust periods in Chengdu, China: Variations, nitrate formation and potential source areas. Environ. Pollut. 2018, 243, 1740–1749. [Google Scholar] [CrossRef] [PubMed]
- Xu, L.; Duan, F.; He, K.; Ma, Y.; Zhu, L.; Zheng, Y.; Huang, T.; Kimoto, T.; Ma, T.; Li, H. Characteristics of the secondary water-soluble ions in a typical autumn haze in Beijing. Environ. Pollut. 2017, 227, 296–305. [Google Scholar] [CrossRef]
- Zhou, M.; Zhang, Y.; Han, Y.; Wu, J.; Du, X.; Xu, H.; Feng, Y.; Han, S. Spatial and temporal characteristics of PM2.5 acidity during autumn in marine and coastal area of Bohai sea, China, based on two-site contrast. Atmos. Res. 2018, 202, 196–204. [Google Scholar] [CrossRef]
- Huang, X.; Liu, Z.; Liu, J.; Bo, H.; Wang, Y. Chemical characterization and source identification of PM2.5 at multiple sites in the Beijing-Tianjin-Hebei region, China. Atmos. Chem. Phys. 2017, 17, 12941–12962. [Google Scholar] [CrossRef]
- Li, J.; Du, H.; Wang, Z.; Sun, Y.; Yang, W.; Li, J.; Tang, X.; Fu, P. Rapid formation of a severe regional winter haze episode over a mega-city cluster on the north China plain. Environ. Pollut. 2017, 223, 605–615. [Google Scholar] [CrossRef]
- Wang, H.L.; Qiao, L.P.; Lou, S.R.; Zhou, M.; Ding, A.J.; Huang, H.Y.; Chen, J.M.; Wang, Q.; Tao, S.K.; Chen, C.H. Chemical composition of PM2.5 and meteorological impact among three years in urban Shanghai, China. J. Clean. Prod. 2016, 112, 1302–1311. [Google Scholar] [CrossRef]
- Tao, J.; Cheng, T.T.; Zhang, R.J. Chemical composition of summertime pmand its relationship to aerosol optical properties in Guangzhou, China. Atmos. Ocean. Sci. Lett. 2015, 5, 88–94. [Google Scholar]
- Guo, W.; Zhang, Z.; Zheng, N.; Luo, L.; Xiao, H.; Xiao, H. Chemical characterization and source analysis of water-soluble inorganic ions in PM2.5 from a plateau city of Kunming at different seasons. Atmos. Res. 2020, 234, 104687. [Google Scholar] [CrossRef]
- Liang, L.; Na, L.; Landis, M.S.; Xu, X.; Feng, X.; Zhuo, C.; Shang, L.; Qiu, G. Chemical characterization and sources of PM2.5 at 12-h resolution in guiyang, china. Acta Geochim. 2018, 37, 334–345. [Google Scholar] [CrossRef]
- Xiao, H.Y.; Liu, C.Q. Chemical characteristics of water-soluble components in TSP over Guiyang, sw China, 2003. Atmos. Environ. 2004, 38, 6297–6306. [Google Scholar] [CrossRef]
- Xiao, H.W.; Xiao, H.Y.; Long, A.M.; Wang, Y.L.; Liu, C.Q. Chemical composition and source apportionment of rainwater at Guiyang, sw China. J. Atmos. Chem. 2013, 70, 269–281. [Google Scholar] [CrossRef]
- Tian, H.; Qiu, P.; Cheng, K.; Gao, J.; Lu, L.; Liu, K.; Liu, X. Current status and future trends of SO2 and NOx pollution during the 12th FYP period in Guiyang city of China. Atmos. Environ. 2013, 69, 273–280. [Google Scholar] [CrossRef]
- Zhang, Z.; Zeng, Y.; Zheng, N.; Luo, L.; Xiao, H. Fossil fuel-related emissions were the major source of NH3 pollution in urban cities of northern China in the autumn of 2017. Environ. Pollut. 2019, 256, 113428. [Google Scholar] [CrossRef] [PubMed]
- Wang, Y.Q.; Zhang, X.Y.; Draxler, R.R. Trajstat: Gis-based software that uses various trajectory statistical analysis methods to identify potential sources from long-term air pollution measurement data. Environ. Model. Softw. 2009, 24, 938–939. [Google Scholar] [CrossRef]
- Salvador, P.; Artíñano, B.; Pio, C.; Afonso, J.; Legrand, M.; Puxbaum, H.; Hammer, S. Evaluation of aerosol sources at European high altitude background sites with trajectory statistical methods. Atmos. Environ. 2010, 44, 2316–2329. [Google Scholar] [CrossRef]
- Liu, B.; Wu, J.; Zhang, J.; Lu, W.; Yang, J.; Liang, D.; Dai, Q.; Bi, X.; Feng, Y.; Zhang, Y. Characterization and source apportionment of PM2.5 based on error estimation from epa pmf 5.0 model at a medium city in China. Environ. Pollut. 2017, 222, 10–22. [Google Scholar] [CrossRef]
- Wang, X.; Zhang, L.; Moran, M. Uncertainty assessment of current size-resolved parameterizations for below-cloud particle scavenging by rain. Atmos. Chem. Phys. 2010, 10, 5685–5705. [Google Scholar] [CrossRef]
- Chang, C.C.; Yuan, C.S.; Li, T.C.; Su, Y.L.; Tong, C.; Wu, S.P. Chemical characteristics, source apportionment, and regional transport of marine fine particles toward offshore islands near the coastline of northwestern Taiwan strait. Environ. Sci. Pollut. Res. 2018, 25, 32332–32345. [Google Scholar] [CrossRef] [PubMed]
- Deng, X.; Shi, C.; Wu, B.; Yang, Y.; Jin, Q.; Wang, H.; Zhu, S.; Yu, C. Characteristics of the water-soluble components of aerosol particles in Hefei, China. J. Environ. Sci. 2016, 42, 32–40. [Google Scholar] [CrossRef] [PubMed]
- Li, J.; Han, Z. Seasonal variation of nitrate concentration and its direct radiative forcing over east Asia. Atmosphere 2016, 7, 105. [Google Scholar] [CrossRef]
- Jansen, R.C.; Yang, S.; Chen, J.; Hu, Y.J.; Chang, X.; Hong, S.; Jiao, L.; Min, Z. Using hourly measurements to explore the role of secondary inorganic aerosol in PM2.5 during haze and fog in Hangzhou, China. Adv. Atmos. Sci. 2014, 31, 1427–1434. [Google Scholar] [CrossRef]
- He, Q.; Yan, Y.; Guo, L.; Zhang, Y.; Zhang, G.; Wang, X. Characterization and source analysis of water-soluble inorganic ionic species in PM2.5 in Taiyuan city, China. Atmos. Res. 2017, 184, 48–55. [Google Scholar] [CrossRef]
- Xu, J.; Wang, Z.; Yu, G.; Qin, X.; Ren, J.; Qin, D. Characteristics of water soluble ionic species in fine particles from a high altitude site on the northern boundary of tibetan plateau: Mixture of mineral dust and anthropogenic aerosol. Atmos. Res. 2014, 143, 43–56. [Google Scholar] [CrossRef]
- Zhao, P.S.; Dong, F.; He, D.; Zhao, X.J.; Zhang, W.Z.; Yao, Q.; Liu, H.Y. Characteristics of concentrations and chemical compositions for PM2.5 in the region of Beijing, Tianjin, and Hebei, China. Atmos. Chem. Phys. 2013, 13, 4631–4644. [Google Scholar] [CrossRef]
- Kundu, S.; Stone, E.A. Composition and sources of fine particulate matter across urban and rural sites in the midwestern united states. Environ. Sci. Process. Impacts 2014, 16, 1360–1370. [Google Scholar] [CrossRef]
- Itahashi, S.; Uno, I.; Osada, K.; Kamiguchi, Y.; Yamamoto, S.; Tamura, K.; Wang, Z.; Kurosaki, Y.; Kanaya, Y. Nitrate transboundary heavy pollution over east Asia in winter. Atmos. Chem. Phys. 2016, 17, 3823–3843. [Google Scholar] [CrossRef]
- Judarezler, K.; Reizer, M.; Maciejewska, K.; Blaszczak, B.; Klejnowski, K. Characterization of atmospheric PM2.5 sources at a central European urban background site. Sci. Total Environ. 2020, 713, 136729. [Google Scholar] [CrossRef]
- Guo, W.; Long, C.; Zhang, Z.; Zheng, N.; Xiao, H.; Xiao, H. Seasonal control of water-soluble inorganic ions in PM2.5 from nanning, a subtropical monsoon climate city in southwestern China. Atmosphere 2019, 11, 5. [Google Scholar] [CrossRef]
- Gawhane, R.D.; Rao, P.S.P.; Budhavant, K.B.; Waghmare, V.; Meshram, D.C.; Safai, P.D. Seasonal variation of chemical composition and source apportionment of PM2.5 in Pune, India. Environ. Sci. Pollut. Res. 2017, 24, 21065–21072. [Google Scholar] [CrossRef] [PubMed]
- Hang, N.T.; Oanh, N.T.K. Chemical characterization and sources apportionment of fine particulate pollution in a mining town of Vietnam. Atmos. Res. 2014, 145, 214–225. [Google Scholar] [CrossRef]
- Kim, Y.; Seo, J.; Kim, J.Y.; Lee, J.Y.; Kim, H.; Kim, B.M. Characterization of PM2.5 and identification of transported secondary and biomass burning contribution in Seoul, Korea. Environ. Sci. Pollut. Res. Int. 2018, 25, 4330–4343. [Google Scholar] [CrossRef]
- Zhao, X.; Zhao, P.; Xu, J.; Meng, W.; Pu, W.; Dong, F.; He, D.; Shi, Q. Analysis of a winter regional haze event and its formation mechanism in the north China plain. Atmos. Chem. Phys. 2013, 13, 5685–5696. [Google Scholar] [CrossRef]
- Hu, G.; Zhang, Y.; Sun, J.; Zhang, L.; Shen, X.; Lin, W.; Yang, Y. Variability, formation and acidity of water-soluble ions in PM2.5 in Beijing based on the semi-continuous observations. Atmos. Res. 2014, 145, 1–11. [Google Scholar] [CrossRef]
- Ohta, S.; Okita, T. A chemical characterization of atmospheric aerosol in Sapporo. Atmos. Environ. Part A Gen. Top. 1990, 24, 815–822. [Google Scholar] [CrossRef]
- Meng, C.C.; Wang, L.T.; Zhang, F.F.; Wei, Z.; Yang, J. Characteristics of concentrations and water-soluble inorganic ions in PM2.5 in Handan city, Hebei province, China. Atmos. Res. 2016, 171, 133–146. [Google Scholar] [CrossRef]
- Voutsa, D.; Samara, C.; Manoli, E.; Lazarou, D.; Tzoumaka, P. Ionic composition of PM2.5 at urban sites of northern Greece: Secondary inorganic aerosol formation. Environ. Sci. Pollut. Res. Int. 2014, 21, 4995–5006. [Google Scholar] [CrossRef]
- Valverde, V.; Pay, M.T.; Baldasano, J.M. A model-based analysis of SO2 and NO2 dynamics from coal-fired power plants under representative synoptic circulation types over the Iberian peninsula. Sci. Total Environ. 2016, 541, 701–713. [Google Scholar] [CrossRef][Green Version]
- Liu, Z.; Hu, B.; Agronomy, C.O.; University, H.A.; Company, W.T. Characteristics of aerosol size distributions and chemical compositions during wintertime pollution episodes in Beijing. Atmos. Res. 2016, 168, 1–12. [Google Scholar] [CrossRef]
- Lin, Y.C.; Cheng, M.-T. Evaluation of formation rates of NO2 to gaseous and particulate nitrate in the urban atmosphere. Atmos. Environ. 2007, 41, 1903–1910. [Google Scholar] [CrossRef]
- Wang, Y.L.; Song, W.; Yang, W.; Sun, X.C.; Tong, Y.D.; Wang, X.M.; Liu, C.Q.; Bai, Z.P.; Liu, X.Y. Influences of atmospheric pollution on the contributions of major oxidation pathways to PM2.5 nitrate formation in Beijing. J. Geophys. Res. Atmos. 2019, 124, 4174–4185. [Google Scholar] [CrossRef]
- Qu, W.; Wang, J.; Zhang, X.; Wang, D.; Sheng, L. Influence of relative humidity on aerosol composition: Impacts on light extinction and visibility impairment at two sites in coastal area of China. Atmos. Res. 2015, 153, 500–511. [Google Scholar] [CrossRef]
- Bäumer, D.; Vogel, B.; Versick, S.; Rinke, R.; Möhler, O.; Schnaiter, M. Relationship of visibility, aerosol optical thickness and aerosol size distribution in an ageing air mass over south-west Germany. Atmos. Environ. 2008, 42, 989–998. [Google Scholar] [CrossRef]
- Pathak, R.K.; Chan, C.K. Inter-particle and gas-particle interactions in sampling artifacts of PM2.5 in filter-based samplers. Atmos. Environ. 2005, 39, 1597–1607. [Google Scholar]
- Wang, S.; Nan, J.; Shi, C.; Fu, Q.; Gao, S.; Wang, D.; Cui, H.; Saiz-Lopez, A.; Zhou, B. Atmospheric ammonia and its impacts on regional air quality over the megacity of Shanghai, China. Sci. Rep. 2015, 5, 15842. [Google Scholar] [CrossRef]
- Karaca, F.; Camci, F. Distant source contributions to PM10 profile evaluated by som based cluster analysis of air mass trajectory sets. Atmos. Environ. 2010, 44, 892–899. [Google Scholar] [CrossRef]
- Gao, X.; Yang, L.; Cheng, S.; Gao, R.; Zhou, Y.; Xue, L.; Shou, Y.; Wang, J.; Wang, X.; Nie, W. Semi-continuous measurement of water-soluble ions in PM2.5 in Jinan, China: Temporal variations and source apportionments. Atmos. Environ. 2011, 45, 6048–6056. [Google Scholar] [CrossRef]
- Zhai, Y.; Liu, X.; Chen, H.; Xu, B.; Zhu, L.; Li, C.; Zeng, G. Source identification and potential ecological risk assessment of heavy metals in PM2.5 from Changsha. Sci. Total Environ. 2014, 493, 109–115. [Google Scholar] [CrossRef]
- Ikeuchi, H.; Murakami, M.; Watanabe, S. Scavenging of PM2.5 by precipitation and the effects of precipitation pattern changes on health risks related to PM2.5 in Tokyo, Japan. Water Sci. Technol. 2015, 72, 1319–1326. [Google Scholar] [CrossRef] [PubMed]


| Species | Autumn | Winter | Spring | Summer | Annual Average |
|---|---|---|---|---|---|
| PM2.5 (μg m−3) | 27.83 ± 19.52 | 45.81 ± 20.49 | 37.41 ± 18.03 | 20.95 ± 10.86 | 33.11 ± 20.00 |
| WSIs (μg m−3) | 17.92 ± 10.79 | 26.26 ± 10.94 | 18.61 ± 8.34 | 11.19 ± 4.98 | 18.52 ± 10.51 |
| SO42− (μg m−3) | 9.07 ± 4.94 | 10.33 ± 4.39 | 9.23 ± 4.20 | 5.81 ± 3.09 | 8.62 ± 4.52 |
| NO3− (μg m−3) | 2.90 ± 3.60 | 5.92 ± 4.24 | 2.25 ± 1.99 | 0.79 ± 0.46 | 2.97 ± 3.50 |
| NH4+ (μg m−3) | 3.04 ± 2.18 | 5.24 ± 2.42 | 3.49 ± 2.10 | 1.90 ± 1.17 | 3.42 ± 2.34 |
| Ca2+ (μg m−3) | 2.06 ± 0.90 | 3.18 ± 1.66 | 2.90 ± 1.28 | 2.11 ± 0.84 | 2.56 ± 1.30 |
| RH (%) | 79.35 ± 10.20 | 77.65 ± 15.68 | 75.73 ± 12.40 | 78.11 ± 10.03 | 77.72 ± 12.29 |
| T (℃) | 16.34 ± 5.64 | 5.76 ± 4.34 | 17.01 ± 4.37 | 22.95 ± 10.86 | 15.49 ± 7.51 |
| Precipitation (mm) | 131.2 | 84.5 | 454.5 | 519 | - |
| wind speed (m s−1) | 2.56 ± 0.62 | 2.43 ± 0.58 | 2.68 ± 0.86 | 2.30 ± 0.48 | 2.50 ± 0.66 |
| Site | SO42− | NO3− | NH4+ | SNA | Time | Reference | |
|---|---|---|---|---|---|---|---|
| China | Guiyang | 8.62 | 2.97 | 3.42 | 15.01 | 2017–2018 | This study |
| Kunming | 6.91 | 2.52 | 2.64 | 12.07 | 2017–2018 | [21] | |
| Nanning | 8.63 | 3.82 | 3.42 | 15.87 | 2017–2018 | [41] | |
| Beijing | 19.44 | 20.32 | 13.51 | 53.27 | 2012–2013 | [37] | |
| Tianjin | 24.26 | 19.62 | 8.53 | 52.41 | 2012–2013 | [37] | |
| Shijiazhuang | 35.66 | 30.47 | 9.29 | 75.42 | 2009–2010 | [37] | |
| Hefei | 15.60 | 15.11 | 7.82 | 38.53 | 2012–2013 | [32] | |
| Tibetan Plateau | 1.43 | 0.41 | 0.22 | 2.06 | 2010–2011 | [36] | |
| Xishan Forest Park | 6.10 | 0.43 | 0.81 | 7.34 | 2013–2014 | [21] | |
| Poland | Masovian | 2.17 | 2.44 | 1.17 | 5.78 | 2016 | [40] |
| Japan | Fukuoka | 2.57 | 3.01 | 3.26 | 8.84 | 2015 | [39] |
| America | Lowa | 1.64 | 1.58 | 0.79 | 4.01 | 2011–2012 | [38] |
| India | Pune | 4.80 | 0.89 | 0.51 | 6.20 | 2015–2016 | [42] |
| Vietnam | Quang Ninh | 9.20 | 1.50 | 3.30 | 14.00 | 2009–2010 | [43] |
| Korea | Seoul | 7.39 | 4.75 | 3.94 | 16.08 | 2012–2013 | [44] |
© 2020 by the authors. Licensee MDPI, Basel, Switzerland. This article is an open access article distributed under the terms and conditions of the Creative Commons Attribution (CC BY) license (http://creativecommons.org/licenses/by/4.0/).
Share and Cite
Xiao, H.; Xiao, H.-Y.; Zhang, Z.-Y.; Zheng, N.-J.; Li, Q.-k.; Li, X.-D. Chemical Characteristics of Major Inorganic Ions in PM2.5 Based on Year-Long Observations in Guiyang, Southwest China—Implications for Formation Pathways and the Influences of Regional Transport. Atmosphere 2020, 11, 847. https://doi.org/10.3390/atmos11080847
Xiao H, Xiao H-Y, Zhang Z-Y, Zheng N-J, Li Q-k, Li X-D. Chemical Characteristics of Major Inorganic Ions in PM2.5 Based on Year-Long Observations in Guiyang, Southwest China—Implications for Formation Pathways and the Influences of Regional Transport. Atmosphere. 2020; 11(8):847. https://doi.org/10.3390/atmos11080847
Chicago/Turabian StyleXiao, Hao, Hua-Yun Xiao, Zhong-Yi Zhang, Neng-Jian Zheng, Qin-kai Li, and Xiao-Dong Li. 2020. "Chemical Characteristics of Major Inorganic Ions in PM2.5 Based on Year-Long Observations in Guiyang, Southwest China—Implications for Formation Pathways and the Influences of Regional Transport" Atmosphere 11, no. 8: 847. https://doi.org/10.3390/atmos11080847
APA StyleXiao, H., Xiao, H.-Y., Zhang, Z.-Y., Zheng, N.-J., Li, Q.-k., & Li, X.-D. (2020). Chemical Characteristics of Major Inorganic Ions in PM2.5 Based on Year-Long Observations in Guiyang, Southwest China—Implications for Formation Pathways and the Influences of Regional Transport. Atmosphere, 11(8), 847. https://doi.org/10.3390/atmos11080847