Abstract
Droughts are a recurrent phenomenon in the semiarid forest-steppe ecotone of Mongolia with negative consequences for tree growth and agricultural management. In order to better cope with the uncertainty of a changing climate, the study of historical drought and its effects on forests could provide useful insights into ecosystem responses to climate variability. Siberian larch (Larix sibirica) is a dominant tree species in Western Mongolia that provides a valuable source of proxy data in the form of annual rings. We used dendrochronological techniques to establish a standard master chronology and analyze the relationship between annual ring widths and climatic factors. Correlation analyses revealed that the strongest associations of tree-ring index (TRI) values for the master chronology to direct climate variables were June temperature (r = −0.36, p < 0.01) and precipitation (r = 0.39, p < 0.01). The master chronology was strongly correlated to Palmer Drought Severity Index (PDSI) for June (r = 0.606, p < 0.001), and this variable (PDSIJun) was chosen for reconstruction. A simple linear regression of PDSIJun based on TRI explained 35.4% of the total variance for the period 1965–2016 and based on this model the PDSIJun changes from 1731–2016 were reconstructed. Split–sample calibration–verification tests were conducted to evaluate the quality of the model used for climate reconstruction. In the past 286 years, the number of non-drought years (PDSI > 0) was low, with a frequency of only 14.1% of the total reconstruction years. Extreme drought (PDSIJun < −2.70) occurred frequently in the 19th and early and late 20th centuries. Multi-taper method (MTM) spectra and wavelet analysis showed that the reconstructed PDSI series had high and low frequency periods (2.4–3.3 and 85–92 years). Our findings provide an understanding of the drought history of the semiarid forest-steppe ecotone of western Mongolia.
1. Introduction
Global warming and an increase in the frequency of extreme weather events has prompted an emerging research emphasis on drought [1]. Droughts pose a serious threat to the functioning of ecosystems and society [2,3]. Droughts occur in most parts of the world, and depending on their frequency and intensity, can strongly affect the water balance of ecosystems, particularly inland Asia and Mediterranean basin [4] in arid and semiarid regions [5]. In western Mongolia, ecosystems are especially prone to drought because the water supply critically depends on a few rainfall events. Water surpluses and shortages arise due to accumulated changes in precipitation [6]. During water shortages, the severity of drought is driven by potential evapotranspiration, which is an indicator of moisture demand [7]. Palmer (1965) proposed an index to indicate the severity of drought (PDSI) [8], which provides an integrated measure of soil moisture conditions by considering precipitation, temperature and evaporation of soil water [9]. Potential evapotranspiration is a clear indicator of moisture demand and an important factor in determining the severity of drought [10]. The PDSI is the most effective index for monitoring the regional drought and moisture conditions [11] and has been applied widely in studies from different regions around the world [12,13].
Mongolia is undergoing significant climatic change, with temperatures rapidly increasing [14], particularly in the high mountain regions of the forest-steppe ecotone of western Mongolia [15]. Drought events have a major impact on pasture and crop yields in Mongolia, and these effects could seriously threaten herders and the nomadic lifestyles that support much of Mongolia’s population. Climate change has a profound impact on the economy and ecosystem of the region [15]. These issues may be exacerbated in the future as temperatures throughout northern Asia, including Mongolia, are expected to continue to warm [16]. Therefore, an assessment of trends in drought events in this region with respect to the changing climate is required. However, the pattern of change in drought must be studied in the context of long-term trends, given that the Mongolian plateau has been shown to possess considerable low-frequency variability over time [17,18,19].
Historical climate data from Mongolian meteorological stations provide only sparse coverage in both space and time. Therefore, the use of natural indicators to reconstruct climate history is particularly important for historical climate research in this region. Annual tree-rings can be accurately dated, and provide strong continuity and wide distribution, making dendrochronological data an excellent proxy for high-resolution climate reconstruction [20]. Reconstruction studies from tree–ring data have been employed around the world to effectively examine regional or large-scale temperature changes [21], precipitation [22,23], and drought index [24,25]. Specifically, there have been many studies using tree-ring data to reconstruct PDSI for drought assessment in North America [26,27], Southeast Asia [28], and Europe [29]. Previous dendroclimatic reconstructions exist for Mongolia [15,17,18,30]. The objective of this study was to develop a dendroclimatic reconstruction of the PDSI using a new tree-ring chronology from the forest-steppe ecotone of Hangai mountains range and examine historical trends in drought variability in western Mongolia. The temporal and spatial representativeness of our reconstruction was subsequently investigated, and the possible driving forces of the drought variation in western Mongolia were analyzed.
2. Materials and Methods
2.1. Study Area and Dendrochronological Data
The study area was located in the semiarid forest-steppe ecotone of western Mongolia, at an elevation of 1757 m above sea level. (Figure 1). In this area, due to the effects of the arid climate and topography, forests are restricted in distribution to the relatively cool and wet north-facing slopes, whereas the warm and dry south–facing slopes are covered with mountain steppe [31,32]. In the forested areas, Pinus sylvestris, Populus davidiana, Betula platyphylla, and Larix sibirica often form mixed stands. Our sampling site (99.35° E, 48.47° N) was close to the southern edge of the boreal forest, where Larix sibirica is the dominant tree species. Climate data (Climate Research Unit, CRU TS4.02) for the period of 1965–2016 for the grid (99.5° E, 48.5° N) in close proximity to our sampling site, indicate that annual precipitation in the area was approximately 265 mm, with 69% falling during June to August. The annual mean temperature was −0.41 °C, with the warmest and coldest months being July (12.2 °C) and January (−27.7 °C), respectively (Figure 1). Previous studies indicate that tree growth in the semiarid area is climate-sensitive [33]. At the study site, the population of Siberian larch was composed of widely dispersed trees, and the forest canopy cover was sparse, indicating a physiognomy consistent with xeric vegetation and suggesting the importance of drought as a factor influencing community structure. In this region, we randomly selected trees for sampling. Two cores, one parallel to the slope and another parallel to the contour, were taken from each randomly selected tree. In total, 74 cores were collected during the summer of 2017.
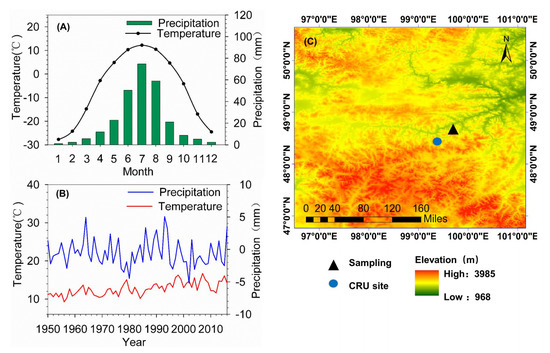
Figure 1.
(A) Monthly mean temperature and precipitation of the study area from 1965–2016. (B) Annual variations of temperature and precipitation of the study area from 1965–2016. (C) Locations of tree-ring sampling site (triangle) and gridded data PDSI (circle). PDSI: Palmer Drought Severity Index.
Standard methods were used for processing increment cores, measuring ring widths, and developing a standard master chronology [34]. In the laboratory, cores were air-dried, mounted on strips, and surfaced with coarse-to-fine sandpapers (240–1200 grit) until all rings were discernable. Ring widths were measured using the Lintab Version 6.0 system with a resolution of 0.01 mm, and cross-dated using the TSAPwin software package. Quality of the cross-dating was assessed using the program COFECHA [35], and errors were corrected or problematic cores were removed to produce the final dated chronology. To avoid errors caused by false rings, broken core samples or absent rings, all cores were cross-dated against each other. The final COFECHA chronology had a mean sensitivity of 0.52 and a series intercorrelation of 0.77. Ultimately, 52 cores from 34 trees were successfully dated and used to establish the master chronology. A negative exponential curve was applied using the dplR package in the R statistical computing environment (R Core Team, 2019) to remove the biological growth trends and other low–frequency variations due to stand dynamics in individual series and build the master chronology [36,37]. A cubic spline with 50% frequency-response cutoff equal to 67% of the series length was also used in few cases (6 cores) when the negative exponential curve failed to produce an adequate standardization, because its anomalously low frequency trend was different from that of the other cores. The chronology was further put through a process of variance stabilization to reduce potential influence due to changing sample size [38]. We calculated the interseries correlation (Rbar) and expressed population signal (EPS) to evaluate the quality of the master chronology. The EPS values were calculated from a 30-year window lagged 15 years to determine the most suitable portions (time periods) of the chronology for climate reconstruction. Values of EPS ≥0.85 are generally considered to be the threshold for reliable chronology development. The running Rbar and EPS were generally high, indicating the high fidelity of this master chronology. Based on these indicators, we developed a reliable master chronology spanning from 1731–2016.
2.2. Climate Data
Due to a lack of long-term meteorological observations collected at the sampling site, we used interpolated monthly climate data to represent the historical climate of the region covering the period of 1965–2016. Mean monthly temperature and monthly total precipitation were extracted from the dataset (CRU TS4.02 for the grid of 0.5° resolution) in closest proximity to our sampling site (Figure 1). For drought reconstruction, we used the PDSI data from the nearest grid point (99.5° E 48.5° N) to our sampling site.
2.3. Statistical Analysis
To explore the associations of tree growth with climate variables, Pearson correlation coefficients were calculated between annual tree-ring index (TRI) values of the master chronology and climate variables from the previous May to current September for the period 1965–2016. The 95% confidence level (p < 0.05) was used to determine the statistical significance of the correlations.
A simple linear regression model was used to reconstruct the PDSI based on the TRI values of the master chronology. Split-sample calibration-verification tests were used to evaluate the quality of the model used for climate reconstruction. The dataset was split into two equally long periods 1965–1990 and 1991–2016 for calibration and verification, respectively [39,40]. The procedure was then repeated with the calibration and verification periods reversed. Pearson’s correlation coefficient (r), explained variance adjusted for loss of degrees of freedom (r2adj), reduction of error (RE), coefficient of efficiency (CE), and the signal test (ST) were calculated to evaluate the similarity between the observed data and the estimated data. Specifically, RE is a measure of shared variance between estimated and observed series and provides a highly sensitive measure of the reliability of a reconstruction, ranging from +1 indicating perfect agreement to minus infinity. Commonly, values of RE and CE > 0 indicate a rigorous model [41]. Finally, the multi-taper method [42] and the wavelet analysis method [43] were applied to explore the spectral characteristics of the drought reconstruction. In this study, to assess the regional-scale drought variability, spatial correlation analysis was conducted using the KNMI climate explorer (http://climexp.knmi.nl). All data analyses and plots were calculated and made using R version 3.5.1 (R Core Team, 2019) and Sigmaplot 10.0.
3. Results
3.1. Master Chronology
Based on the analysis of 52 increment core samples, we developed a 312-year ring-width chronology, spanning the period from 1705 to 2016. The mean correlation within trees (r = 0.77) and between trees (r = 0.52) of the chronology were both high. Other statistics, including the standard deviation (0.21), mean sensitivity (0.52) and AC1 (0.67), indicated the chronology would be useful for climate reconstruction. The mean EPS for 30-year intervals with 15-year overlap was 0.98. Based on the criterion of EPS > 0.85, we removed the years from 1702 to 1730 from the chronology, and determined the reliable portion spanned the period from 1731 to 2016 (Figure 2).
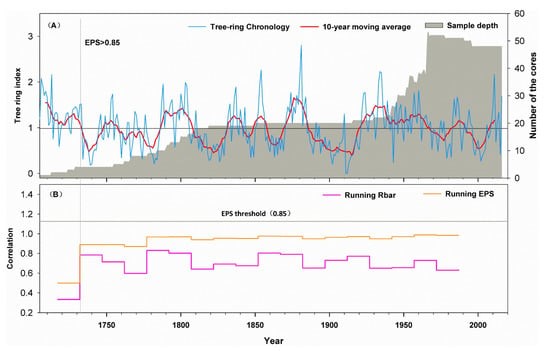
Figure 2.
(A) The regional tree-ring standard chronologies and sample depth. (B) The running Rbar (30-year window lagged 15 years) and the running expressed population signal (EPS). The reliable portion of the chronology has running EPS value >0.85.
3.2. Tree-Ring Response to Climate and Reconstruction of PDSI
Correlation analyses of the tree-ring chronology and the climate data show that in general, tree growth was negatively correlated to temperature and positively correlated with precipitation (Figure 3). Particularly, the temperature of the current June (r = −0.36, p < 0.01) and previous June (r = −0.31, p < 0.05) were both significantly and negatively correlated with the tree-ring chronology (Figure 3). There were positive correlations between the ring–width indices and precipitation of the current June (r = 0. 39, p < 0.01) and previous June (r = 0.31, p < 0.05), which were also statistically significant. We also analyzed the association between the tree–ring chronology and various seasonal calculations of the PDSI (Figure 4). There were consistently positive correlations between tree–ring width and the PDSI calculated for various months during the current year (January–December), all significant at the 99% confidence level. The strongest correlation between the tree–ring chronology and PDSI was for June values of the current year (r = 0.606, p < 0.001) (Figure 4). Therefore, the PDSI for June of the current year was selected as the best candidate variable for a drought reconstruction model, and a 286-year reconstruction was developed for the period of 1731 to 2016. The transfer function was designed using the linear regression model defined in equation:
where PDSIJun is the PDSI value of June for year t and RWIt is the tree-ring index value for year t.
PDSIJun = 3.0171 × RWIt − 4.3991
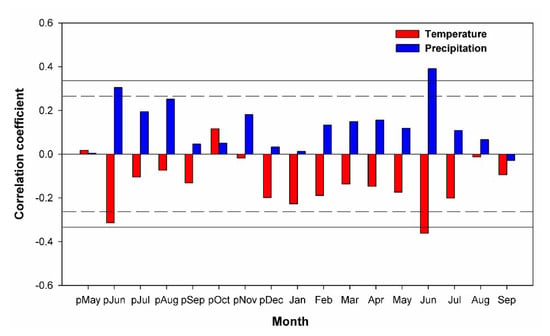
Figure 3.
Correlations of the standard master chronology with monthly mean temperature (red bars), monthly total precipitation (blue bars) during the period of 1965–2016. The solid line and dashed line indicate p < 0.05 and p < 0.01, respectively.
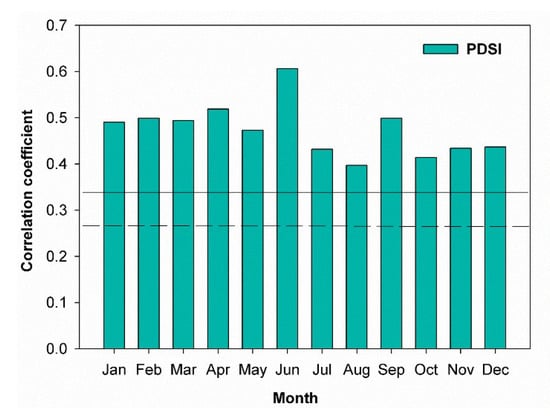
Figure 4.
Correlations of the standard master chronology with Palmer Drought Severity Index (PDSI) data for different months of the current growth year during the period of 1965–2016. The solid line and dashed line indicate p < 0.05 and p < 0.01, respectively.
The significant regression model (F = 28.95) explained a substantial portion of the variance (r2adj = 0.354) in the PDSIJun for the period 1965–2016. The quality and stability of the regression equation was verified using the split-sample method (Table 1). Calibration and verification revealed significant correlations from 1965–1990 and 1991–2016 (r = 0.589 and r = 0.635, respectively) justifying the development of a PDSIJun reconstruction. Verification statistics including error reduction value (RE) and efficiency coefficient (CE) were both positive. The signal test was significant at the 99% confidence level for the 1965–1990 period and significant at the 95% confidence level for the 1991–2016 period. These results all demonstrate that the reconstruction equation is stable and reliable and can be used to reconstruct the PDSIJun of the study area.

Table 1.
Calibration and verification statistics for the tree-ring reconstruction of the June Palmer Drought Severity Index (PDSI).
3.3. Reconstructed Drought Variability
Based on the linear regression model, we reconstructed the historical PDSIJun values from 1731–2016 in the Hangai mountain range, Mongolia (Figure 5). The general trends reflected in both datasets were similar, and when differences did occur, they were in magnitude rather than direction (Figure 5A,B). Reconstructed PDSI values ranged between −4.4 and 4, and the frequency of PDSI values >0 was low, accounting for only 14.1% of the total reconstruction years. The mean value of the reconstructed PDSI values for the period of 1731–2016 was −1.49. We defined years with reconstructed PDSI values greater than the mean plus one standard deviation (PDSI > −0.10) as relatively wet years, and years with values less than the mean minus one standard deviation (PDSI < −2.91) as dry years. Relatively wet years accounted for 15.0% (43 years) and drought years accounted for 16.7% (48 years) of the entire 286-year reconstruction period. Based on a 10-year low-pass filtered curve (Figure 5C), relative wet periods occurred in 1748–1757, 1786–1808, 1832–1841, 1849–1858, 1869–1885, 1920–1967, 1982–1991, and 2008–2016. Relative dry periods covering a multi–decadal scale occurred in 1735–1747, 1758–1785, 1809–1831, 1842–1848, 1859–1868, 1886–1919, 1968–1981, and 1992–2007. Six of the ten driest years while four of the ten wettest years occurred during the 20th and 21th centuries (Table 2).
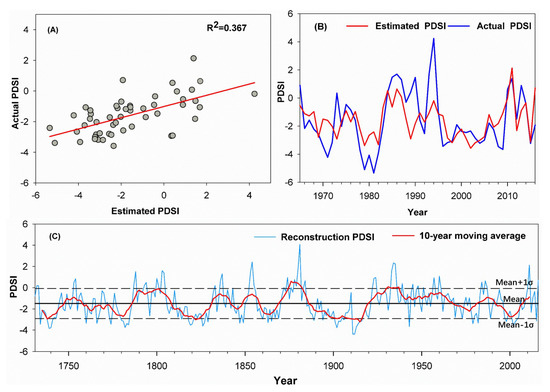
Figure 5.
(A) Correlation of actual and estimated June PDSI during the period of 1965–2016; (B) Comparison of actual and estimated June PDSI 1965–2016. (C) Tree-ring reconstructed June PDSI plotted annually (blue line) 1731–2016, along with a smoothed 10-year moving average (red line).

Table 2.
Ten driest and wettest years for reconstructed Palmer Drought Severity Index (PDSI).
Spatial correlation analysis shows that our reconstruction captures large-scale regional drought variability in the vicinity of northwestern Mongolia (Figure 6). The multi-taper method (MTM) spectral and wavelet analysis indicated that June PDSI reconstruction in the Hangai mountain range exhibits variability at inter-annual to multi-decadal time scales. The MTM results show that significant spectral peaks were found at 3.0–3.3 years at the 99% confidence level (Figure 7). We also identified cyclic patterns at 2.4–2.5, and 82–95 years at the 95% confidence level. Wavelet analysis showed similar cycles. The greatest power was at the decadal timescale, expressed in the range from 70–90 years, and cycles were observed from the 1790s to the turn of the 21st century. Power within the 8–12 and 4–8 year ranges was evident in cycles occurring from the 1970s–2000s and 1930s–1940s (Figure 8). Power in the 10–20 year ranges was found in cycles from the 1740s–1800s and 1970s–2010s.
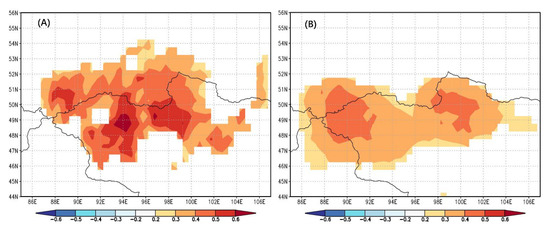
Figure 6.
Spatial correlations between the PDSI reconstruction and (A) June mean precipitation and (B) actual PDSI from the Climate Research Unit, CRU TS4.02 data (1965–2016) (p < 0.01).
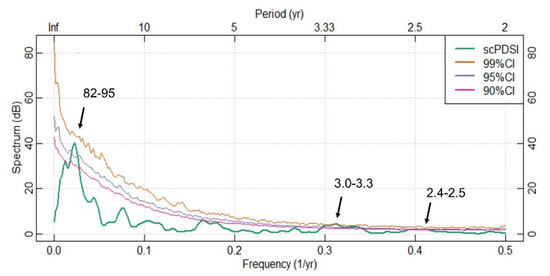
Figure 7.
Results of the multi-taper method (MTM) spectral analysis of the temperature reconstruction.
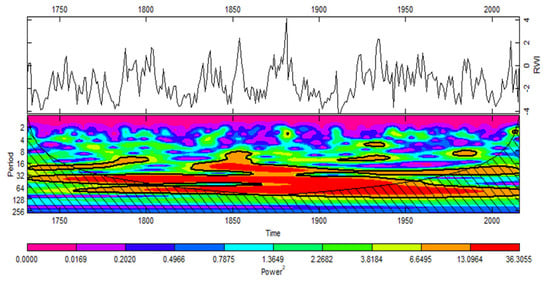
Figure 8.
Wavelet plots for reconstructed June PDSI. Areas surrounded by thick black contours (95% significant level, using red noise background spectrum) are regions of significant power at corresponding timescales.
4. Discussion
4.1. Tree-Ring as an Indicator of Climatic Dryness in Western Mongolia
Associations between growth index values and climate variables indicated that tree growth generally had a negative correlation to monthly temperature and a positive correlation to monthly precipitation or PDSI values. Thus, we suggest that soil moisture balance is predominant limiting factor for the radial growth of Siberian larch in the Hangai mountain range of Mongolia. This area has a climate typical of an arid to semi-arid region, with the annual evaporation more than twice the annual precipitation [2]. Most likely, tree growth is not limited by a single climatic factor under these conditions, but rather determined by the interaction of temperature and precipitation [44]. Indeed, we observed that the precipitation and temperature in June of the current year had the highest correlation to TRI values. High precipitation during the growing season contributes to the radial growth of trees by providing the moisture required for the division and elongation of radial cells [45]. However, increased temperature during the growing season exacerbates water stress, and accelerates the consumption of soil water by evapotranspiration, ultimately limiting plant growth [46]. This effect can be dependent on soil conditions, as low water holding capacity of soils in arid and semiarid regions can exert an even greater effect on plant growth [47]. Seasonally, the effects of temperature and precipitation were greatest in June. Plants can access and use meltwater from permafrost degradation in the soil at the beginning of the growing season during a dry summer, but plants mainly use rainwater during a wet summer [48]. Thus, growing season precipitation, especially in June, is a limiting factor for Siberian larch in this study site. During the growing season, higher temperature can accelerate transpiration and respiration, simultaneously decreasing carbohydrate accumulation in stems. Annual effective evapotranspiration is about five- to seven-times greater than total precipitation in the Hangai mountain region [49], which means that high temperatures in June would exacerbate the already large soil moisture deficits.
This pattern of reduced growth driven by the interaction of low precipitation and high temperature is widely found in arid to semi-arid regions [13,24,50,51]. Furthermore, in dry and semiarid areas, moist and cool years with below average temperature during the growing season could increase the growth of many conifer species [46,52,53]. The alternating periods of poor and good growth within our sample population appear to be best captured by examining the PDSI values in June, which had the strongest correlation to TRI values. Based on the water balance model, Palmer proposed the PDSI index as an integrated measure of soil moisture conditions by considering precipitation, temperature and evaporation of soil water. Our results suggest that the multiple environment variables combined in PDSI data freely available from the CRU TS4.02 grid provide a useful indicator of local tree-growth in the arid or semiarid area we studied. Thus, the reconstruction of June PDSI is well justified as a useful indicator of past climate conditions within the Hangai mountain region of Mongolia.
4.2. Wet and Dry Periods in Western Mongolia
Our reconstruction of drought events provides a substantial improvement in the time series available for evaluation of drought variability in Hangai mountain range. The mean value of the reconstructed PDSI during 1731–2016 was −1.55, and the frequency of years with PDSI > 0 was low, suggesting that mild drought conditions predominated throughout the period. In general, the 19th century was a relatively dry period in Northwest Mongolia [17]. Overall, 1881 was the wettest year of the past 286 years (Table 2), followed by the longest dry period in the period of reconstruction (1885–1920). A trend towards increasing moisture began in the 1920s and continued into the end of 20th century and that is the wettest period of past three centuries. These trends are similar to those reported by David et al. (2009) in western Mongolia [15].
A reconstruction of summer temperature based on tree-ring width in our study region [54] provides a useful comparison to our reconstruction of PDSI for verification, and for examining relationships in larger spatial context. The two series of reconstructions show some similar temporal patterns over the past three centuries. For instance, reconstructed summer temperature in northern Mongolia during the past 300 years significantly correlates to our estimated PDSI, but the correlation coefficient is relatively weak (r = −0.150, p < 0.05) (Figure 9). This may indicate that the drought in this area is less affected by temperature, and maybe more related to precipitation. We also compared our drought reconstruction with tree-ring based drought or precipitation reconstructions from the near region. Recently, researchers used streamflow reconstruction to characterize regional drought conditions in northern Mongolia [18,55]. There are significantly positive correlations between the our PDSI reconstruction and the two streamflow reconstructions (r = 0.396 and r = 0.327, p < 0.001). In addition, we calculated the frequency of extreme drought events (PDSIJun < −2.70) with the length of 1/3 of the entire reconstruction as an interval. In the past century, although the average summer temperature has increased [54], the incidence of extreme drought events in the region has not increased, with 26.31% (1731–1825), 25.26% (1826–1921), and 15.78% (1922–2016), respectively. PDSI is an integrated index by considering precipitation, temperature, and evaporation of soil water and thus correlated with observed streamflow and soil moisture over many high-latitude regions (Russia, Mongolia, and northern China), despite that snow and other cold land processes are not explicitly treated in the Palmer model [8]. This implies that for plants, the occurrence of summer extreme drought events in western Mongolia is mainly affected by available moisture on a long–time scale.
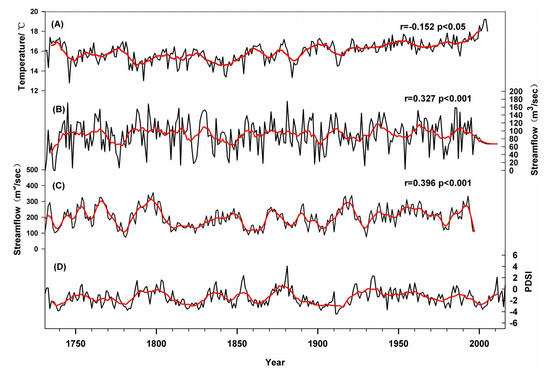
Figure 9.
Comparisons between (A) summer temperature reconstruction in North of Mongolia from Davi et al. (2015), (B) Yeruu River, Mongolia 300-Year Streamflow Reconstruction (Perderson et al. 2012), (C) Selenge River, Mongolia Streamflow Reconstruction (Davi et al. 2006), and (D) PDSI reconstruction of this study.
4.3. Linkage to the Large-Scale Climate Forcing
Drought in arid and semi–arid areas can be influenced by local, regional, or global scale factors [56,57,58,59]. Our reconstructed PDSI series have high and low frequency periods (85–92, 3–3.3, and 2.4–2.5 years), indicating that drought variability in the Hangai mountain range of Mongolia has connections to different circulation systems and climate models. Specifically, the significant high-frequency 2.4–2.5 years (p < 0.05) and 3–3.3 years (p < 0.01) cycles of reconstructed PDSI have been widely reported in previous studies and may be linked to the tropospheric biennial oscillation [60] in the regions of southern of Kazakhstan [23] and Tibetan Plateau [61]. The high frequency cycles (3–3.3 years) also fall within the range of the ENSO (El Niño-Southern Oscillation) periods of 2–8 years over the entire reconstruction [22]. A significant negative correlation (r = –0.316, p < 0.01) was found between our reconstructions (10-year moving average) and the multivariate ENSO index (10-year moving average) in whole reconstructed period.
In previous studies, it was pointed out that there are teleconnections between the different forcings (e.g., NAO and ENSO) and climate in east Asia [62,63]. The ENSO variability regulates the intensity of the Asian summer monsoon [64], which leads to precipitation changes in the marginal monsoon region and causes extensive droughts in the Asian monsoon region [65]. Previous studies also have revealed patterns of water availability similar to our results covering northeastern Mongolia and northern China [15,25]. However, the low frequency cycles (85–92 years) resembled a different pattern of reconstructed temperature and PDSI and suggested a possible association between annual PDSI variation in this study area and solar activity [66]. Overall, our reconstruction provides valuable climatic information for Hangai mountain range in Mongolia, providing new insights into historical climate variability and linking these patterns to known climatic influences in this part of Asia.
5. Conclusions
In summary, we developed a Siberian larch tree-ring width chronology for the arid and semi-arid mountain areas in Hangai region, Mongolia. The drought reconstruction has identified several periods of June drought in the Hangai mountain of Mongolia during the past 286 years (1731–2016). Prolonged drought events occurred frequently in the 19th and early and late 20th centuries. The reconstructed PDSI series had high and low-frequency variation (85–92, 3–3.3, and 2.4–2.5 years), indicating that drought cycles are connected to various climate drivers. On a long-term timescale, the increase of temperature did not lead to more extreme drought events, and water limitation was the main reason for extreme drought in western Mongolia. Our findings provide a basic understanding of the drought history of the semiarid forest-steppe ecotone of western Mongolia.
Author Contributions
L.S., H.L., M.Z. and P.Z. collected samples and analyzed the data, L.S., Z.R. and G.L. did laboratory measurements; L.S., J.P.D. and H.L. wrote the manuscript; all the authors discussed the results and commented on the manuscript. All authors have read and agreed to the published version of the manuscript.
Funding
This research was funded by the National Natural Science Foundation of China (No. 41530747 and 41563006).
Acknowledgments
We are grateful to Gangqiqige Dashgar, Weichao Guo, YongyueYu, Jiaxin Xue, and Deleihei Bayin for their assistance in field sampling in Mongolia.
Conflicts of Interest
The authors declare no conflict of interest.
References
- Rahmstorf, S.; Coumou, D. Increase of extreme events in a warming world. Proc. Natl. Acad. Sci. USA 2011, 108, 17905–17909. [Google Scholar] [CrossRef]
- Hessl, A.E.; Anchukaitis, K.J.; Jelsema, C.; Cook, B.; Byambasuren, O.; Leland, C.; Nachin, B.; Pederson, N.; Tian, H.; Hayles, L.A. Past and future drought in Mongolia. Sci. Adv. 2018, 4, e1701832. [Google Scholar] [CrossRef] [PubMed]
- Park Williams, A.; Allen, C.D.; Macalady, A.K.; Griffin, D.; Woodhouse, C.A.; Meko, D.M.; Swetnam, T.W.; Rauscher, S.A.; Seager, R.; Grissino-Mayer, H.D.; et al. Temperature as a potent driver of regional forest drought stress and tree mortality. Nat. Clim. Chang. 2012, 3, 292–297. [Google Scholar] [CrossRef]
- Tejedor, E.; Saz, M.A.; Esper, J.; Cuadrat, J.M.; de Luis, M. Summer drought reconstruction in northeastern Spain inferred from a tree ring latewood network since 1734. Geophys. Res. Lett. 2017, 44, 8492–8500. [Google Scholar] [CrossRef]
- Huang, J.; Li, Y.; Fu, C.; Chen, F.; Fu, Q.; Dai, A.; Shinoda, M.; Ma, Z.; Guo, W.; Li, Z.; et al. Dryland Climate Change: Recent Progress and Challenges: Dryland Climate Change. Rev. Geophys. 2017, 55, 719–778. [Google Scholar] [CrossRef]
- Wilhite, D.; Glantz, M. Understanding the drought phenomenon: The role of definitions. Water Int. 1985, 10, 111–120. [Google Scholar] [CrossRef]
- Cook, B.I.; Smerdon, J.E.; Seager, R.; Coats, S. Global warming and 21st century drying. Clim. Dyn. 2014, 43, 2607–2627. [Google Scholar] [CrossRef]
- Palmer, W.C. Meteorological Drought; Research Paper No. 45; US Weather Bureau: Washington, DC, USA, 1965; Volume 58.
- Dai, A. Characteristics and trends in various forms of the Palmer Drought Severity Index during 1900–2008. J. Geophys. Res. 2011, 116. [Google Scholar] [CrossRef]
- Rind, D.; Goldberg, R.; Hansen, J.; Rosenzweig, C.; Ruedy, R. Potential evapotranspiration and the likelihood of future drought. J. Geophys. Res. Atmos. 1990, 95, 9983–10004. [Google Scholar] [CrossRef]
- Mishra, A.K.; Singh, V.P. A review of drought concepts. J. Hydrol. 2010, 391, 202–216. [Google Scholar] [CrossRef]
- Cook, E.R.; Seager, R.; Cane, M.A.; Stahle, D.W. North American drought: Reconstructions, causes, and consequences. Earth Sci. Rev. 2007, 81, 93–134. [Google Scholar] [CrossRef]
- Cai, Q.; Liu, Y.; Liu, H.; Ren, J. Reconstruction of drought variability in North China and its association with sea surface temperature in the joining area of Asia and Indian–Pacific Ocean. Palaeogeogr. Palaeoclimatol. Palaeoecol. 2015, 417, 554–560. [Google Scholar] [CrossRef]
- Yatagai, A.; Yasunari, T. rends and decadal-scale fluctuations of surface air temperature and precipitation over China and Mongolia during the recent forty-year period (1951–1990). J. Meteorol. Soc. Jpn. 1994, 72, 937–957. [Google Scholar] [CrossRef]
- Davi, N.K.; Jacoby, G.C.; D’Arrigo, R.D.; Baatarbileg, N.; Jinbao, L.; Curtis, A.E. A tree-ring-based drought index reconstruction for far-western Mongolia: 1565–2004. Int. J. Clim. 2009, 29, 1508–1514. [Google Scholar] [CrossRef]
- Sato, T. Regional Climate Simulations to Diagnose Environmental Changes in Mongolia; Bulletin of the Terrestrial Environment Research Center, University of Tsukuba: Tsukuba, Japan, 2006; pp. 59–69. [Google Scholar]
- Pederson, N.; Jacoby, C.G.; D’Arrigo, R.; Cook, E.; Buckley, M.B.; Dugarjav, C.; Mijiddorj, R. Hydrometeorological Reconstructions for Northeastern Mongolia Derived from Tree Rings: 1651–1995. J. Clim. 2001, 14, 872–881. [Google Scholar] [CrossRef]
- Davi, N.K.; Jacoby, G.C.; Curtis, A.E.; Baatarbileg, N. Extension of Drought Records for Central Asia Using Tree Rings: West-Central Mongolia. J. Clim. 2006, 19, 288–299. [Google Scholar] [CrossRef]
- Jacoby, G.; Pederson, N.; D’Arrigo, R. Temperature and precipitation in Mongolia based on dendroclimatic investigations. Chin. Sci. Bull. 2003, 48, 1474–1479. [Google Scholar]
- Schweingruber, F. Tree Rings: Basics and Applications of Dendrochronology; Reidel, D., Ed.; Springer: Dordrecht, The Netherlands, 1988; pp. 78–79. [Google Scholar]
- Liu, Y.; Wang, Y.; Li, Q.; Song, H.; Linderholm, H.W.; Leavitt, S.W.; Wang, R.; An, Z. Tree-ring stable carbon isotope-based May–July temperature reconstruction over Nanwutai, China, for the past century and its record of 20th century warming. Quat. Sci. Rev. 2014, 93, 67–76. [Google Scholar] [CrossRef]
- Li, J.; Xie, S.-P.; Cook, E.R.; Morales, M.S.; Christie, D.A.; Johnson, N.C.; Chen, F.; D’Arrigo, R.; Fowler, A.M.; Gou, X. El Niño modulations over the past seven centuries. Nat. Clim. Chang. 2013, 3, 822. [Google Scholar] [CrossRef]
- Zhang, R.; Shang, H.; Yu, S.; He, Q.; Yuan, Y.; Bolatov, K.; Mambetov, B.T. Tree-ring-based precipitation reconstruction in southern Kazakhstan, reveals drought variability since A.D. 1770. Int. J. Clim. 2017, 37, 741–750. [Google Scholar] [CrossRef]
- Liu, Y.; Zhang, X.; Song, H.; Cai, Q.; Li, Q.; Zhao, B.; Liu, H.; Mei, R. Tree-ring-width-based PDSI reconstruction for central Inner Mongolia, China over the past 333 years. Clim. Dyn. 2016, 48, 867–879. [Google Scholar] [CrossRef]
- Jiang, P.; Liu, H.; Wu, X.; Wang, H. Tree-ring-based SPEI reconstruction in central Tianshan Mountains of China since A.D. 1820 and links to westerly circulation. Int. J. Clim. 2017, 37, 2863–2872. [Google Scholar] [CrossRef]
- Cook, E.; Meko, D.; Stahle, D.; Cleaveland, M. Drought Reconstructions for the Continental United States. J. Clim. 1999, 12, 1145–1162. [Google Scholar] [CrossRef]
- Stahle, D.W.; Fye, F.K.; Cook, E.R.; Griffin, R.D. Tree-ring reconstructed megadroughts over North America since a.d. 1300. Clim. Chang. 2007, 83, 133–149. [Google Scholar] [CrossRef]
- Zhao, F.; Fan, Z.; Su, T.; Li, S.; Tang, H.; Spicer, T.E.; Zhou, Z.J.P. Palaeoclimatology, Palaeoecology. Tree-ring δ18O inferred spring drought variability over the past 200 years in the Hengduan Mountains, Southwest China. Palaeogeogr. Palaeoclimatol. Palaeoecol. 2019, 518, 22–33. [Google Scholar] [CrossRef]
- Nicault, A.; Alleaume, S.; Brewer, S.; Carrer, M.; Nola, P.; Guiot, J.J.C.D. Mediterranean drought fluctuation during the last 500 years based on tree-ring data. Clim. Dyn. 2008, 31, 227–245. [Google Scholar] [CrossRef]
- D’Arrigo, R.; Jacoby, G.; Frank, D.; Pederson, N.; Cook, E.; Buckley, B.; Nachin, B.; Mijiddorj, R.; Dugarjav, C. 1738 years of Mongolian temperature variability inferred from a tree-ring width chronology of Siberian pine. Geophys. Res. Lett. 2001, 28, 543–546. [Google Scholar] [CrossRef]
- Gunin, P.; Vostokova, E.A.; Dorofeyuk, N.I.; Tarasov, P.; Black, C.C. Vegetation Dynamics of Mongolia; Kluwer Academic Publishers: Dordrecht, The Netherlands, 1999; pp. 7–43. [Google Scholar]
- Liu, J.; Fang, X.; Tang, X.; Wang, W.; Zhou, G.; Xu, S.; Huang, W.; Wang, G.; Yan, J.; Ma, K.; et al. Patterns and controlling factors of plant nitrogen and phosphorus stoichiometry across China’s forests. Biogeochemistry 2019, 143, 191–205. [Google Scholar] [CrossRef]
- Wang, T.; Ren, H.; Ma, K. Climatic signals in tree ring of Picea schrenkiana along an altitudinal gradient in the central Tianshan Mountains, northwestern China. Trees 2005, 19, 736–742. [Google Scholar] [CrossRef]
- Cook, E.R.; Kariukstis, L.A. Methods of Dendrochronology: Applications in the Environmental Sciences; Springer, Kluwer: Dordrecht, The Netherlands, 1990; pp. 98–102. [Google Scholar]
- Grissino-Mayer, H.D. Evaluating crossdating accuracy: A manual and tutorial for the computer program cofecha. Tree Ring Res. 2001, 57, 205–221. [Google Scholar]
- Cook, E.R. A Time Series Analysis Approach to Tree-Ring Standardization; The University of Arizona: Tucson, AZ, USA, 1985. [Google Scholar]
- Melvin, T.M.; Briffa, K.R. A “Signal-Free” approach to dendroclimatic Standardization. Dendrochronologia 2008, 26, 71–86. [Google Scholar] [CrossRef]
- Cook, E. The Decomposition of Tree-Ring Series for Evnironmental Studies. Tree-Ring Bull. 1987, 47, 37–59. [Google Scholar]
- Fritts, H.C. Tree Rings and Climate; Cambridge University Press: Cambridge, UK, 1976; Volume 15, pp. 567–568. [Google Scholar]
- Michaelsen, J. Cross-Validation in Statistical Climate Forecast Models; American Meteorological Society: Massachusetts, MA, USA, 1987; Volume 26, pp. 1589–1600. [Google Scholar]
- Fritts, H.C.; Joel, G.; Gordon, G.A.; Schweingruber, F. Methods of Calibration, Verification, and Reconstruction; Springer: Dordrecht, The Netherlands, 1990; pp. 163–217. [Google Scholar]
- Mann, M.; Lees, J. Robust Estimation of Background Noise and Signal Detection in Climatic Time Series. Climatic Change. 1996, 33, 409–445. [Google Scholar] [CrossRef]
- Grinsted, A.; Moore, J.C.; Jevrejeva, S. Application of Cross Wavelet Transform and Wavelet Coherence to Geophysical Time Series. Nonlinear Process. Geophys. 2004, 11, 561–566. [Google Scholar] [CrossRef]
- Liang, E.; Dawadi, B.; Pederson, N.; Eckstein, D. Is the growth of birch at the upper timberline in the Himalayas limited by moisture or by temperature? Ecology 2014, 95, 2453–2465. [Google Scholar] [CrossRef]
- Speer, J.H. Fundamentals of Tree-Ring Research; University of Arizona Press: Tucson, AZ, USA, 2010; pp. 43–49. [Google Scholar]
- Kharal, D.K.; Thapa, U.K.; George, S.S.; Meilby, H.; Rayamajhi, S.; Bhuju, D.R. Tree-climate relations along an elevational transect in Manang Valley, central Nepal. Dendrochronologia 2017, 41, 57–64. [Google Scholar] [CrossRef]
- Laio, F.; Porporato, A.; Ridolfi, L.; Rodriguez-Iturbe, I. Plants in water-controlled ecosystems: Active role in hydrologic processes and response to water stress: II. Probabilistic soil moisture dynamics. Adv. Water Resour. 2001, 24, 707–723. [Google Scholar] [CrossRef]
- Sugimoto, A.; Yanagisawa, N.; Naito, D.; Fujita, N.; Maximov, T.C. Importance of permafrost as a source of water for plants in East Siberian taiga. Ecol. Res. 2002, 17, 493–503. [Google Scholar] [CrossRef]
- Bao, G.; Liu, Y.; Linderholm, H.W. April–September mean maximum temperature inferred from Hailar pine (Pinus sylvestris var. mongolica) tree rings in the Hulunbuir region, Inner Mongolia, back to 1868 AD. Palaeogeogr. Palaeoclimatol. Palaeoecol. 2012, 313, 162–172. [Google Scholar] [CrossRef]
- Liang, E.; Shao, X.; Liu, H.; Eckstein, D. Tree-ring based PDSI reconstruction since AD 1842 in the Ortindag Sand Land, east Inner Mongolia. Chin. Sci. Bull. 2007, 52, 2715–2721. [Google Scholar] [CrossRef]
- Fang, K.; Gou, X.; Chen, F.; Li, J.; D’Arrigo, R.; Cook, E.; Yang, T.; Davi, N. Reconstructed droughts for the southeastern Tibetan Plateau over the past 568 years and its linkages to the Pacific and Atlantic Ocean climate variability. Clim. Dyn. 2009, 35, 577–585. [Google Scholar] [CrossRef]
- Shah, S.K.; Bhattacharyya, A. Spatio-temporal growth variability of three Pinus species of Northeast Himalaya with relation to climate. Dendrochronologia 2012, 30, 266–278. [Google Scholar] [CrossRef]
- Gaire, N.P.; Bhuju, D.R.; Koirala, M.; Shah, S.K.; Carrer, M.; Timilsena, R. Tree-ring based spring precipitation reconstruction in western Nepal Himalaya since AD 1840. Dendrochronologia 2017, 42, 21–30. [Google Scholar] [CrossRef]
- Davi, N.K.; D’Arrigo, R.; Jacoby, G.C.; Cook, E.R.; Anchukaitis, K.J.; Nachin, B.; Rao, M.P.; Leland, C. A long-term context (931–2005 C.E.) for rapid warming over Central Asia. Quat. Sci. Rev. 2015, 121, 89–97. [Google Scholar] [CrossRef]
- Pederson, N.; Leland, C.; Nachin, B.; Hessl, A.E.; Bell, A.R.; Martin-Benito, D.; Saladyga, T.; Suran, B.; Brown, P.M.; Davi, N.K. Three centuries of shifting hydroclimatic regimes across the Mongolian Breadbasket. Agric. For. Meteorol. 2013, 178–179, 10–20. [Google Scholar] [CrossRef]
- Liang, E.Y.; Shao, X.M.; Xu, Y. Tree-ring evidence of recent abnormal warming on the southeast Tibetan Plateau. Appl. Clim. 2009, 98, 9–18. [Google Scholar] [CrossRef]
- Borgaonkar, H.P.; Sikder, A.B.; Ram, S.; Pant, G.B. El Niño and related monsoon drought signals in 523-year-long ring width records of teak (Tectona grandis L.F.) trees from south India. Palaeogeogr. Palaeoclimatol. Palaeoecol. 2010, 285, 74–84. [Google Scholar] [CrossRef]
- Panthi, S.; Bräuning, A.; Zhou, Z.-K.; Fan, Z.-X. Tree rings reveal recent intensified spring drought in the central Himalaya, Nepal. Glob. Planet. Chang. 2017, 157, 26–34. [Google Scholar] [CrossRef]
- Gaire, N.P.; Dhakal, Y.R.; Shah, S.K.; Fan, Z.-X.; Bräuning, A.; Thapa, U.K.; Bhandari, S.; Aryal, S.; Bhuju, D.R. Drought (scPDSI) reconstruction of trans-Himalayan region of central Himalaya using Pinus wallichiana tree-rings. Palaeogeogr. Palaeoclimatol. Palaeoecol. 2019, 514, 251–264. [Google Scholar] [CrossRef]
- Meehl, G. The Annual Cycle and Interannual Variability in the Tropical Pacific and Indian Ocean Regions. Mon. Weather Rev. 1987, 115, 27. [Google Scholar] [CrossRef]
- Huang, R.; Zhu, H.; Liang, E.; Liu, B.; Shi, J.; Zhang, R.; Yuan, Y.; Grießinger, J. A tree ring-based winter temperature reconstruction for the southeastern Tibetan Plateau since 1340 CE. Clim. Dyn. 2019, 53, 3221–3233. [Google Scholar] [CrossRef]
- Linderholm, H.; Seim, A.; Ou, T.; Jeong, J.-H.; Liu, Y.; Wang, X.; Bao, G.; Folland, C. Exploring teleconnections between the summer NAO (SNAO) and climate in East Asia over the last four centuries—A tree-ring perspective. Dendrochronologia 2013, 31, 297–310. [Google Scholar] [CrossRef]
- Wang, B.; Wu, R.; Fu, J.X. Pacific-East Asian teleconnection: How does ENSO affect East Asian climate? J. Clim. 2000, 13, 1517–1536. [Google Scholar] [CrossRef]
- Zhang, R.; Sumi, A.; Kimoto, M. A diagnostic study of the impact of El Nino on the precipitation in China. Adv. Atmos. Sci. 1999, 16, 229–241. [Google Scholar] [CrossRef]
- Dai, A.; Wigley, T.M.L. Global Patterns of ENSO-induced Precipitation. Geophys. Res. Lett. 2000, 27, 1283–1286. [Google Scholar] [CrossRef]
- Raspopov, O.M.; Dergachev, V.A.; Kolström, T. Periodicity of climate conditions and solar variability derived from dendrochronological and other palaeoclimatic data in high latitudes. Palaeogeogr. Palaeoclimatol. Palaeoecol. 2004, 209, 127–139. [Google Scholar] [CrossRef]
© 2020 by the authors. Licensee MDPI, Basel, Switzerland. This article is an open access article distributed under the terms and conditions of the Creative Commons Attribution (CC BY) license (http://creativecommons.org/licenses/by/4.0/).