Article

The Impact of Utility-Scale Photovoltaics Plant on Near Surface Turbulence Characteristics in Gobi Areas

1
Key Laboratory of Land Surface Process and Climate Change in Cold and Arid Regions, Northwest Institute of Eco-Environment and Resources, Chinese Academy of Sciences, Lanzhou 730000, China
2
College of Resources and Environment, University of Chinese Academy of Sciences, Beijing 100049, China
3
Key Laboratory for Semi-Arid Climate Change of PRC Ministry of Education, College of Atmospheric Sciences, Lanzhou University, Lanzhou 730000, China
*
Author to whom correspondence should be addressed.
Atmosphere 2021, 12(1), 18; https://doi.org/10.3390/atmos12010018
Submission received: 23 November 2020 / Revised: 20 December 2020 / Accepted: 21 December 2020 / Published: 24 December 2020
(This article belongs to the Special Issue Nonlinearities, Turbulence and Chaos in Space and Earth Systems)

Abstract

:
With the rapid deployment of utility-scale photovoltaic (PV) plants, the impact of PV plants on the environment is a new concern of the scientific and social communities. The exchange of sensible and latent heat energy and mass between land and air in PV plants is crucial to understanding its impact. It is known that the near surface turbulence characteristics rule the exchange. Therefore, it is essential for understanding the impact to study the characteristics of near surface turbulence. However, it is not well recognized. Turbulent fluxes and strength characteristics for the PV plant and the adjacent reference site in the Xinjiang Gobi area were investigated in this study. Various surface layer parameters including friction velocity, stability parameter, momentum flux, and turbulent flux were calculated using eddy correlation system. Results indicate that compared to the reference site, near the surface boundary layer was more unstable during the daytime due to the stronger convection heating, while it was more stable at night in the PV plant. In the PV plant, I u was weakened and I v was strengthened during the daytime, and I u and I v were all weakened at night, while I w was strengthened across the whole day. The significant difference between I u and I v in the PV plant indicated that the horizontally turbulence strengths were affected by the plant layout. The turbulent kinetic energy of the PV plant was lower than the reference site and the momentum in the PV plant was higher than the reference site, especially during the daytime. Compared to the reference site, the PV plant had a higher sensible heat flux and less latent heat flux. The turbulent components of wind followed the 1/3 power law in the unstable conditions and stable conditions in the PV plant and the reference site.

1. Introduction

Solar energy development is considered as one of the efficient countermeasures against environmental crisis. The rapid progress of PV technologies and the dramatic reduction in cost has impelled the development of the PV industry [1,2]. Nowadays, more and more PV plants have been setup worldwide. Consequently, one concern, the environmental impact of PV plants is raising awareness in the public and scientific community. The exchange of sensible and latent energy and mass between land and air in PV plants is crucial to formulate its impact. It is known that the near surface turbulence characteristics rule the exchange.
The transport of momentum, heat, and moisture between the Earth’s surface and atmosphere is dominated by turbulence, which, as a key physical process in the atmospheric boundary layer (ABL), plays an important role in the formation and evolution of the planetary boundary layer [3,4,5,6,7]. Topography modifies atmospheric turbulence through various processes including radiative, thermodynamic, and dynamic effects [8,9]. The heterogeneity in surface cover generates a significant impact on the micrometeorological parameters [10,11]. The characteristics of the micrometeorological parameters of surface boundary layer such as turbulent fluxes, turbulent diffusion, and wind profiles have been described in previous studies [12,13,14,15,16,17].
According to the Monin–Obukhov (M–O) similarity theory, the non-dimensional wind speed component can be expressed as a universal function of the non-dimensional stability parameter for the isotropic boundary layer with a steady and horizontally homogeneous underlying surface [18,19]. In recent decades, with the advancement of theoretical analysis and the progress of observational technology, many investigations and verifications of M–O similarity theory over different surface conditions such as urban, plateau, ocean, and mountainous regions have been carried out [20,21,22,23,24,25,26,27,28]. Panofsky et al. found that the relationship between normalized standard deviation of wind speed and the stability parameter on the flat underlying surface was in accordance with the 1/3 power law [20]. M–O similarity theory has failed to be verified for the coastal marine boundary layer in near-neutral and stable conditions [21]. Moreover, the characteristics of turbulence over mountainous terrain demonstrates that M–O similarity theory is also applicable to the anisotropic boundary layer [28].
Although some features of the surface boundary layer over different underlying types have been investigated in the above studies, few studies have been carried out in areas with a utility-scale deployment of PV plants. Generally, darker-colored PV panels change the radiative forcing on the Earth’s surface by reducing the surface albedo [29,30] and usually increases surface roughness [31]. In previous studies, some observational studies found that a utility-scale PV plant in barren areas produced a heating effect of about 2–4 K on the near surface air due to low albedo and specific heat capacity of PV panels [32,33,34]. A recent observation found that PV plants increased the sensible heat flux and reduced the storage and release of soil heat flux [35]. Unfortunately, near surface turbulence characteristics, which are crucial to formulate these impacts of PV plants, are not well recognized.
In this study, we investigated the characteristics of the near surface air turbulence, dynamical, and thermal-dynamical properties in a utility-scale PV plant and an undisturbed reference site in the Wujiaqu Gobi area in Xinjiang. The rest of this paper is organized as follows. Section 2 introduces the experimental design and the derived methodology related to the turbulence parameters discussed in this study; Section 3 presents the comparison results and relevant discussion; and Section 4 summarizes the conclusions.

2. Site Overview and Methods

2.1. Site Overview

This experiment was conducted in a utility-scale PV plant in the Wujiaqu Gobi area of Xinjiang. Wujiaqu is located at the intersection of the desert and oasis in the southeast of the Jungar Basin. It is cold in winter and hot in summer, and it is dry all year round, a typical continental temperate arid climate. The PV plant had a length of 1120 m from north to south and a width of 1030 m from east to west, covering an area of about 1.15 km2 and a capacity of 70 MW. The PV panel lies with the inclination angle of 37°, the row spacing of the PV array was 7.5 m, and the top edge of the PV panel was 2.5 m above the ground. The panel material was polysilicon and the maximum power was 250 W.
We set up two observation systems in and out of the plant, respectively. One (Figure 1c) was located out of the plant and taken as the reference site as it was free of PV panels, compared to the one inside the plant (Figure 1a). The location of the observation site in the PV plant is 44.406° N, 87.656° E with the altitude of 439 m. The reference site is located 910 m northeast to the observation point in the plant (44.409° N, 87.667° E) with the altitude of 437 m. The terrain is relatively flat. The observation systems contained two meteorological observation towers of 11 m high, respectively. The underlying surface is Gobi with sparse vegetation. The soil type is sandy soil, and the soil texture is relatively coarse.
The various turbulence parameters were derived from the ultrasonic open-circuit vortex covariance system, which were installed at the height of the 5.5 m level in the PV plant and at a 3 m level in the reference site, respectively. The equipment of the ultrasonic open-circuit vortex covariance system used in our experiment was IRGASON-IC-BB by Campbell, USA. It integrates an open-circuit infrared gas analyzer and a three-dimensional ultrasonic anemometer. The drift error was less than ±8 cm/s for Ux, Uy, and Uz. IRGASON-IC-BB can measure the vertical flux of heat and water vapor in the atmosphere and various pulsations. The data collection and sampling frequency was 10 Hz, and a 30 min-averaged wind speed was used for calculating the related surface layer parameters. The data period was from 8 June to 31 October 2019, and the time system used in this paper was Beijing time.

2.2. Flux Data Processing and Calculation Methods

The high frequency ultra-sonic anemometer observational data were processed by Easyflux, which is an online processing software used for post-data processing and thee quality control of ultrasonic observations. The main procedures include outlier elimination, double rotation and plane fitting method coordinate rotation [36], frequency delay time correction [37], ultrasonic virtual temperature correction [38], and WPL correction [39]. Finally, 30 min-averaged turbulent fluxes were calculated, and the data quality evaluation such as the turbulence stability test and development adequacy ITC (Integral Turbulence Characteristics) test were used to check the accuracy of the fluxes.
The surface layer parameters analyzed in this study mainly include friction velocity u * , temperature scale T * , stability parameter ζ , roughness length Z 0 , turbulence strength I , turbulent kinetic energy e , momentum flux τ , sensible heat flux H , and latent heat flux L E . The eddy correlation method was employed to derive these parameters. Normalized standard deviation of 3D wind were analyzed as a function of ζ .
In the boundary layer, after introducing dimensionless variables through scale parameters, the contours of many variables can be expressed in a general form [40]. Among them, the scaling speed, as a basic surface speed scaling parameter, also called friction speed, can be obtained by the following formula:
u * = ( ( u w ) ¯ 2 + ( v w ) ¯ 2 ) 1 4 ,
The temperature scale and length scale parameters are as follows:
T * = w T ¯ | u * | ,
L = u * 3 T ¯ k g ( w T ¯ ) ,
Among them, the fluctuations of the three-dimensional wind speed component and temperature are obtained by subtracting the average value from the instantaneous value of each parameter, that is, u = u u ¯ , v = v v ¯ , w = w w ¯ , T = T T ¯ , k = 0.4 is the Von Karman constant, and g is the acceleration of gravity.
Atmosphere stability parameter ζ is a measure of the buoyancy convection ability and is obtained by:
ζ = z d L ,
where z is the measurement height (5.5 m for the PV plant and 3 m for the reference site), d is the zero-plane displacement.
The roughness length Z 0 depends not only on the surface type, but also on the surface roughness texture, and can be derived from a wind profile under neutral conditions [41]:
Z 0 = ( z d ) exp ( k u ¯ 2 + v ¯ 2 u * ) ,
Turbulence strength is defined as the ratio of the standard deviation of the three wind speed components to the average wind speed:
I u = σ u / U ¯ ,   I v = σ v /   U ¯ ,   I w = σ w / U ¯ ,
where σ u ,   σ v ,   σ w are the standard deviation of wind speed fluctuations: σ u = u u ¯ , σ v = v v ¯ , σ w = w w ¯ .
The turbulent parameters are computed using the following formulae:
e = 0.5 ( σ u 2 + σ v 2 + σ w 2 ) ,
τ = ρ u w ¯ ,
H = C p ρ w T ¯ ,
L E = λ ρ w q ¯ ,
where ρ and C p are the density and the constant specific heat capacity of air, respectively;   q is the fluctuation of water vapor density; and λ is the latent heat of evaporation.
According to the M–O similarity theory, the normalized standard deviation of the turbulent velocity component can be expressed by the universal function of the stability parameter ζ :
σ u , v , w u * = a ( 1 + b | ζ | ) 1 3 ,
where a and b are the site-specific modeling coefficients.

3. Results and Discussion

3.1. Atmospheric Stability Parameter and Aerodynamic Roughness

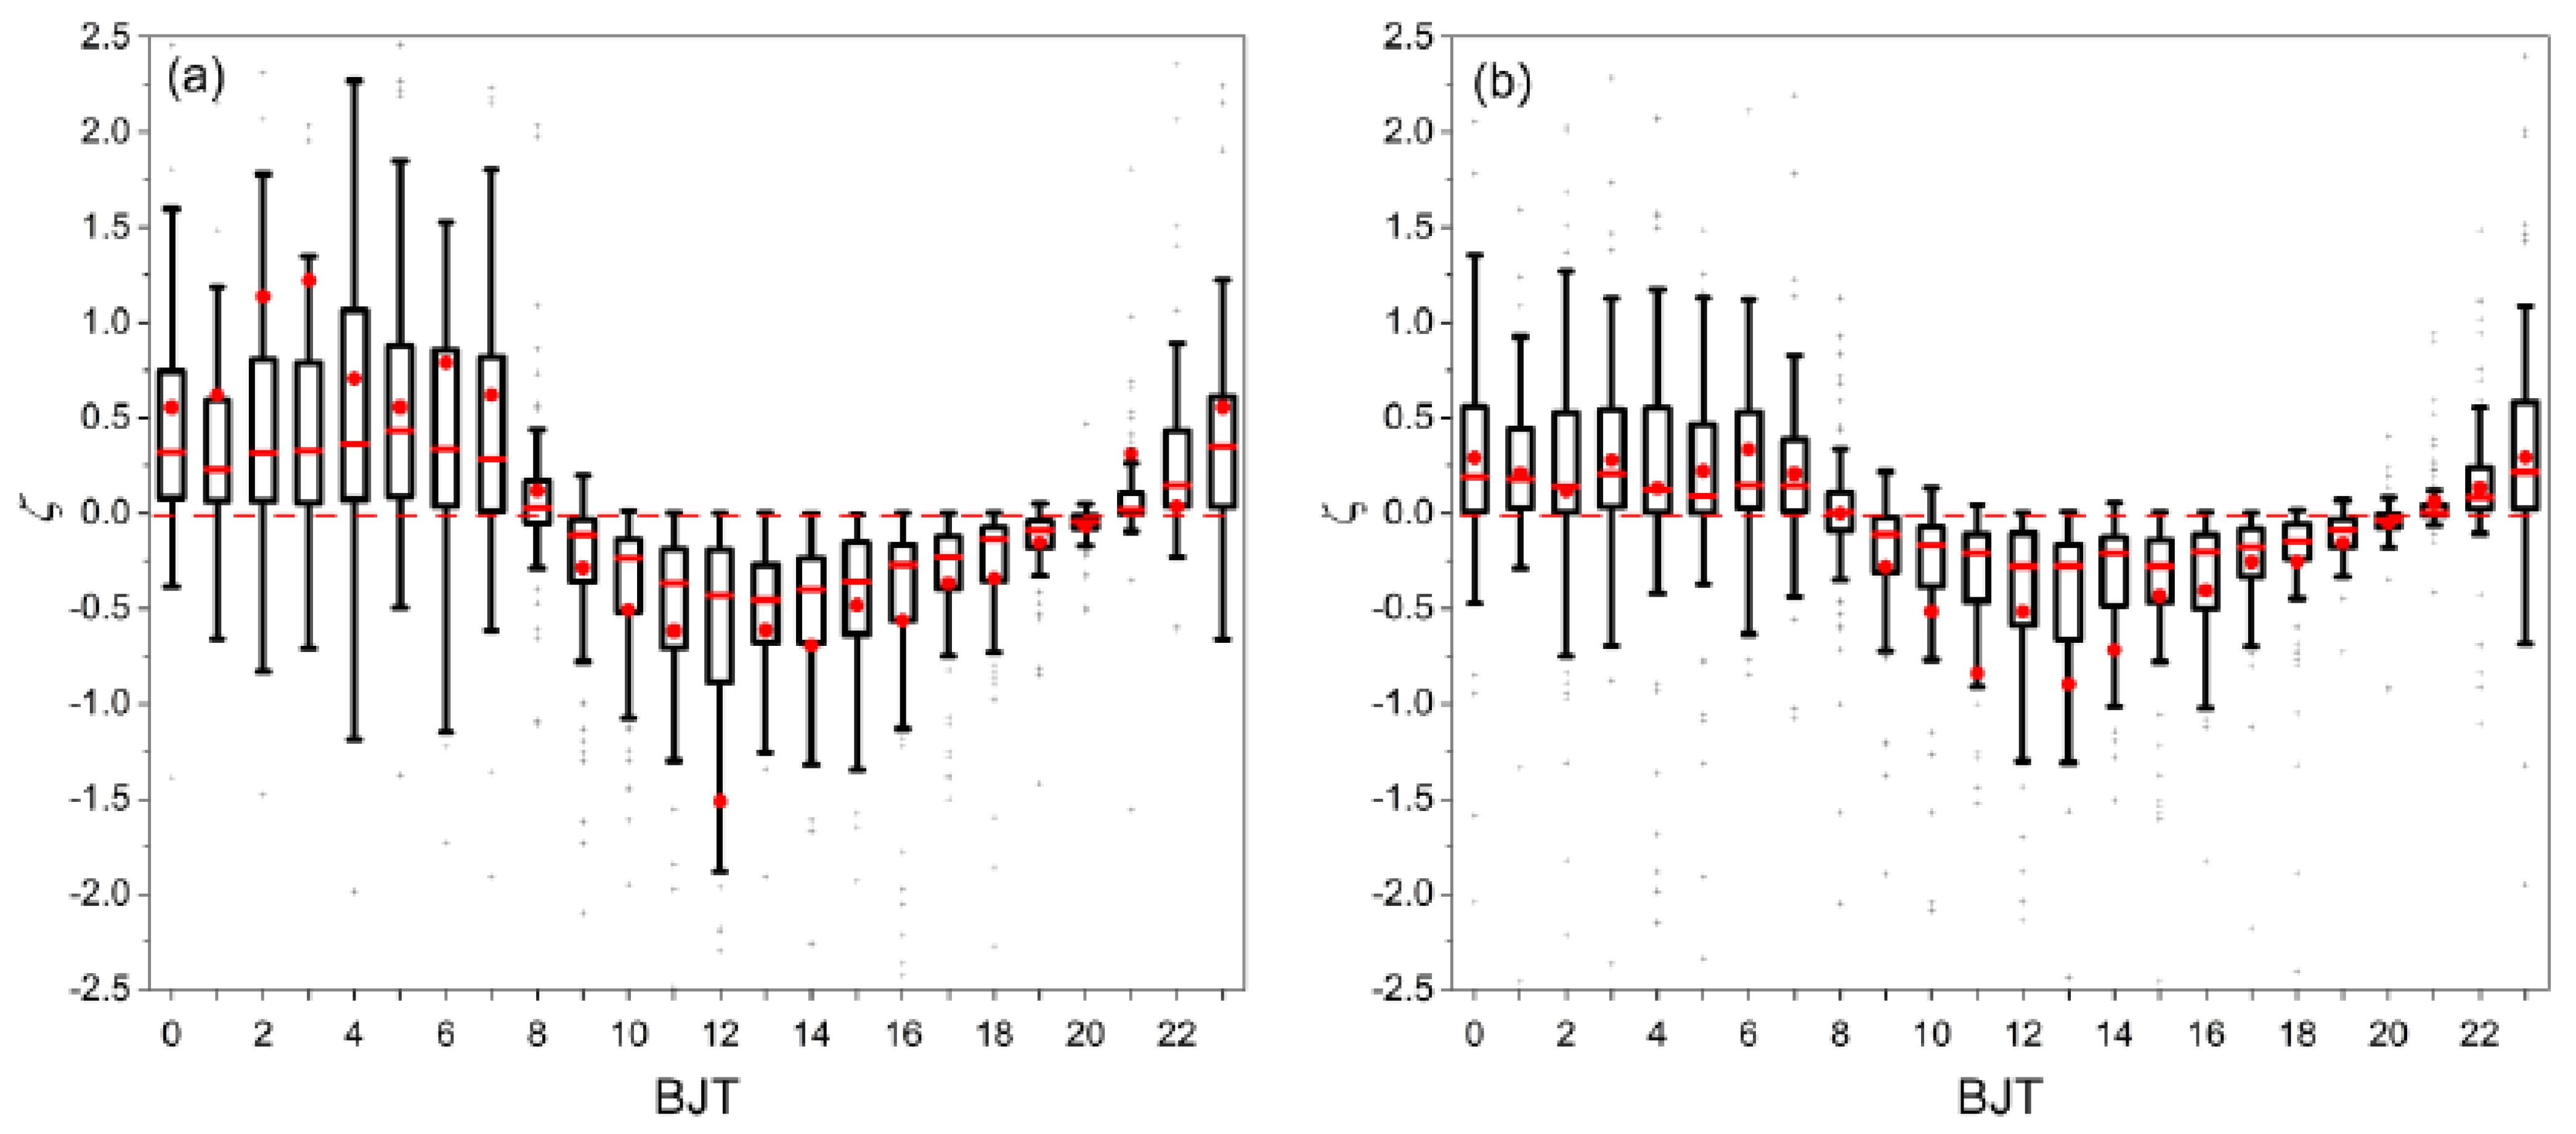
Atmospheric stability ζ and aerodynamic roughness Z 0 are important factors that control the energy exchange between the Earth and atmosphere. The diurnal variation of ζ was analyzed for the PV plant and the reference site in Figure 2. The positive ζ during early morning and at night indicated stable conditions ( ζ > 0 ) of near-surface atmosphere due to the stratification of the atmosphere caused by surface radiational cooling, while the negative ζ during the daytime from 9:00 to 17:00 indicated unstable conditions ( ζ < 0 ), which resulted from the accumulation of surface solar radiation. Although similar characteristics of ζ were found at both sites, there were a few differences. During the daytime, the near surface air has higher instability with the average minimum ζ of smaller than −1.5 at 12:00 in the PV plant compared with the reference site (Figure 2a,b). The highly unstable conditions of near surface air may be caused by the strong convection exchange in the PV plant reported in the previous study [35]. For nocturnal hours, larger ζ in the PV plant indicated more stable near surface atmospheric stratification than that of the reference site, which may have resulted from the thermal insulation effect of PV modules on the ground surface at night. The magnitude of daily variation of ζ in the PV plant was larger than that of the reference site, as evident from the length of the whiskers.
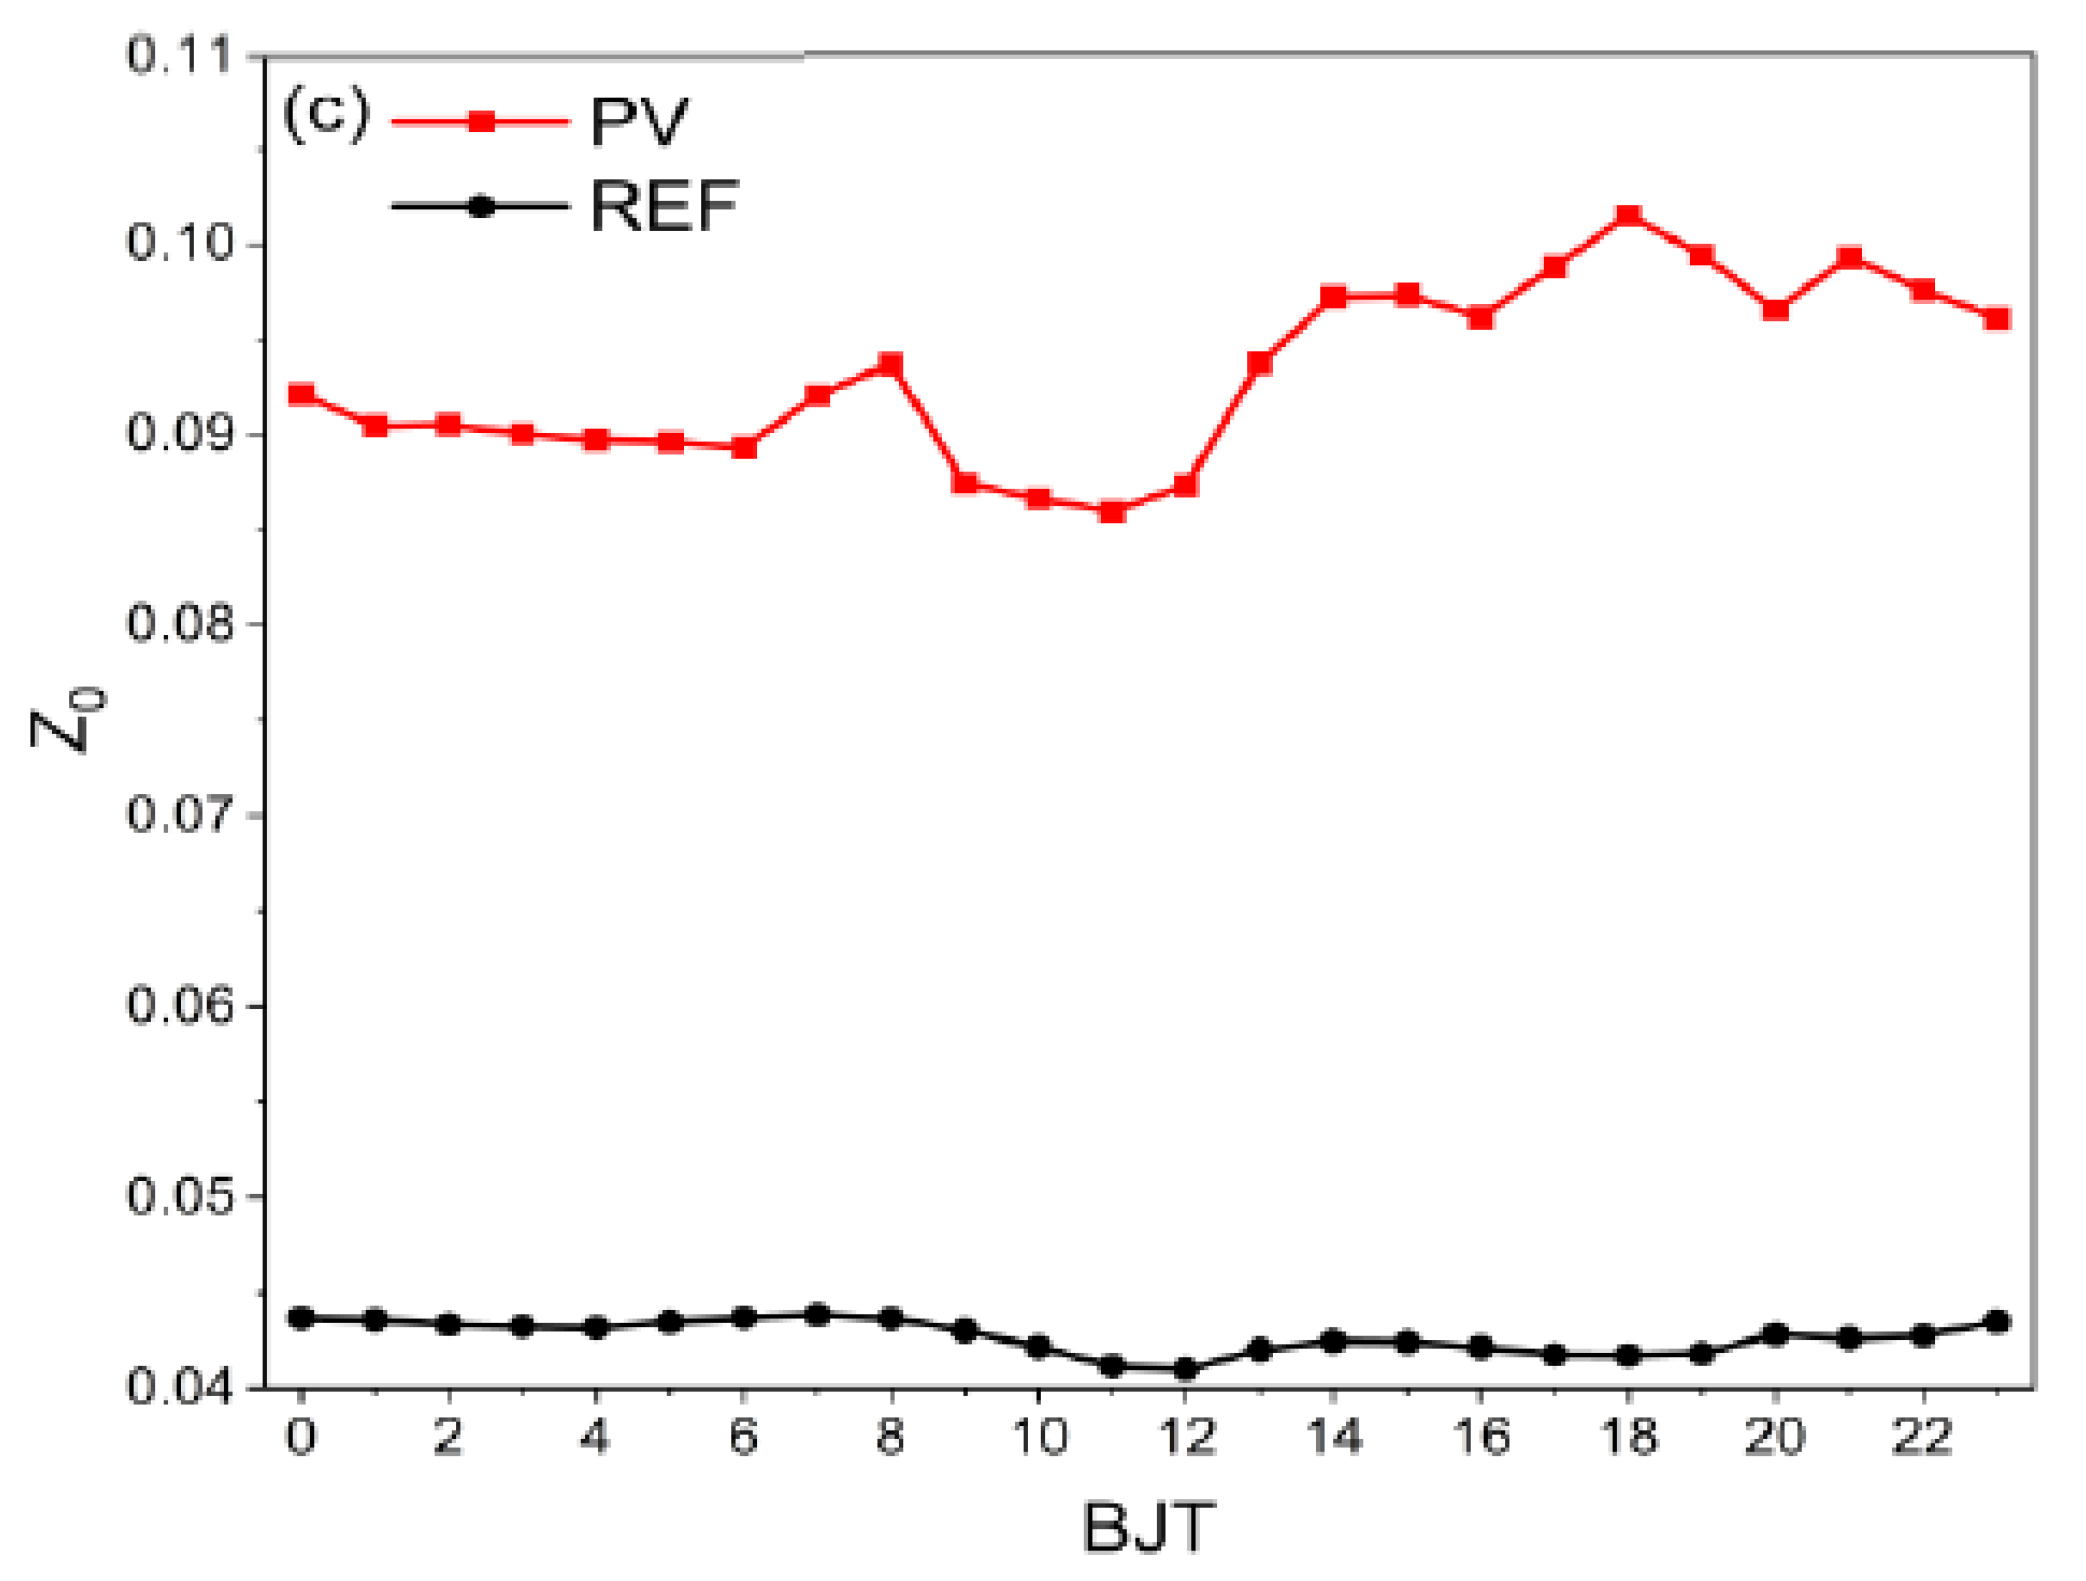
Aerodynamic roughness Z 0 refers to the height with a wind speed of zero, and changes dynamically because its magnitude not only depends on the structure and shape of the surface roughness element, but also depends on the near-surface airflow conditions to a certain extent [42]. Z 0 in the PV plant with the value of 0.08~0.1 m was larger than the reference site with a value slightly larger than 0.04 m (Figure 2c), indicating that the PV underlying surface was rougher than the flat Gobi surface. More obvious diurnal variation of Z 0 in the PV plant also revealed a more complicated influence of panels on the airflow compared with the reference site. The averaged Z 0 was 0.089 m in the PV plant and 0.041 m in the reference site, respectively, and the order of magnitude was similar to the previous studies in grassland and shrub sandbags in New Mexico [43], but an order of magnitude larger than studies in the Heihe Desert (0.0045 m), Heihe Gobi (0.0045 m), and Dunhuang Gobi (0.0019 m).

3.2. Scaling Parameters

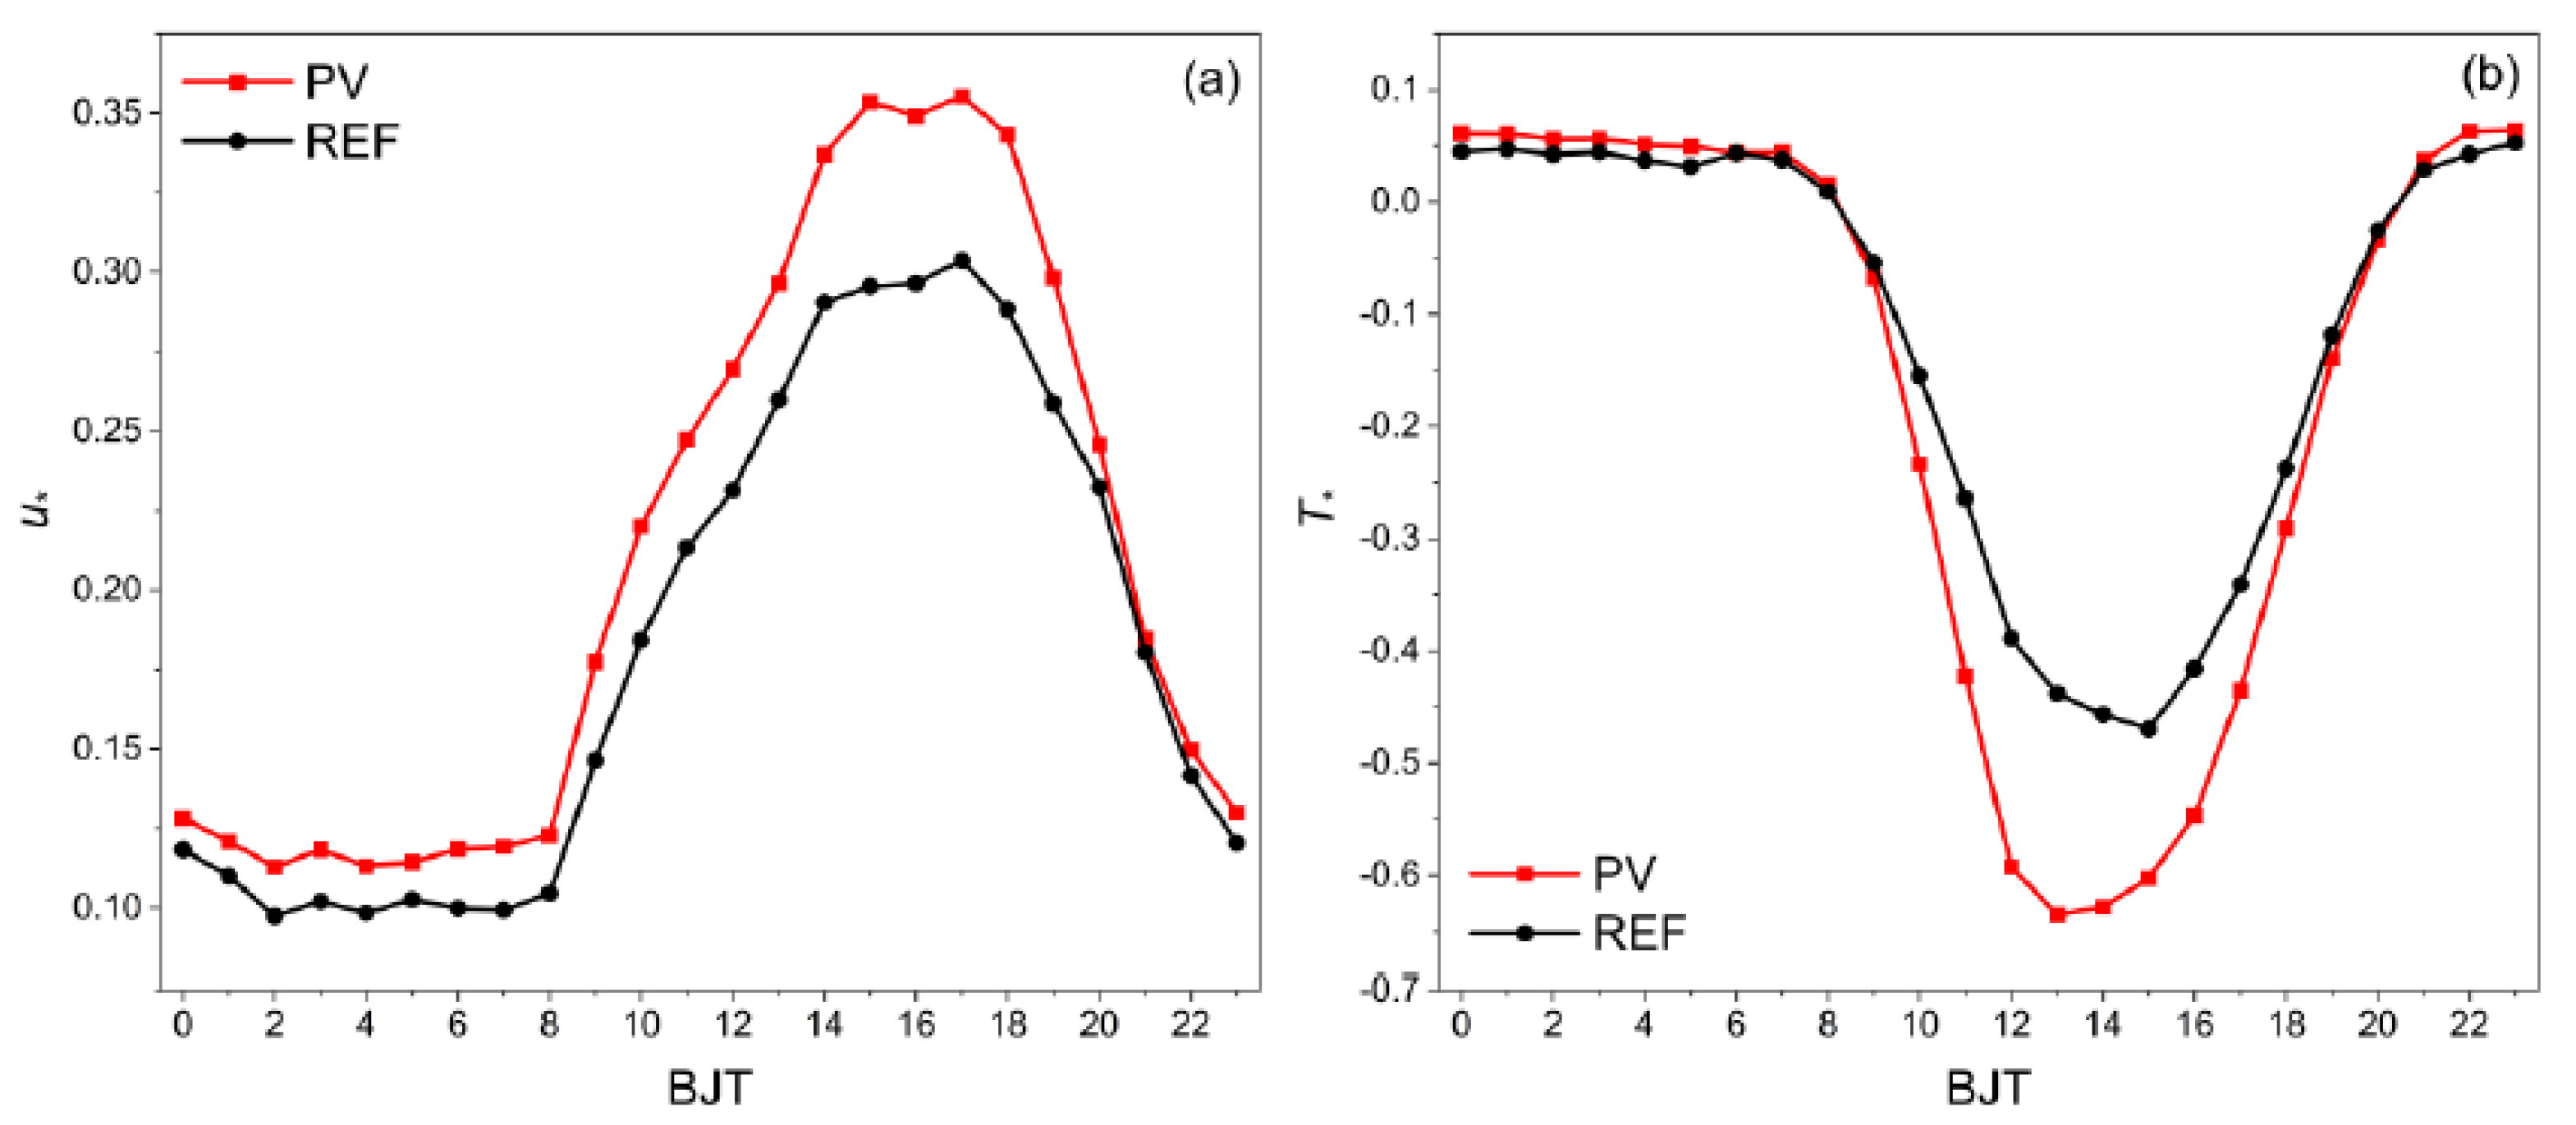
Friction velocity u * , as an important dynamic characteristic parameter, characterizes the interaction between near-surface airflow and surface roughness element, and reflects the diffusion and transport capacity in all directions in space [44]. The diurnal variation of u * was analyzed for the two sites (Figure 3a). The obvious diurnal characteristics of u * indicated strong wind speed during the daytime, and greater u * in the PV plant suggests that the airflow is subjected to stronger friction due to the presence of PV panels, which is not only affected by the surface roughness element, but also related to the wind speed and the strength of the mechanical turbulence.
The characteristic temperature T * (Figure 3b) has the opposite trend related to u * . At both the PV plant and reference site, negative T * decreased after 8:00 and reduced to a minimum value of −0.65 in the PV plant and −0.47 in the reference site in the afternoon, respectively. Positive T * gradually increased after 20:00. Across the whole day, greater u * and T * in the PV plant indicated that the PV panel strengthened the ability of the vertical transport of turbulence in contrast to the reference site.

3.3. Turbulence Strength and Turbulent Kinetic Energy

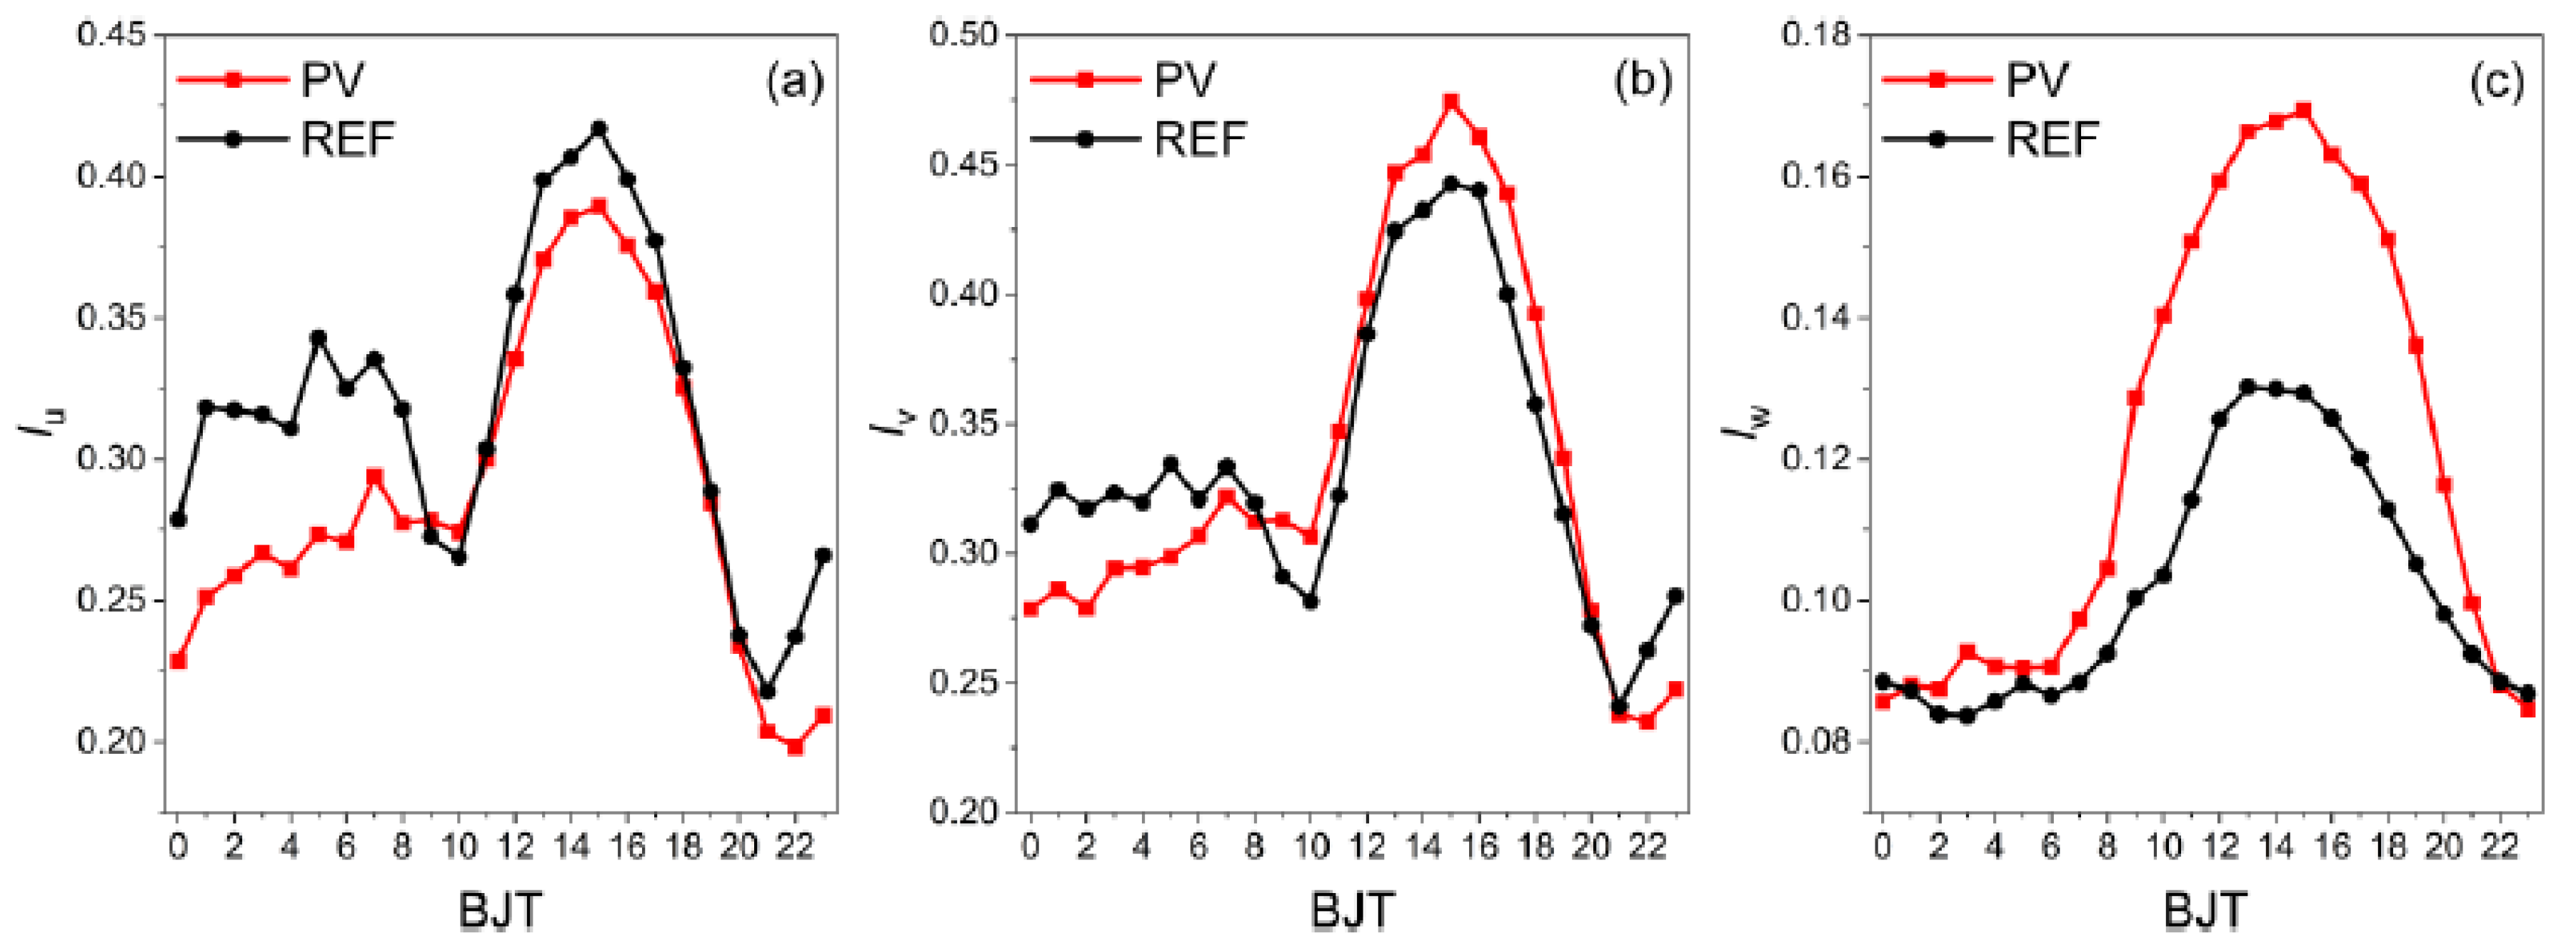
Averaged diurnal variations of the turbulence strength components I u (longitudinal wind), I v   (lateral wind), and I w   (vertical wind) show a similar behavior for the two sites (Figure 4). Strong turbulence occurs under unstable conditions with strong wind speed and solar heating during the daytime, while turbulence at night is significantly weakened. For the horizontal turbulence strength I u and I v in the PV plant, the former was lower while the latter was higher than that of the reference site. The significant difference between I u and I v in the PV plant indicated that the horizontally turbulence strengths were affected by the plant layout. Southward inclination of the PV panel diminished the homogeneity of the north–south direction while it increased homogeneity in the east–west direction, resulting in weaker I u and stronger I v . For nocturnal hours with stable stratification conditions, convective exchange near the ground was suppressed, and turbulence was dominated by mechanical dynamics, and I u and I v in the PV plant was smaller than the reference site, mainly due to the lower wind speed compared to the reference site. In the PV plant, I w was significantly higher, which was a result of the increased vertical turbulence mixing caused by increased surface area and roughness compared to the reference site. The averages of I u ,   I v , and I w in the PV plant (reference site) were 0.29 (0.32), 0.34 (0.34), and 0.12 (0.10), indicating that the turbulence strength was dominated by horizontal flow. The turbulence strength of wind components was higher than that of the Badain Jaran Desert in previous studies [45].
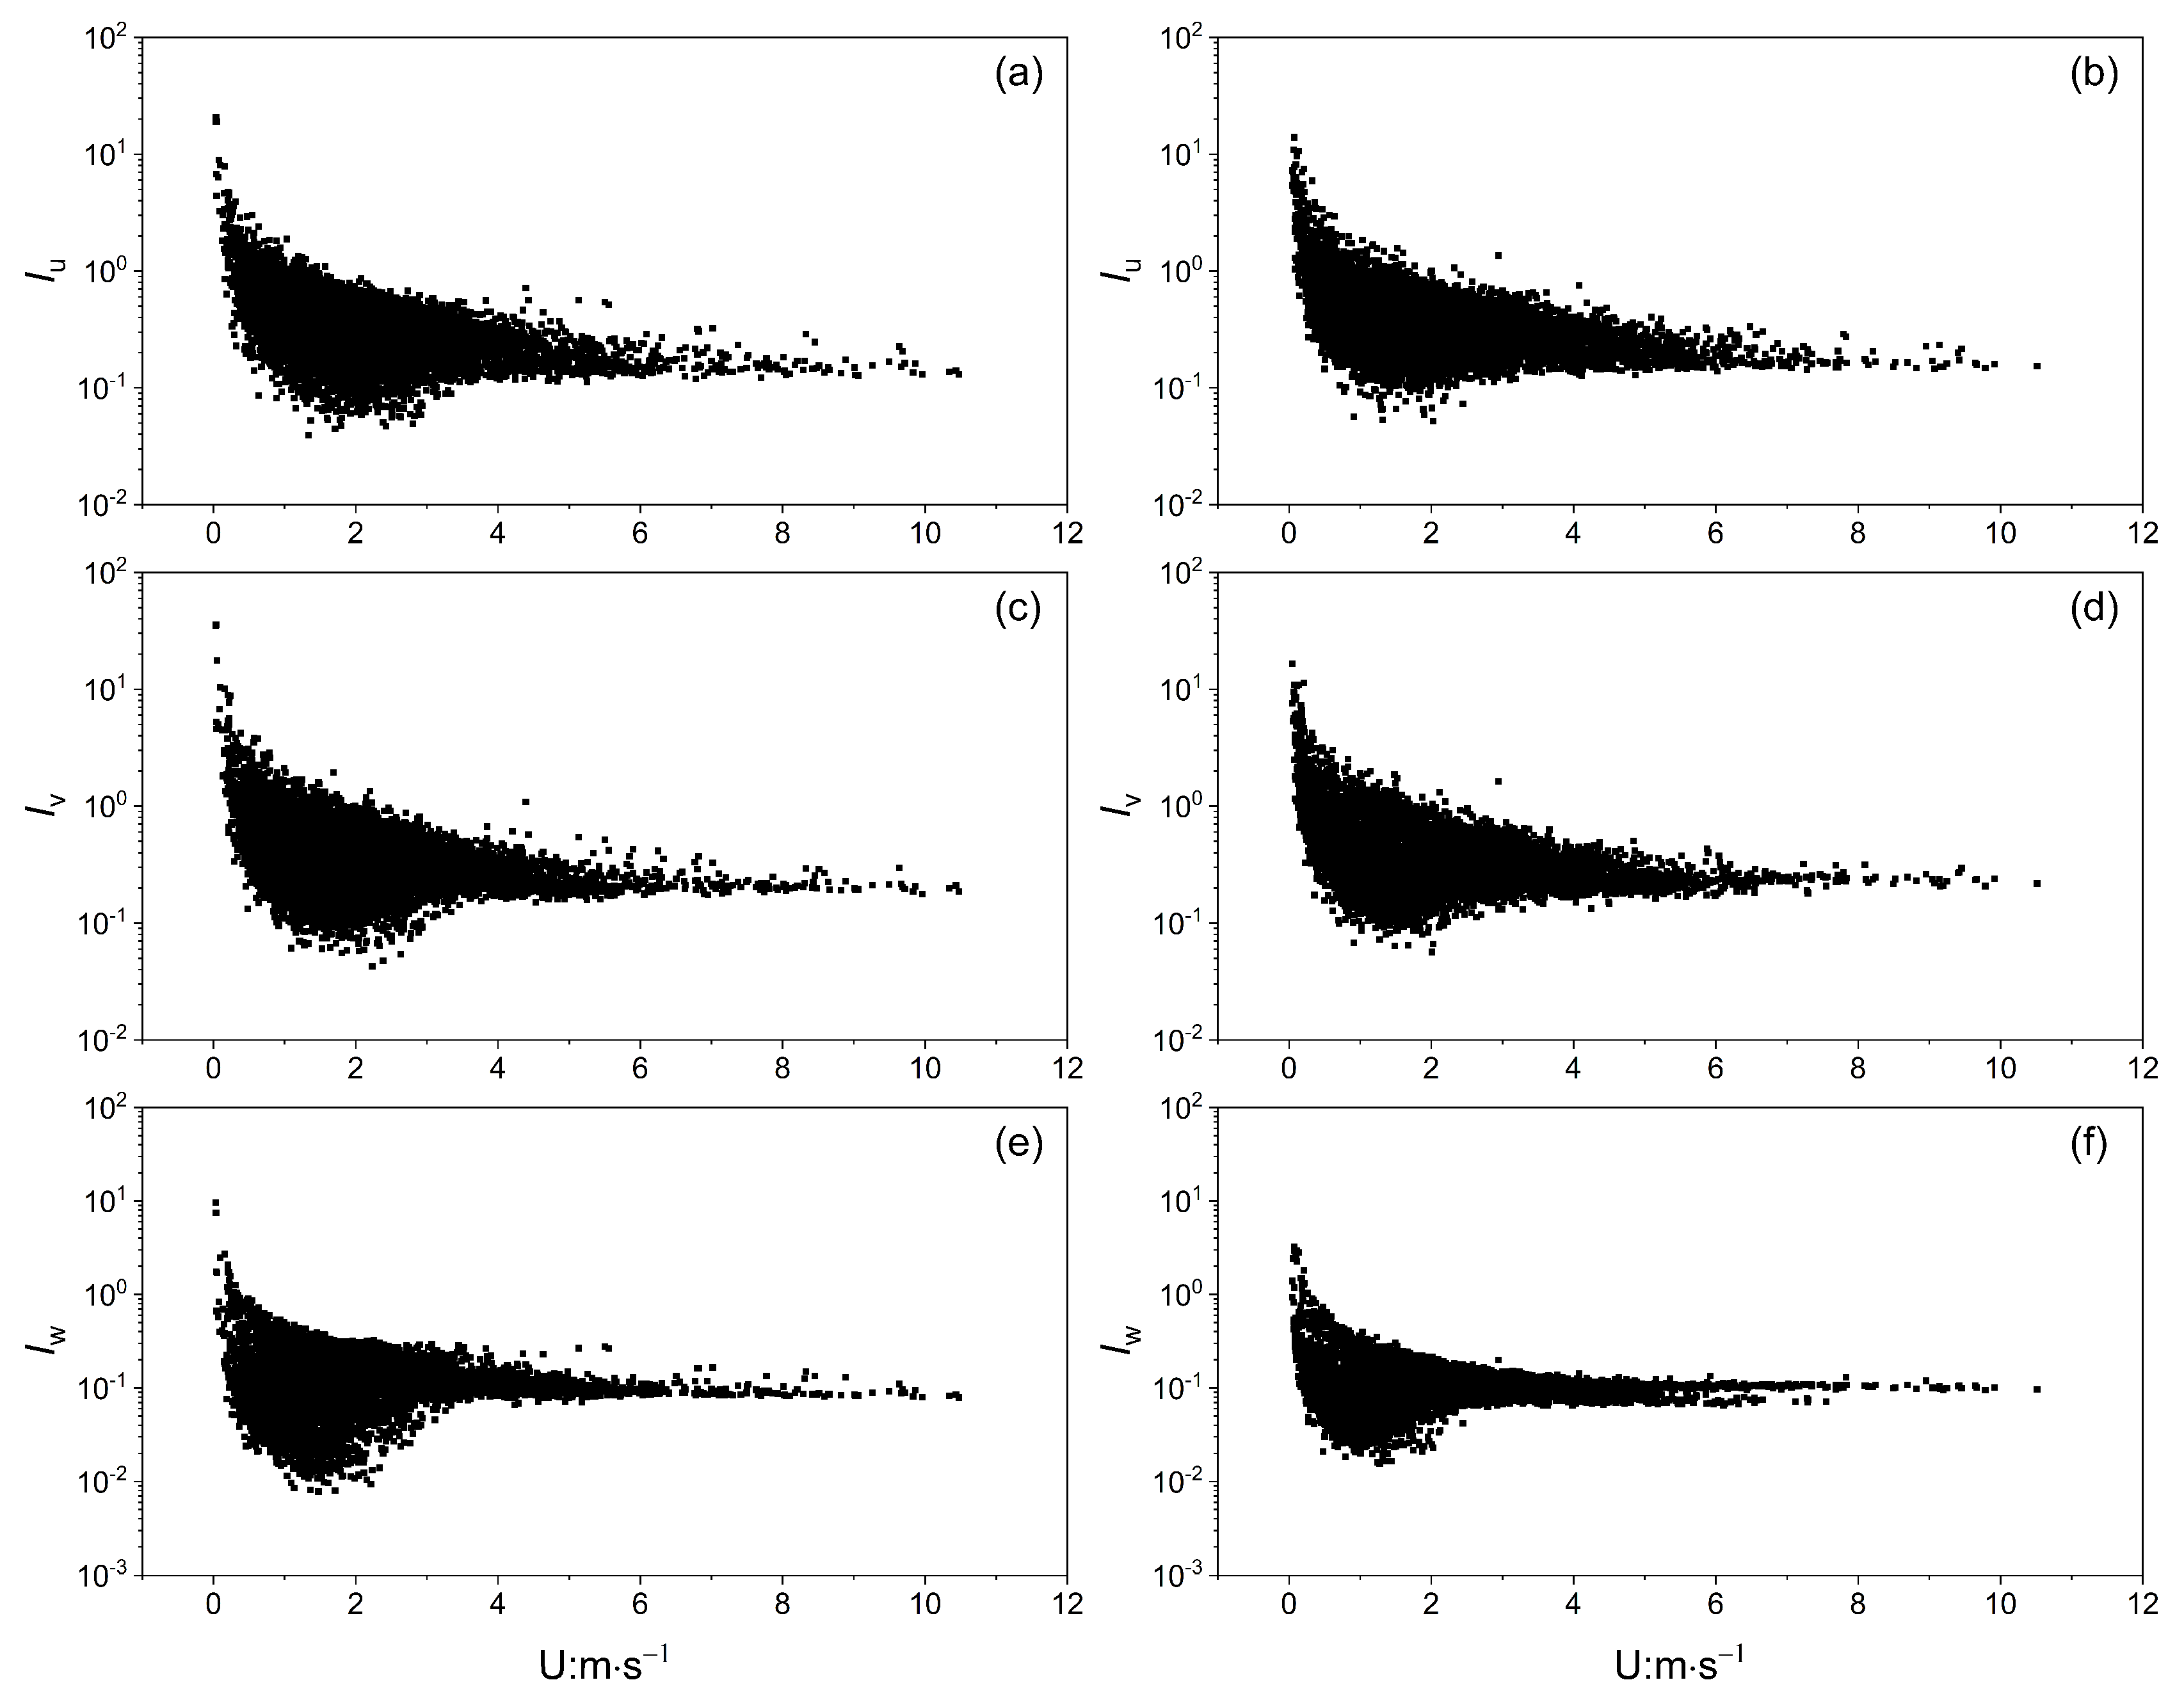
Figure 5 presents the development of turbulence is subjected to wind speed (Figure 5). Scatters of turbulence strengths and wind speed showed a similar trend for all three directions. The higher turbulence strengths corresponded with the lower wind speed. In the state of free convection with wind speeds lower than 2 m/s, the turbulence strengths of three directions decreased sharply with the increase in wind speed. The turbulence developed vigorously with a wind speed lower than 4 m/s while it tended to be steady with a wind speed greater than 6 m/s. The variation amplitude of the turbulence strength with the wind speed of the reference site was smaller than that of the PV plant, especially in the vertical direction.
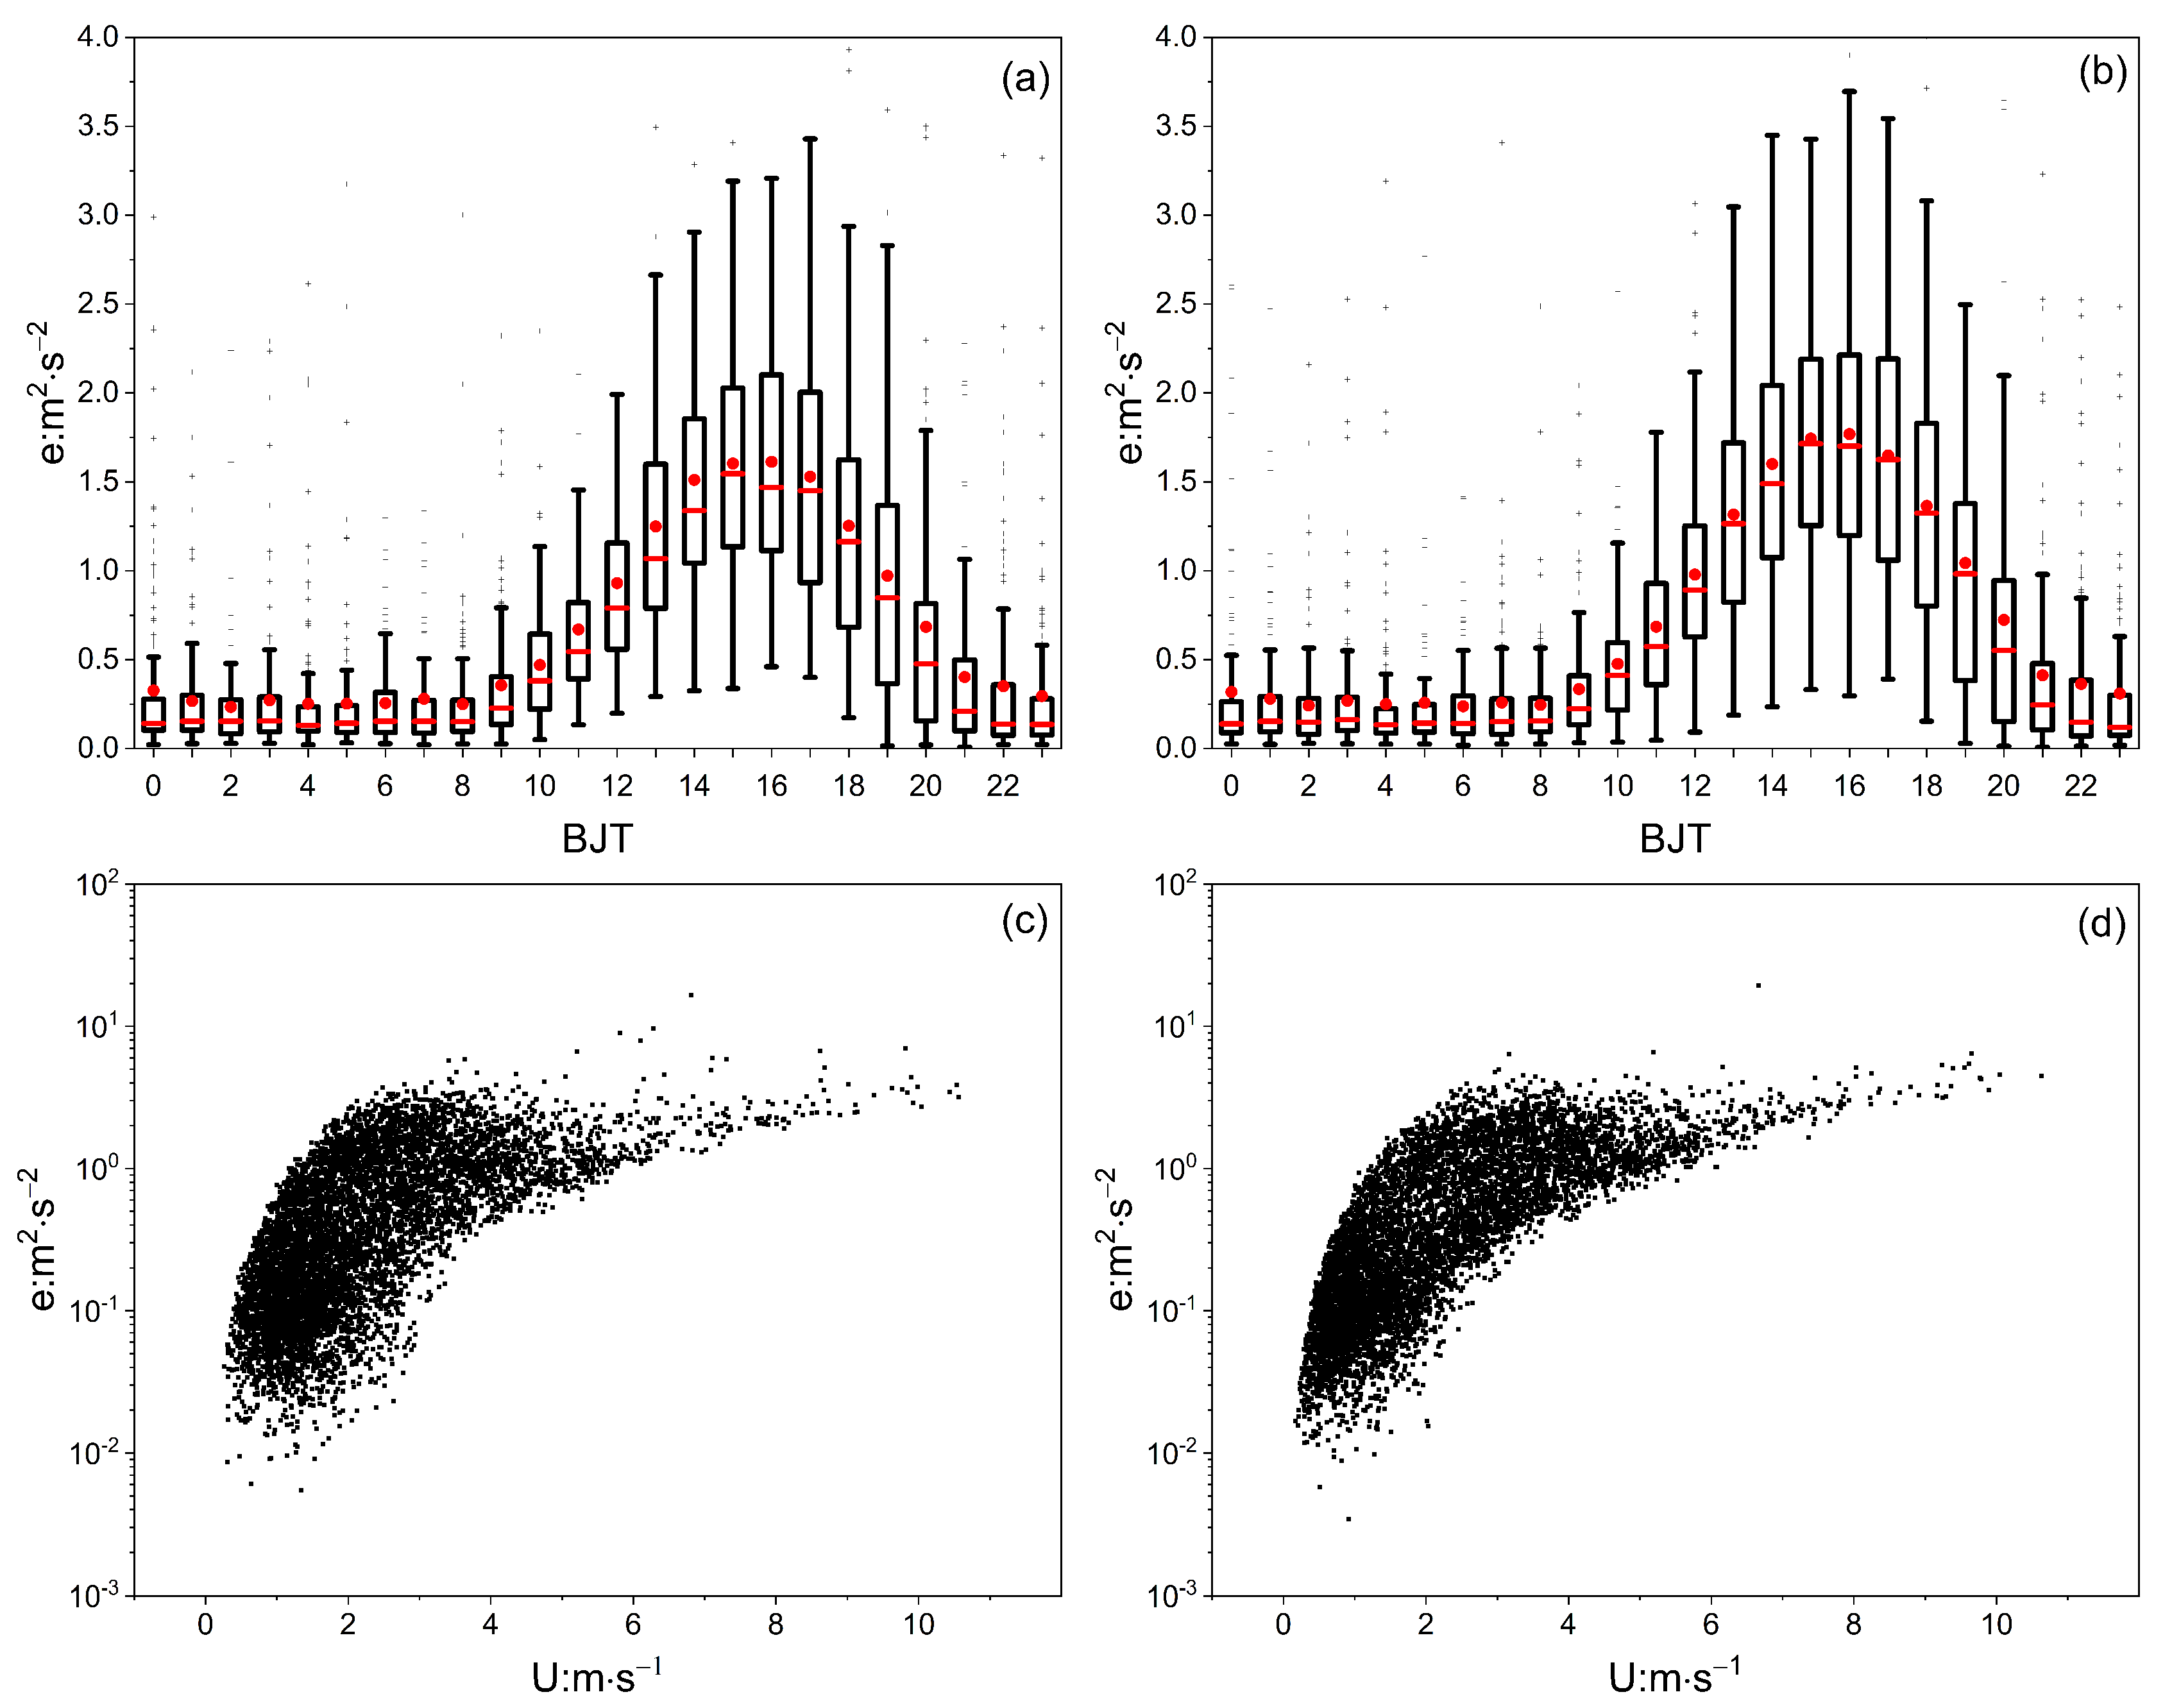
Turbulent kinetic energy (TKE, e) is an important indicator to measure the development and decline of turbulence, involving the transport of momentum, heat, and water vapor in the boundary layer. During the daytime, the TKE increased rapidly after 8:00 and reached a peak value around 16:00 at the two sites (Figure 6a,b), the lower TKE in the PV plant may be caused by a deficit of mean TKE throughout the panel array, which is related to the inclination of panels. At night, the TKE of the two sites ranged from 0.2 to 0.4, and the difference was very slight. With regard to the relationship between the TKE and wind speed (Figure 6c,d), the TKE increased rapidly with the increase in wind speed with a value lower than 4 m/s and tended to be stable when the wind speed was greater than 4 m/s in the two sites, and TKE at the PV plant was more discrete.

3.4. Momentum Flux and Heat Flux

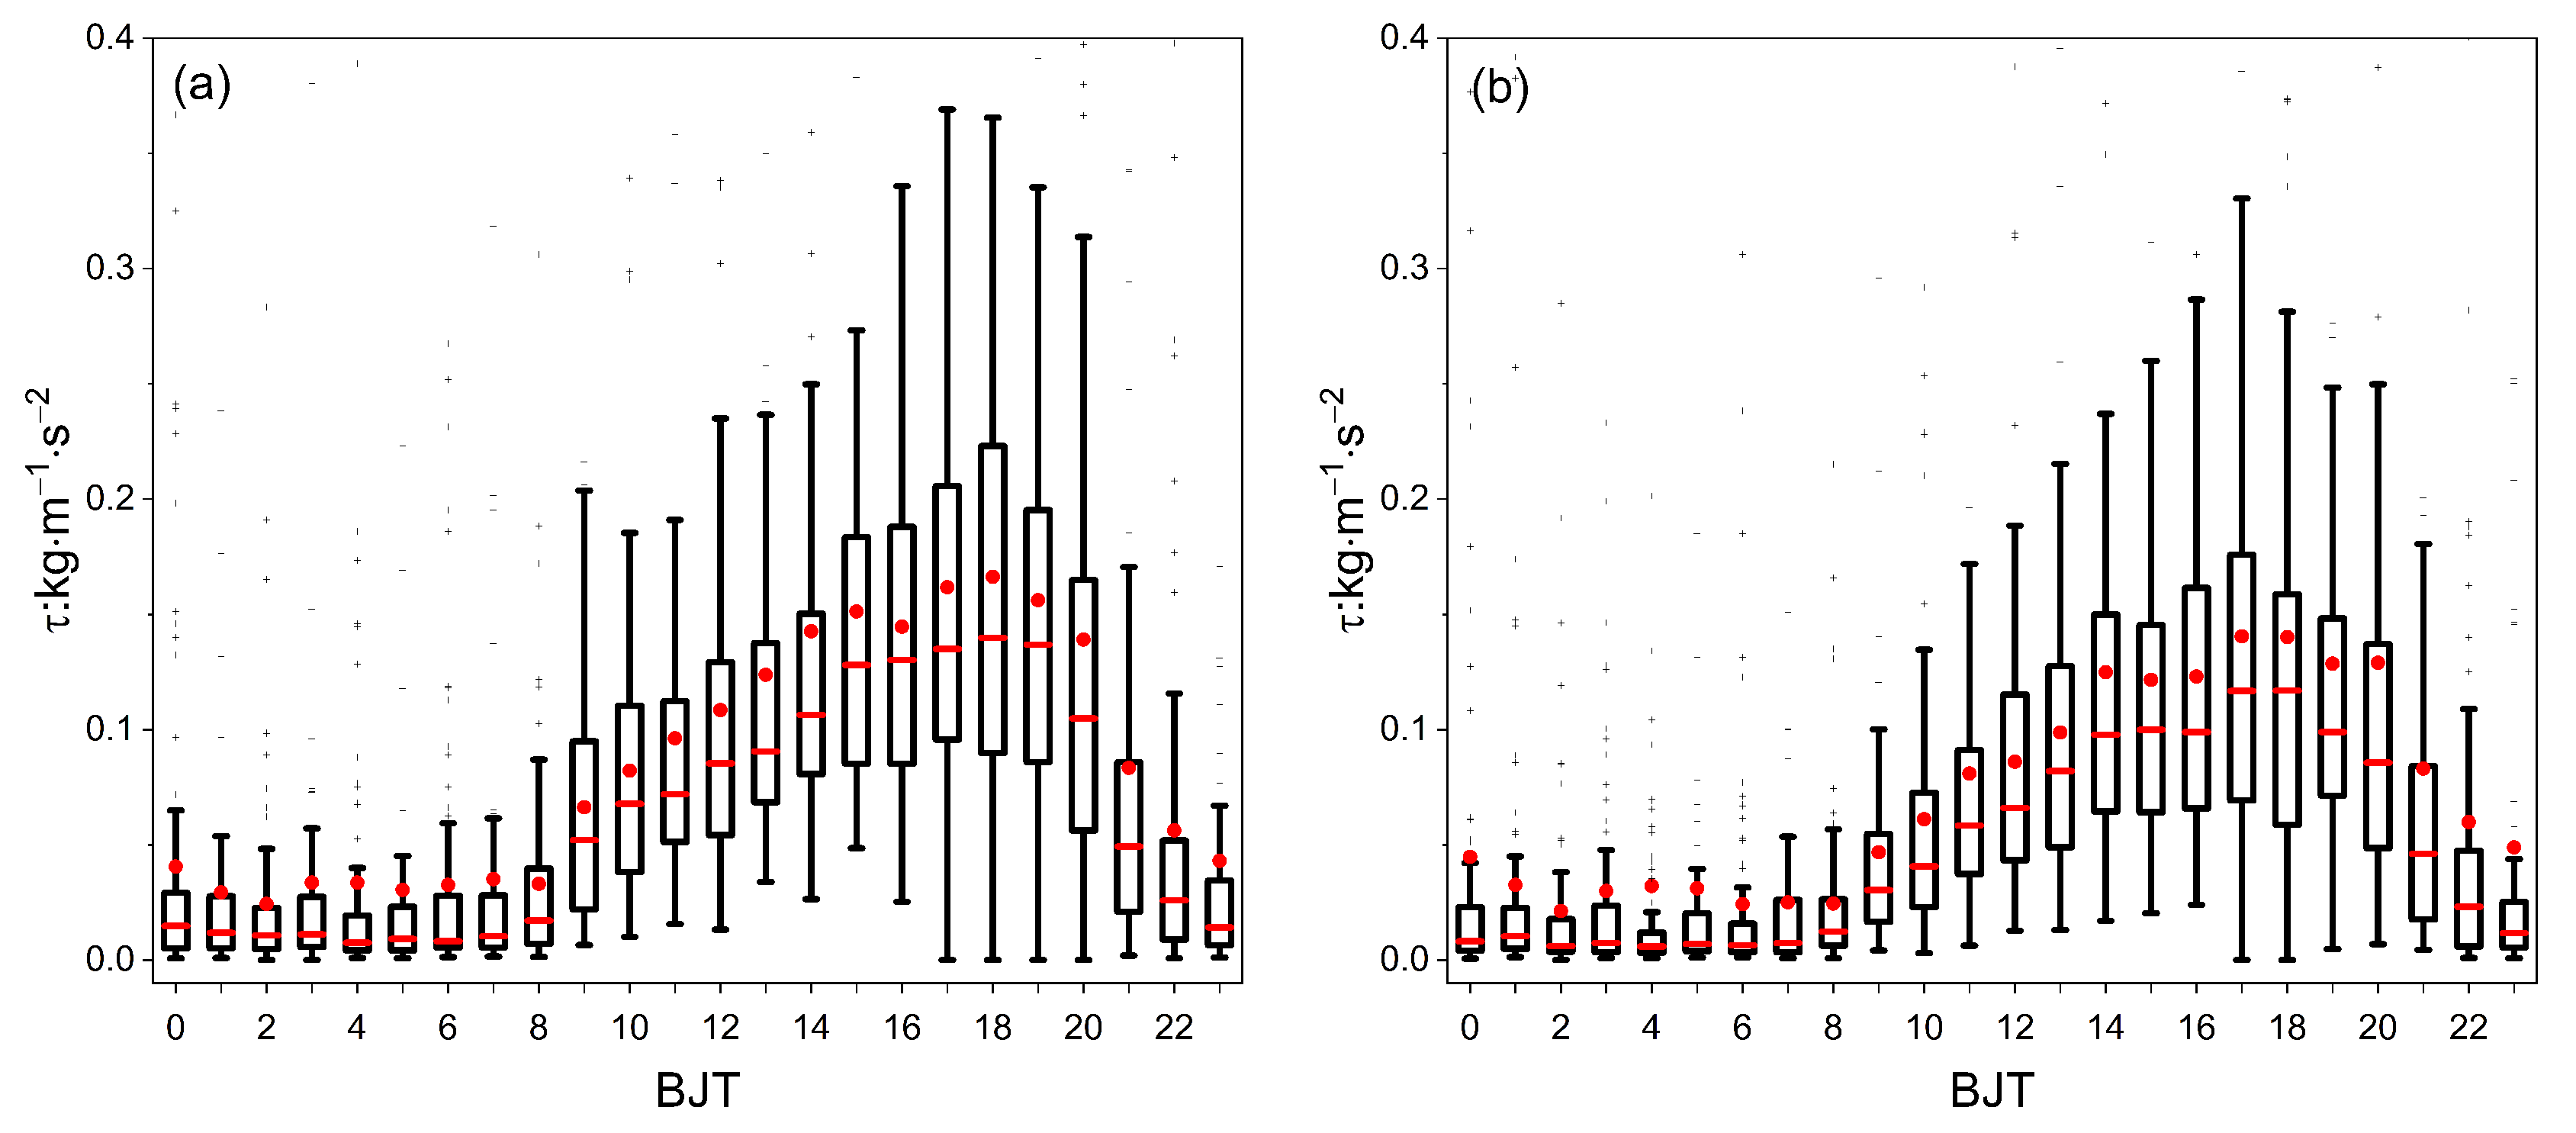
The diurnal variation of momentum flux, as shown in Figure 7, as used to investigate the surface layer dynamics difference between the PV plant and the reference site. Momentum was positive across the whole day and showed obvious diurnal variation in the two sites. The momentum fluxes during the daytime were higher than that at nighttime, and high values of momentum fluxes corresponded to the strong convective turbulence and unstable conditions. PV panels enhanced the vertical interaction with the air flow above the panels, hence the wind shear as the main contributor for mechanical turbulence was stronger in the PV plant than the reference site. The peak daytime momentum fluxes in the PV plant and the reference site were 0.17 and 0.14 kg · m 1 · s 2 , respectively. The lower momentum flux at night was associated with the weak development of turbulence, and the momentum flux in the PV plant was slightly higher than that of the reference site in the late night.
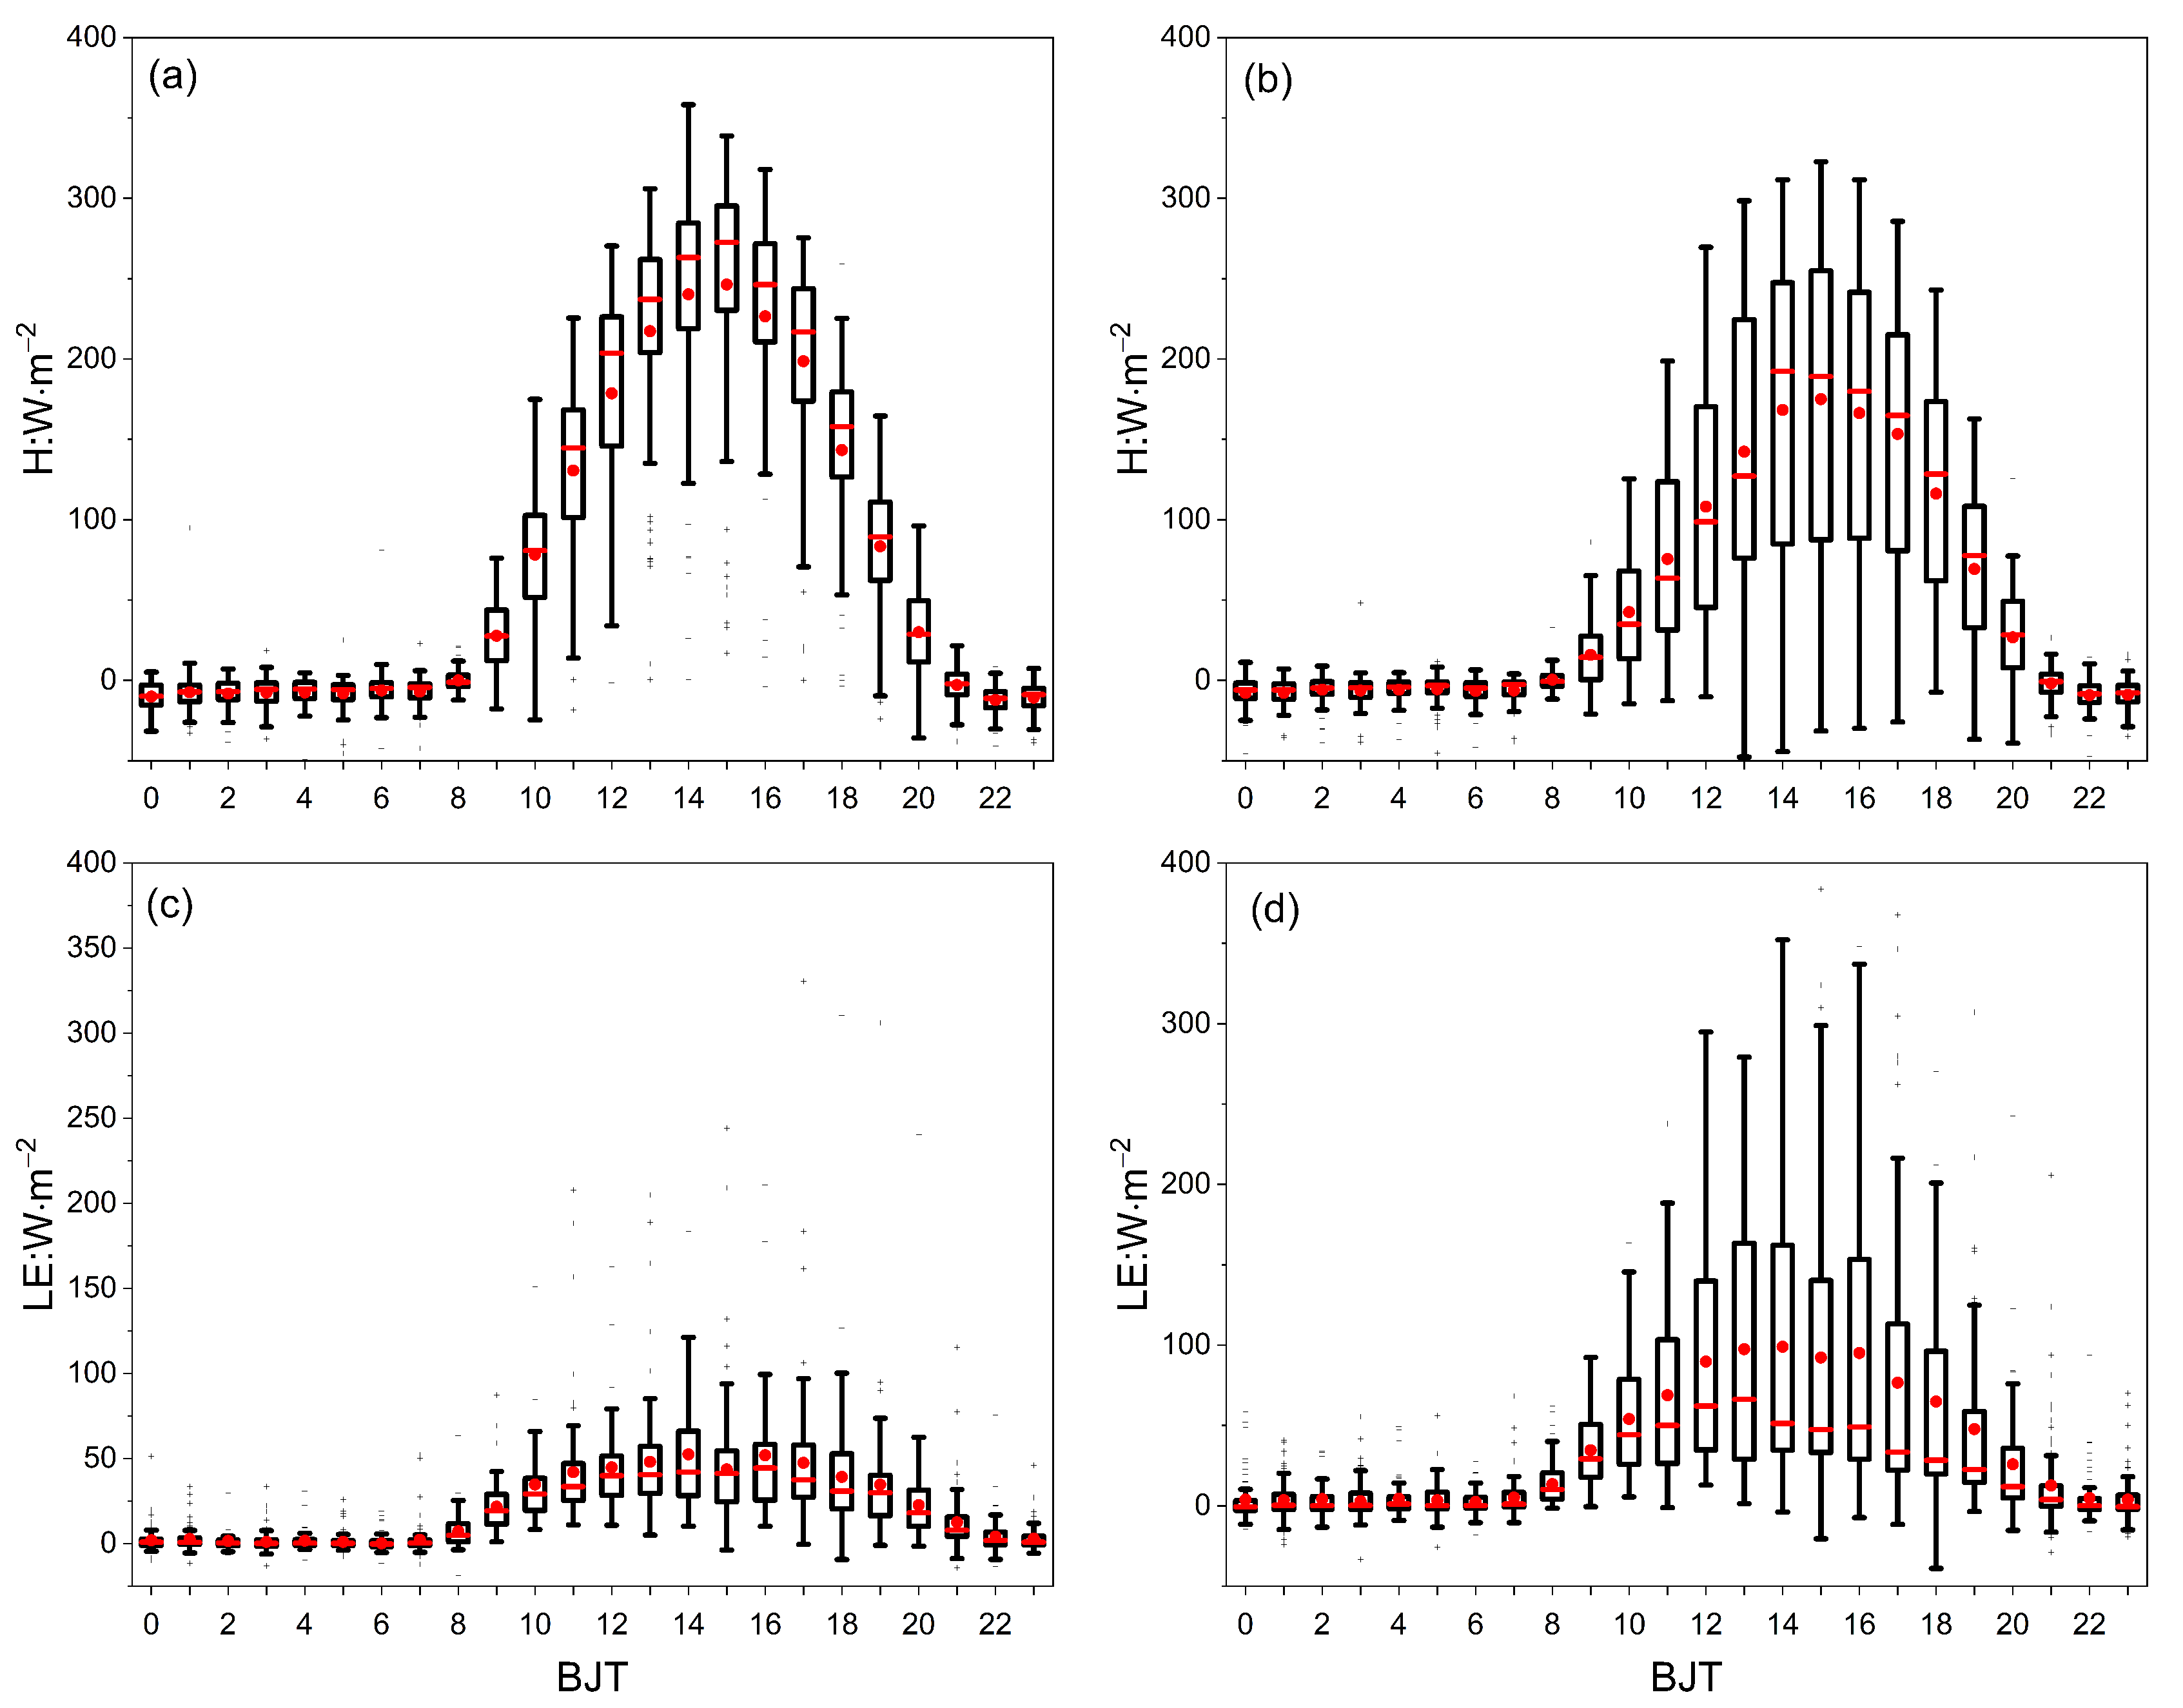
The vertical heat, as a measure of the surface buoyancy, reflects the strength of heat and water exchange between Earth and near surface air. Figure 8 shows the diurnal variation of sensible and latent heat flux in the PV plant and the reference site. The positive value from 9:00 to 20:00 during the daytime indicated upward sensible heat flux from the surface to the air due to solar radiation heating for the surface. The maximum sensible heat fluxes were observed at about 15:00 with values of 246.3 and 175 W/m2 at the PV plant and the reference site, respectively. Compared to the reference site, the lower heat capacity and increased surface area in the PV plant generated stronger convective conditions, resulting in higher sensible heat flux. The minimum heat fluxes were observed during 7:00~8:00, indicating near neutral conditions during the early morning. The negative value at night indicated downward sensible heat flux from the loft atmosphere to surface caused by surface radiative cooling. With regard to the latent heat flux, the peak values of 52.4 and 98.9 W/m2 at 14:00 were observed in the PV plant and the reference site, respectively. The wind resistance and shielding effect of PV panels in the PV plant brought about less evaporation compared with the reference site. The positive latent heat fluxes in the two sites were close to zero at night, which indicates that extremely weak evaporation still exists.

3.5. The Relationship between Turbulence Variance and Stability

The normalized standard deviations of the wind speed components, which describe the relationships between the near-surface variance and the fluxes, and represent the overall characteristics of turbulence, were applied to a variety of atmospheric diffusion modes. These relationships depend on the spatial and temporal in-homogeneities of the atmospheric motions and the atmospheric stability [46]. Additional, turbulent strength relationships may be affected by geographical location, dynamical, and the thermal characteristics of the atmosphere [47].
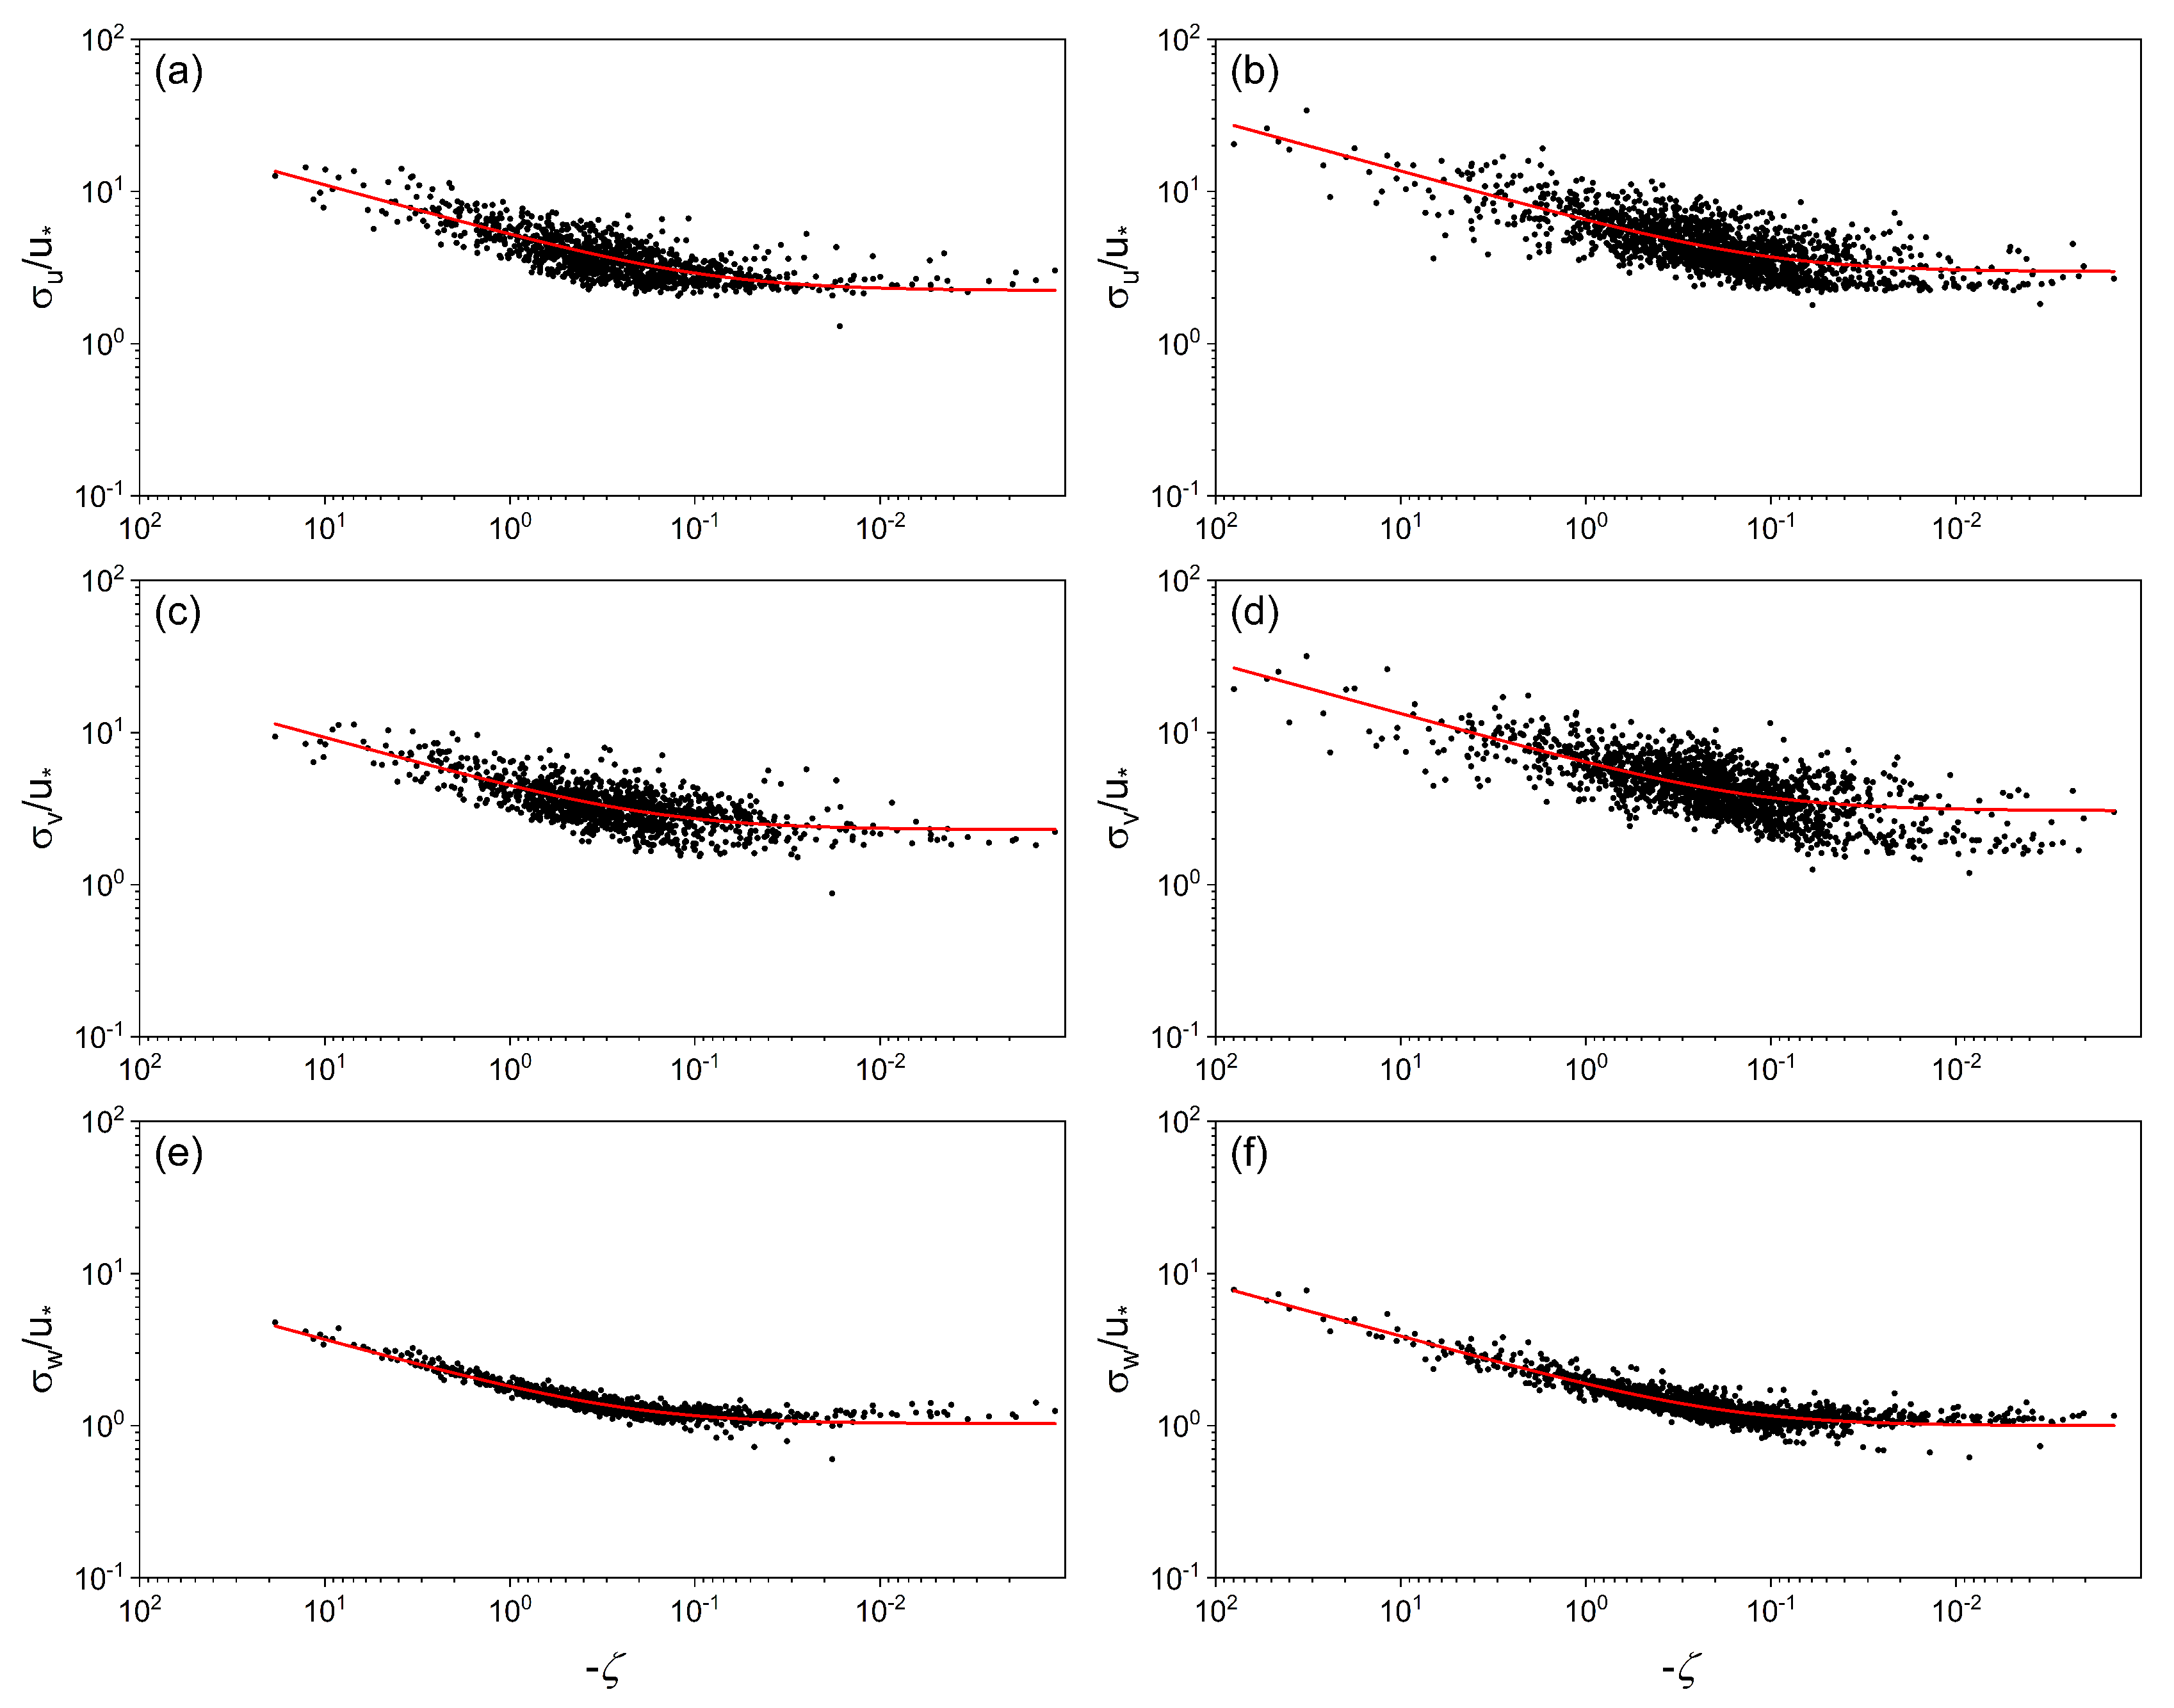
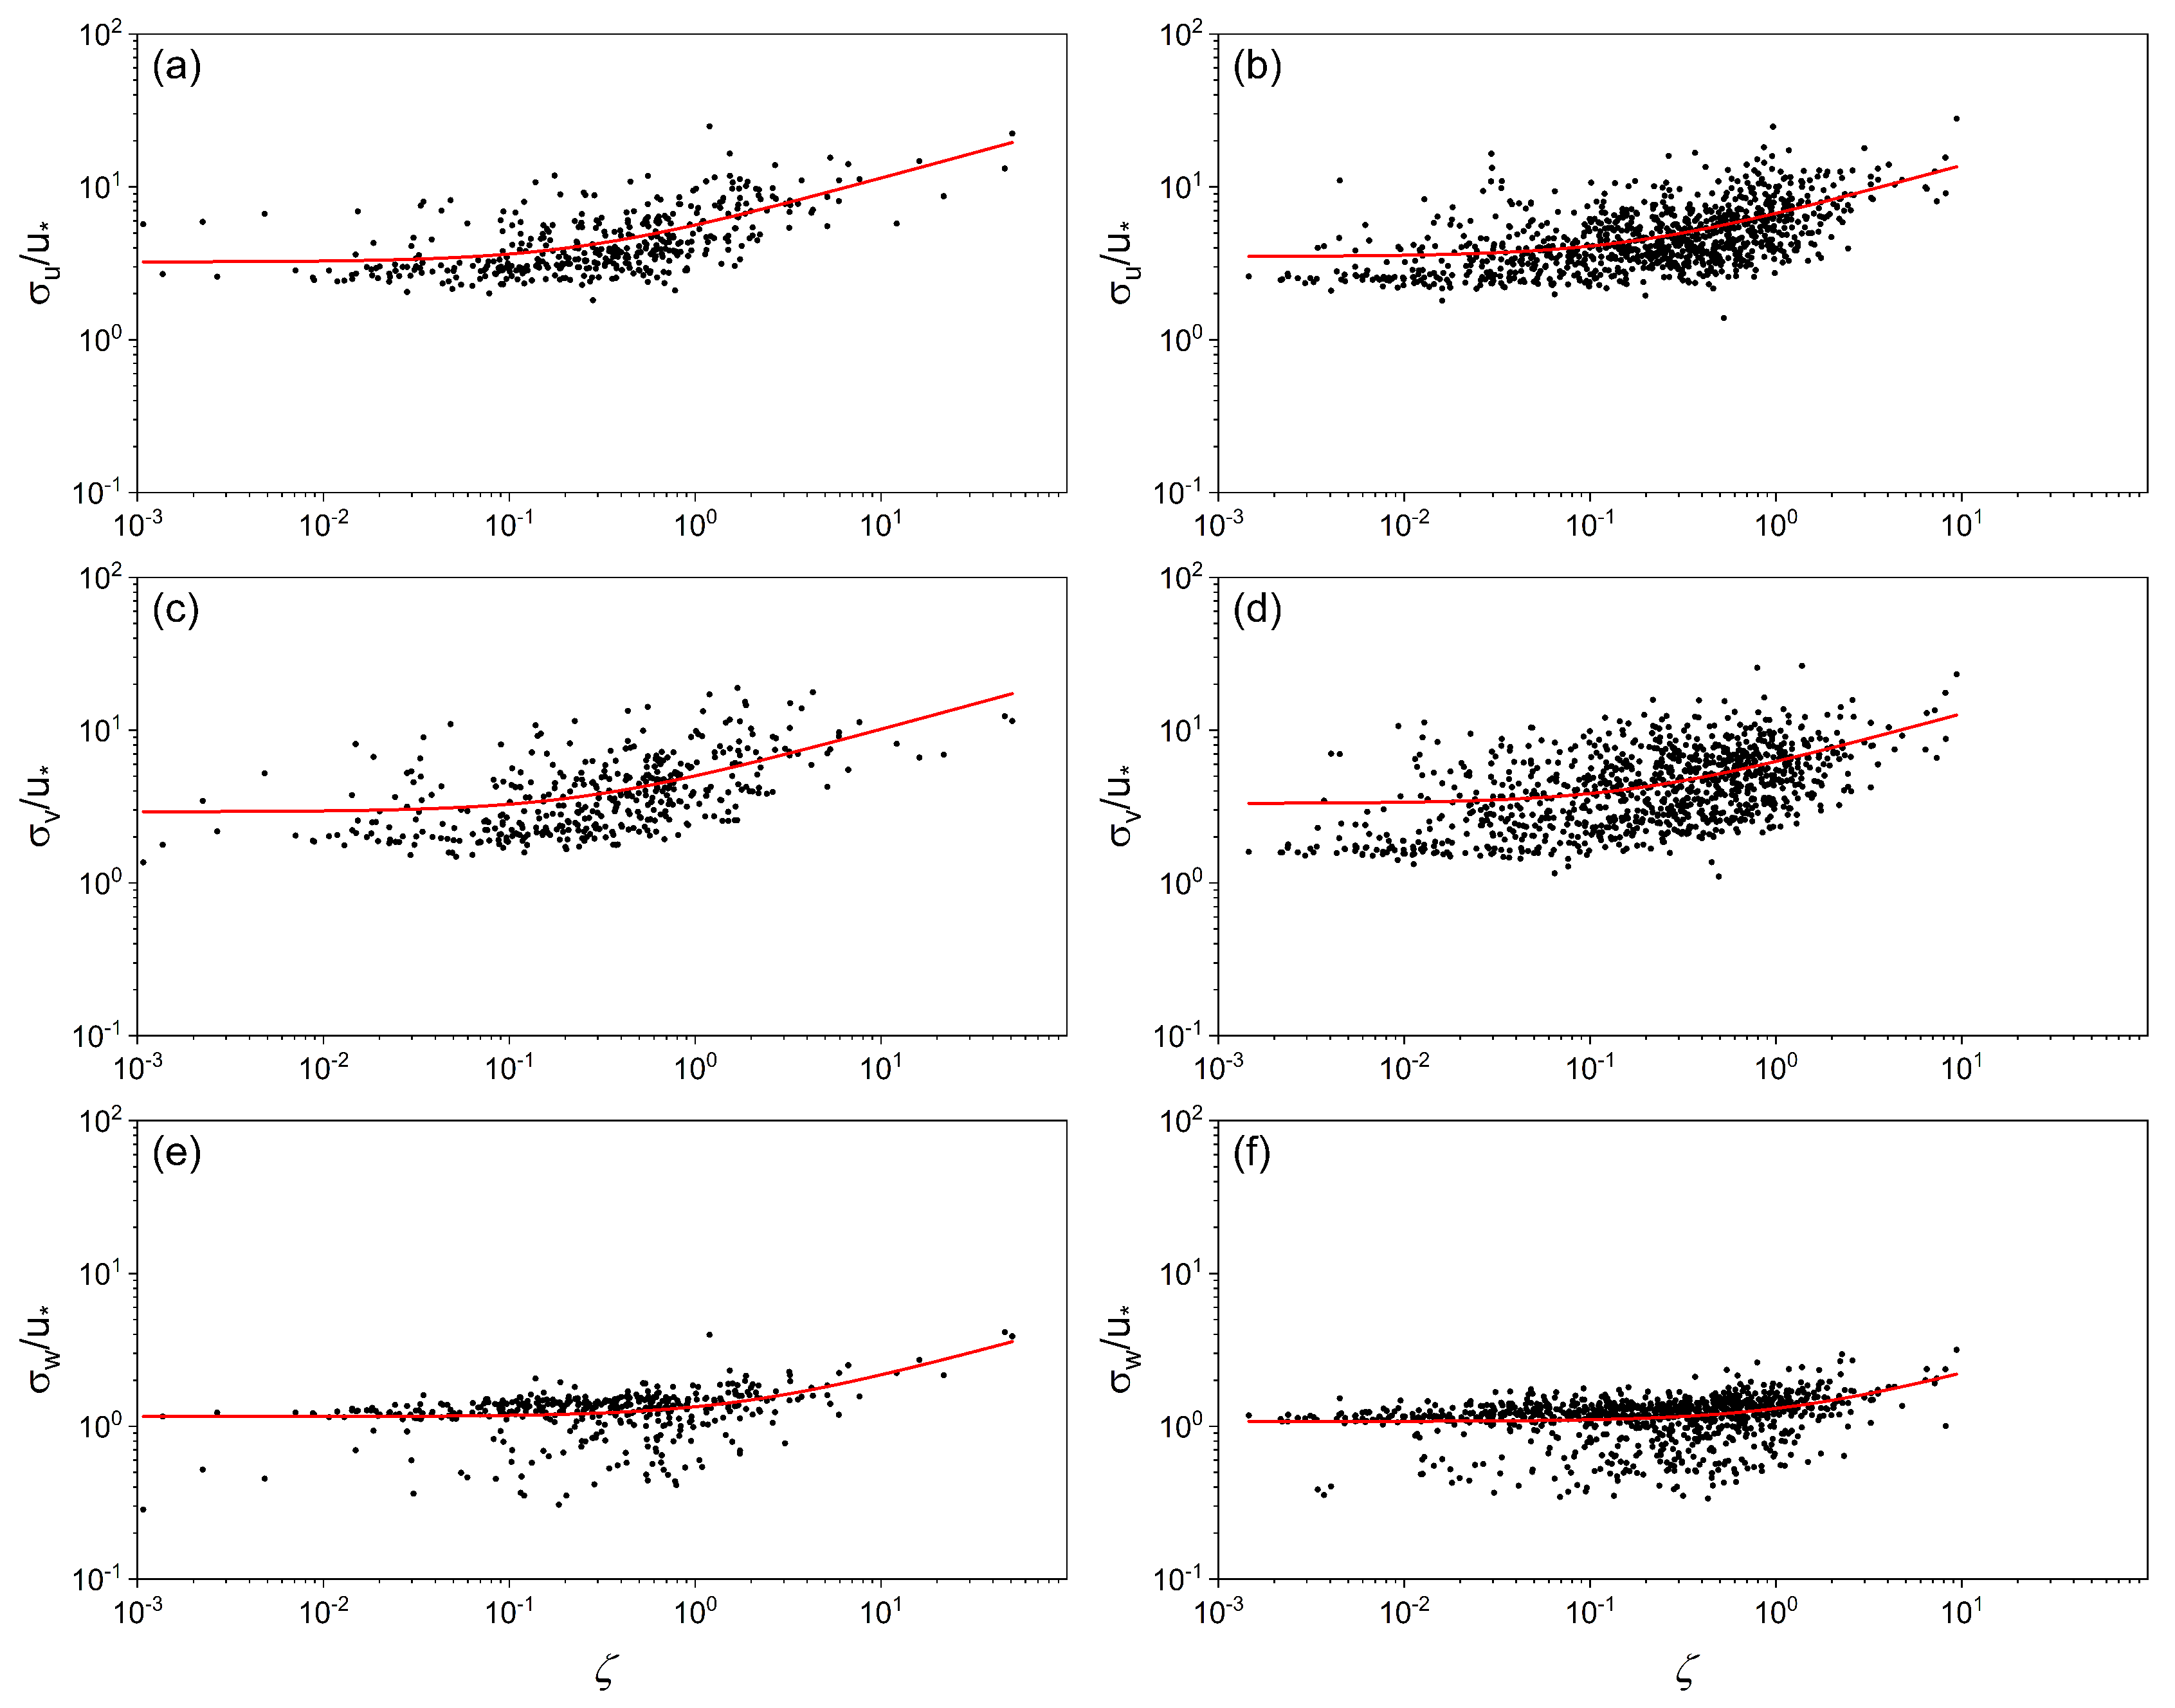
Here, we fitted the relationship between σ u / u * , σ v / u * , σ w / u * , and ζ , respectively, for the PV plant and the reference site according to Equation (11), and the best similarity coefficients are shown in Table 1. In the near neutral range ( 0.1 < ζ < 0.1 ) , turbulence is assumed to be isotropic and turbulent motion is decoupled from the surface, so the statistical characteristics of turbulence are independent of height and tend to be a constant. Under unstable conditions, the relationship between the horizontal and vertical wind speed normalized deviations and ζ can conform to the 1/3 law in the PV plant and the reference site (Figure 9). Compared with the horizontal velocity, the vertical velocity variance had better similarity, and the dispersion of scatters was small, the main reason being that the energy of vertical movement is buoyancy; and the wind velocity variance similarity of the three directions of the PV plant was better than that of the reference site, which may be caused by the difference in air flow between the PV plant and reference site. Under stable conditions, the wind speed variance of the PV plant and the reference site can also basically meet the similarity theory, but the dispersion of scatters was greater than that of the unstable condition (Figure 10). The similarity of the wind speed variance of the PV plant was better than that of the reference site, especially in the vertical direction.

4. Conclusions

To explore the impact of PV plants on the turbulence field, the observation of turbulence characteristics in a utility-scale PV plant and adjacent reference site over the Gobi area from 8 June to 31 October 2019 in Xinjiang, China were compared. As far as we know, this is the first time to explore the atmospheric turbulence characteristics of a utility-scale PV plant. Results indicate that in the study region, near surface air stratification is more unstable during the daytime while more stable at night in the PV plant than the reference site, ζ varies from −1.5 to 1.25 in the PV plant while it varied from −0.8 to 0.45 in the reference site in the averaged diurnal variation. In the PV plant, I u was lower, I v and I w were higher than the reference site during the daytime, I u and I v were lower, and I w was higher than the reference site at night. The averages of I u , I v , and I w in the PV plant (reference site) were 0.29 (0.32), 0.34 (0.34), and 0.12 (0.10), respectively. The turbulent kinetic energy in the PV plant during the daytime was lower than the reference site.
With regard to the turbulent fluxes, the momentum in the PV plant was higher than the reference site, especially during the daytime. Compared to the reference site, the lower heat capacity and increased surface area of the PV panels generated stronger convective conditions, resulting in higher sensible heat flux while the latent heat flux was reduced due to the wind resistance and shielding effect of PV panels in the PV plant.
Site specific turbulent strength relationships were developed for the PV plant and the reference site by analyzing wind components as a function of ζ . The turbulent components of wind followed the 1/3 power law under the unstable conditions and stable conditions in the two sites. Comparison of the derived relationships of the PV plant with the reference site indicates that the turbulent strength for vertical winds in the PV plant is relatively strong, especially under unstable conditions.

Author Contributions

Conceptualization, J.J. and X.G.; methodology, B.C.; software, J.J.; validation, J.J., X.G. and B.C.; formal analysis, J.J.; investigation, B.C.; resources, X.G.; data curation, B.C.; writing—original draft preparation, J.J.; writing—review and editing, J.J.; visualization, J.J.; supervision, J.J.; project administration, J.J.; funding acquisition, X.G. All authors have read and agreed to the published version of the manuscript.

Funding

This work was funded by the National Key Research and Development Program of China (2018YFB1502800) and the National Natural Science Foundation of China (41805085).

Data Availability Statement

The data presented in this study are available on request from the corresponding author. The data are not publicly available due to the restriction of the project (2018YFB1502800).

Conflicts of Interest

The authors declare no conflict of interest.

References

  1. Haegel, N.M.; Margolis, R.; Buonassisi, T.; Feldman, D.; Froitzheim, A.; Garabedian, R.; Green, M.; Glunz, S.; Henning, H.-M.; Holder, B.; et al. Terawatt-scale photovoltaics: Trajectories and challenges. Science 2017, 356, 141–143. [Google Scholar] [CrossRef] [PubMed]
  2. Breyer, C.; Bogdanov, D.; Gulagi, A.; Aghahosseini, A.; Barbosa, L.S.; Koskinen, O.; Barasa, M.; Caldera, U.; Afanasyeva, S.; Child, M.; et al. On the role of solar photovoltaics in global energy transition scenarios. Prog. Photovolt. Res. Appl. 2017, 25, 727–745. [Google Scholar] [CrossRef]
  3. Foken, T. Micrometeorology; Springer: New York, NY, USA, 2008; p. 308. [Google Scholar]
  4. Brunet, Y. Turbulent Flow in Plant Canopies: Historical Perspective and Overview. Bound. Layer Meteorol. 2020, 1772, 315–364. [Google Scholar] [CrossRef]
  5. Prasad, K.B.R.R.H.; Srinivas, C.V.; Singh, A.B.; Naidu, C.V.; Baskaran, R.; Venkatraman, B. Turbulence characteristics of surface boundary layer over the Kalpakkam tropical coastal station, India. Theor. Appl. Clim. 2018, 131, 827–843. [Google Scholar] [CrossRef]
  6. Dyer, A.J.; Garratt, J.R.; Francey, R.J.; McIlroy, I.C.; Bacon, N.E.; Hyson, P.; Bradley, E.F.; Denmead, O.T.; Tsvang, L.R.; Volkov, Y.A.; et al. An international turbulence comparison experiment (ITCE 1976). Bound. Layer Meteorol. 1982, 24, 181–209. [Google Scholar] [CrossRef]
  7. Shuhua, L.; Jie, L.; Heping, L.; Fuming, L.; Jianhua, W.; .Chan, J.C.L.; CHEN, A.Y.S.; Fei, H.; Huizhi, L. Characteristics of Turbulence Spectra and Local Isotropy in EBEX-2000. Chin. J. Atmos. Sci. 2005, 29, 213–224. [Google Scholar]
  8. Raupach, M.R.; Finnigan, J.J. The Influence of Topography on Meteorological Variables and Surface-Atmosphere Interactions. J. Hydrol. 1997, 190, 182–213. [Google Scholar] [CrossRef]
  9. Van Gorsel, E.; Christen, A.; Feigenwinter, C.; Parlow, E.; Vogt, R. Daytime Turbulence Statistics above a Steep Forested Slope. Bound. Layer Meteorol. 2003, 109, 311–329. [Google Scholar] [CrossRef] [Green Version]
  10. Moraes, O.; Acevedo, O.; DeGrazia, G.; Anfossi, D.; DaSilva, R.; Anabor, V. Surface layer turbulence parameters over a complex terrain. Atmos. Environ. 2005, 39, 3103–3112. [Google Scholar] [CrossRef]
  11. Solanki, R.; Singh, N.; Kumar, N.V.P.K.; Rajeev, K.; Dhaka, S.K. Time Variability of Surface-Layer Characteristics over a Mountain Ridge in the Central Himalayas During the Spring Season. Bound. Layer Meteorol. 2015, 158, 453–471. [Google Scholar] [CrossRef]
  12. Pleim, J.E. A Simple, Efficient Solution of Flux–Profile Relationships in the Atmospheric Surface Layer. J. Appl. Meteorol. Clim. 2006, 45, 341–347. [Google Scholar] [CrossRef]
  13. Businger, J.A.; Wyngaard, J.C.; Izumi, Y.; Bradley, E.F. Flux-profile relationships in the atmospheric surface layer. J. Atmos. 1971, 28, 181–189. [Google Scholar] [CrossRef]
  14. Haugen, D.A.; Kaimal, J.C.; Bradley, E.F. An experimental study of Reynolds stress and heat flux in the atmospheric surface layer. Q. J. R. Meteorol. Soc. 1971, 97, 168–180. [Google Scholar] [CrossRef]
  15. Shikhovtsev, A.; Kovadlo, P.; Lukin, V.; Nosov, V.; Kiselev, A.; Kolobov, D.Y.; Kopylov, E.A.; Shikhovtsev, M.; Avdeev, F. Statistics of the Optical Turbulence from the Micrometeorological Measurements at the Baykal Astrophysical Observatory Site. Atmosphere 2019, 10, 661. [Google Scholar] [CrossRef] [Green Version]
  16. Helgason, W.D.; Pomeroy, J.W. Characteristics of the Near-Surface Boundary Layer within a Mountain Valley during Winter. J. Appl. Meteorol. Clim. 2012, 51, 583–597. [Google Scholar] [CrossRef]
  17. Barman, N.; Borgohain, A.; Kundu, S.S.; Roy, R.; Saha, B.; Solanki, R.; Kumar, N.V.P.K.; Raju, P.L.N. Daytime Temporal Variation of Surface-Layer Parameters and Turbulence Kinetic Energy Budget in Topographically Complex Terrain Around Umiam, India. Bound. Layer Meteorol. 2019, 172, 149–166. [Google Scholar] [CrossRef]
  18. Monin, A.S.; Obukhov, A.M. Basic Turbulent Mixing Laws in the Atmospheric Surface Layer. Contrib. Geophys. Inst. Acad. Sci. Ussr 1954, 151, 163–187. [Google Scholar]
  19. Nosov, V.V.; Emaleev, O.N.; Nosov, E.V. Semiempirical hypotheses of the turbulence theory in anisotropic boundary layer. In Proceedings of the SPIE Proceedings; International Society for Optics and Photonics: Bellingham, WA, USA, 2004; Volume 5743, pp. 110–131. [Google Scholar]
  20. Panofsky, H.A.; Tennekes, H.; Lenschow, D.H.; Wyngaard, J.C. The characteristics of turbulent velocity components in the surface layer under convective conditions. Bound. Layer Meteorol. 1977, 11, 355–361. [Google Scholar] [CrossRef]
  21. Lange, B.; Larsen, S.; Hojstrup, J.; Barthelmie, R. The influence of thermal effects on the wind speed profile of the coastalmarine boundary layer. Bound. Layer Meteorol. 2004, 112, 587–617. [Google Scholar] [CrossRef]
  22. Huizhi, L.; Zhongxiang, H. Turbulent Characteristics in the Surface Layer over Gerze Area in the Tibetan Plateau. Chin. J. Atmos. Sci. 2000, 24, 289–300. [Google Scholar]
  23. Yaoming, M.; Weiqiang, M.; Zeyong, H.; Maoshan, L.; Jiemin, W. Similarity Analysis of Atmospheric Turbulent Strength over Grassland Surface of Qinghai-Xizang Plateau. Plateau Meteorol. 2002, 21, 514–517. [Google Scholar]
  24. Huizhi, L.; Zhongxiang, H. Turbulent Statistical Characteristics over the Urban Surface. Chin. J. Atmos. Sci. 2002, 26, 241–248. [Google Scholar]
  25. Hedde, T.; Durand, P. Turbulence intensities and bulk coefficients in the surface layer above the sea. Bound. Layer Meteorol. 1994, 71, 415–432. [Google Scholar] [CrossRef]
  26. Huiwang, G.; Ming, G.; Renlei, W.; Yuhuan, X. Analysis of the Characteristics of the Atmospheric Turbulene Strength and the Similarity of the Standard Deviations of Wind Velocity over the North Yellow Sea. Period. Ocean Univ. China 2009, 39, 563–568+578. [Google Scholar]
  27. Yaoming, M.; Jieming, W.; Wei, L.; Qingrong, Z.; Boqiang, M. The Study of the Characteristics of Both the Atmospheric Turbulence Structure and the Transfer in the Lower Layer of the Atmosphere above the Nansha Islands Area. Chin. J. Atmos. Sci. 1997, 21, 102–110. [Google Scholar]
  28. Nosov, V.; Lukin, V.; Torgaev, A. Turbulence Scales of the Monin–Obukhov Similarity Theory in the Anisotropic Mountain Boundary Layer. Russ. Phys. J. 2020, 63, 244–249. [Google Scholar] [CrossRef]
  29. Nemet, G.F. Net Radiative Forcing from Widespread Deployment of Photovoltaics. Environ. Sci. Technol. 2009, 43, 2173–2178. [Google Scholar] [CrossRef]
  30. Burg, B.R.; Ruch, P.; Paredes, S.; Michel, B. Placement and efficiency effects on radiative forcing of solar installations. In Proceedings of the 11th International Conference on Concentrator Photovoltaic Systems: Cpv-11; AIP Publishing: Melville, NY, USA, 2015; Volume 1679, p. 090001. [Google Scholar]
  31. Hernandez, R.R.; Easter, S.; Murphymariscal, M.L.; Maestre, F.T.; Tavassoli, M.; Allen, E.B.; Barrows, C.W.; Belnap, J.; Ochoahueso, R.; Ravi, S.; et al. Environmental impacts of utility-scale solar energy. Renew. Sustain. Energy Rev. 2014, 29, 766–779. [Google Scholar] [CrossRef] [Green Version]
  32. Chang, R.; Shen, Y.; Luo, Y.; Wang, B.; Yang, Z.; Guo, P. Observed surface radiation and temperature impacts from the large-scale deployment of photovoltaics in the barren area of Gonghe, China. Renew. Energy 2018, 118, 131–137. [Google Scholar] [CrossRef]
  33. Yang, L.; Gao, X.; Lv, F.; Hui, X.; Ma, L.; Hou, X. Study on the local climatic effects of large photovoltaic solar farms in desert areas. Sol. Energy 2017, 144, 244–253. [Google Scholar] [CrossRef]
  34. Armstrong, A.; Ostle, N.J.; Whitaker, J. Solar park microclimate and vegetation management effects on grassland carbon cycling. Environ. Res. Lett. 2016, 11, 074016. [Google Scholar] [CrossRef] [Green Version]
  35. Broadbent, A.M.; Krayenhoff, E.S.; Georgescu, M.; Sailor, D.J. The Observed Effects of Utility-Scale Photovoltaics on Near-Surface Air Temperature and Energy Balance. J. Appl. Meteorol. Clim. 2019, 58, 989–1006. [Google Scholar] [CrossRef]
  36. Wilson, K.; Goldstein, A.; Falge, E.; Aubinet, M.; Baldocchi, D.D.; Berbigier, P.; Bernhofer, C.; Ceulemans, R.; Dolman, A.; Field, C.; et al. Energy balance closure at FLUXNET sites. Agric. For. Meteorol. 2002, 113, 223–243. [Google Scholar] [CrossRef] [Green Version]
  37. Massman, W.J. A simple method for estimating frequency response corrections for eddy covariance systems. Agric. For. Meteorol. 2000, 104, 185–198. [Google Scholar] [CrossRef]
  38. Schotanus, P.; Nieuwstadt, F.; De Bruin, H. Temperature measurement with a sonic anemometer and its application to heat and moisture fluxes. Bound. Layer Meteorol. 1983, 26, 81–93. [Google Scholar] [CrossRef]
  39. Webb, E.K.; Pearman, G.I.; Leuning, R. Correction of flux measurements for density effects due to heat and water-vapor transfer. Q. J. R. Meteorol. Soc. 1980, 106, 85–100. [Google Scholar] [CrossRef]
  40. RB, S. Introduction to Boundary Layer Meteorology; Springer: Dordrecht, The Netherlands, 1988. [Google Scholar]
  41. Rosenberg, N.J.; Blad, B.B.; Verma, S.B. Microclimate: The Biological Environment, 2nd ed.; John Wiley & Son: New York, NY, USA, 1983; p. 135. [Google Scholar]
  42. Qiang, Z.; Zeng, J.; Yao, T. Interaction of aerodynamic roughness length and windflow conditions and its parameterization over vegetation surface. Chin. Sci. Bull. 2012, 57, 1559–1567. [Google Scholar] [CrossRef] [Green Version]
  43. Prueger, J.H.; Kustas, W.P.; Hipps, L.; Hatfield, J.L. Aerodynamic parameters and sensible heat flux estimates for a semi-arid ecosystem. J. Arid. Environ. 2004, 57, 87–100. [Google Scholar] [CrossRef]
  44. Ao, Y.H.; Lv, S.H.; Han, B.; Li, Z.G. Analysis on Micrometeorology Characteristics in Surface Layer over Badan Jaran Desert in summer. Plateau Meteorol. 2013, 32, 1682–1691. [Google Scholar]
  45. Xinqian, Z.; Fan, Y.; Chaofan, L.; Honglin, P.; Chunrong, J.; Mamtimin, A.; Wen, H.; Xinghua, Y.; Chenglong, Z. The Turbulence Strength of Surface Layer and Land Surface Processes over Guaizi Lake Shifting Sandy Land on the Northern Margin of Badain Jaran Desert. J. Desert Res. 2019, 39, 103–112. [Google Scholar]
  46. McBean, G.A. The variations of the statistics of wind, temperature and humidity fluctuations with stability. Bound. Layer Meteorol. 1971, 1, 438–457. [Google Scholar] [CrossRef]
  47. Singha, A.; Sadr, R. Characteristics of surface layer turbulence in coastal area of Qatar. Environ. Fluid Mech. 2012, 12, 515–531. [Google Scholar] [CrossRef]
Figure 1. Photos of the monitoring sites in the PV plant (a) and the reference site (east to the PV plant) (b) in the Wujiaqu Gobi area. The map (c) shows the layout of the PV plant and the locations of two observation systems (from Google Earth by the end of 2018).
Atmosphere 12 00018 g001
Figure 2. Diurnal variation of the atmospheric stability parameter ζ in the PV plant (a) and the reference site (b). The height of the box shows the range from the 25th to 75th percentile. The horizontal red line inside the box and solid red dot denote the median value and mean value, respectively. The ends of the whiskers are drawn to the 10th and 90th percentile values. (c) is the diurnal variation of aerodynamic roughness Z 0 in the PV plant (red line) and the reference site (black line). BJT is for Beijing time.
Atmosphere 12 00018 g002aAtmosphere 12 00018 g002b
Figure 3. Diurnal variation of the scaling parameter of velocity u * (a) and temperature T * (b) in the PV plant (red line) and the reference site (black line), BJT is to Beijing time.
Atmosphere 12 00018 g003
Figure 4. The average daily variation of turbulence strength component of longitudinal wind I u (a), lateral wind I v (b), and vertical wind I w (c) in the PV plant (red line) and the reference site (black line), BJT is to Beijing time.
Atmosphere 12 00018 g004
Figure 5. Relationship between the turbulence strength and wind speed at the PV plant (left: (a,c,e) and the reference site (right: (b,d,f), U is the horizonal wind speed.
Atmosphere 12 00018 g005
Figure 6. Diurnal variation of turbulent kinetic energy e in the PV plant (a) and the reference site (b). The height of the box shows the range from the 25th to 75th percentile. The horizontal red line inside the box and solid red dot denote the median value and mean value, respectively. The ends of the whiskers are drawn to the 10th and 90th percentile values. The relationship between turbulent kinetic energy and wind speed for the PV plant (c) and the reference site (d), U is the horizonal wind speed.
Atmosphere 12 00018 g006
Figure 7. Diurnal variation of momentum flux in the PV plant (a) and the reference site (b). The height of the box shows the range from the 25th to 75th percentile. The horizontal red line inside the box and the solid red dot denote the median value and mean value, respectively. The ends of the whiskers were drawn to the 10th and 90th percentile values.
Atmosphere 12 00018 g007
Figure 8. Diurnal variation of sensible heat flux (H: W · m 2 ) in the PV plant (a) and the reference site (b) and the latent heat flux (LE: W · m 2 ) in the PV plant (c) and the reference site (d). The height of the box shows the range from the 25th to 75th percentile. The horizontal red line inside the box and solid red dot denote the median value and mean value, respectively. The ends of the whiskers were drawn to the 10th and 90th percentile values.
Atmosphere 12 00018 g008
Figure 9. Normalized standard deviation of longitudinal wind velocity ( σ u / u * ), lateral wind velocity ( σ v / u * ), and vertical wind velocity σ w / u * for unstable stratification conditions at the PV plant (left: (a,c,e) and the reference site (right: (b,d,f) from June to October 2019. The red solid line represents the empirical relations applied to the observed data.
Atmosphere 12 00018 g009
Figure 10. Normalized standard deviation of longitudinal wind velocity ( σ u / u * ), lateral wind velocity ( σ v / u * ), and vertical wind velocity σ w / u * for stable stratification conditions at the PV plant (left: (a,c,e) and the reference site (right: (b,d,f) from June to October 2019. The red solid line represents the empirical relations applied to the observed data.
Atmosphere 12 00018 g010
Table 1. Optimal similarity function coefficients for fitting normalized standard deviation of longitudinal wind velocity ( σ u / u * ), lateral wind velocity ( σ v / u * ), vertical wind velocity σ w / u * under unstable and stable stratification conditions for the observed data from June to October 2019.
σ i / u * UnstableStable
PVREFPVREF
abR2abR2abR2abR2
σ u / u * 2.2411.970.673.018.670.593.163.730.413.506.050.30
σ v / u * 2.306.500.583.117.40.532.13.520.303.315.70.20
σ w / u * 1.034.510.921.015.420.891.120.670.301.080.780.15
Publisher’s Note: MDPI stays neutral with regard to jurisdictional claims in published maps and institutional affiliations.