Article

Changes Detected in Five Bioclimatic Indices in Large Romanian Cities over the Period 1961–2016

by
Ștefana Banc
1,
Adina-Eliza Croitoru
2,*,
Nicoleta Afrodita David
3 and
Andreea-Sabina Scripcă
1
1
Doctoral School of Geography, Faculty of Geography, Babeș-Bolyai University, 400006 Cluj-Napoca, Romania
2
Department of Physical and Technical Geography, Faculty of Geography, Babeș-Bolyai University, 400006 Cluj-Napoca, Romania
3
Department of Regional Geography and Territorial Planning, Faculty of Geography, Babeș-Bolyai University, 400006 Cluj-Napoca, Romania
*
Author to whom correspondence should be addressed.
Atmosphere 2020, 11(8), 819; https://doi.org/10.3390/atmos11080819
Submission received: 15 June 2020 / Revised: 22 July 2020 / Accepted: 30 July 2020 / Published: 3 August 2020
(This article belongs to the Special Issue Challenges in Applied Human Biometeorology)

Abstract

:
Bioclimatic indices are very important tools to evaluate the thermal stress of the human body. The aims of this study were to analyze the general bioclimatic conditions in ten big cities in Romania and to find out if there has been any change in five bioclimatic indices over a 56-year period: 1961–2016. The indices considered were: equivalent temperature, effective temperature, cooling power, universal thermal climate index and temperature-humidity index. They were calculated based on the daily meteorological data of air temperature, relative humidity, and wind speed recorded in 10 weather stations in Romania: Bucharest-Băneasa, Botoșani, Cluj-Napoca, Constanța, Craiova, Galați, Iași, Oradea, Sibiu and Timișoara. The features investigated for trend detection consisted of the frequency and length of the occurrence period for each class and for each index. The test used for trend detection was Mann-Kendall and the magnitude of the trend (the slope) was calculated by employing Sen’s slope method. The main results are based on frequency analysis. Three indices showed comfort class as dominant whereas the other two indicated cold stress conditions as dominant in the area. There was a shift from the cold stress conditions to the warm and hot ones for all the indices. The most stressful conditions for hot extremes did not indicate significant change. The climate in the big cities of Romania became milder during the cold season and hotter during the warm period of the year. The analysis of the length of each thermal class indicated mainly longer occurrence periods during the year for comfortable or warm stress classes.

1. Introduction

Much interest is shown nowadays, in the era of climate change, to information about the local impact of climate changes in every domain of our lives, from politics to public health and even science [1]. It is already widely known that one of the main consequences of global air temperature rises is the increasing frequency of intense, extreme events [2,3,4]. They lead, mostly during extreme seasons, to severe impact on different social and economic sectors, causing serious health problems to the population and disturbing agriculture, transportation, building industry and tourism activities. It is considered that the most affected climatic variables will be temperature, precipitation, humidity and wind, mostly because of their increase in extreme values, in terms of frequency, intensity and persistence [5]. Furthermore, international specialists in territorial planning state that climate change also affects, in a negative way, life quality in urban areas, especially through heat waves that occur in urban climate islands (ICU), to an increase in the energy and water consumption, as well as to an increase in polluting substances. Additionally, there is a higher risk of infrastructure damage and winter tourism. For all these, the mitigation and adaptation strategies propose both general and specific measures such as the continuous information and education of the population, preservation of the natural resources, encouraging infrastructure and geo-system resilience processes, as well as expanding green spaces and parks, building green infrastructure, innovation and diversification of winter tourism through finding new solutions independent of snow [6]. However, some of the effects of ICU under high temperature conditions (e.g., heat waves intensification) on human body are represented by the extreme thermal stress for the cardiovascular system and increase in the mortality rate, especially for children and elderly people [7,8]. Therefore, some of the proposed solutions by the same institution are developing pilot projects for acclimatization, infrastructure and green spaces, as well as the development of local, regional and national climatic change adaptation strategies.
In this context, common people show a high interest for knowledge, forecasts and predictions about weather conditions [5,9].
It has been believed since ancient times that weather plays an important role on the human body, but the latest scientific research has proved it. The sensitivity of the organs and the psycho-physiological reactions are increased by external atmospheric conditions. The adaptation ability to sudden changes in weather conditions differ from individual to individual and widely depends on genetic predisposition and specific characteristics [10]. Over the last 20 years, a multitude of studies have been conducted in order to explain the relationships between humans and their environment, trying to investigate how thermal comfort or thermal stress in outdoor environment influences human behavior during daily activities. Two comprehensive reviews have been developed [11,12], whereas some other research papers focused on specific issues. The great majority of these studies have focused on thermal sensations in urban areas [1,13,14,15,16,17,18,19,20,21,22,23,24,25,26].
One of the most realistic and objective ways to assess thermal perception and stress for humans is based on using appropriate indices [1]. Even though inside the meteorological and biometeorological community there are different opinions about the indices that should be used or not, in general it is considered that the more indices used, the better and more reliable the image of the changes is created [5,27]. Indices, serving as tools for heat stress and thermal comfort analysis, have a major role in describing the combined effect of meteorological variables on humans in terms of thermal stress or comfort [28].
In Romania, the number of biometeorology studies is quite small, most of them being focused on bioclimatology and more likely presenting theoretical aspects [29,30,31,32,33,34,35]. In 2008, impressive work was done by Nicoleta Ionac and Sterie Ciulache that represented the Romanian Bioclimatic Atlas [36]. The number of studies that integrated biometeorological indices is quite low. One of them focused on the analysis of some biometeorological indices in the southern Dobrogea, which is one of the most hot and dry regions of the country [37]. Most recently, a bioclimatic analysis in the context of urban environment and tourism was developed, based on the temperature–humidity index, described by fractal Higuchi Dimension, and covering a period of 17 years (2001–2017) in a mid-sized city (Focșani). The study emphasized the increasing air temperature defined by this index [38].
The main objectives of this study are: (i). to assess the general bioclimatic conditions, based on five bioclimatic indices in 10 of the largest cities of Romania, and (ii). to find out if there has been any change in the bioclimatic indices over a 56 year period (1961–2016) in terms of duration of their occurrence period (DOP) and frequency of occurrence considering the number of days for each class (FO). With this study, we intend to present regional differences in changes in bioclimatic conditions in Romania.

2. Data and Methods

2.1. Study Area

Romania is located in South-Eastern Europe, on the north-western shore of the Black Sea (extending on about 9° on longitude and approximately on 5° on latitude) and it covers more than 237,000 km2 (Figure 1). With a general temperate continental climate, there is a large diversity of climate sub-types induced by several important influences: extreme continental in the eastern and southern regions, more humid conditions generated by the moist oceanic air masses originated over the North Atlantic in central and western regions and altitude influenced climate in the mountain region. In general, they lead to specific bioclimatic conditions: milder and more humid in the western regions and hotter in summer and colder in winter and dryer over the entire year in eastern and southern regions. The mean multiannual temperature varies from more than 11.0 °C in the southern regions and on the coastline to sub-zero values in the mountains. Extreme temperatures can reach more than 40 °C in the summertime, and below −20 °C in the wintertime. The largest daily and annual temperature ranges are specific to eastern and southern Romania. In terms of precipitation, the multiannual amount is above 500 mm in western and central regions, but between 300 to 700 mm in Eastern and Southern Romania [39]. In the mountains, the value rises above 1000 mm. Generally, the important difference in climatic conditions between western and central regions on the one hand and the eastern, southern, and southeastern ones on the other hand, are imposed by the presence of the Carpathians, which are considered to be a natural barrier for western moist air masses toward Eastern Europe [8]. In Romania, most studies conducted on climate change focused on air temperature and precipitation and they revealed significant increase in air temperature (mean and extreme temperature indices) and no significant change for precipitation [8,39,40,41,42,43]. Sunshine hours significantly increased, especially in spring and summer, whereas wind speed significantly decreased in most of the locations considered [41]. No study on changes in the relative humidity or cloudiness has been conducted in Romania so far.

2.2. Data Used

The historical data derived from direct observations at 10 weather stations were used to calculate a set of five bioclimatic indices over a 56-year period (1961–2016). The meteorological parameters employed for indices calculation were daily average data for: air temperature (T) (°C), relative humidity (RH) (%), wind speed at 10 m (v10) (m/s), and cloudiness (N) (%). In this research, we also used the daily maximum air temperature (TX) and the daily minimum relative humidity (RHmin).
The weather stations used in the study provide a good spatial coverage for the whole country and include all the climatic regions of Romania. Their location is presented in Figure 1 and their geographical coordinates and elevation are listed in Table 1. Since all the weather stations considered are inside the built area of the cities (except for Craiova weather stations, which is located 200 m away from the built area limit), we consider that they catch weather conditions quite well in the cities low-rise building areas.
The climatic data for this study were derived from four main sources. Most of them were provided by the National Meteorological Administration (NMA). The missing values for two of the weather stations were supplemented with data from the existing online databases. The missing data from the Bucharest-Băneasa weather station for N for 2001 were completed with data available on www.meteomanz.com. For the Cluj-Napoca weather station, the T values were freely downloaded from the European Climate Assessment and Dataset project (ECA&D) database (non-blend data) [40], and from www.meteomanz.com [44]. For 2016, the values of the parameters of v10, RH and N were downloaded from the databases www.meteomanz.com and www.rp5.ru [45]. Moreover, for all the weather stations and the entire period, the TX values were extracted from ECA&D and www.meteomanz.com databasis [46,47]. While four databases were used, the data homogeneity was assured by the common source of the data: raw SYNOP messages issued by the weather stations considered. Random checking was performed for the common periods where possible.

2.3. Methods

2.3.1. Biometeorological Indices

In the present study, we analyzed the following bioclimatic indices: the equivalent temperature (TeK), the Effective Temperature (TE), the Cooling Power (H), the Universal Thermal Climate Index (UTCI), and the Temperature-Humidity Index (THI). They are largely used for the bioclimatic conditions assessment in different regions [18,20,23,47,48,49]. For some cities in Romania, these indicators were calculated and presented in other short studies [50,51].
To calculate all the indices mentioned above, as well as their parameters, the freely available software BioKlima 2.6 (https://www.igipz.pan.pl/bioklima.html) [52] was used.
For wind speed conversion from 10 m altitude (v10 m) to 1.2 m (v), we employed the formula for wind speed extrapolation (1), available on: https://websites.pmc.ucsc.edu/~jnoble/wind/extrap/ [53].
v = v r e f · l n ( z z 0 ) l n ( z r e f z 0 ) .
where:
v is the velocity to be calculated at height z;
z is the height above the ground level for velocity v;
vref is the known velocity at height zref;
—zref is the reference height where vref is known;
—z0 represents the roughness length in the current wind direction.
Below we presented briefly the main information related to the indicators we calculated (focusing on the calculation formula and bioclimatic comfort classes).

TeK Calculation

TeK evaluates the influence of air temperature and water vapor pressure (e) on the human body. This index was introduced by Dufton [54,55] and Bedford described its use [56,57]. For its calculation, Equation (2) was used:
T e K = T + 1.5 × e .
Vapor pressure (e) (hPa) was alos derived from air temperature and relative humidity by using the BioKlima software [52] as Equation (3):
e = 6.112 × 10 [ 7.5 × T ÷ ( 237.7 + T ) ] × 0.01 × R H ,
where T is the air temperature and RH is the relative humidity.

TE Calculation

TE evaluates the common influence of air temperature, wind speed, and the relative humidity of air. The index establishes a relationship between the identical state of the human body thermoregulatory capacity (warm and cold stress sensation perception) and the differing temperature and humidity of the surrounding environment [48]. It was calculated by using two different Equations (4) and (5), depending on the wind speed values [49].
—for v ≤ 0.2 m/s:
T E = T 0.4 × ( T 10 ) × ( 1 0.01 × R H ) .
—at v > 0.2 m/s:
T E = 37 ( 37 T ) ÷ { 0.68 0.0014 × R H + [ 1 ÷ ( 1.76 + 1.4 v 0.75 ) ] } 0.29 × T × ( 1 0.01 × R H ) ,
where T is the air temperature, v is the wind speed, and RH is the relative humidity.

H Calculation

The H (W/m2) index was calculated according to Hill’s empirical Equations (6) and (7), depending on the wind speed [49,58,59,60]:
—at v ≤ 1 m/s:
H = ( 36.5 T ) × ( 0.2 + 0.4 × S Q R T ( v ) ) × 41.868 .
—at v > 1 m/s:
H = ( 36.5 T ) × ( 0.13 + 0.47 × S Q R T ( v ) ) × 41.868 ,
where T is the air temperature and v is the wind speed.
For this index, thermal sensations are assessed according to the modified scale developed by Petrovič and Kacvinsky [49,58,59].

UTCI Calculation

UTCI is the most comprehensive index for calculating heat stress in outdoor environment [61,62]. Its values are calculated as a polynomial regression function up to the sixth order and the input data include meteorological (temperature, mean radiation temperature, the pressure of water vapor or relative humidity, and wind speed (at the elevation of 10 m), and non-meteorological (a metabolic rate of 135 W m−2 and a walking speed of 1.1 m s−1, clothing thermal resistance) data [57,60,63].
The mean radiant temperature was calculated using Equation (8) [63]:
M r t = [ ( R + 0.5 × L g + 0.5 × L a ) ÷ ( 0.95 × 5.667 × 10 8 ) ] ,
where R′ is the solar radiation absorbed by the outer layer of clothing in a standing man. This was calculated using the statistical SolAlt model [63,64,65,66,67]. They were identified based on Equations (9) and (10) [63].
L g = 5.5 × 10 8 × ( 273 + T g ) ,
L a = 5.5 × 10 8   × ( 273 + T ) 4 × [ 0.82 0.25 × 10 ( 0.094 × 0.75 × e ) ] ,
where T is air temperature, e is the vapour pressure, Tg is the temperature of the ground surface, as in Equations (11)–(13) [63]:
for N ≥ 80%
T g = T .
for N < 80% and t ≥ 0 °C
T g = 1.25 × T .
for N < 80% and t < 0 °C
T g = 0.9 × T ,
where T is the air temperature, and N is the cloudiness.

THI Calculation

THI is an index developed for warm and hot periods of the year and it is the only index used by the NMA in Romania in the national weather forecast and for releasing early warning messages during summertime for heat stress [35].
In this study, it was calculated based on Equation (14), considering daily maximum temperatures and the daily minimum relative humidity.
T H I = ( T X × 1.8 + 32 ) ( 0.55 0.0055 × R H m i n ) × [ ( T X × 1.8 + 32 ) 58 ] ,
where TX is the daily maximum temperature and RHmin is the daily minimum relative humidity.

Thermal Comfort and Discomfort Classes

Each of the thermal indices has been described as having a specified number of classes, usually ranging from extreme cold to extreme heat discomfort. In most situations, the classes do not coincide among the indices and this situation makes comparison among indices very difficult. The thermal comfort classes of the indicators used for this study are summarized in Table 2.

2.3.2. Calculating Indices Parameters

Investigating features such as FO and DOP is of great importance to highlight the possible period of a certain thermal comfort/stress class during the year and to identify any change all over the analyzed period. Therefore, for all the indices, first we identified the feature (thermal comfort/discomfort class) of each day and year in the 56-year period. After that, the FO was calculated for each year. FO is the number of days included in each class (a certain comfort/discomfort condition), between the first and the last day of occurrence of the specified class and year.
For the DOP calculation, the first and the last days of occurrence of each class for every year were detected. The DOP was calculated as the total number of consecutive days between the first and the last day of occurrence for each class each year, no matter if all the days belonged to the same class or not.
As a calculation procedure, for warm and hot stress classes, a number from 1 to 366 was assigned to each day of the year, from the 1st of January to the 31st of December. However, for the cold stress classes, the numbering was made differently, so that the DOP, which was calculated as the difference between the last day and the first day of occurrence, could be homogenous and not present long missing periods. For instance, the first three classes of comfort for the H index are missing every year during the summer months, hence, the numbering for these classes started from the 1st of September to the 31st of July, so that the length of the DOP could be as exactly as possible.
All these operations were made using the Macro option in Microsoft Excel 2013 software.

2.3.3. Trend Detection and Mapping Methods

For trend detection in the two features of the considered indies, we used the Mann-Kendall test [70,71] and the magnitude of the trend (the slope) was calculated by employing the Sen’s slope method [72]. The significance level was established at 0.05.
All the calculations were performed by employing XLSTAT ProPlus software (Addinsoft, Paris, France) and the spatial distribution of trend types was mapped using ArcMap10.2 software (ESRI, Bucharest, Romania).

3. Results

3.1. TeK Index

3.1.1. FO and DOP Spatial Distribution

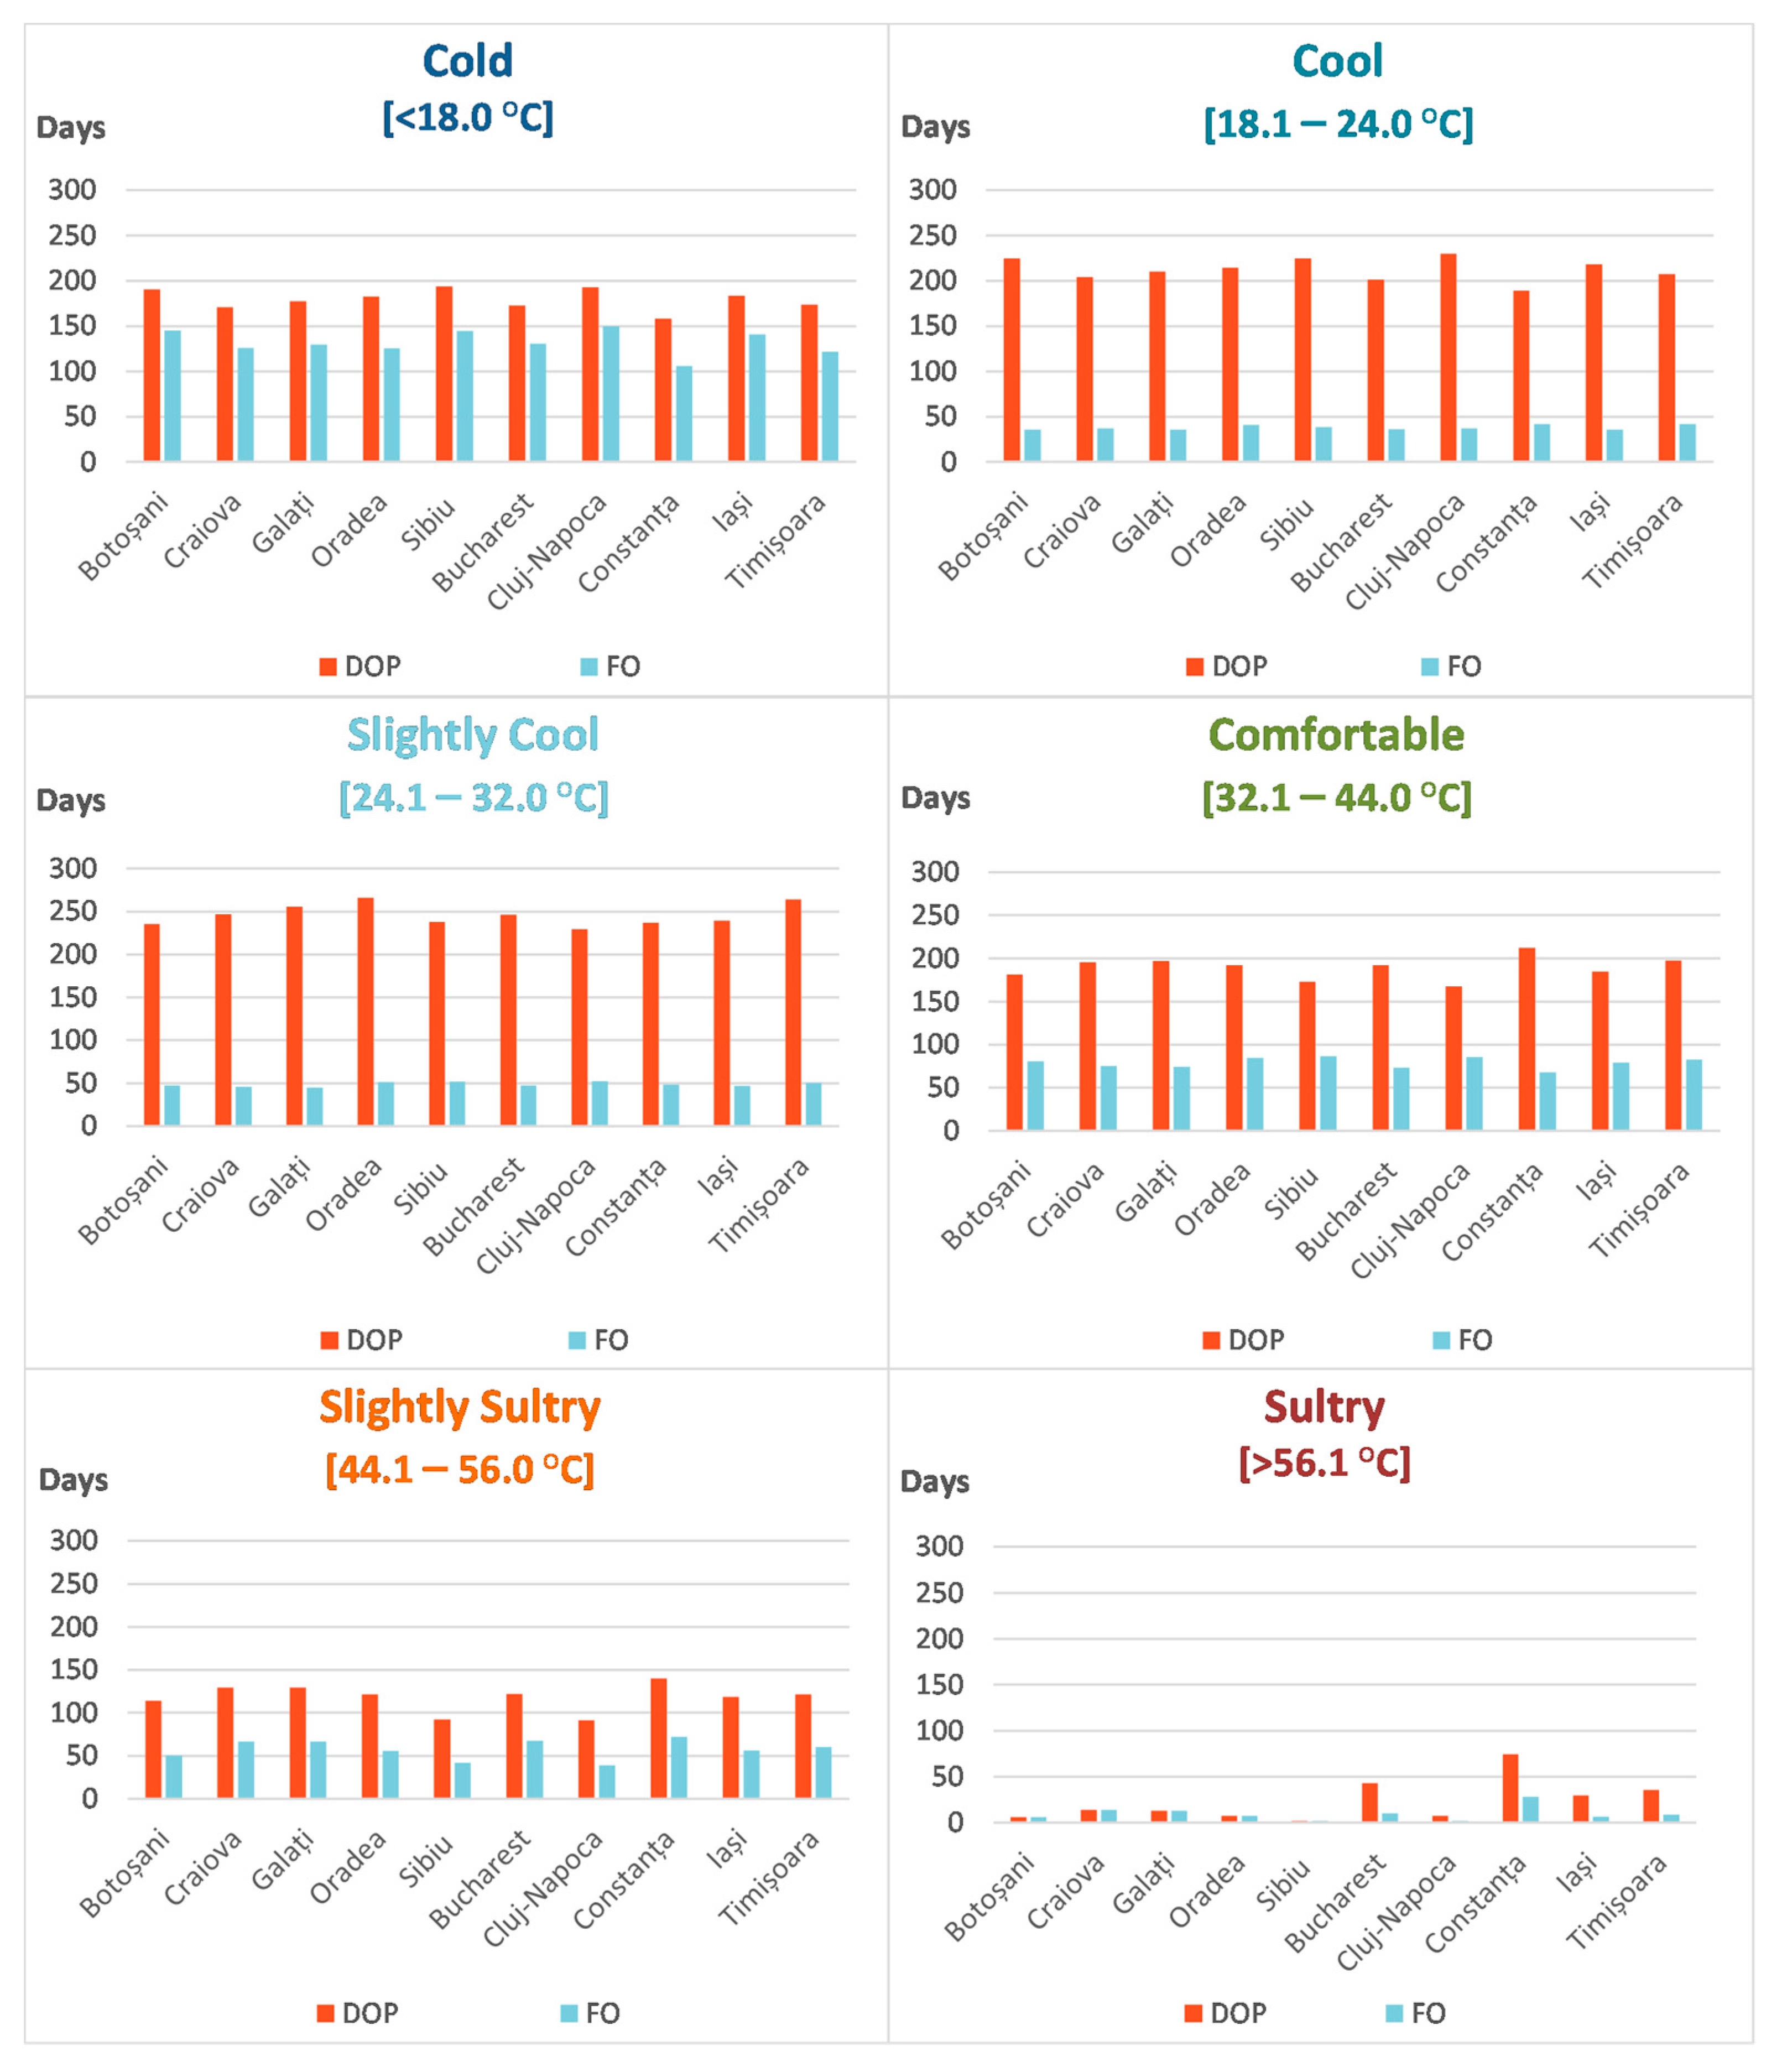
Considering this index, most days of the year belong to the cold stress class (<18 °C), with a multi-annual average value varying from 110 (Constanța) to 150 days/year (Cluj-Napoca), and to comfortable sensation class (32.1–44.0 °C), with 70–80 days/year. They are followed by the slightly sultry class (44.1–56.0 °C) that has an average of 40–70 days/year, whilst the slightly cool and cool conditions characterize 40–50 days/year, and respectively 35–40 days/year. Less than 20 days/year are attributed to the sultry conditions for all the weather stations considered, except for Constanța, which is located on the Black Sea shore and such conditions are accomplished in almost 30 days/year (Figure 2).
For most of the cases, the DOP exceeds 150 days/year, with the cool and slightly cool classes exceeding 200 days/year, or even 250 days/year in western Romania; thus, these conditions are mostly accomplished all year round, except for hot summer days, which are characterized by DOP varying from 100 to 150 days/year corresponding to slightly sultry sensations, respectively less than 50 days/year (apart from Constanța) for sultry conditions. However, the DOP values are considerable higher for the extra-Carpathians regions, especially for those located in plain and low hilly or tableland areas. The lowest values characterize the center of the country (Cluj-Napoca and Sibiu weather stations) (Figure 2).

3.1.2. Changes Detected in TeK Index Parameters

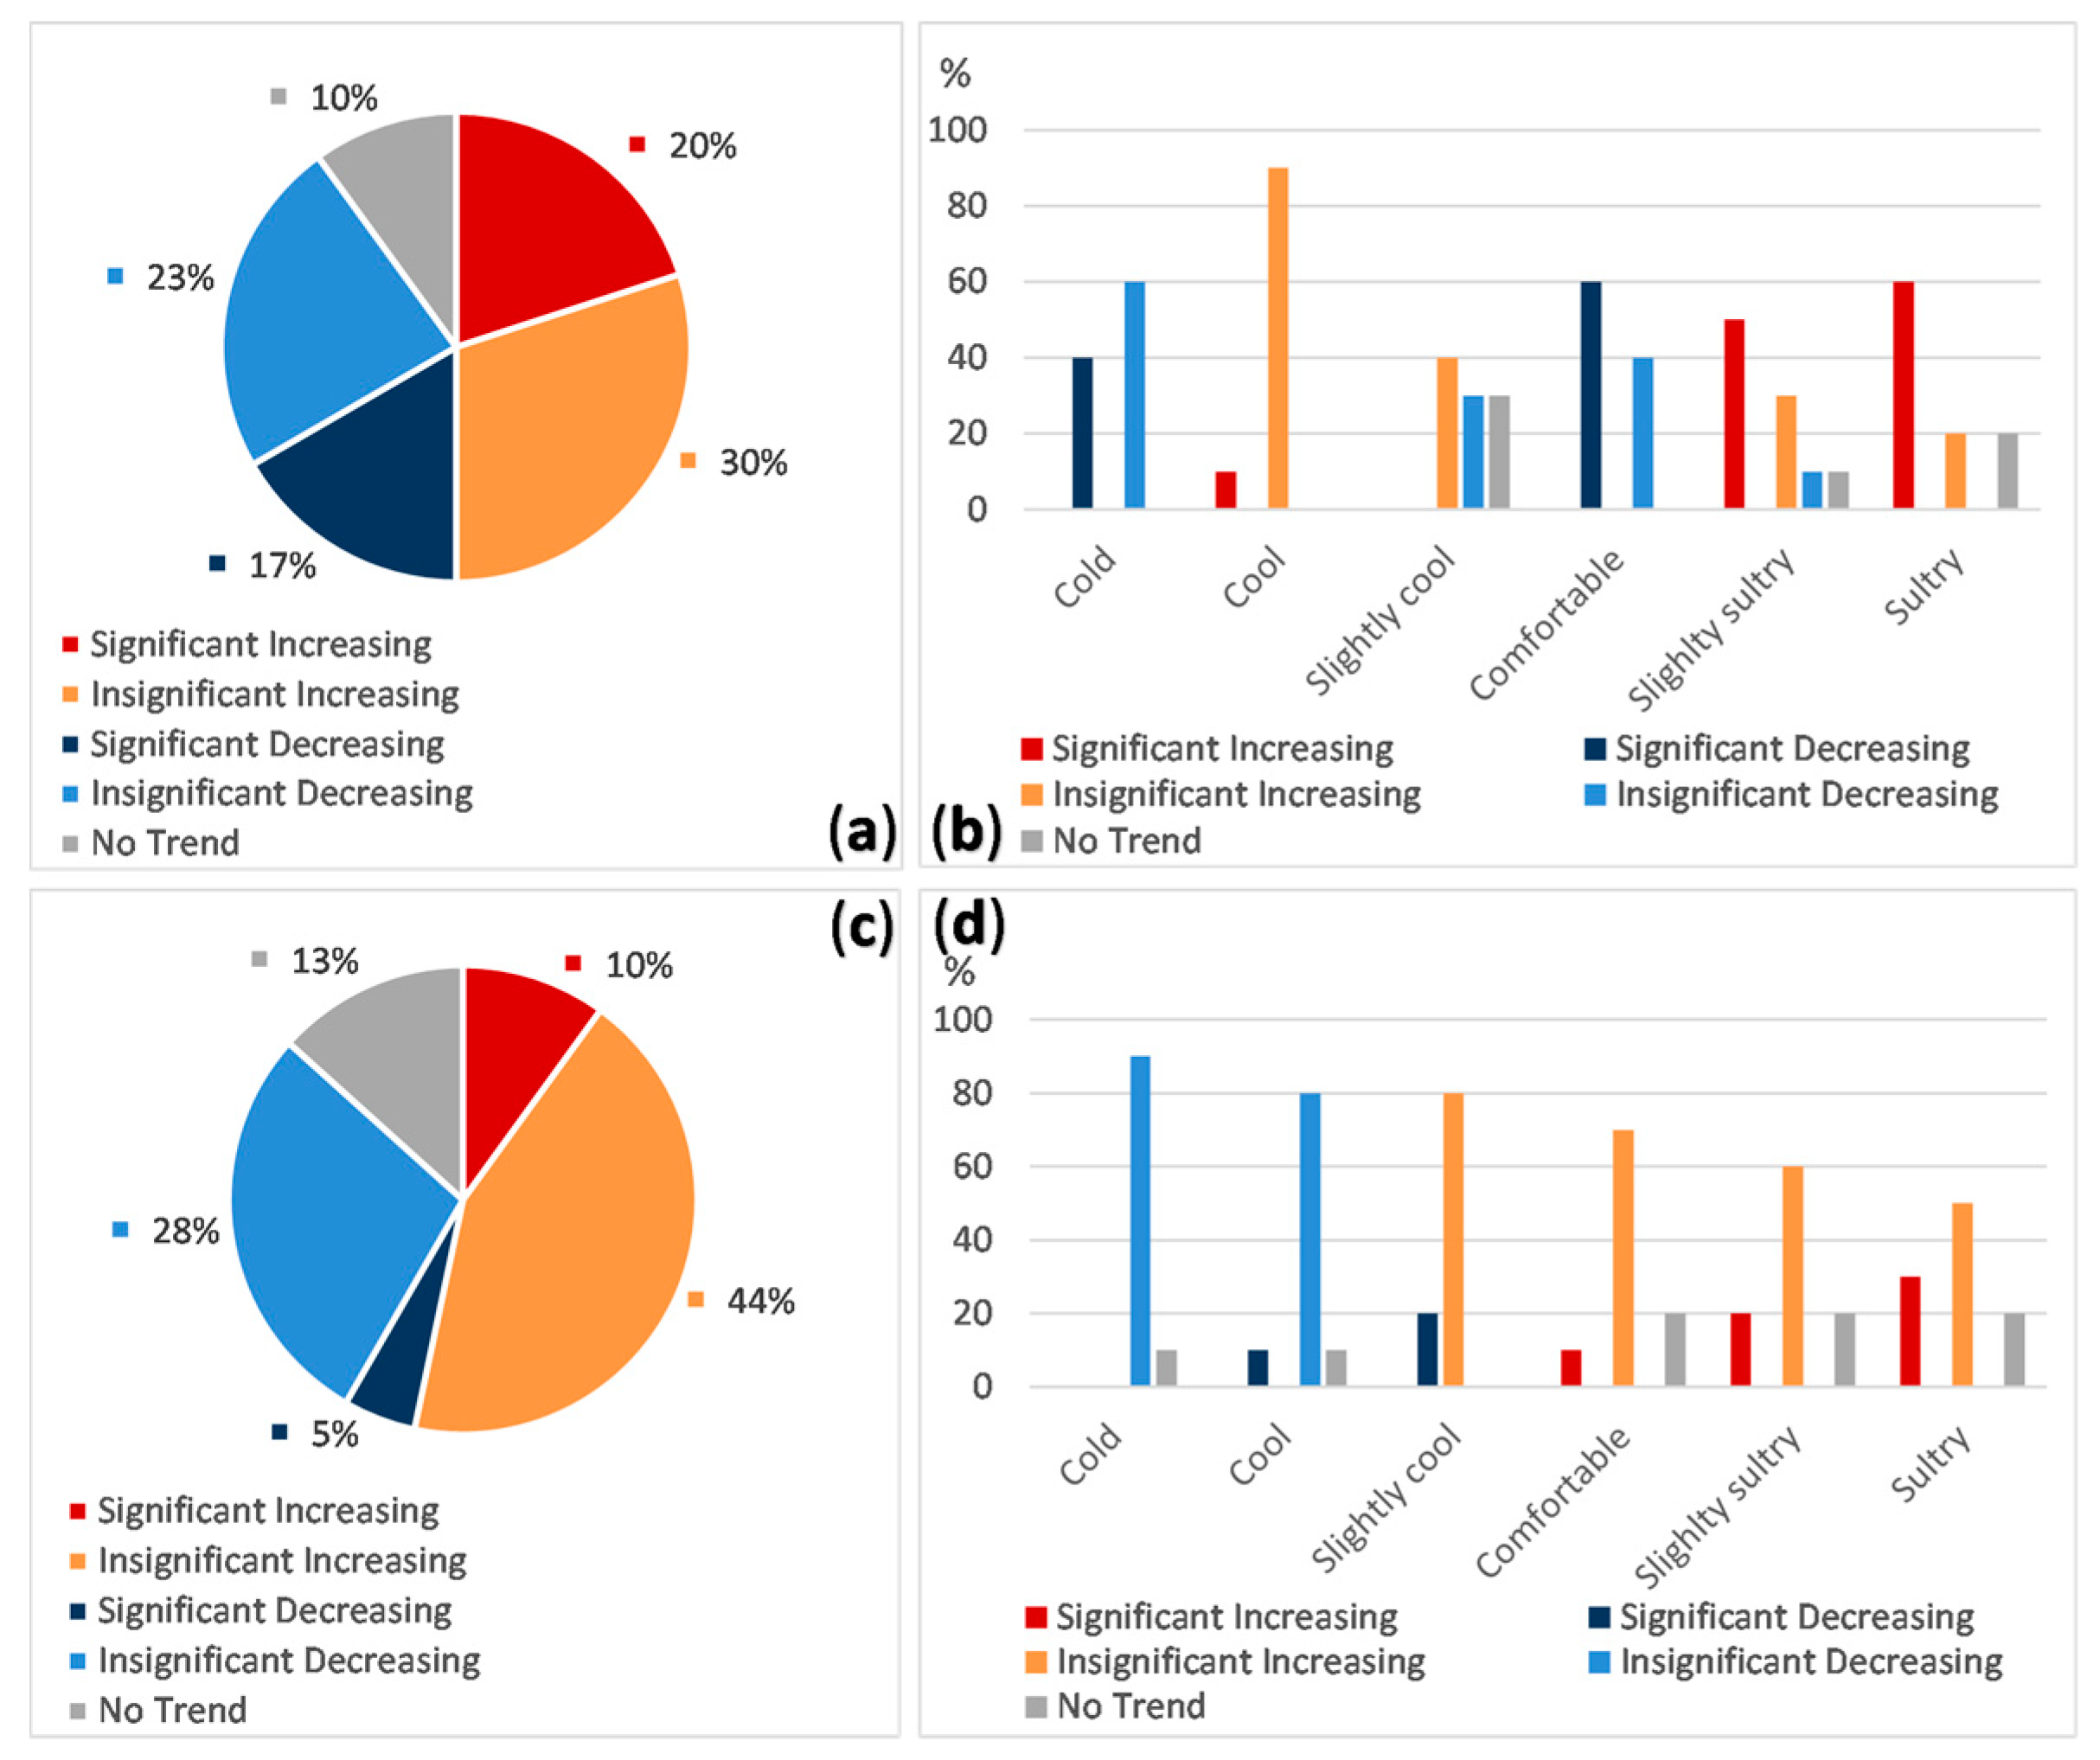
Increasing trends were dominant for both parameters considered. Most of them were found to be statistically insignificant, when all the data sets were considered: 53% of the FO series and 72% of the DOP (Figure 3a,c).
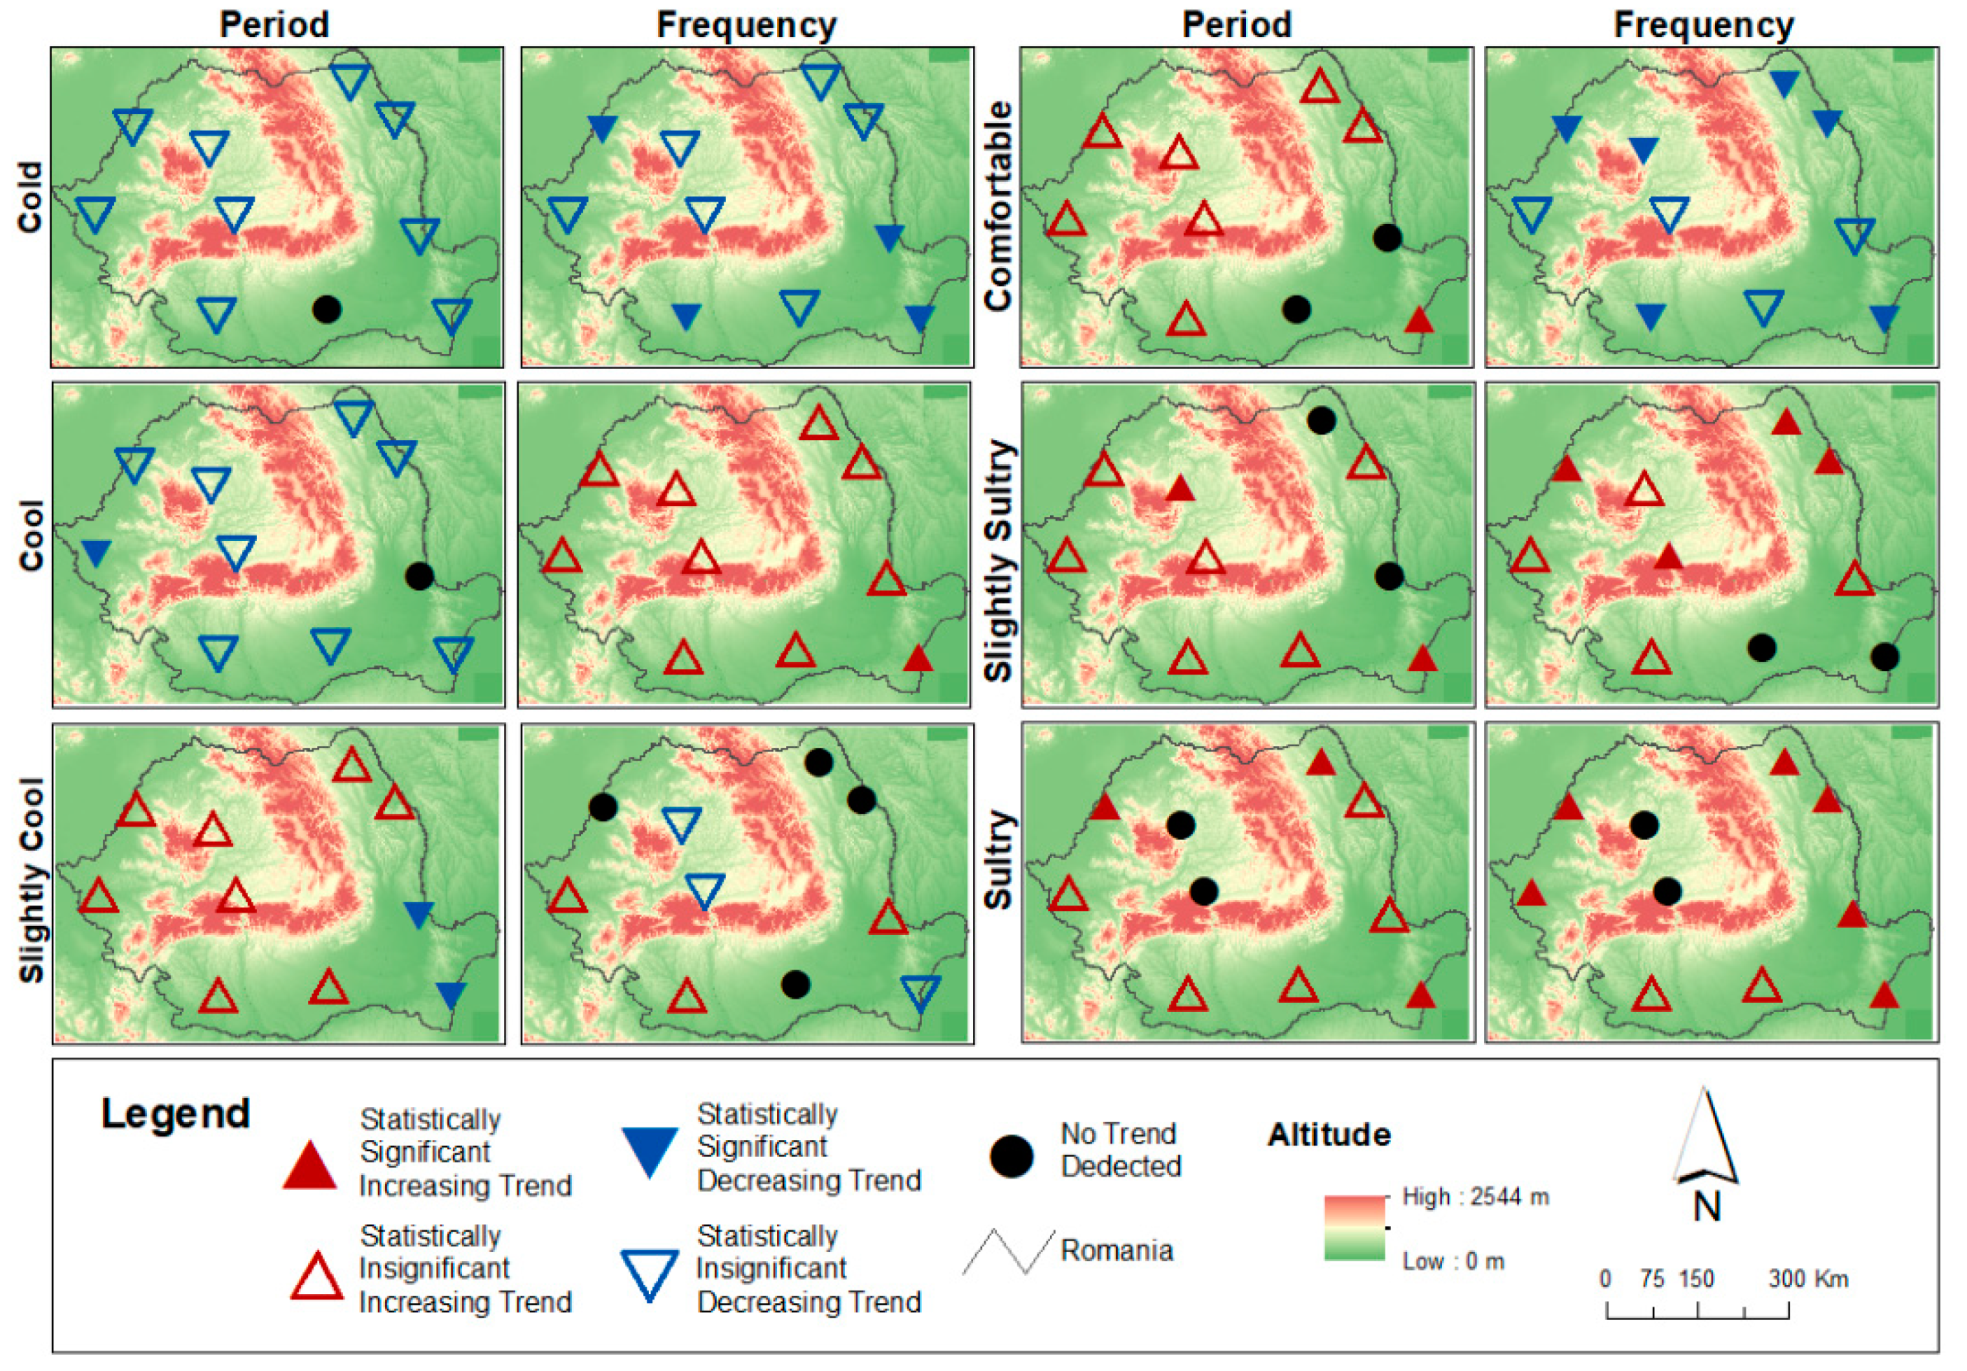
The analysis revealed that the FO by comfort/discomfort classes increased for half of the locations, and for 20% of them, the increase was found to be statistically significant (Figure 3a). They were specific mainly to the slightly sultry and sultry conditions classes for eastern and western regions (Figure 3b and Figure 4). Out of the total data series, 40% indicated downward trends and 17% were characterized by statistical significance (Figure 3a). They were specific mainly to the cold stress and comfortable sensation classes.
In the case of the DOP, only 15% of the data series indicated significant changes (10% increasing and 5% decreasing). In general, the DOP for cool and cold conditions decreased, whereas for the other classes (slightly cool, comfortable, slightly sultry and sultry) it increased, yet not statistically significant. The only region in Romania where a significant change was detected is the southeastern one, located on the seaside of the Black Sea: the length of comfortable and hot stress periods increased over the 56-year period. A few stationary trends were detected, but they were not spatially coherent (Figure 4).

3.2. TE index

3.2.1. FO and DOP Spatial Distribution

For the considered cities, the extreme heat discomfort class of TE (Hot) had a very low frequency at all stations, at a maximum of 2 days/year. Since it seemed irrelevant, we decided not to include it in this study.
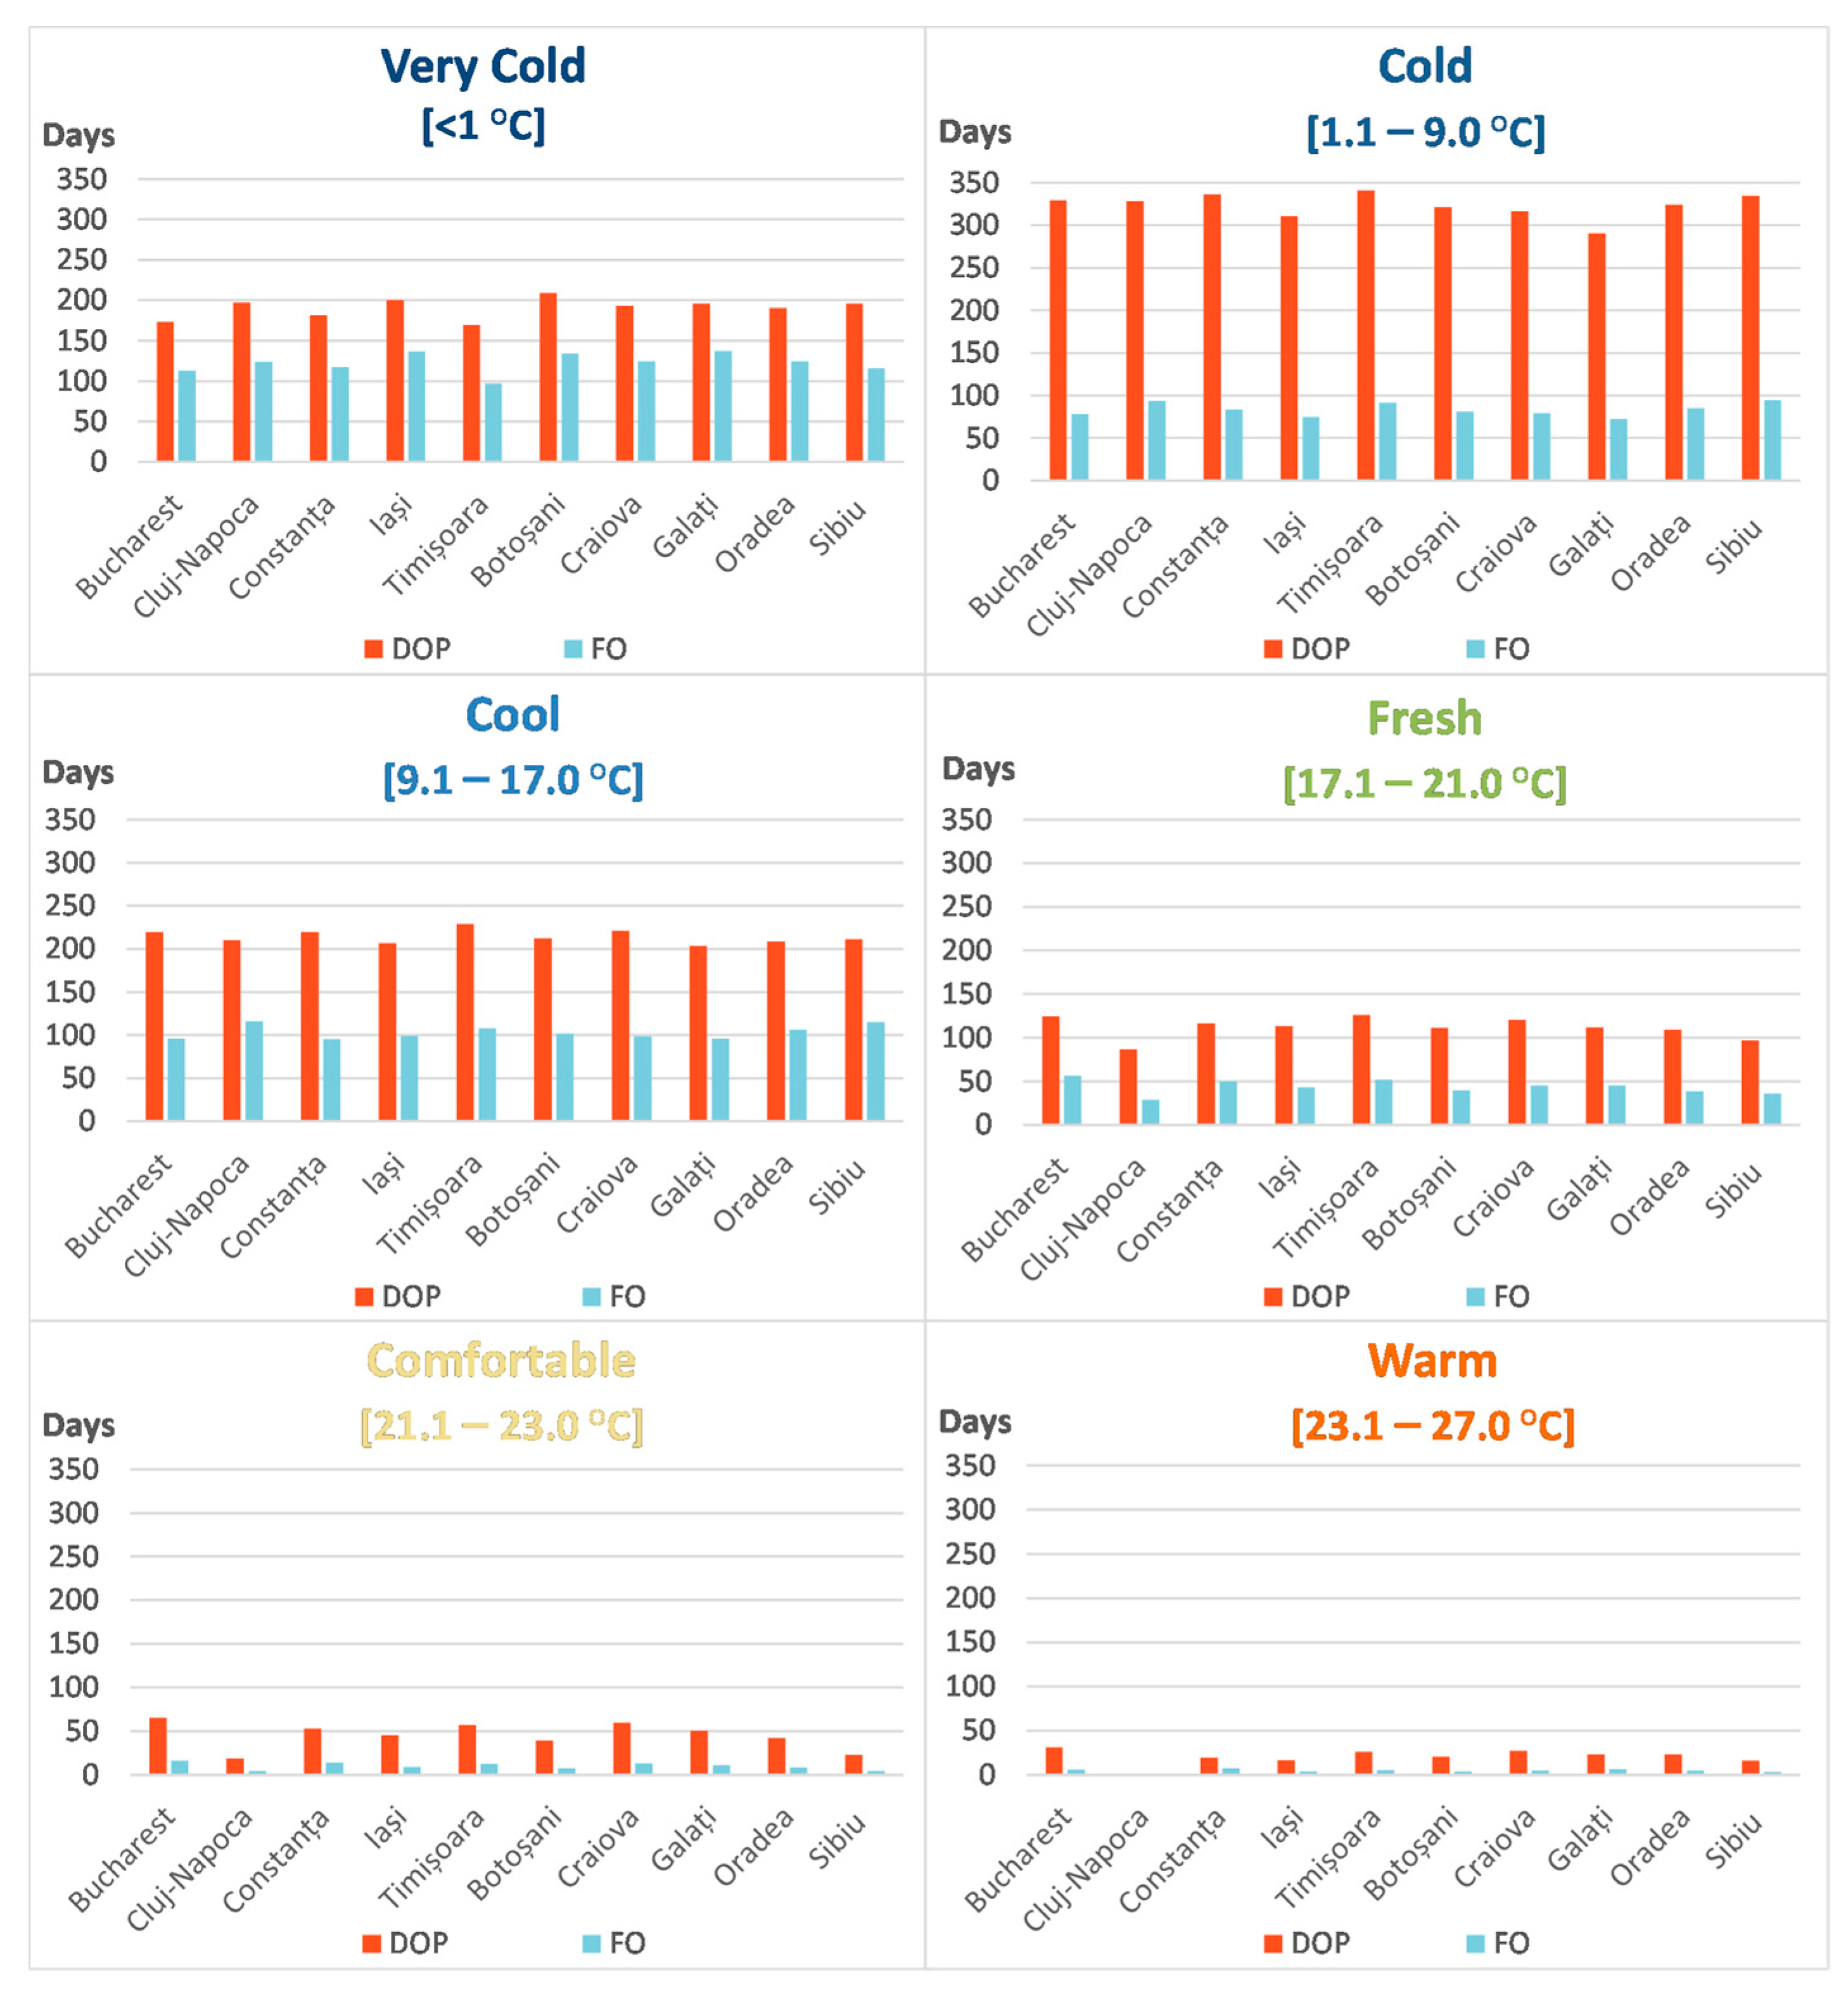
The best represented class for the FO was that corresponding to very cold conditions: 90–140 days/year, as average values, depending on the location. The maximum values reached 140–180 days/year. It was followed by the cool and cold sensation classes, with more than 90 days/year, as average values. According to this index, the comfortable or warm stress sensation classes were less frequent, usually less than 15–20 days/year (Figure 5).
By analyzing the DOP, we found that the most representative class was that characterized by cold sensation one, which was present throughout the entire year, with more than 300 days/year. It was followed by very cold and cool ones covering about 200 days/year. Based on this index, the comfortable and warm conditions were the least frequent and did not exceed maximum values of 60 days/year (Figure 5).

3.2.2. Changes Detected in the TE Index Parameters

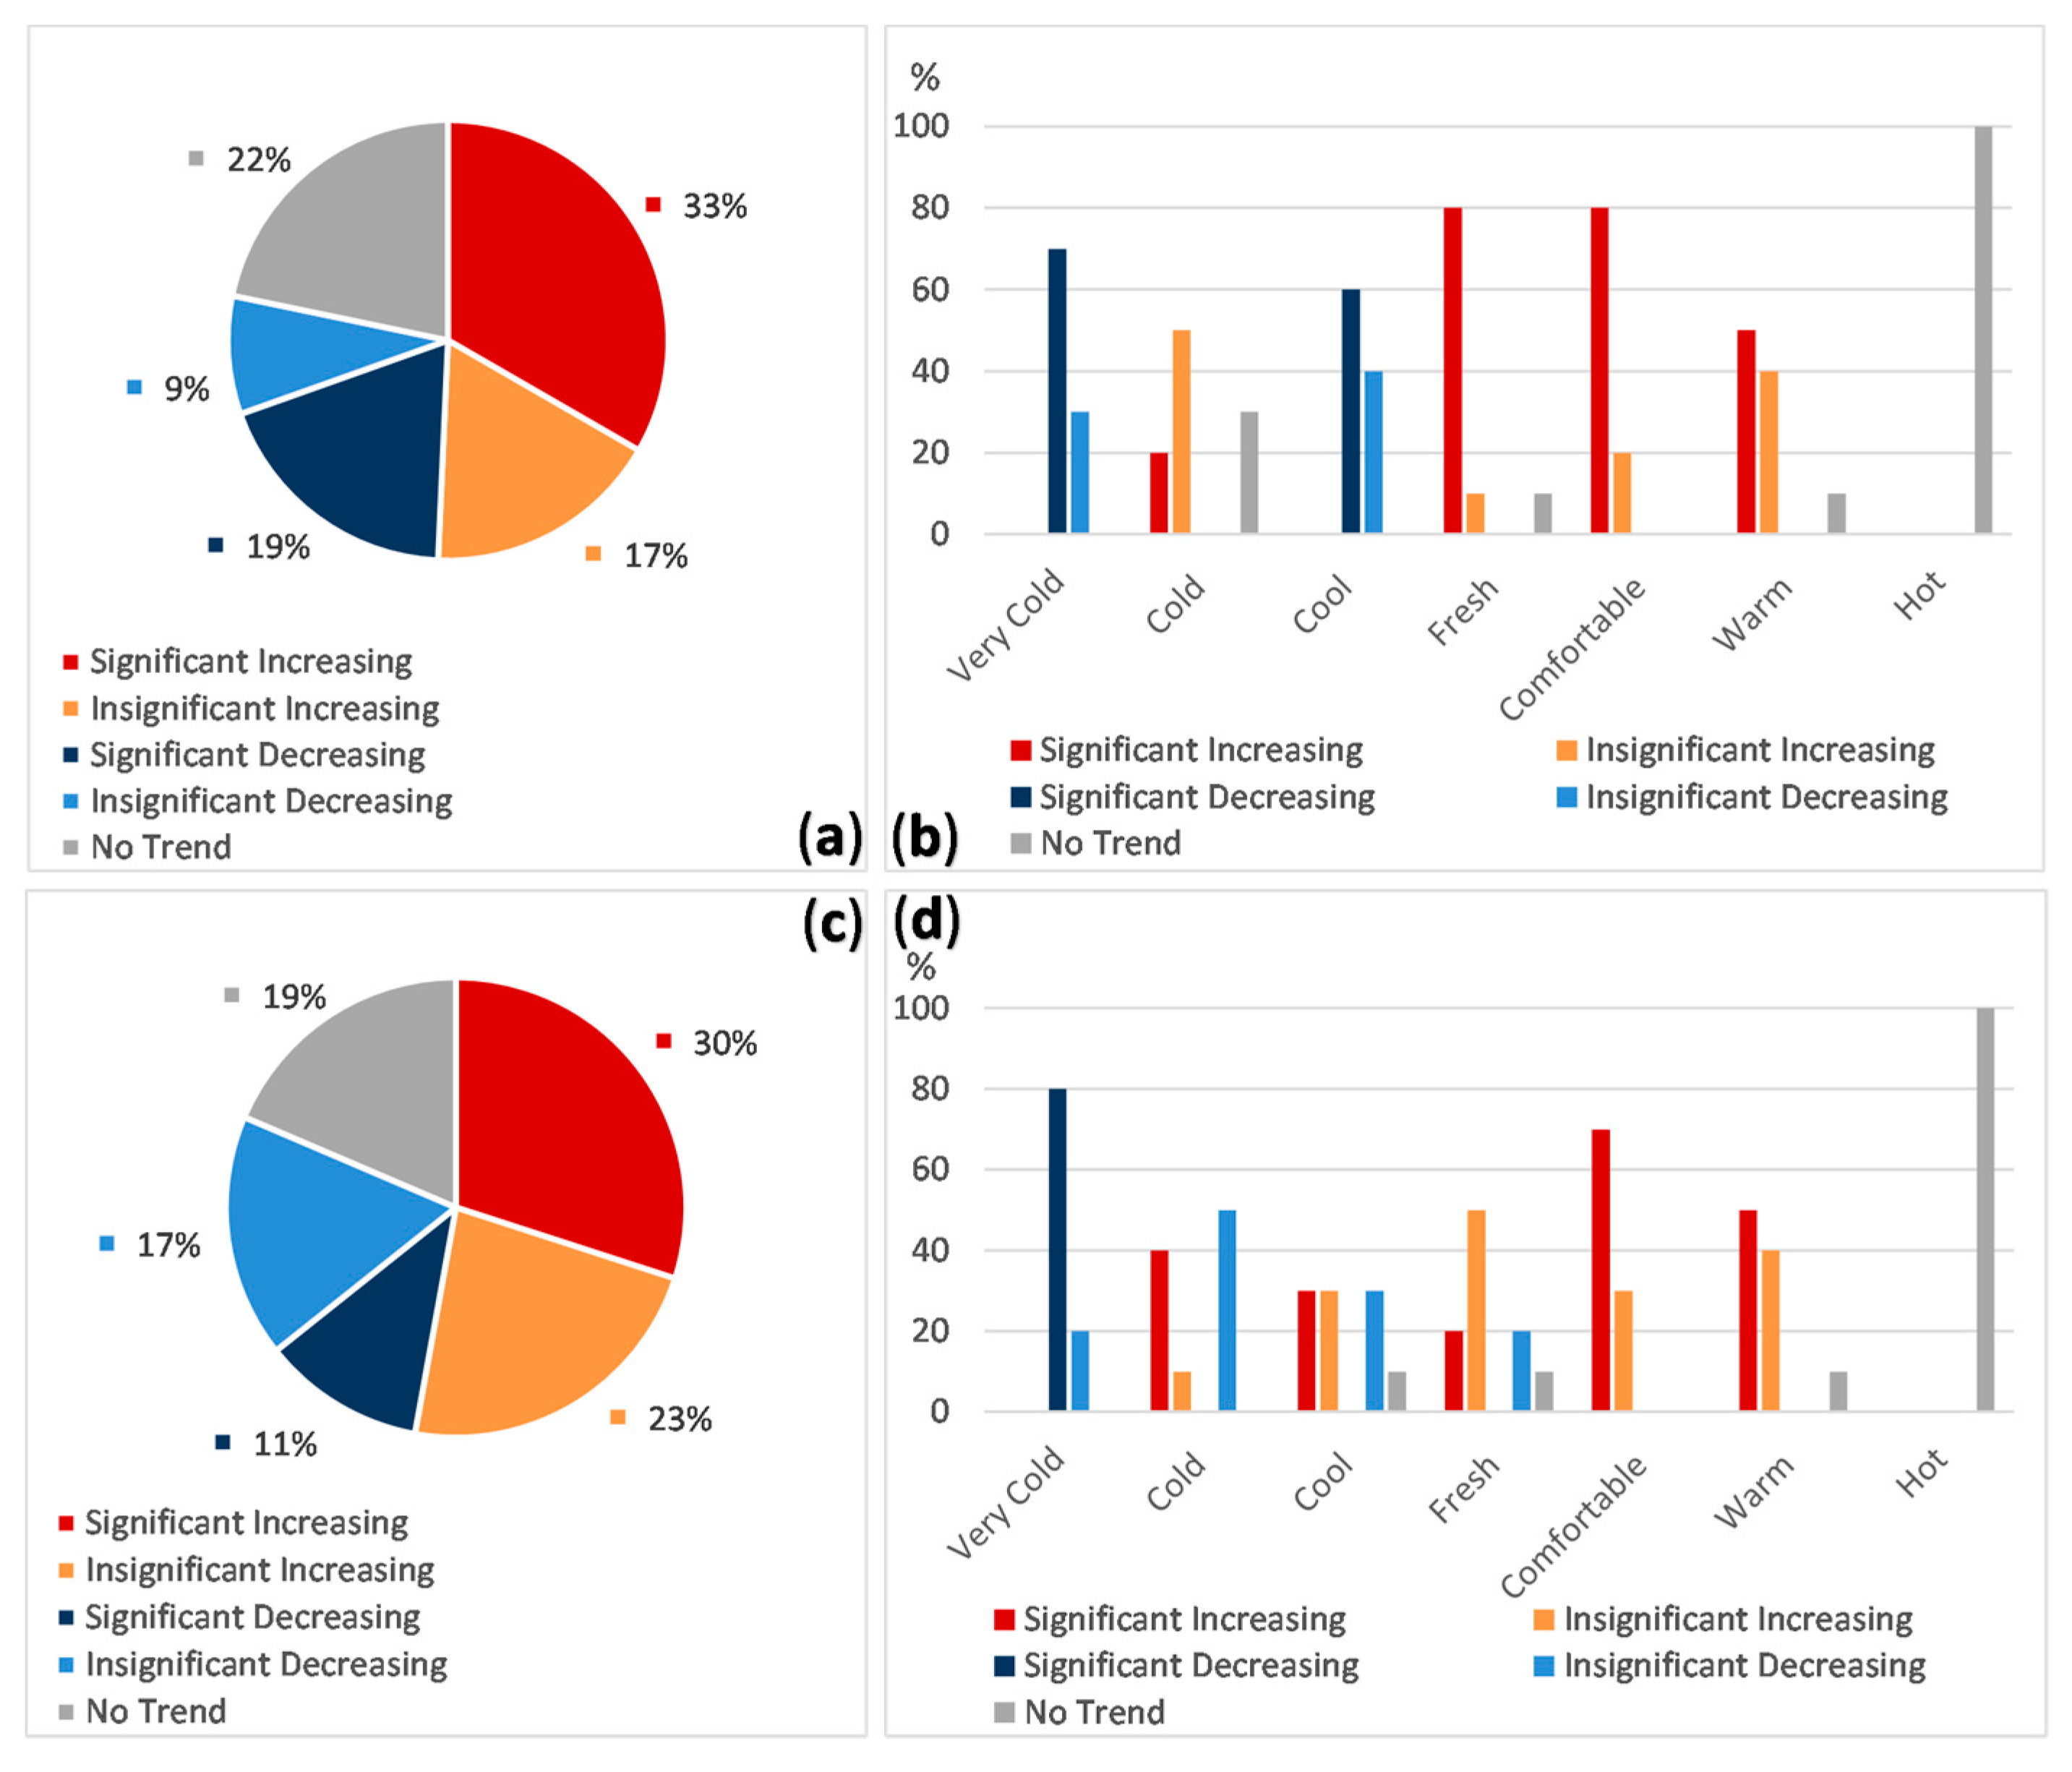
The analyses revealed that most of the detected trends for the TE index increased, reaching up to 50% of the total data series considered for the FO parameter in each class and 53% of the series for the DOP; statistically significant trends represent more than 30% in both cases (Figure 6a,c). The statistically significant decreasing ones were specific to the FO in the case of very cold and cool days, respectively, for the DOP of very cold conditions.
Significant increases were found in cold, fresh, comfortable and warm conditions for both FO and DOP (Figure 6b,d).
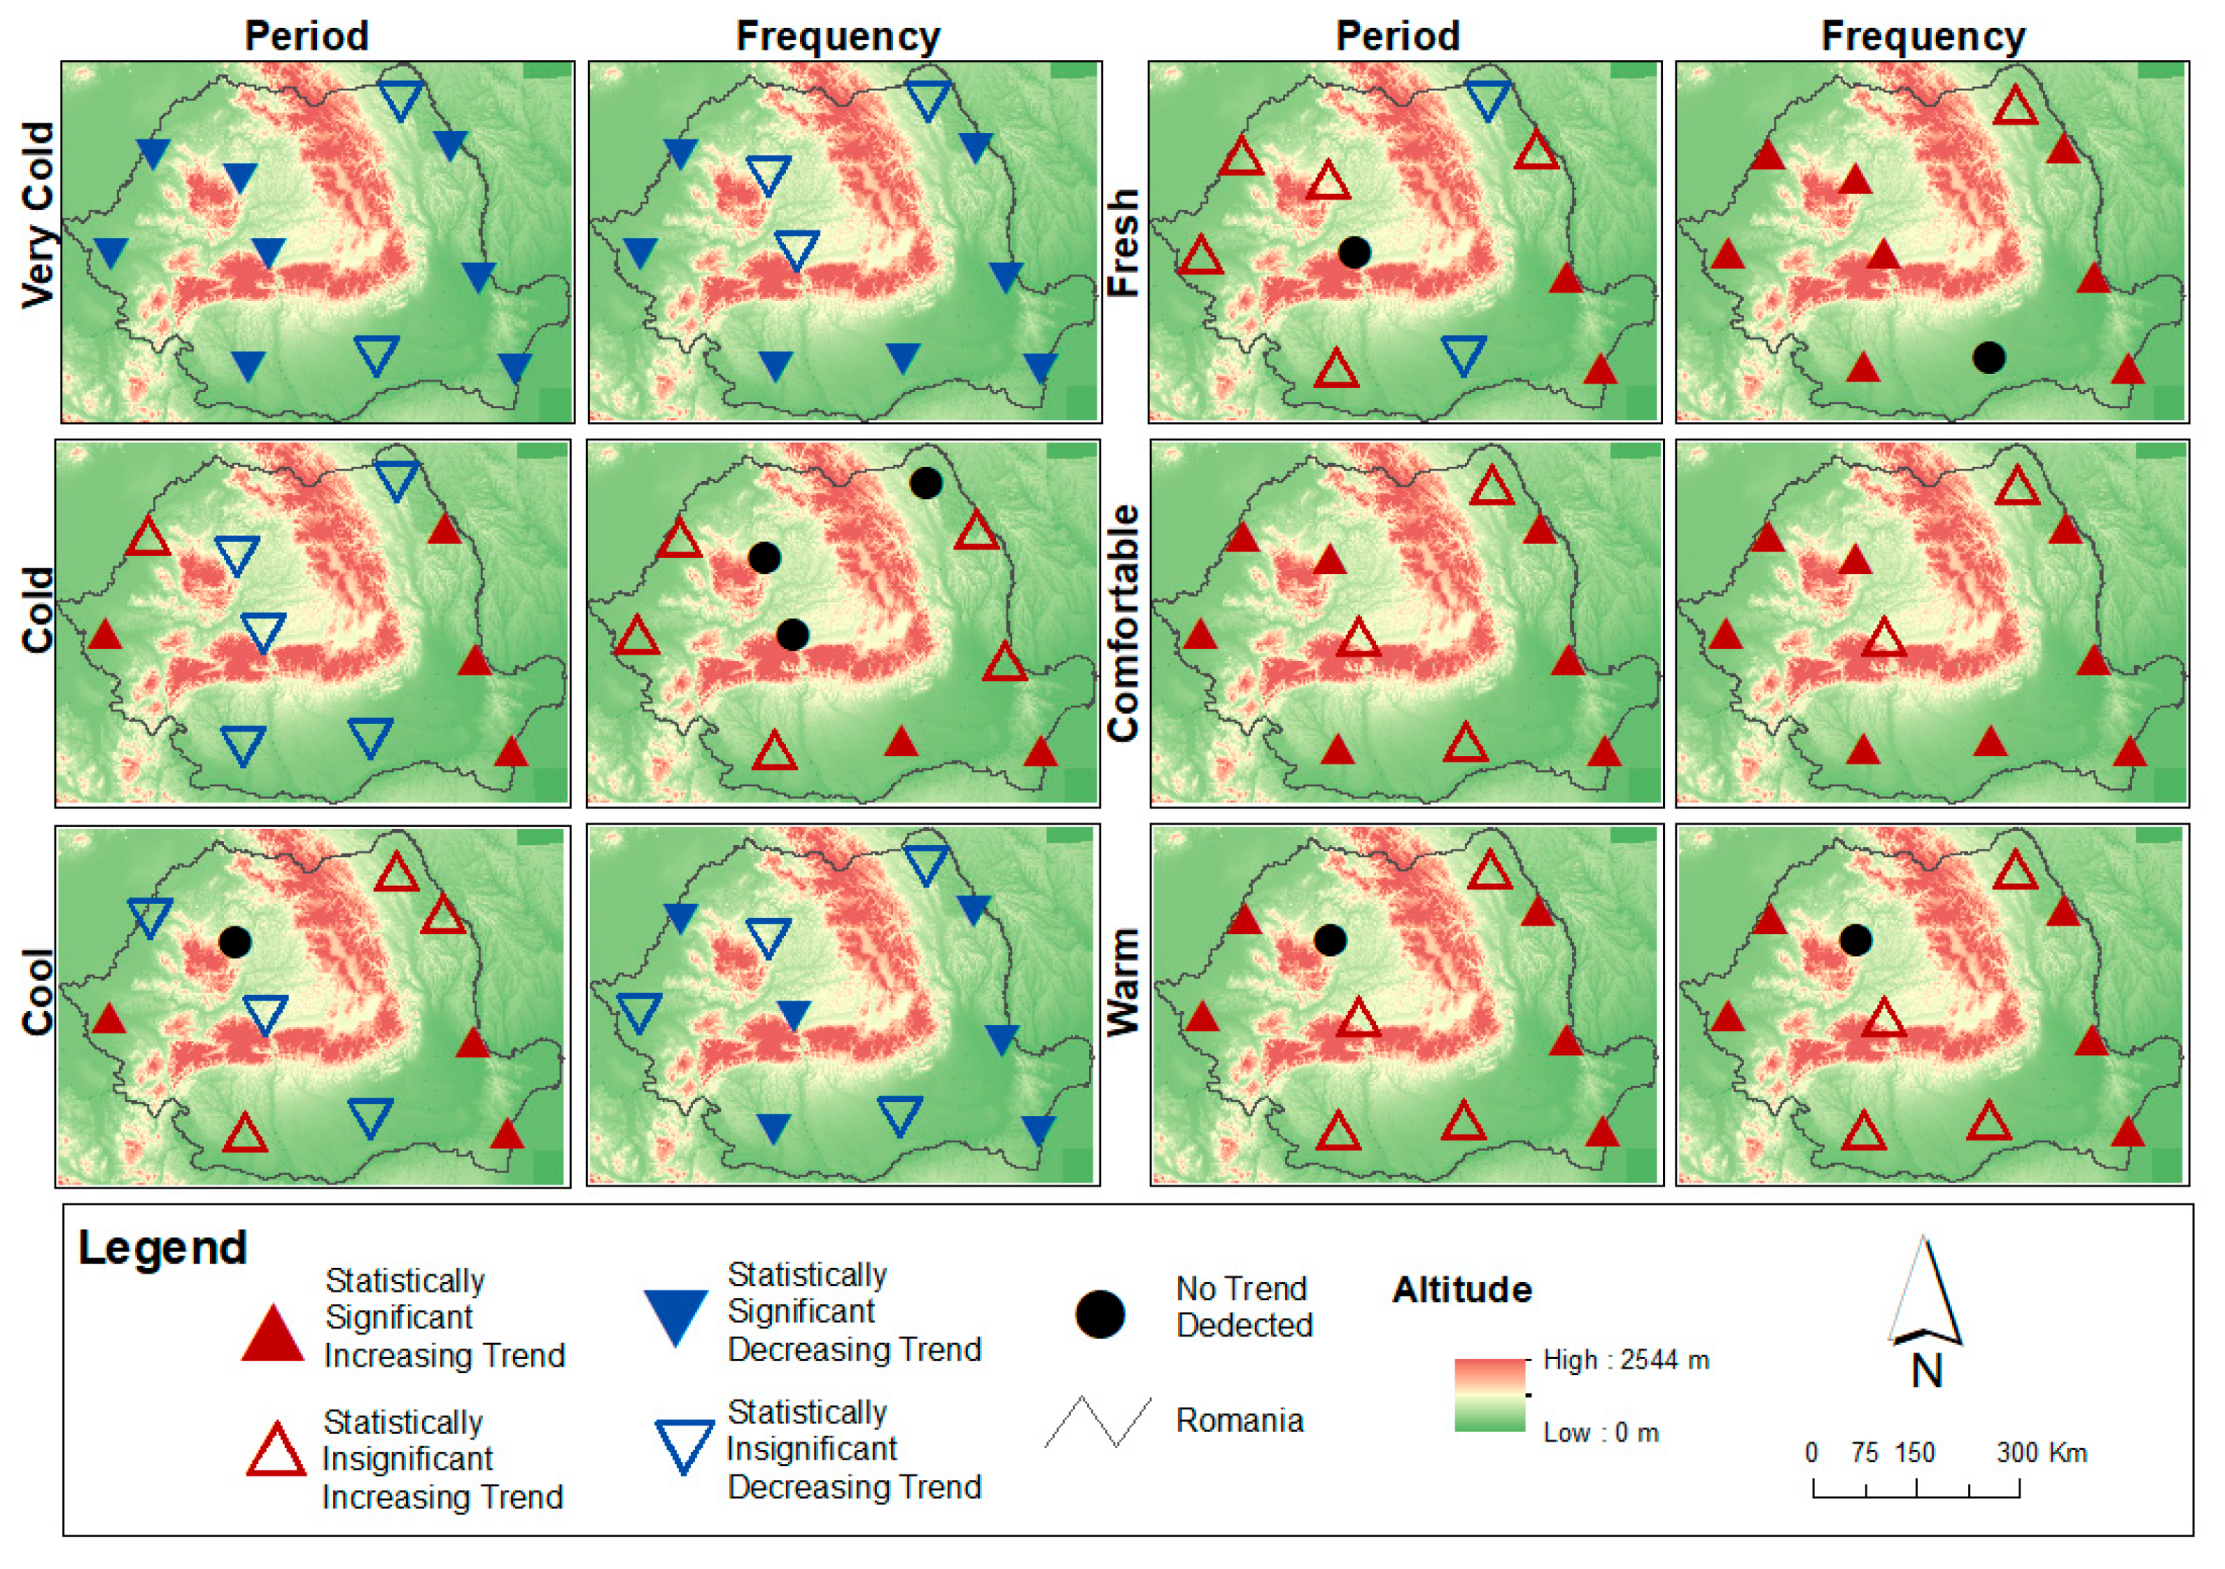
While the very cold and cool stress classes had the highest frequencies in terms of the number of days over the considered period, this parameter indicated a downward trend for all the locations and for most of them it was detected to be statistically significant. For the fresh, comfortable and warm sensation classes, the great majority of upward trends were found statistically significant (Figure 7). When attention was paid to the DOP, significant negative trends were detected for all the locations considered during very cold days. For eight of them, the decrease was statistically significant and for the other classes, significant increase was specific mainly to the eastern and south-eastern cities of the country. For comfortable and warm conditions, significant increase was specific to western cities. However, in the case of fresh, comfortable and warm classes, increasing trend, statistically significant or not, was dominant. Only a few series indicated no change.

3.3. H Index

3.3.1. FO and DOP Spatial Distribution

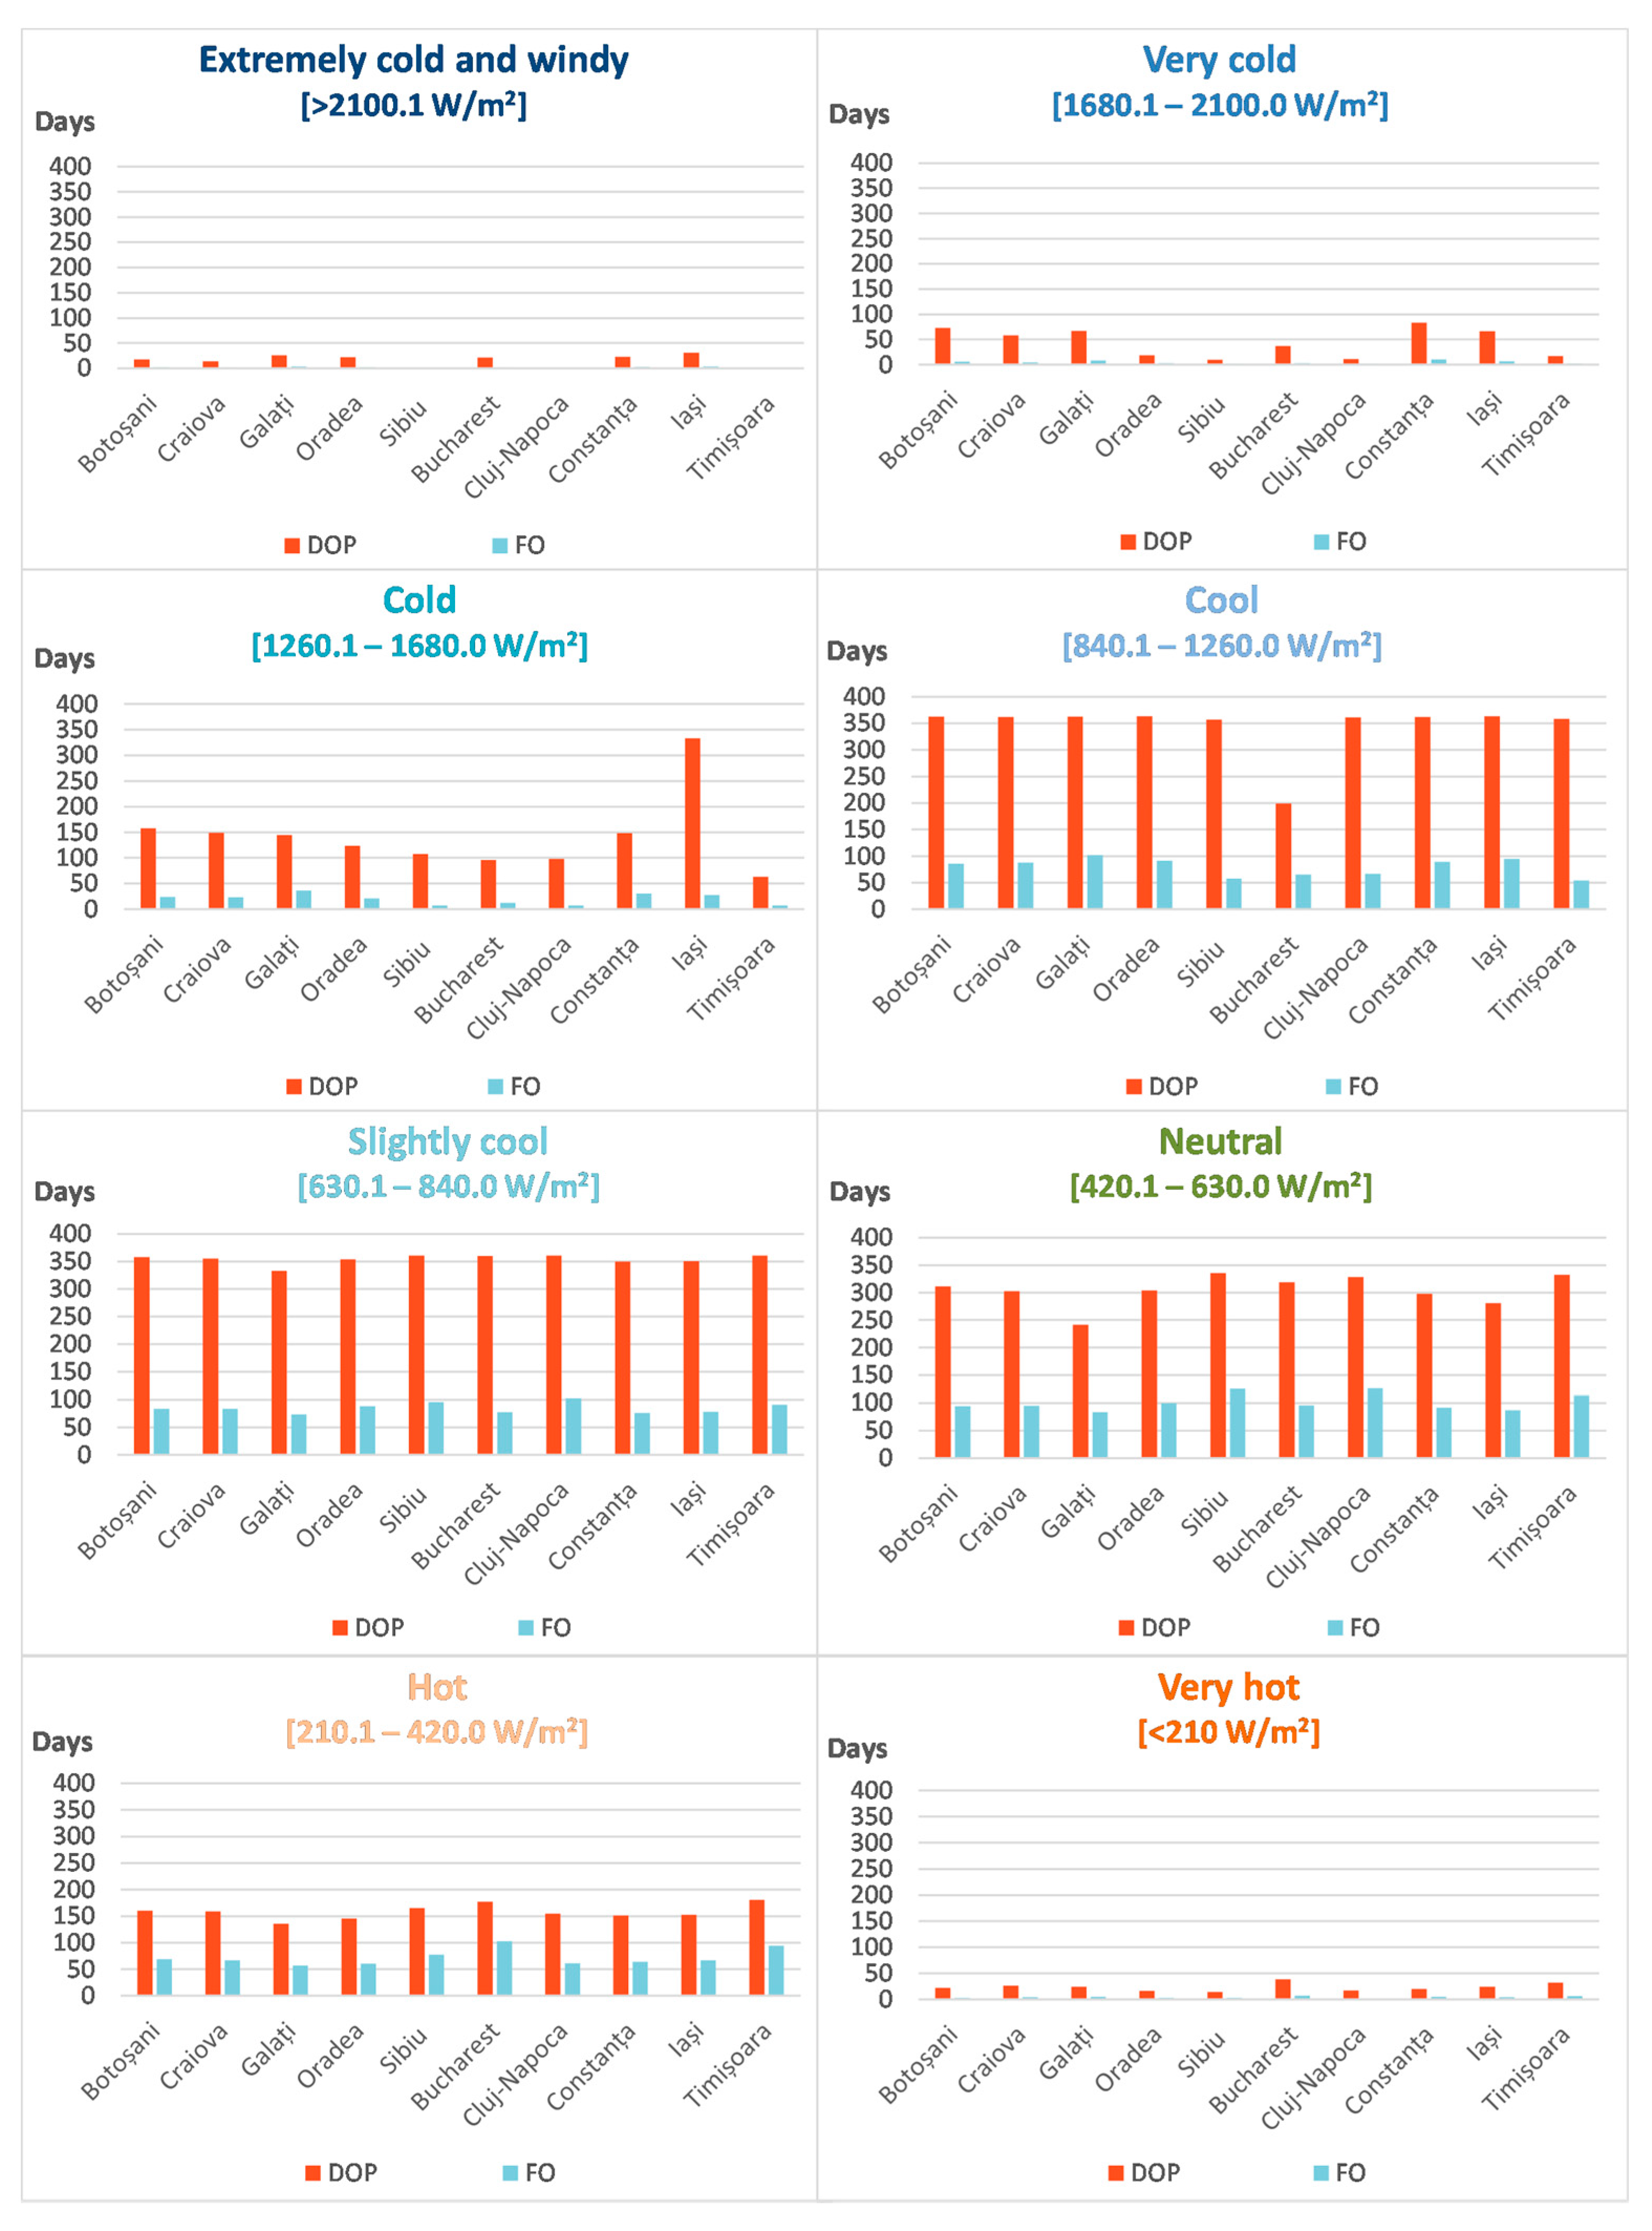
This index presents most of the days in the “middle” classes (cool, slightly cool, neutral and hot sensation), the extreme ones (extremely cold and windy, very cold and very hot) lasting less than 10 days/year. The cold conditions had the highest frequency in Eastern Romania (Constanta, Galati and Iasi). The class that covered the majority of days was the neutral one (80–130 days/year). The other three classes (cool, slightly cool and hot) did not differ very much in regards to FO values: the average ones were not higher than 100 days/year. By classes, the minimum FO values ranged from 50 days/year at Timișoara for cool conditions, to 55 days/year for hot days, at Galați and to 70 days/year for the slightly cool class (Figure 8).
The mean DOP varied between 300 and 350 days/year at most weather stations, for the cool, slightly cool sensation and neutral conditions, assuming that they were present over almost the entire year. For the cold and hot classes, it summed around 100–150 days/year. In some cases, the frequency was much higher: cold days at Iași exceeded 300 days/year. The frequency of the extreme classes was less than 50 days/year (Figure 8).

3.3.2. Changes Detected in the H Index Parameters

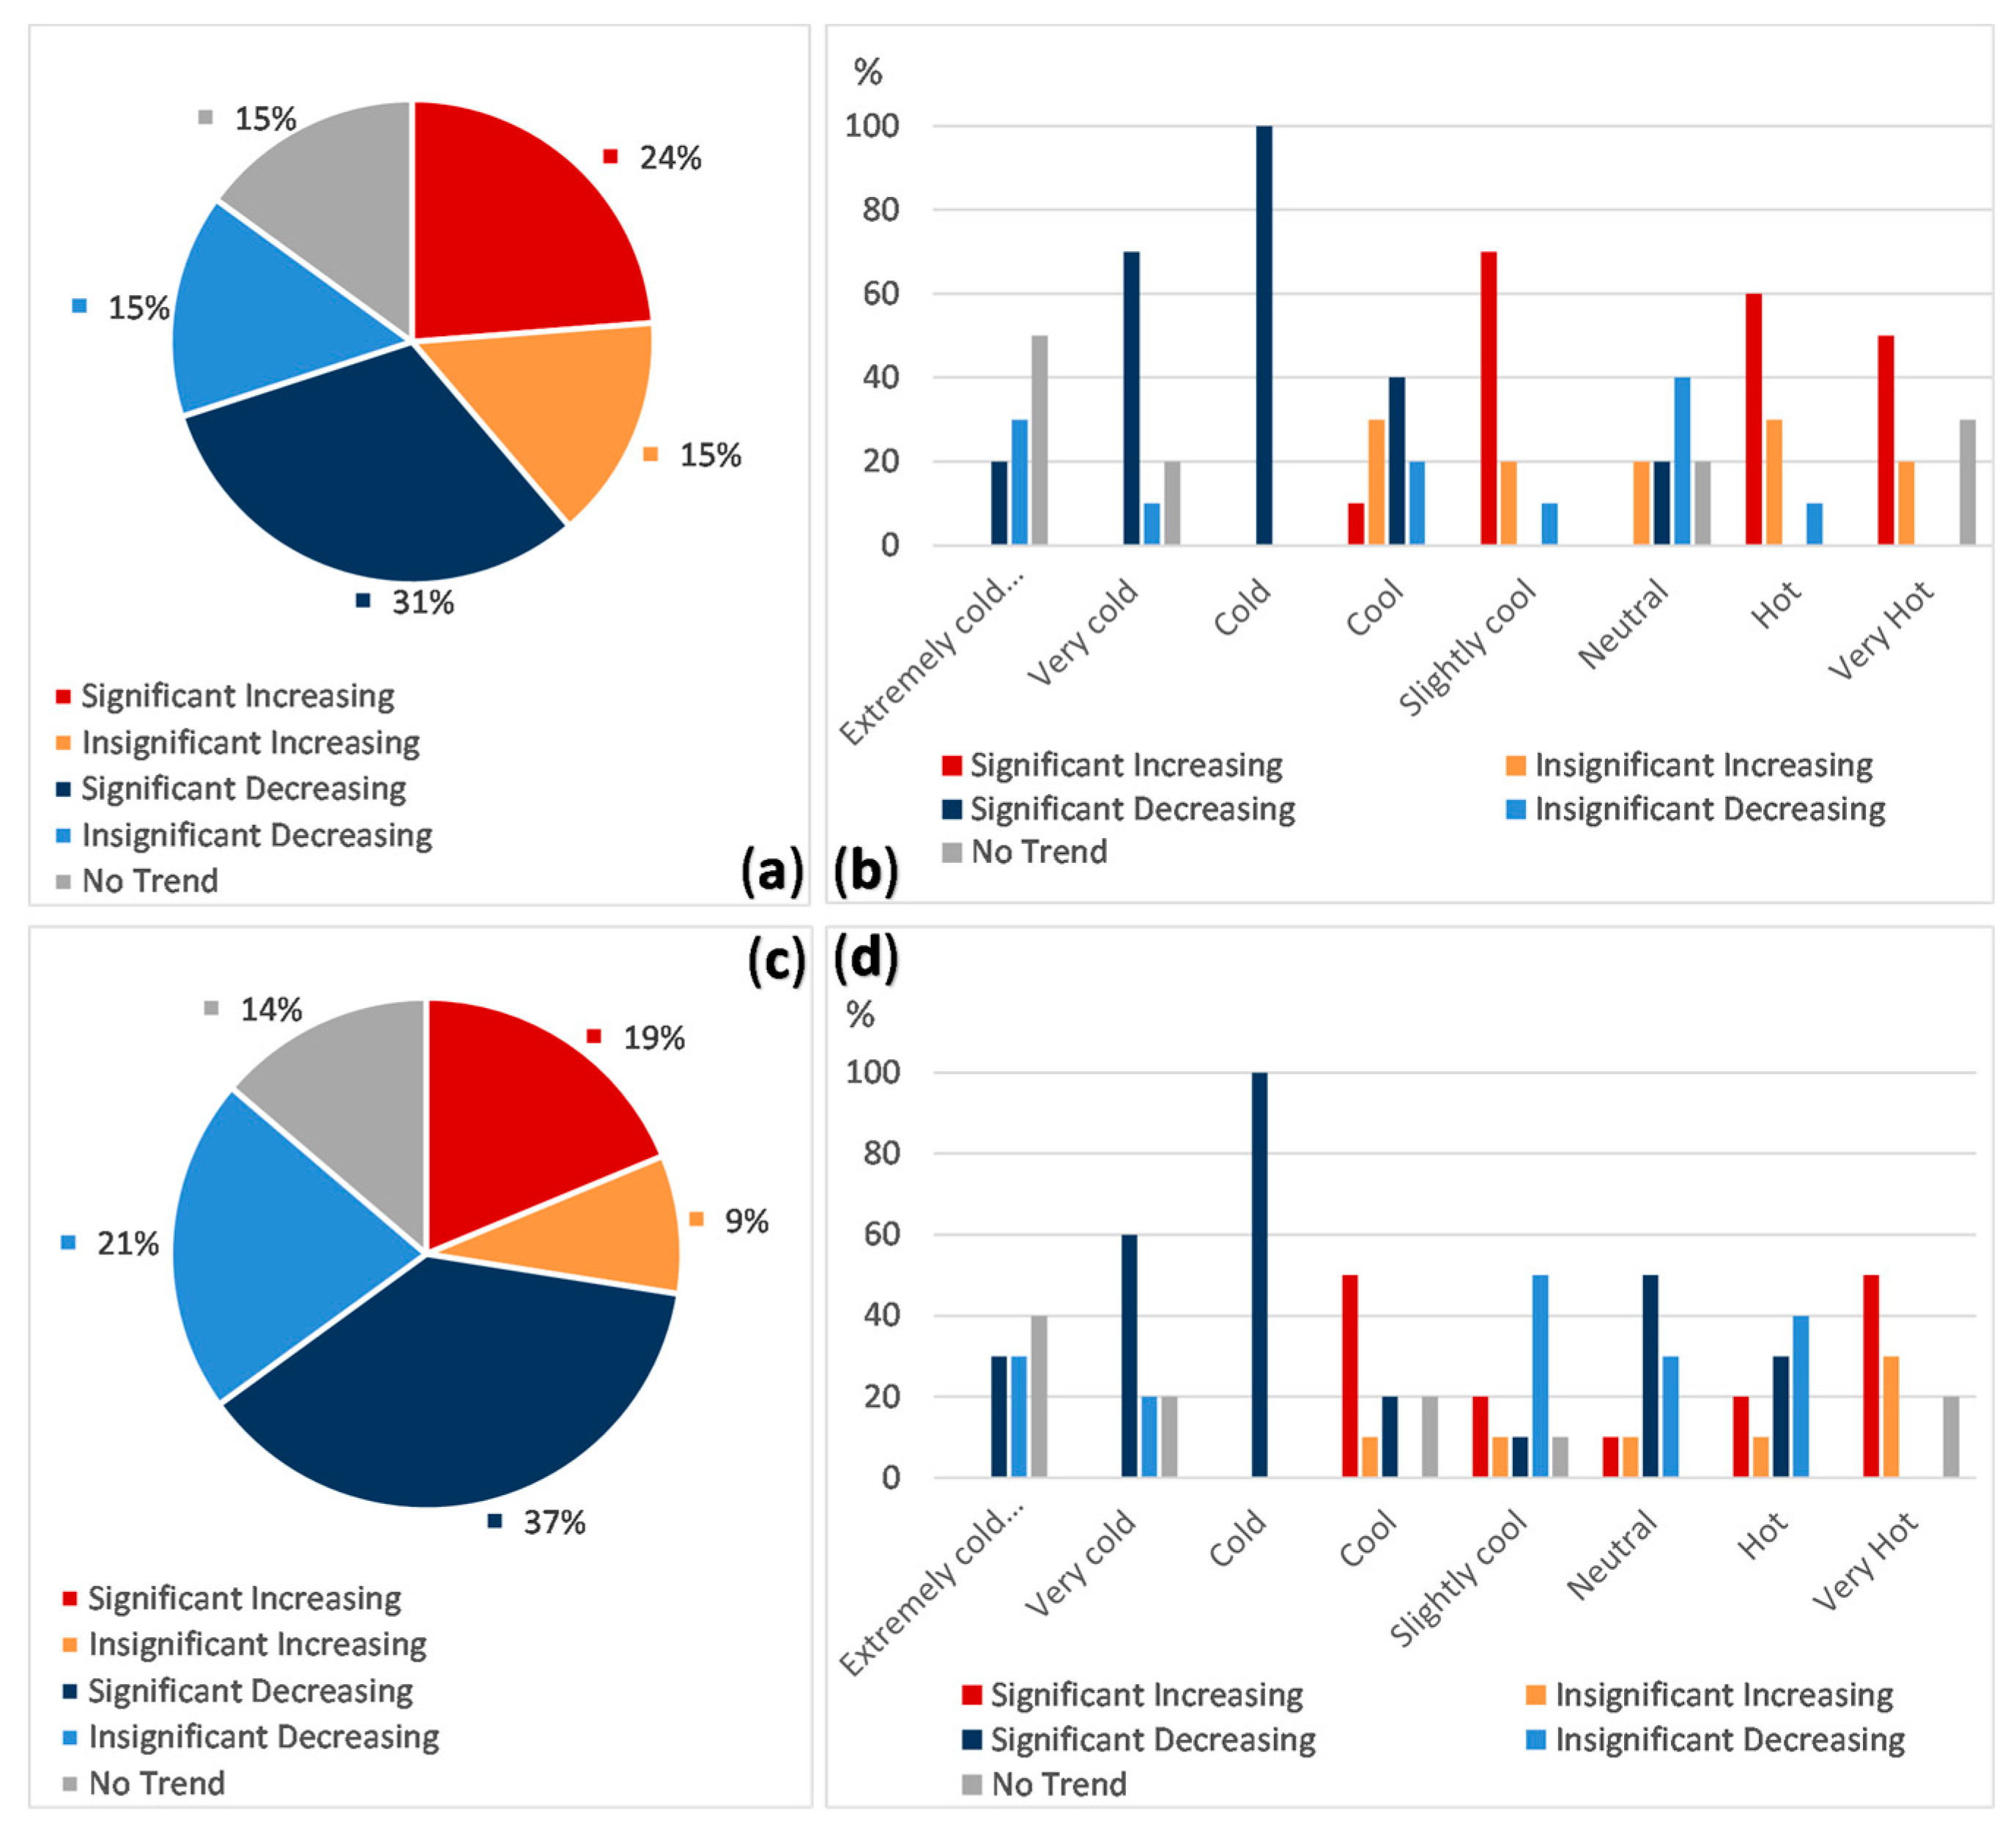
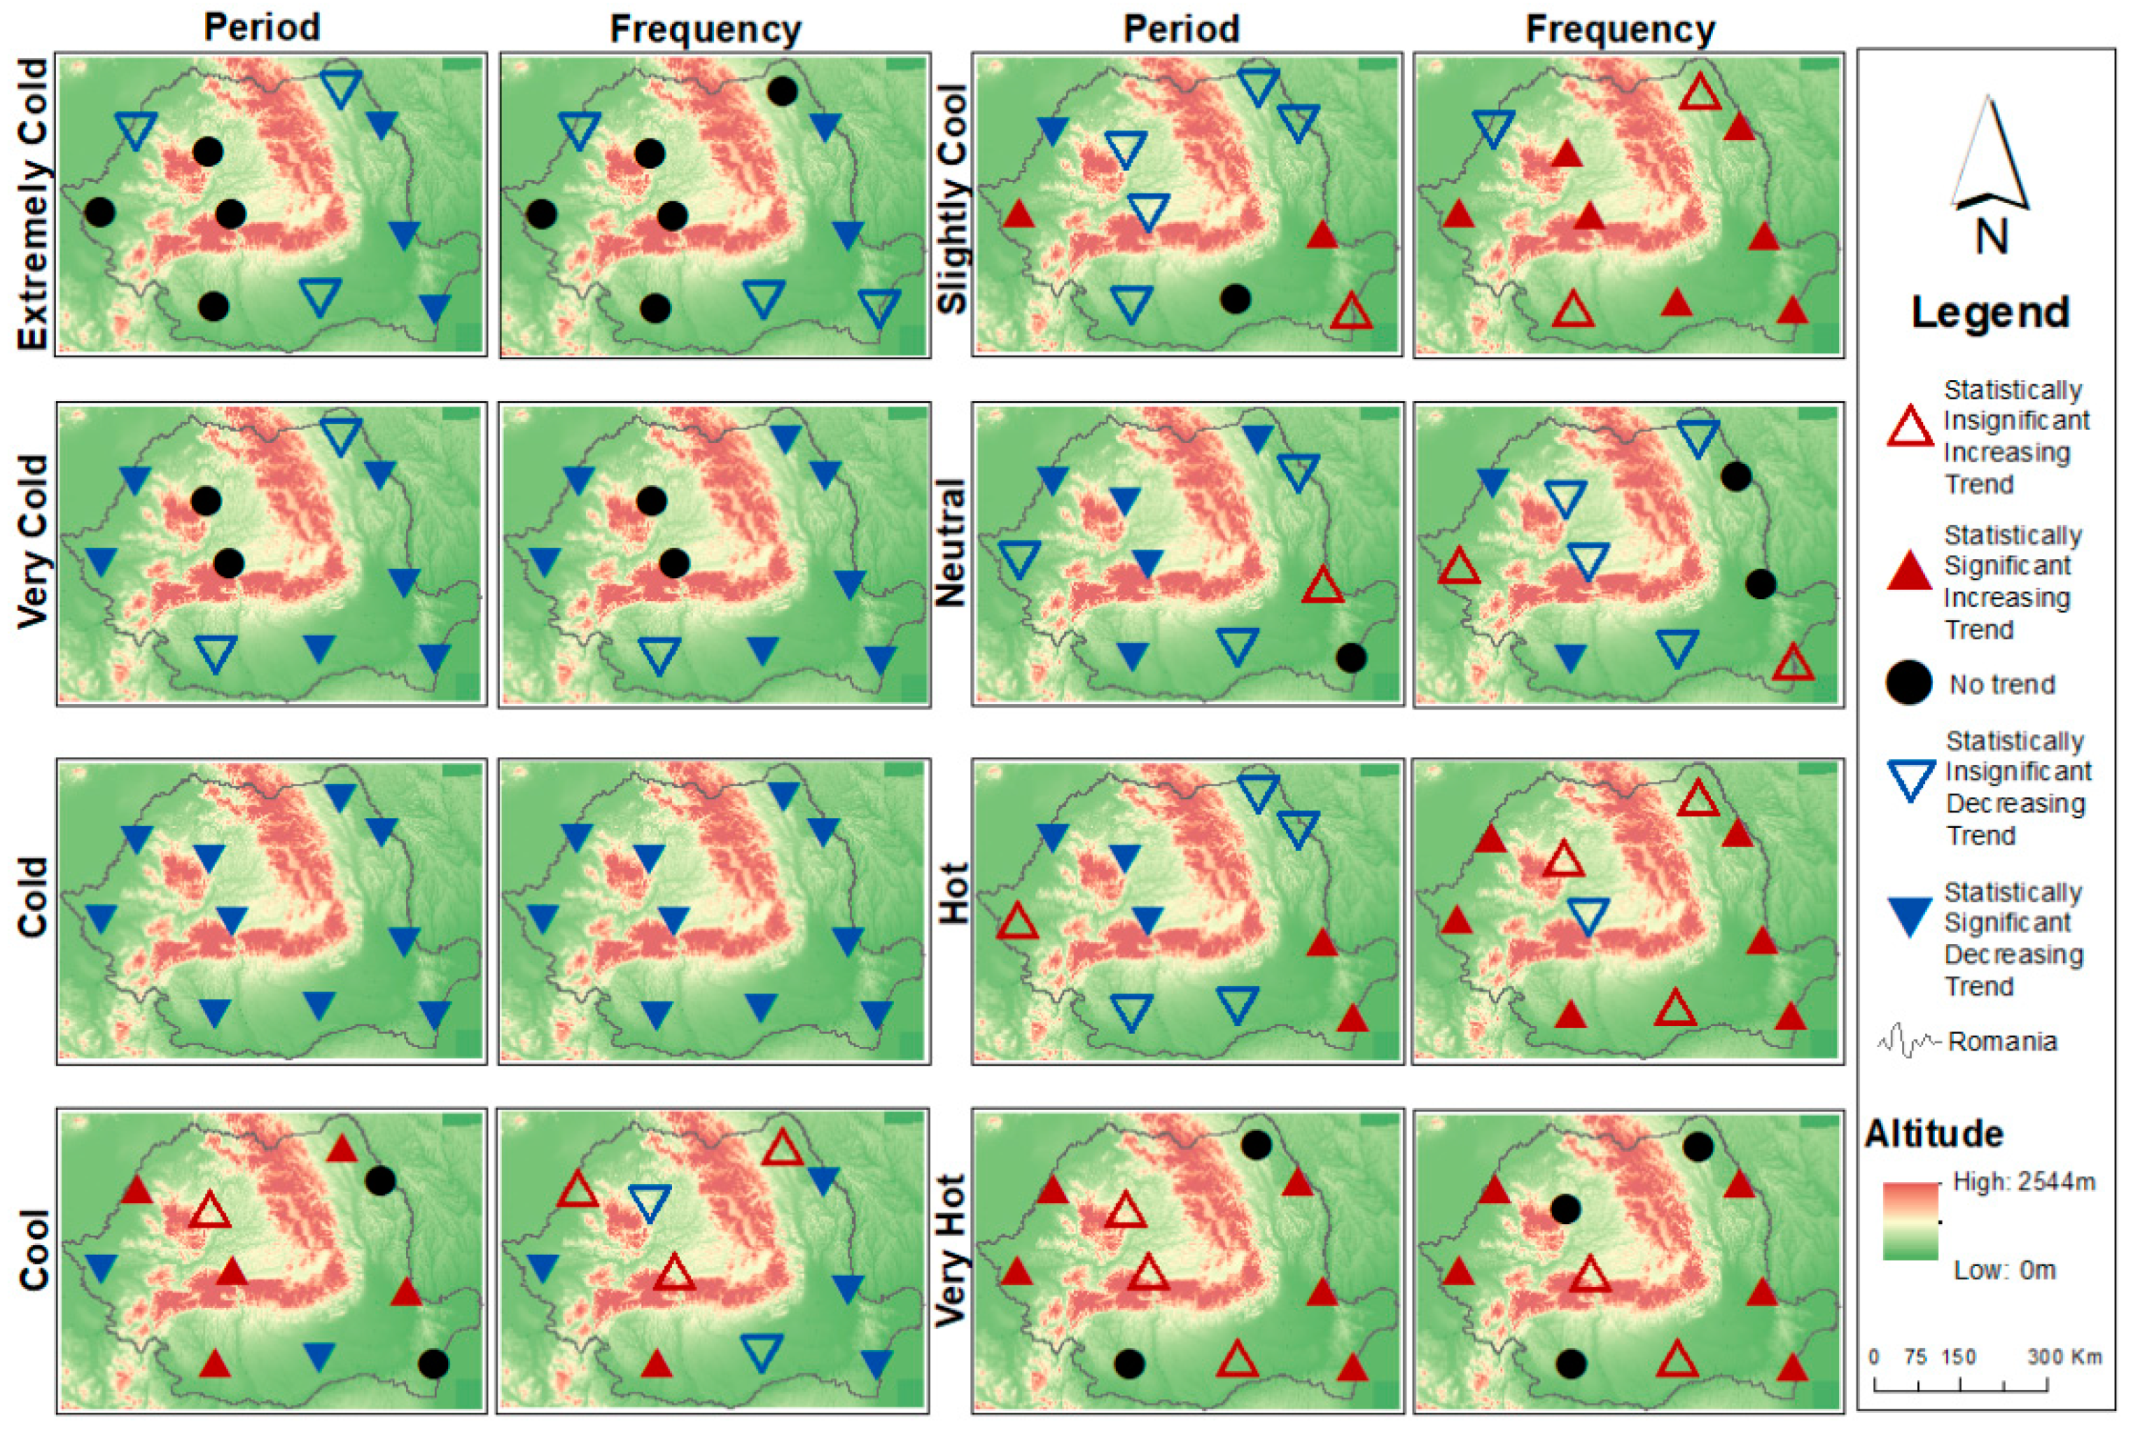
The trend type for which FO had the highest share was the significantly decreasing one, covering 31% of the data sets, followed by the significantly increasing one (24% of the data sets). The remaining series were equally distributed between not significant upward and downward trends and no trend (15% for each type) (Figure 9a).
Slightly cool, hot and very hot conditions significantly increased in regards to FO in most of the cities, (e.g., 7 out of 10 for slightly cool conditions) (Figure 10).
For the DOP series, decreasing trends were dominant (58% of the series). Among them, 37% were detected to be statistically significant (Figure 9c) and they characterized especially the cold stress classes, from extremely cold to neutral (Figure 9b). The increasing trends were detected for classes from cool to very hot conditions, for both parameters. The cold sensation class was characterized by significant decrease for all the locations considered (Figure 9b,d).
The DOP indicated negative slopes, equally significant and insignificant for the extremely cold class. The significant decrease was specific to eastern and southeastern Romania. Additionally, no trend characterized four cities, located mainly in the southwestern part of Romania, but this might be attributed to the lack of data (due to extremely low values, the trend could not be calculated) (Figure 10).

3.4. UTCI Index

3.4.1. FO and DOP Spatial Distribution

For this index, no extreme heat stress days were identified over the entire period considered, in the analyzed cities of Romania. Only four very strong heat stress days were registered at one single location, and thus, due to the extremely low frequency, the two classes (extreme heat stress and very strong heat stress) were not considered for further analysis.
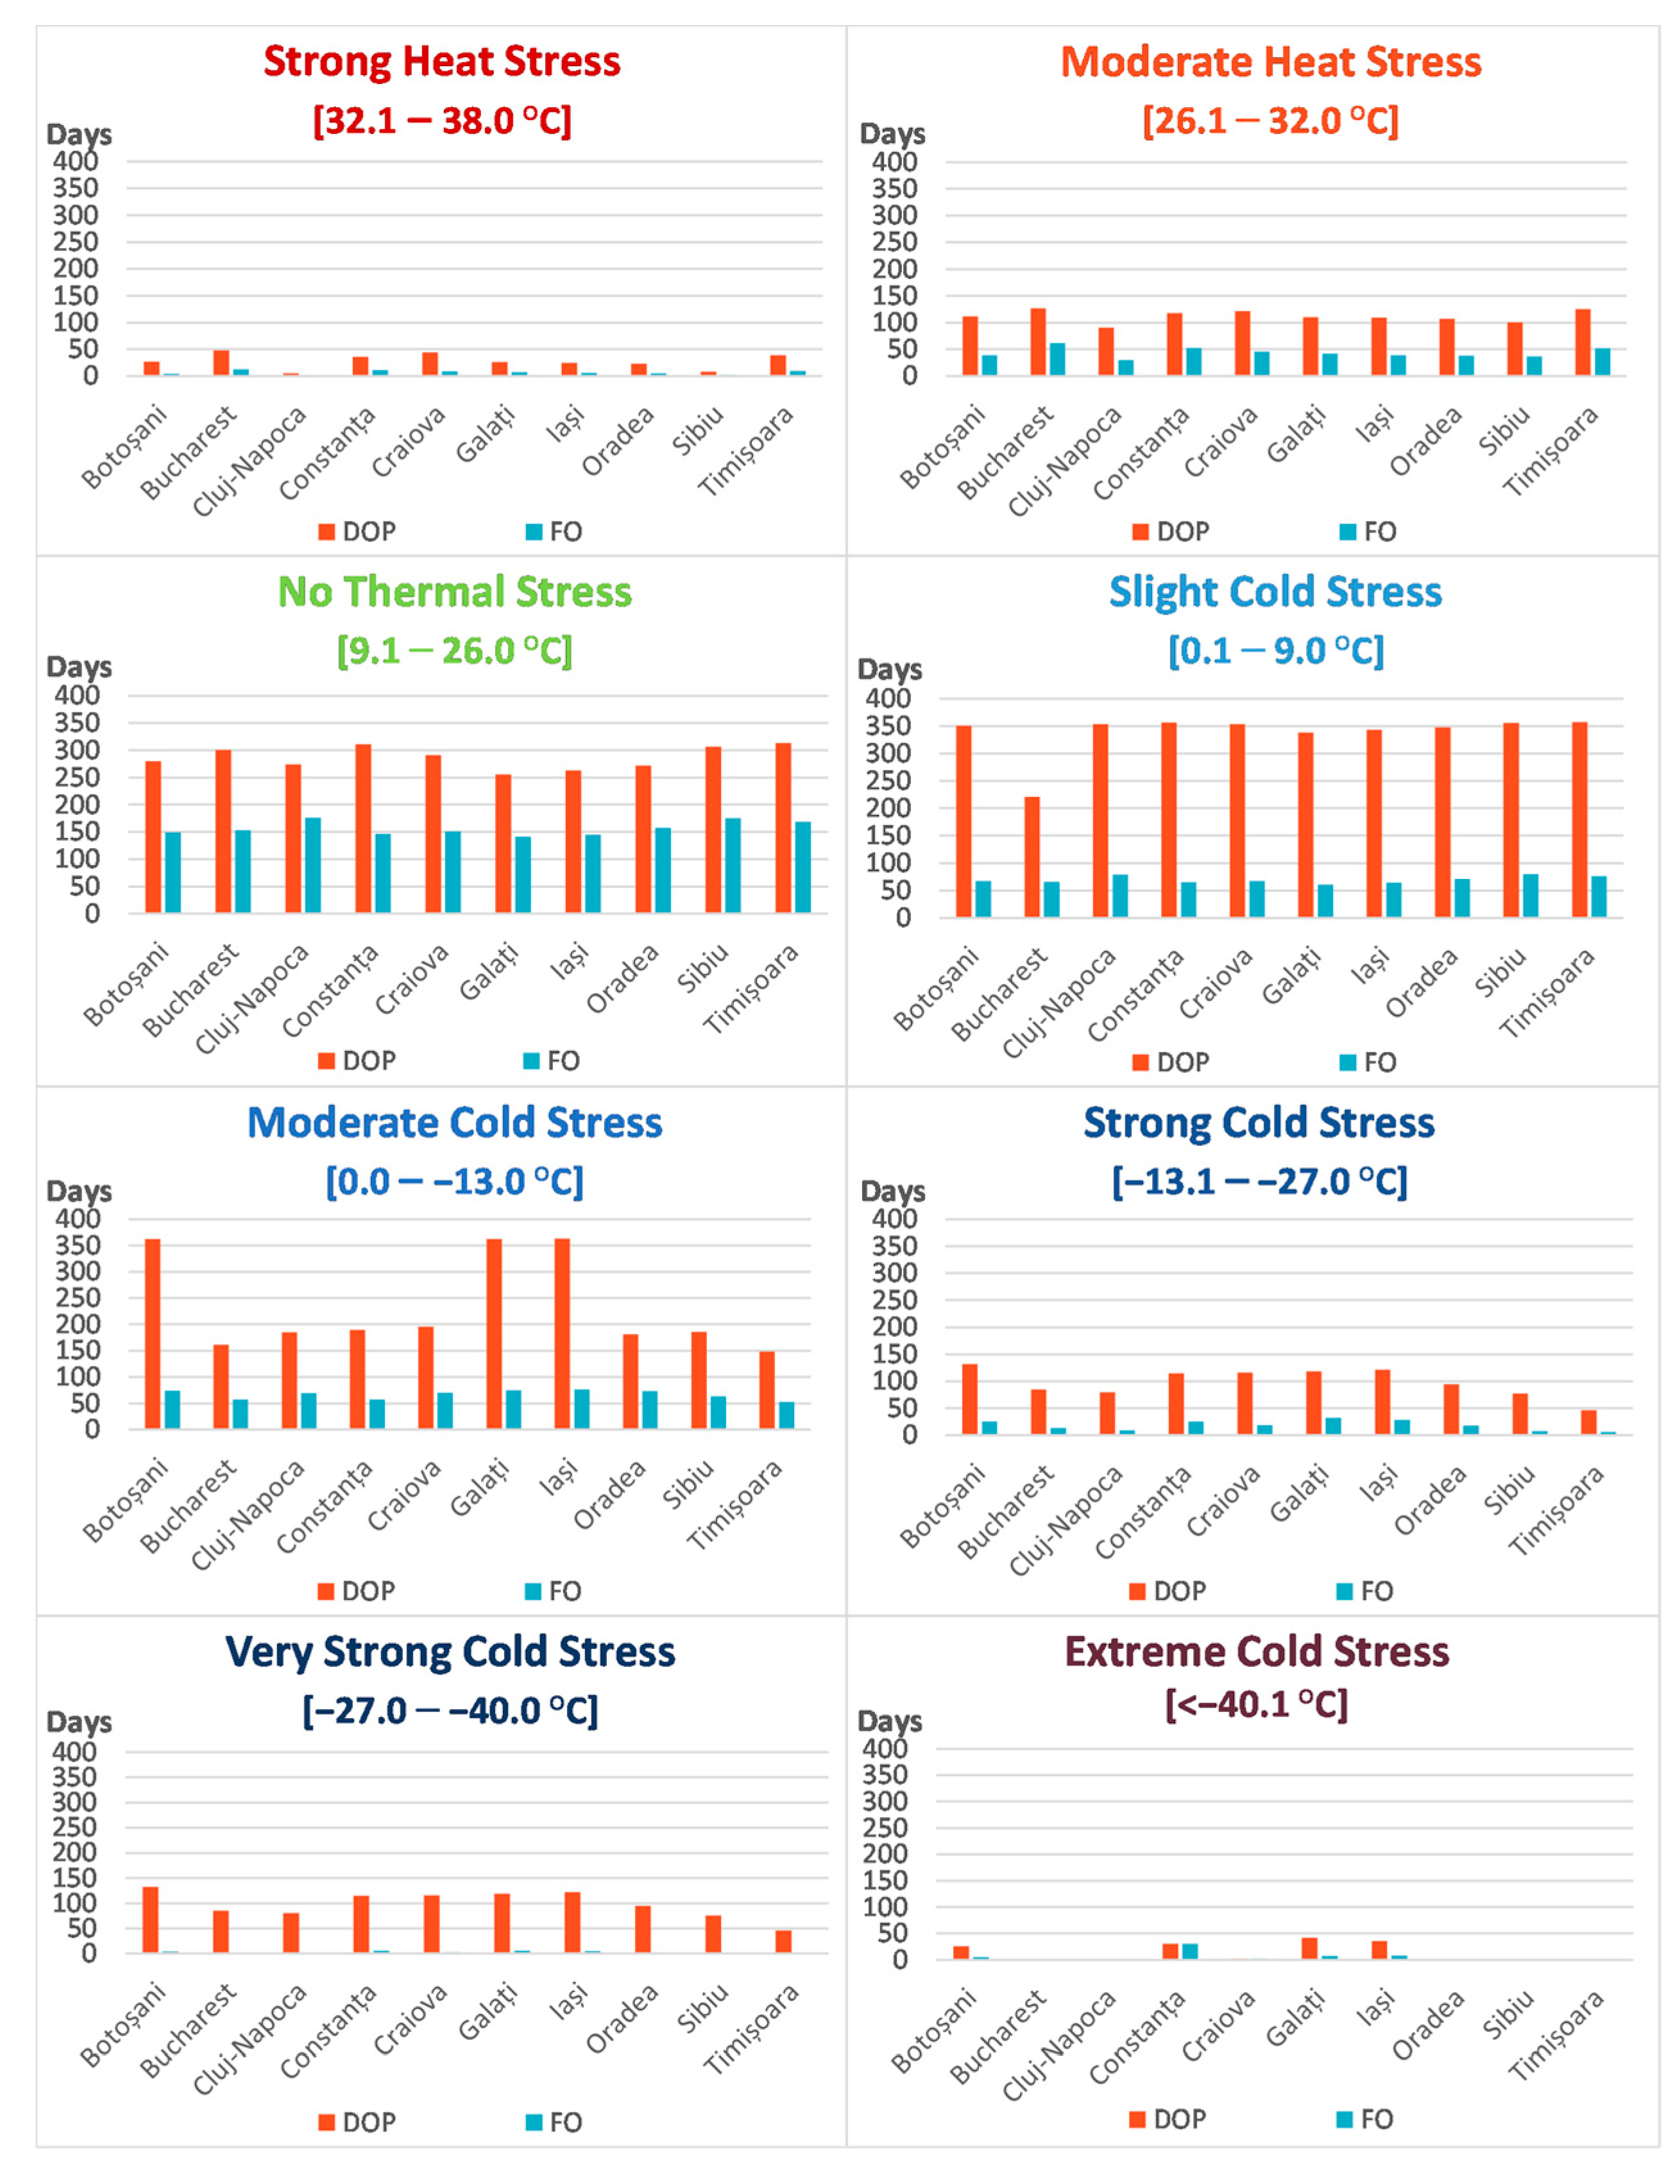
According to the UTCI, in terms of FO, most days were characterized by no thermal stress (140–180 days/year). The slight cold stress days ranged from 60 days/year, at Galați, to 80 days/year, at Sibiu; the number of moderate cold stress days varied between 50 days/year, at Timișoara, and 80 days/year, at Iași, and the moderate heat stress characterized, as average values, 30–60 days/year. The remaining classes covered less than 50 days/year for all the locations (Figure 11).
The DOP reached the maximum length for slight cold stress at all the weather stations, except for Bucharest, reaching up to almost 350 days/year, followed by the no thermal stress class. Moderate cold stress was only recorded over 350 days/year at three stations: Botoșani, Galați and Iași. It was present elsewhere for less than 200 days/year. The interval when strong and very strong cold stress days can occur did not exceed 150 days at any station. The strong heat stress and extreme cold stress conditions were found to last no more than 50 days/year; however, extreme cold stress occurred at four weather stations over the entire period analyzed (Figure 11).

3.4.2. Changes Detected in the UTCI Index Parameters

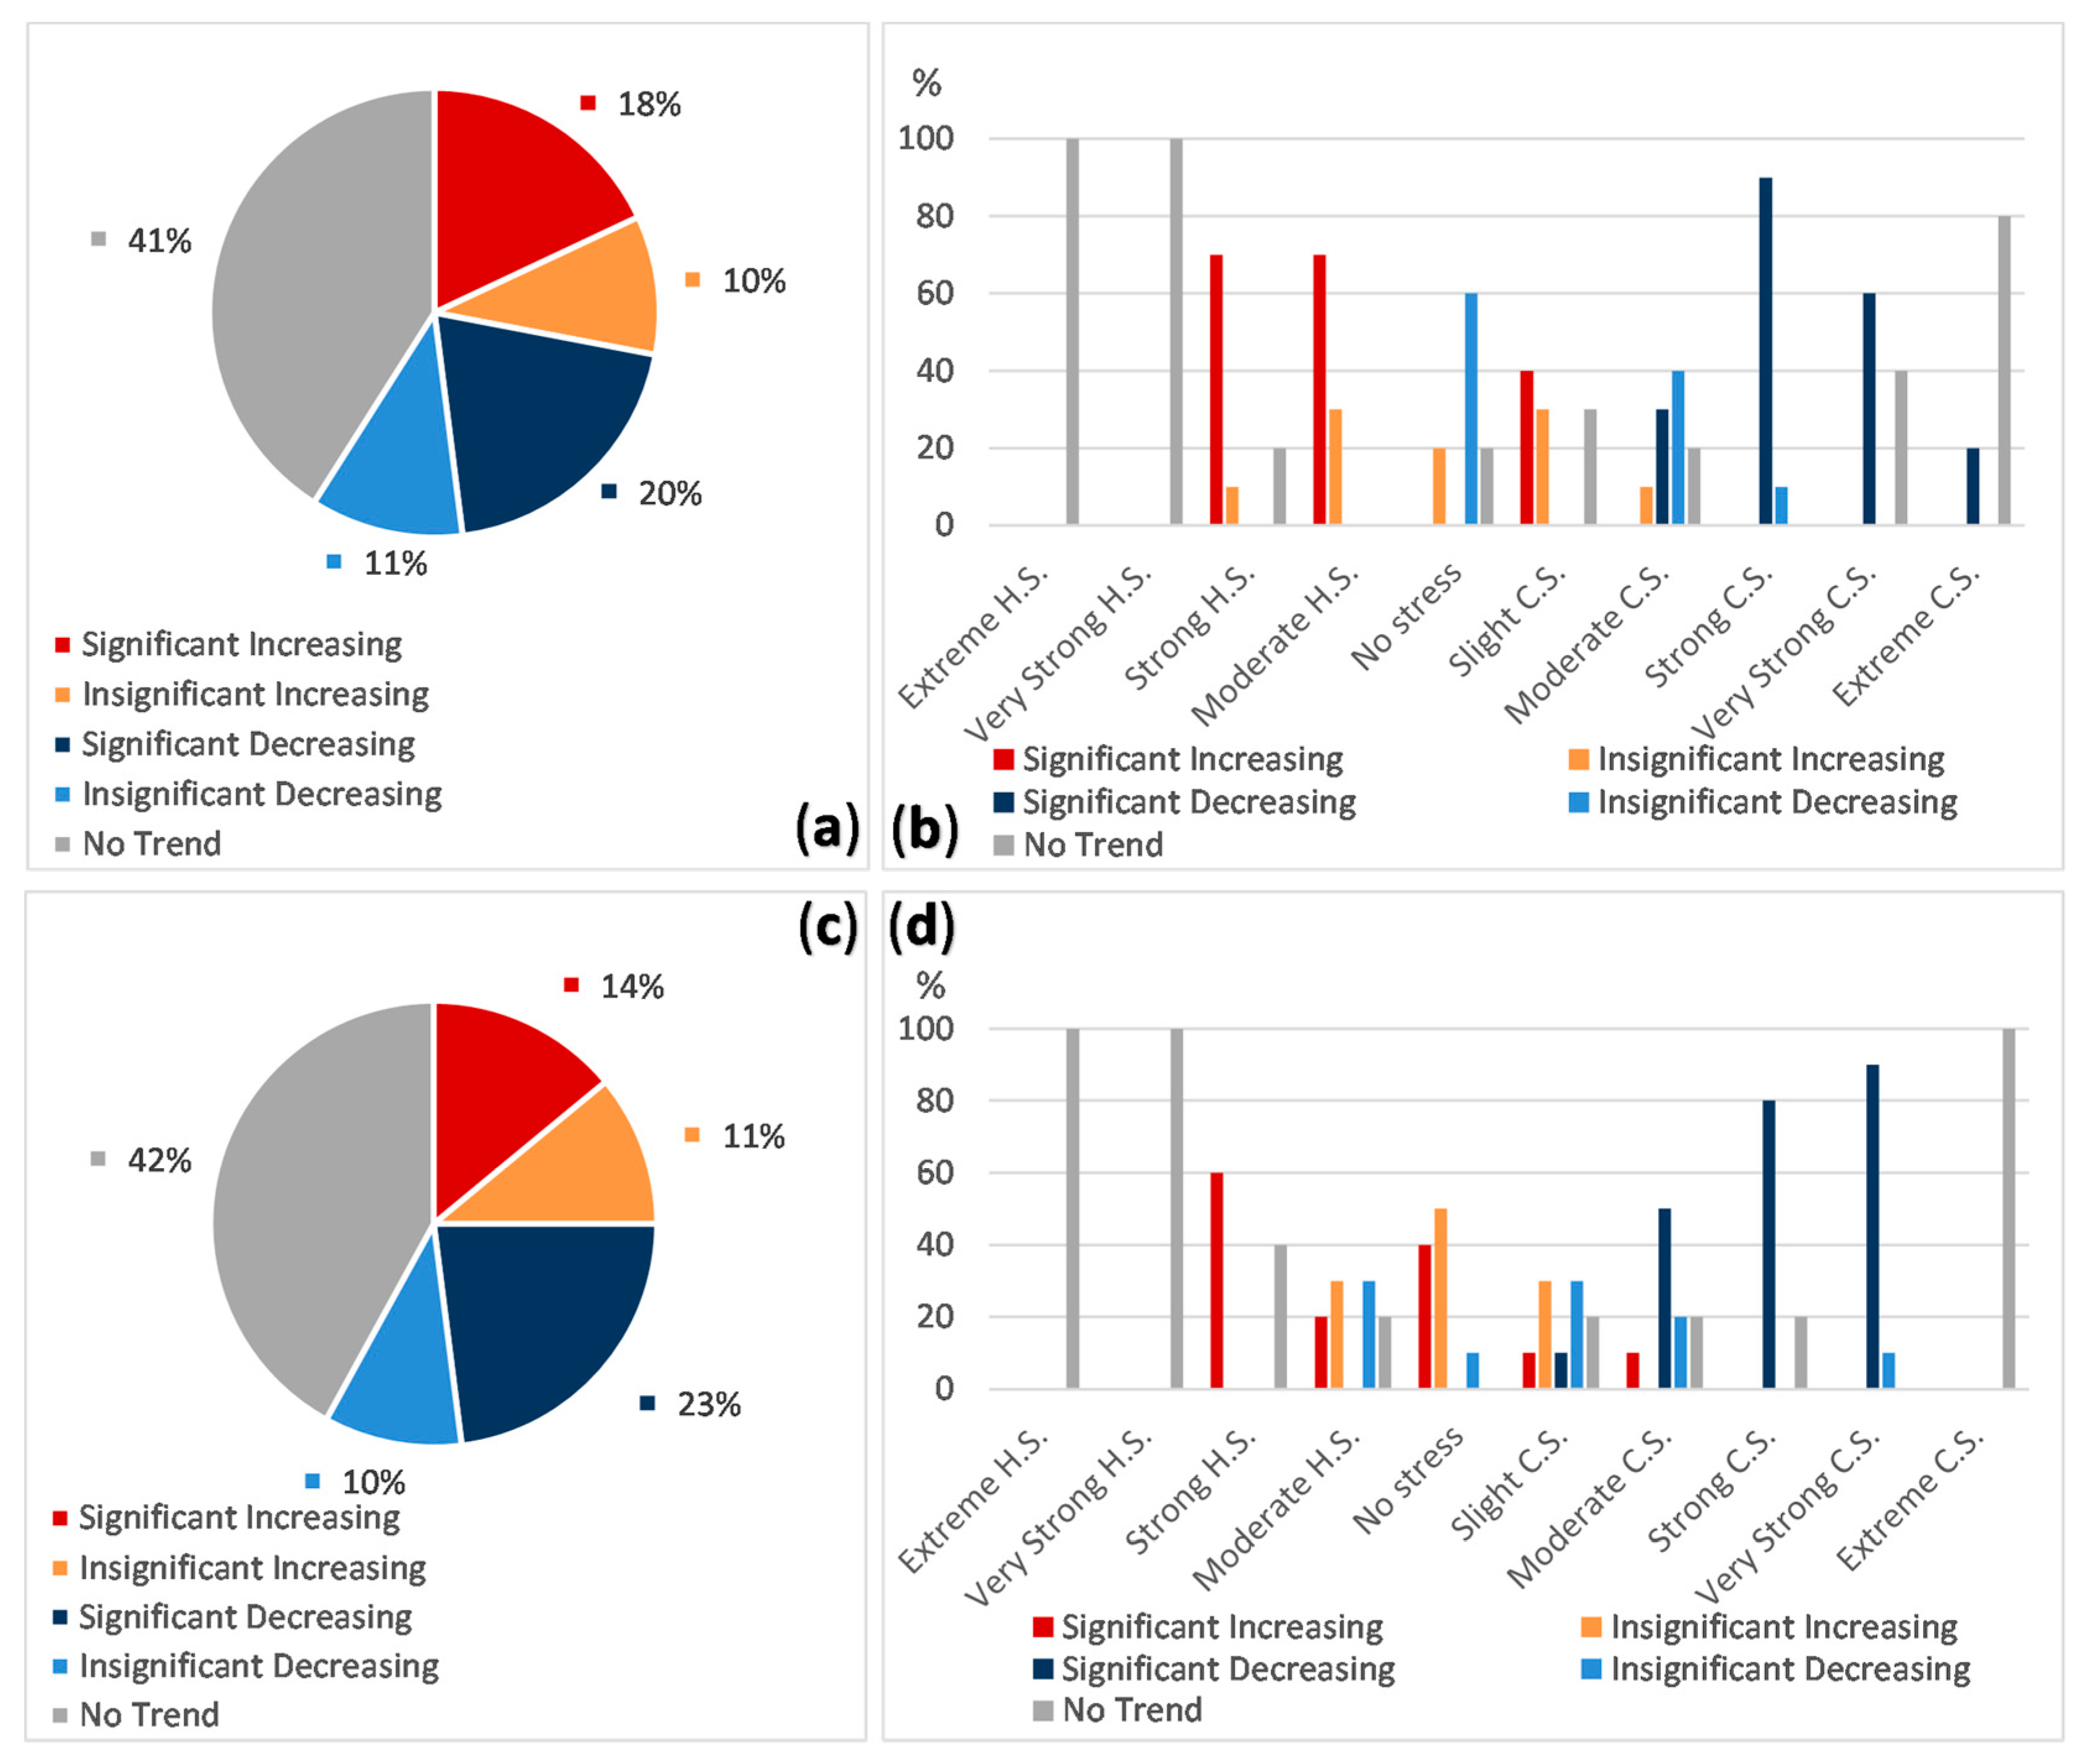
For both FO and DOP of the UTCI index, mainly no change was detected in 41% of the FO series (Figure 12a) and 42% of the DOP series (Figure 12c). This could be explained by the small number of days attributed to extreme thermal (hot or cold) discomfort conditions. Significant changes were found in 38% of data sets considered for FO, respectively, and in 37% of the DOP. The increasing trends were dominant for the heat stress classes (mainly for strong and moderate heat stress), whereas decreasing trends became dominant for the cold stress conditions, especially in the case of strong and very strong cold classes (Figure 12b,d). The DOP also indicated significant increasing trends for the heat stress classes, as well as for slight and moderate cold stress ones. For the no thermal stress class, the statistically not significant increase indicated a higher rate than the significant one.
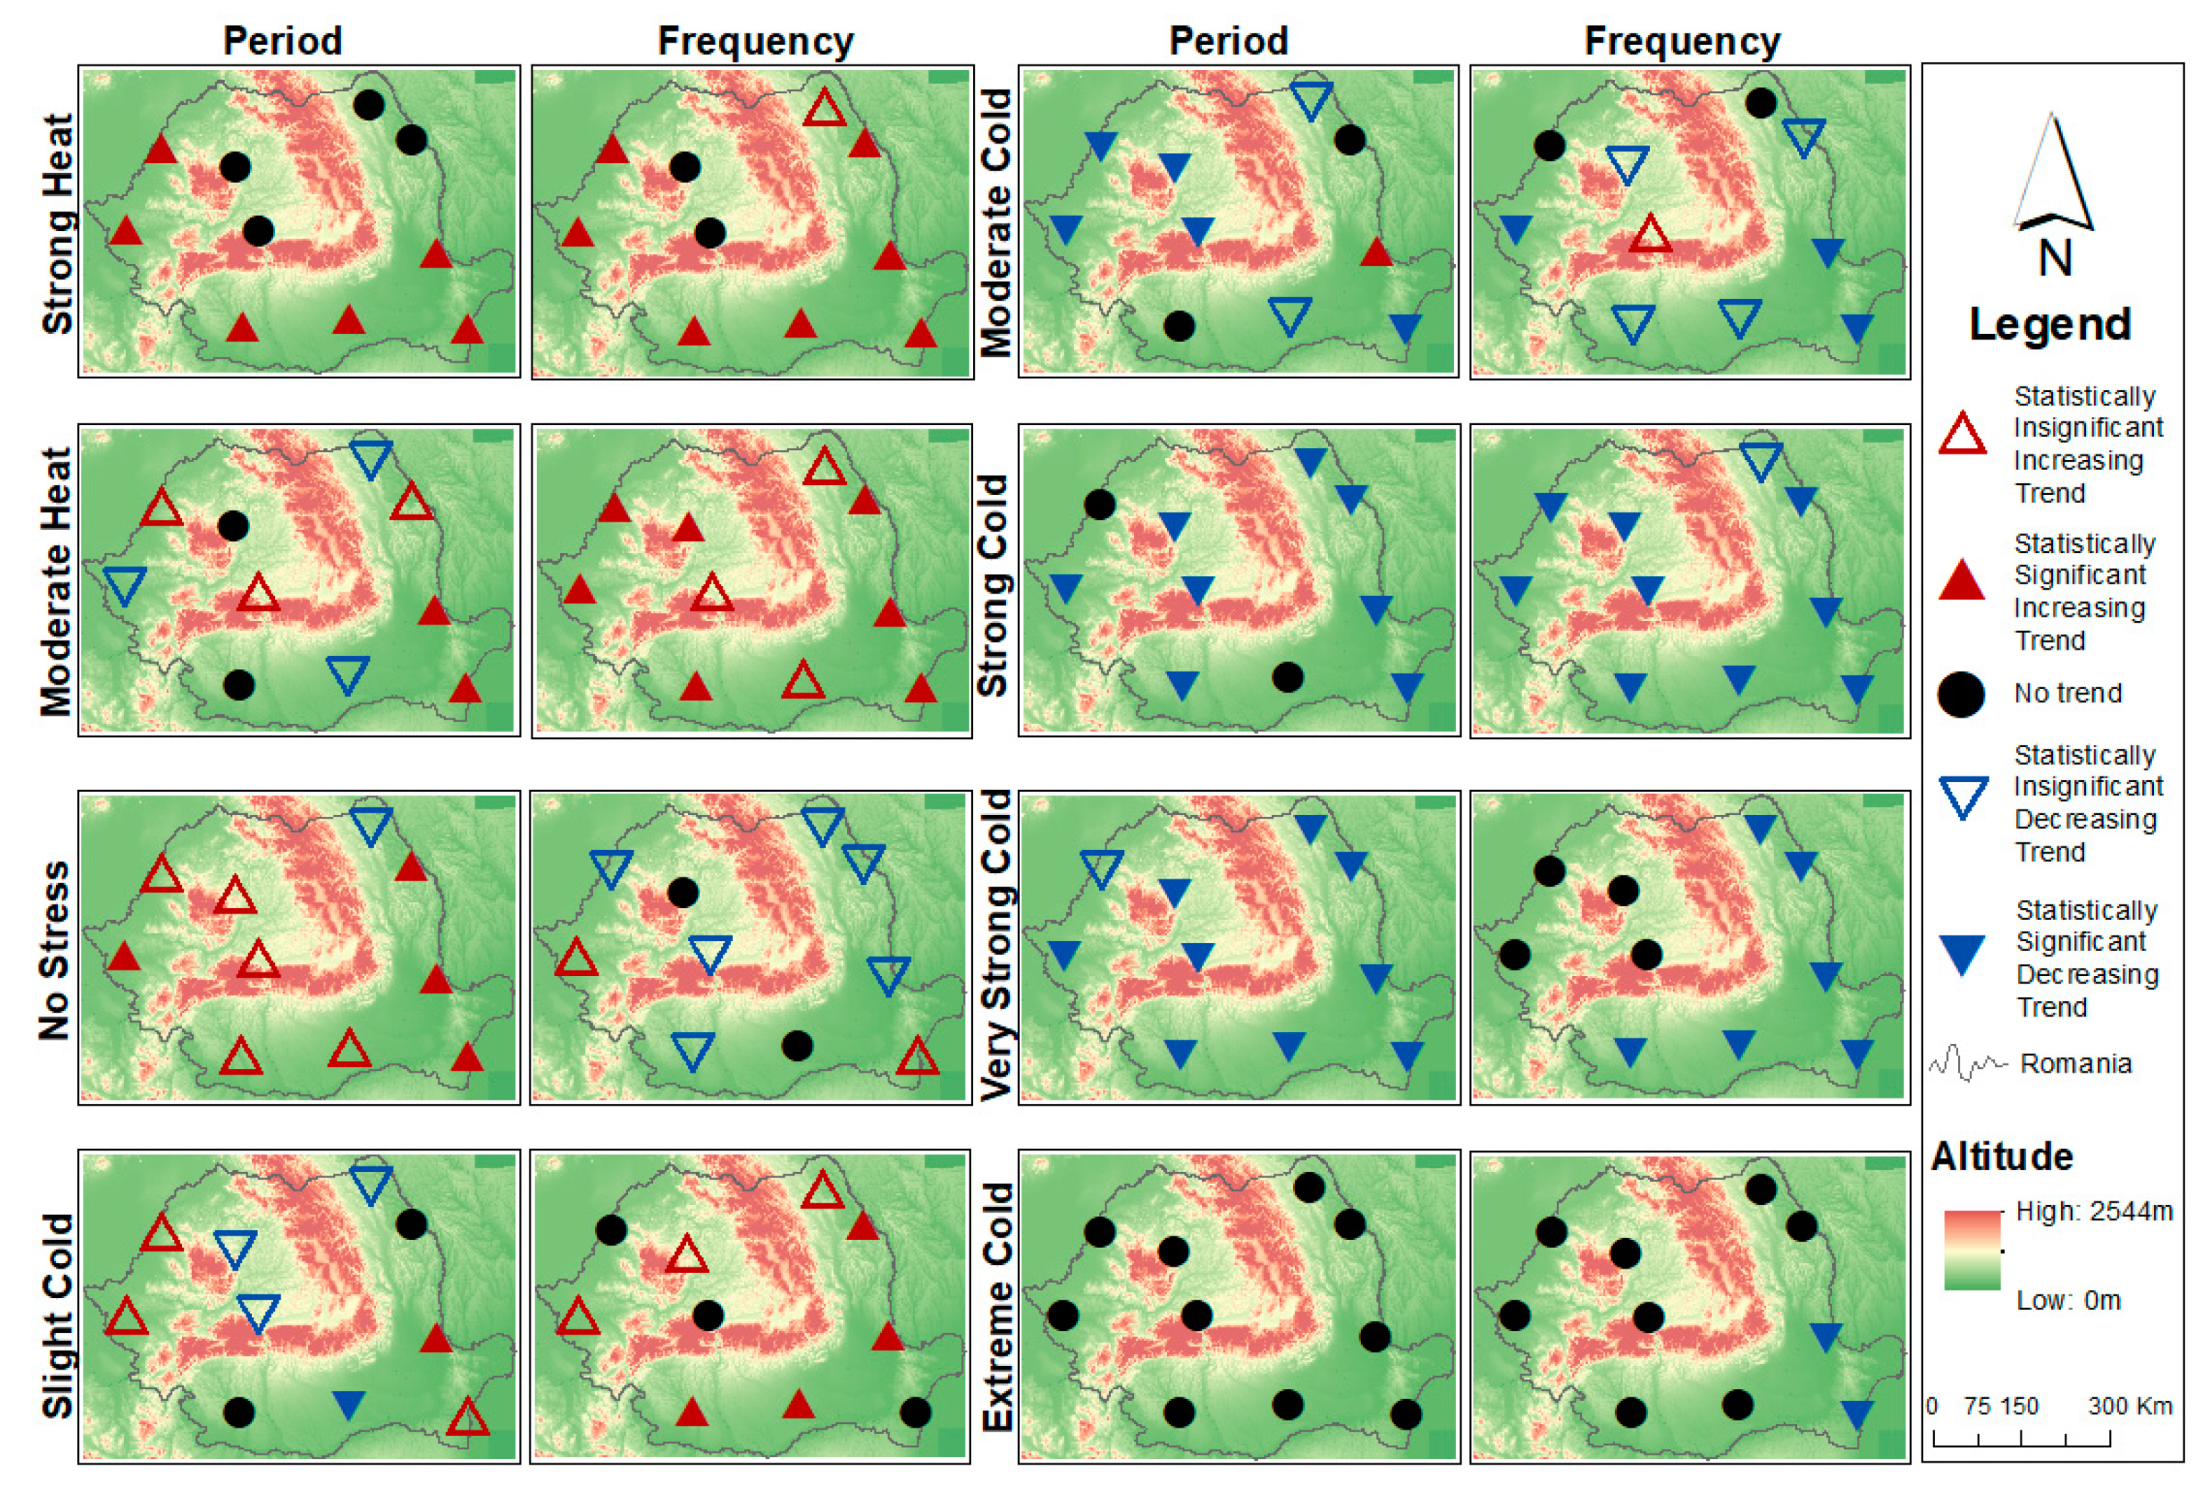
As a spatial distribution, the DOP seemed to increase significantly for the strong heat stress in the western and southern regions of the country; for the other regions, no change was detected. Moreover, the no thermal stress class was found to have mainly a positive trend all over the country, except for the northern-most city (Botoșani), for which an insignificant decrease was detected. The upward trends were significant in the extreme western and eastern cities. Statistically significant negative slopes were specific to most cities for the duration of the periods characterized by strong and very strong cold stress. Only two cities experienced no trends (Oradea and Bucharest) for the strong cold stress class, and just a single one (Oradea) had a decreasing downward trend for the very strong cold stress class (Figure 13).
A statistically significant increasing trend for FO in the case of strong and moderate heat stress classes, as well as for the slight cold stress class was detected for the great majority of the locations considered. The significant decreasing trends were specific for the strong, very strong, and extreme cold stress classes (Figure 13).
A great number of locations with stationary trends detected in the extreme cold stress class, for both FO and DOP (Figure 13), may be explained by the very low number of days characterized by the given conditions corresponding to both parameters.

3.5. THI Index

3.5.1. FO and DOP Spatial Distribution

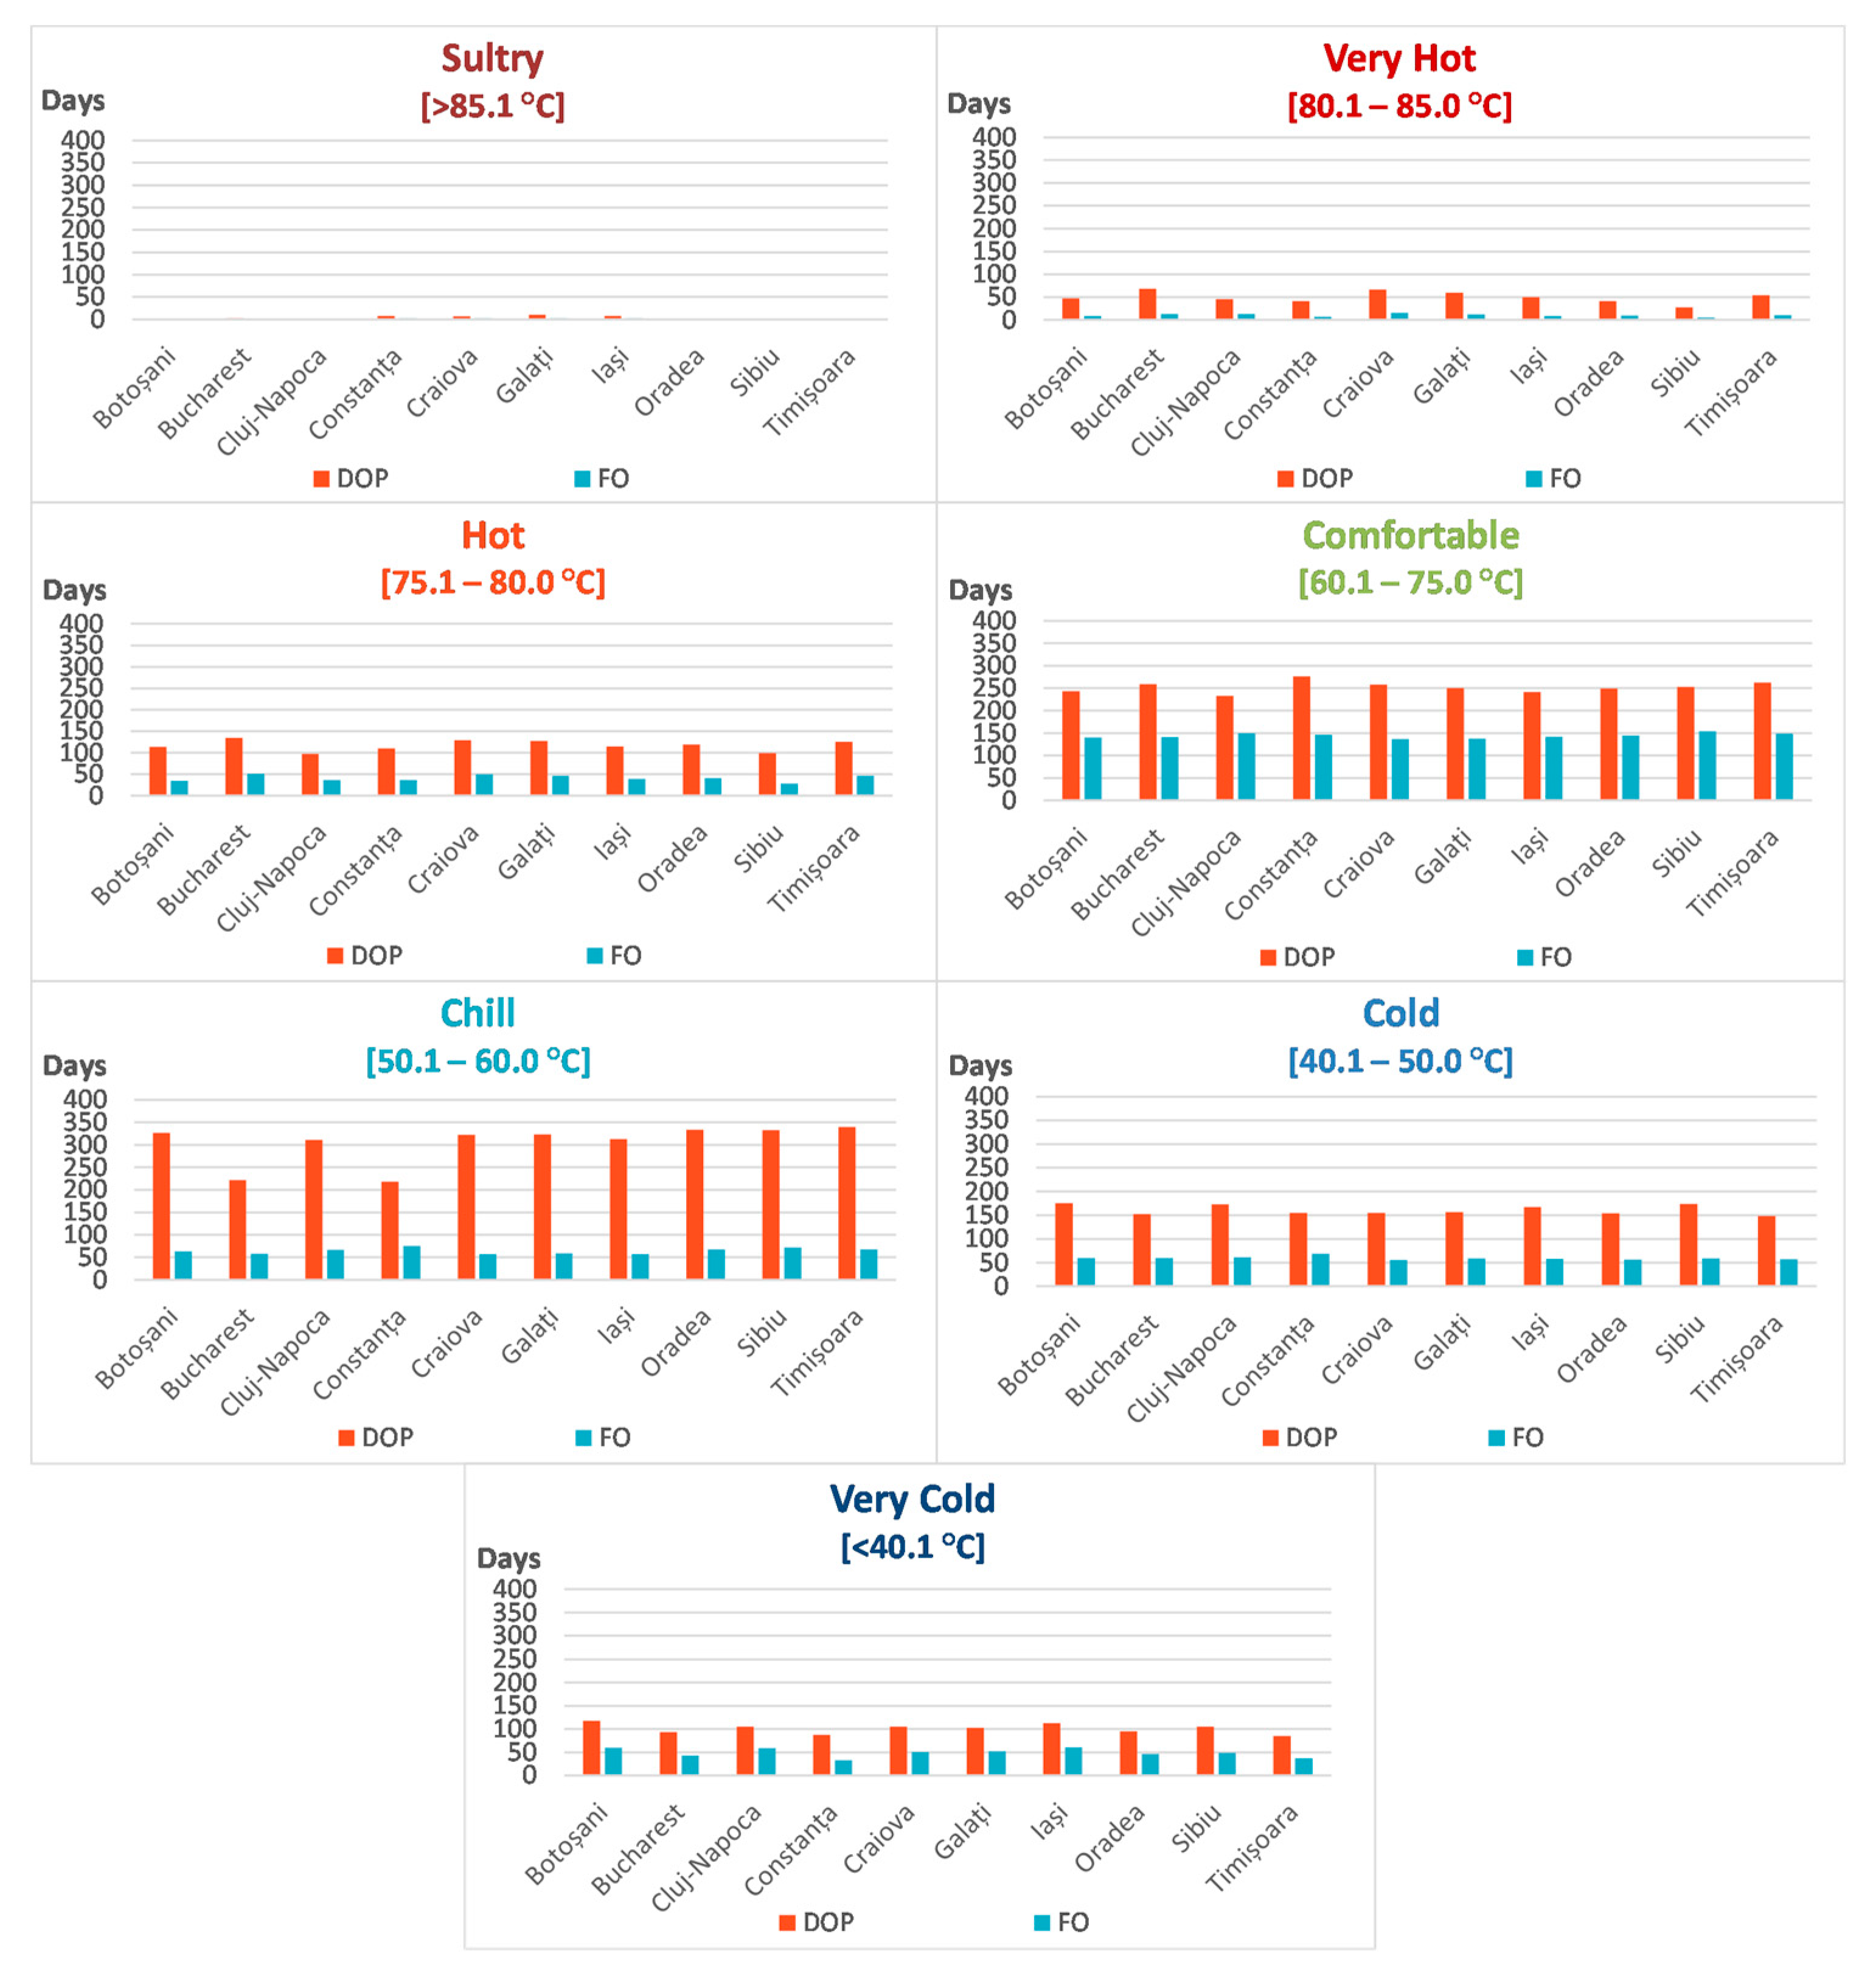
According to the THI classification, the most days of the year belong to comfortable sensation class, their average number varying between 140 days, at Craiova, and 150 days, at Sibiu. Chill and cold sensation classes characterized, on average, approximately the same number of days, but they varied with the location from 50 to 70 days/year. Very cold days covered between 30 (Constanța) and 60 days/year (Botoșani, Cluj-Napoca and Iași). The most numerous hot days reached their highest mean value of 50 days/year in Bucharest, and the lowest one, 25 days/year, in Sibiu. The mean multiannual number of very hot days did not exceed 20 days/year, on average, whereas their maximum values went up to 50 days/year. Sultry conditions occurred occasionally (less than 5 days/year) (Figure 14).
Thermal classes with the longest DOP are those characterized by chill and comfortable sensations, which cover more than 250 days/year, as well as the cold one, which mostly accounted for 150 days/year at each location. The frequency of the hot and cold classes can exceed 100 days/year, while the sultry days were quite rare in the region—they only occurred in four cities for less than 10 days/year.

3.5.2. Changes Detected in the THI Index Parameters

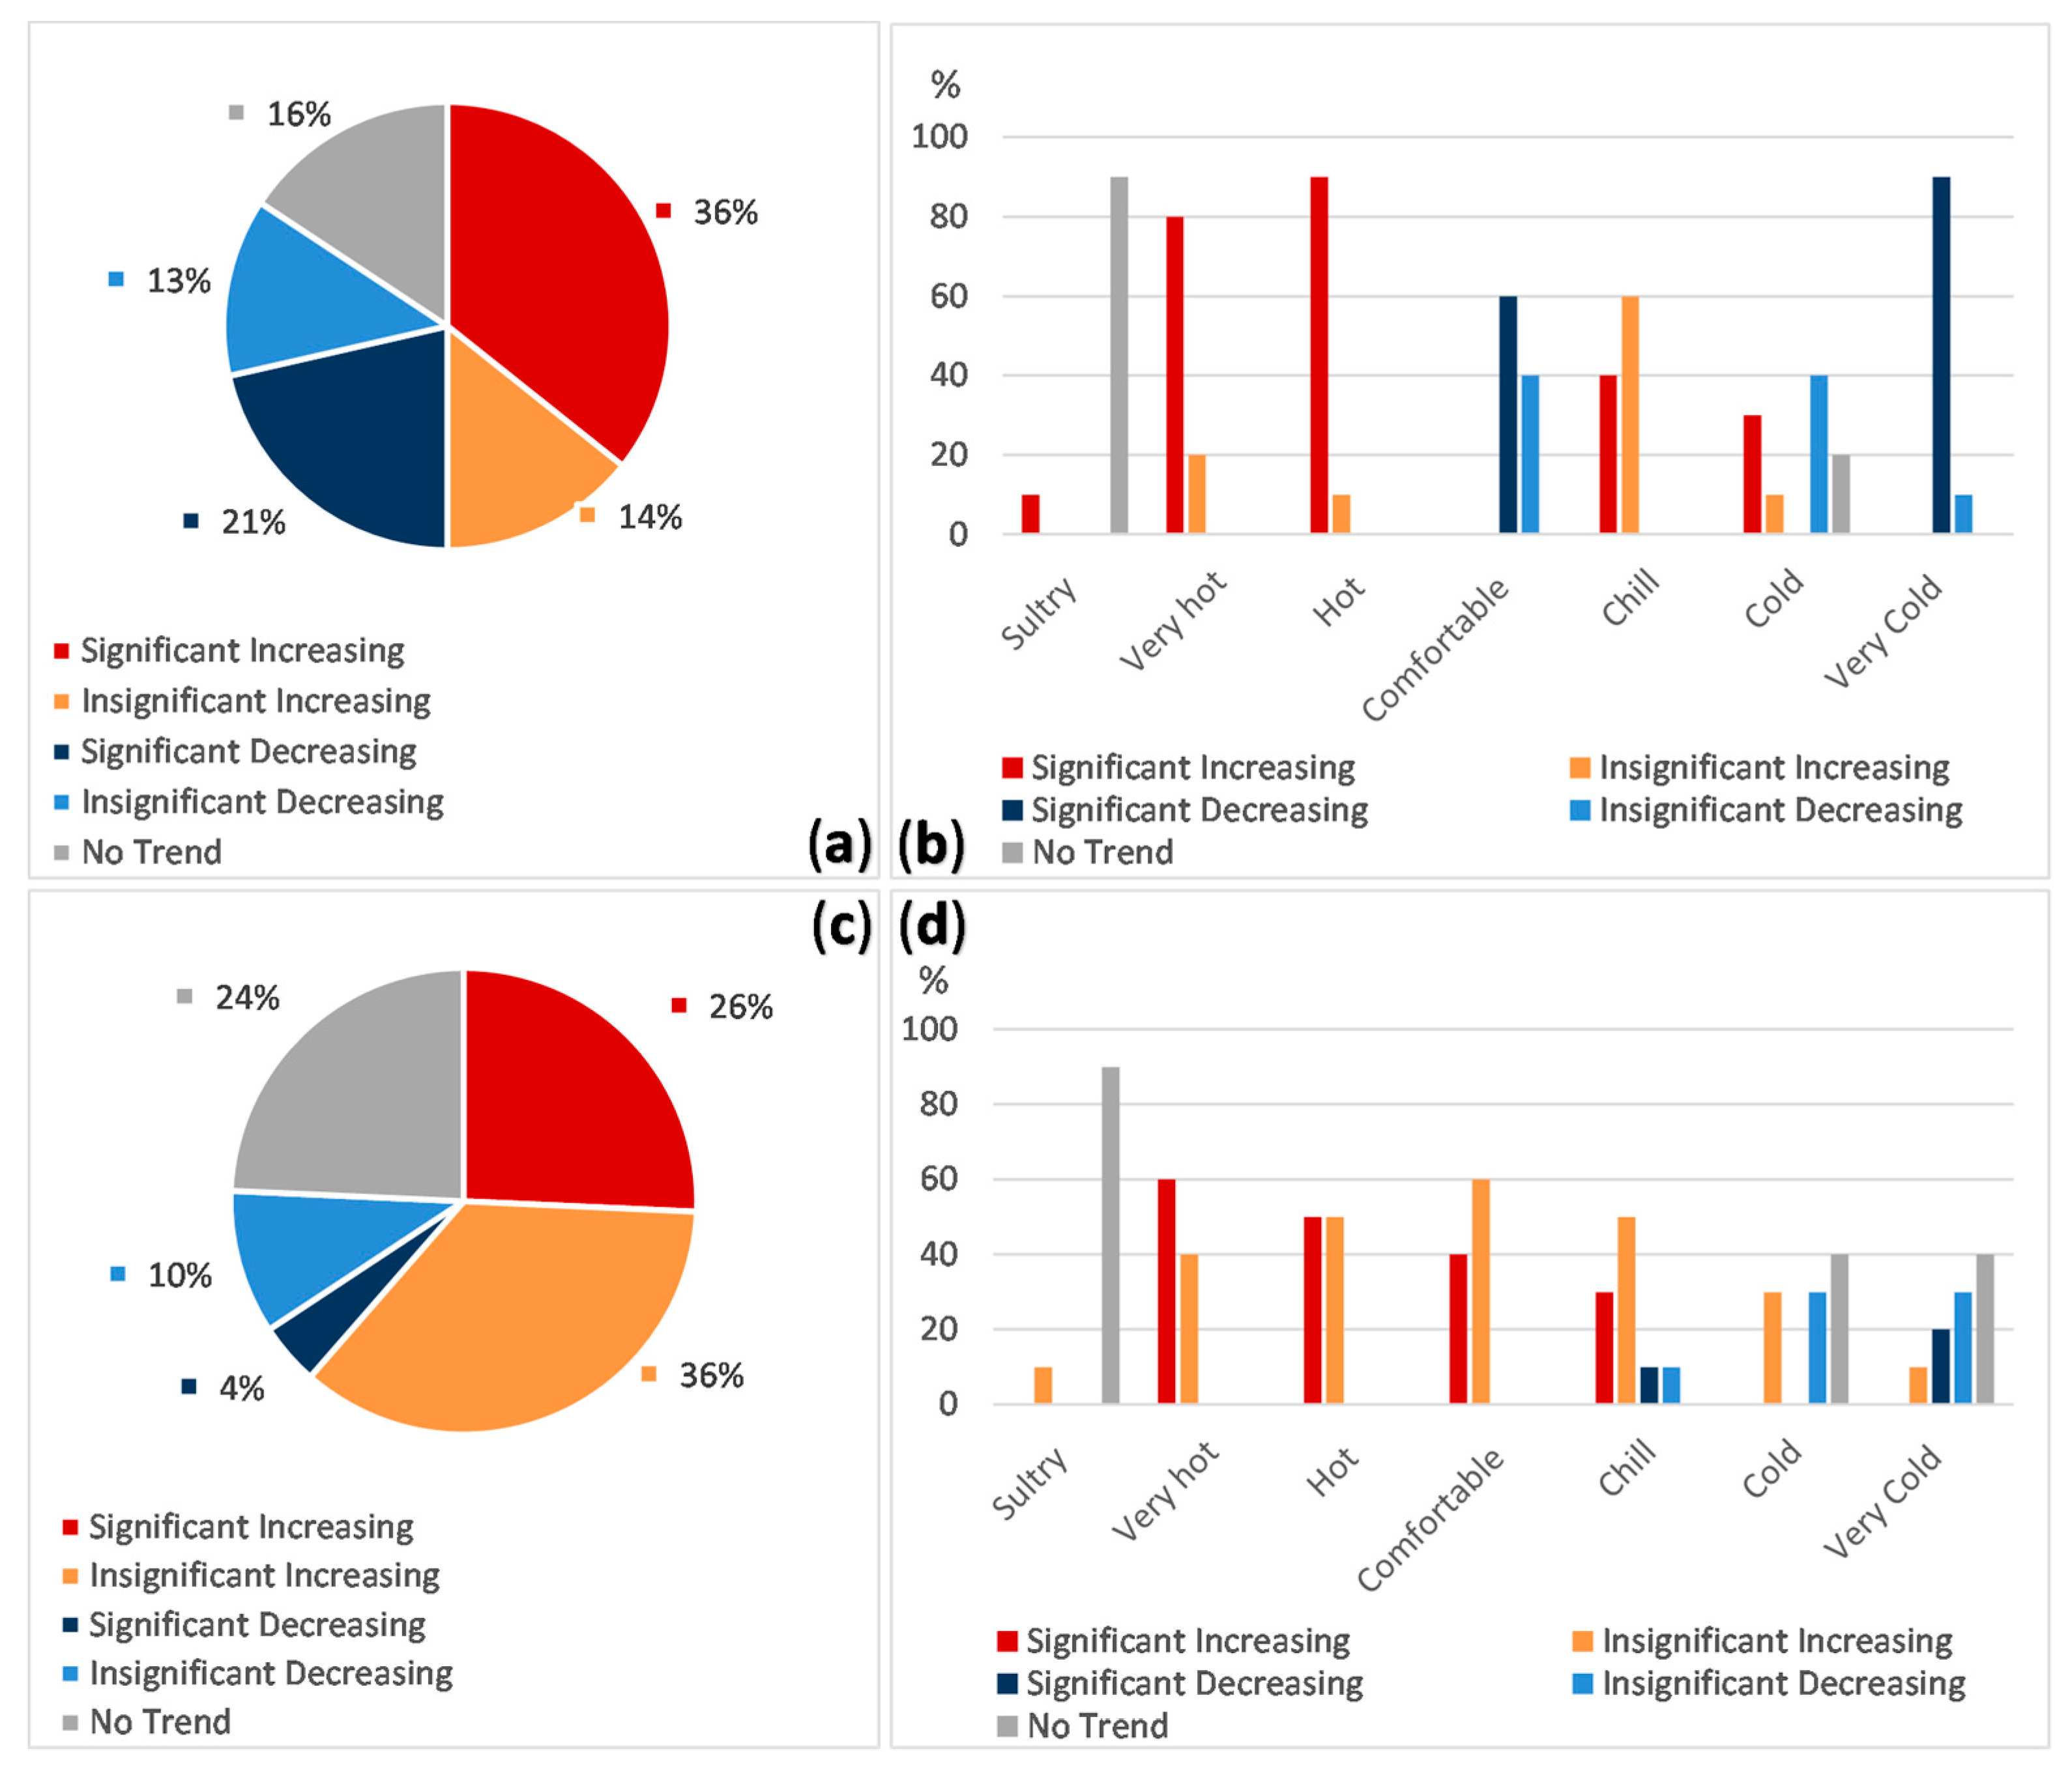
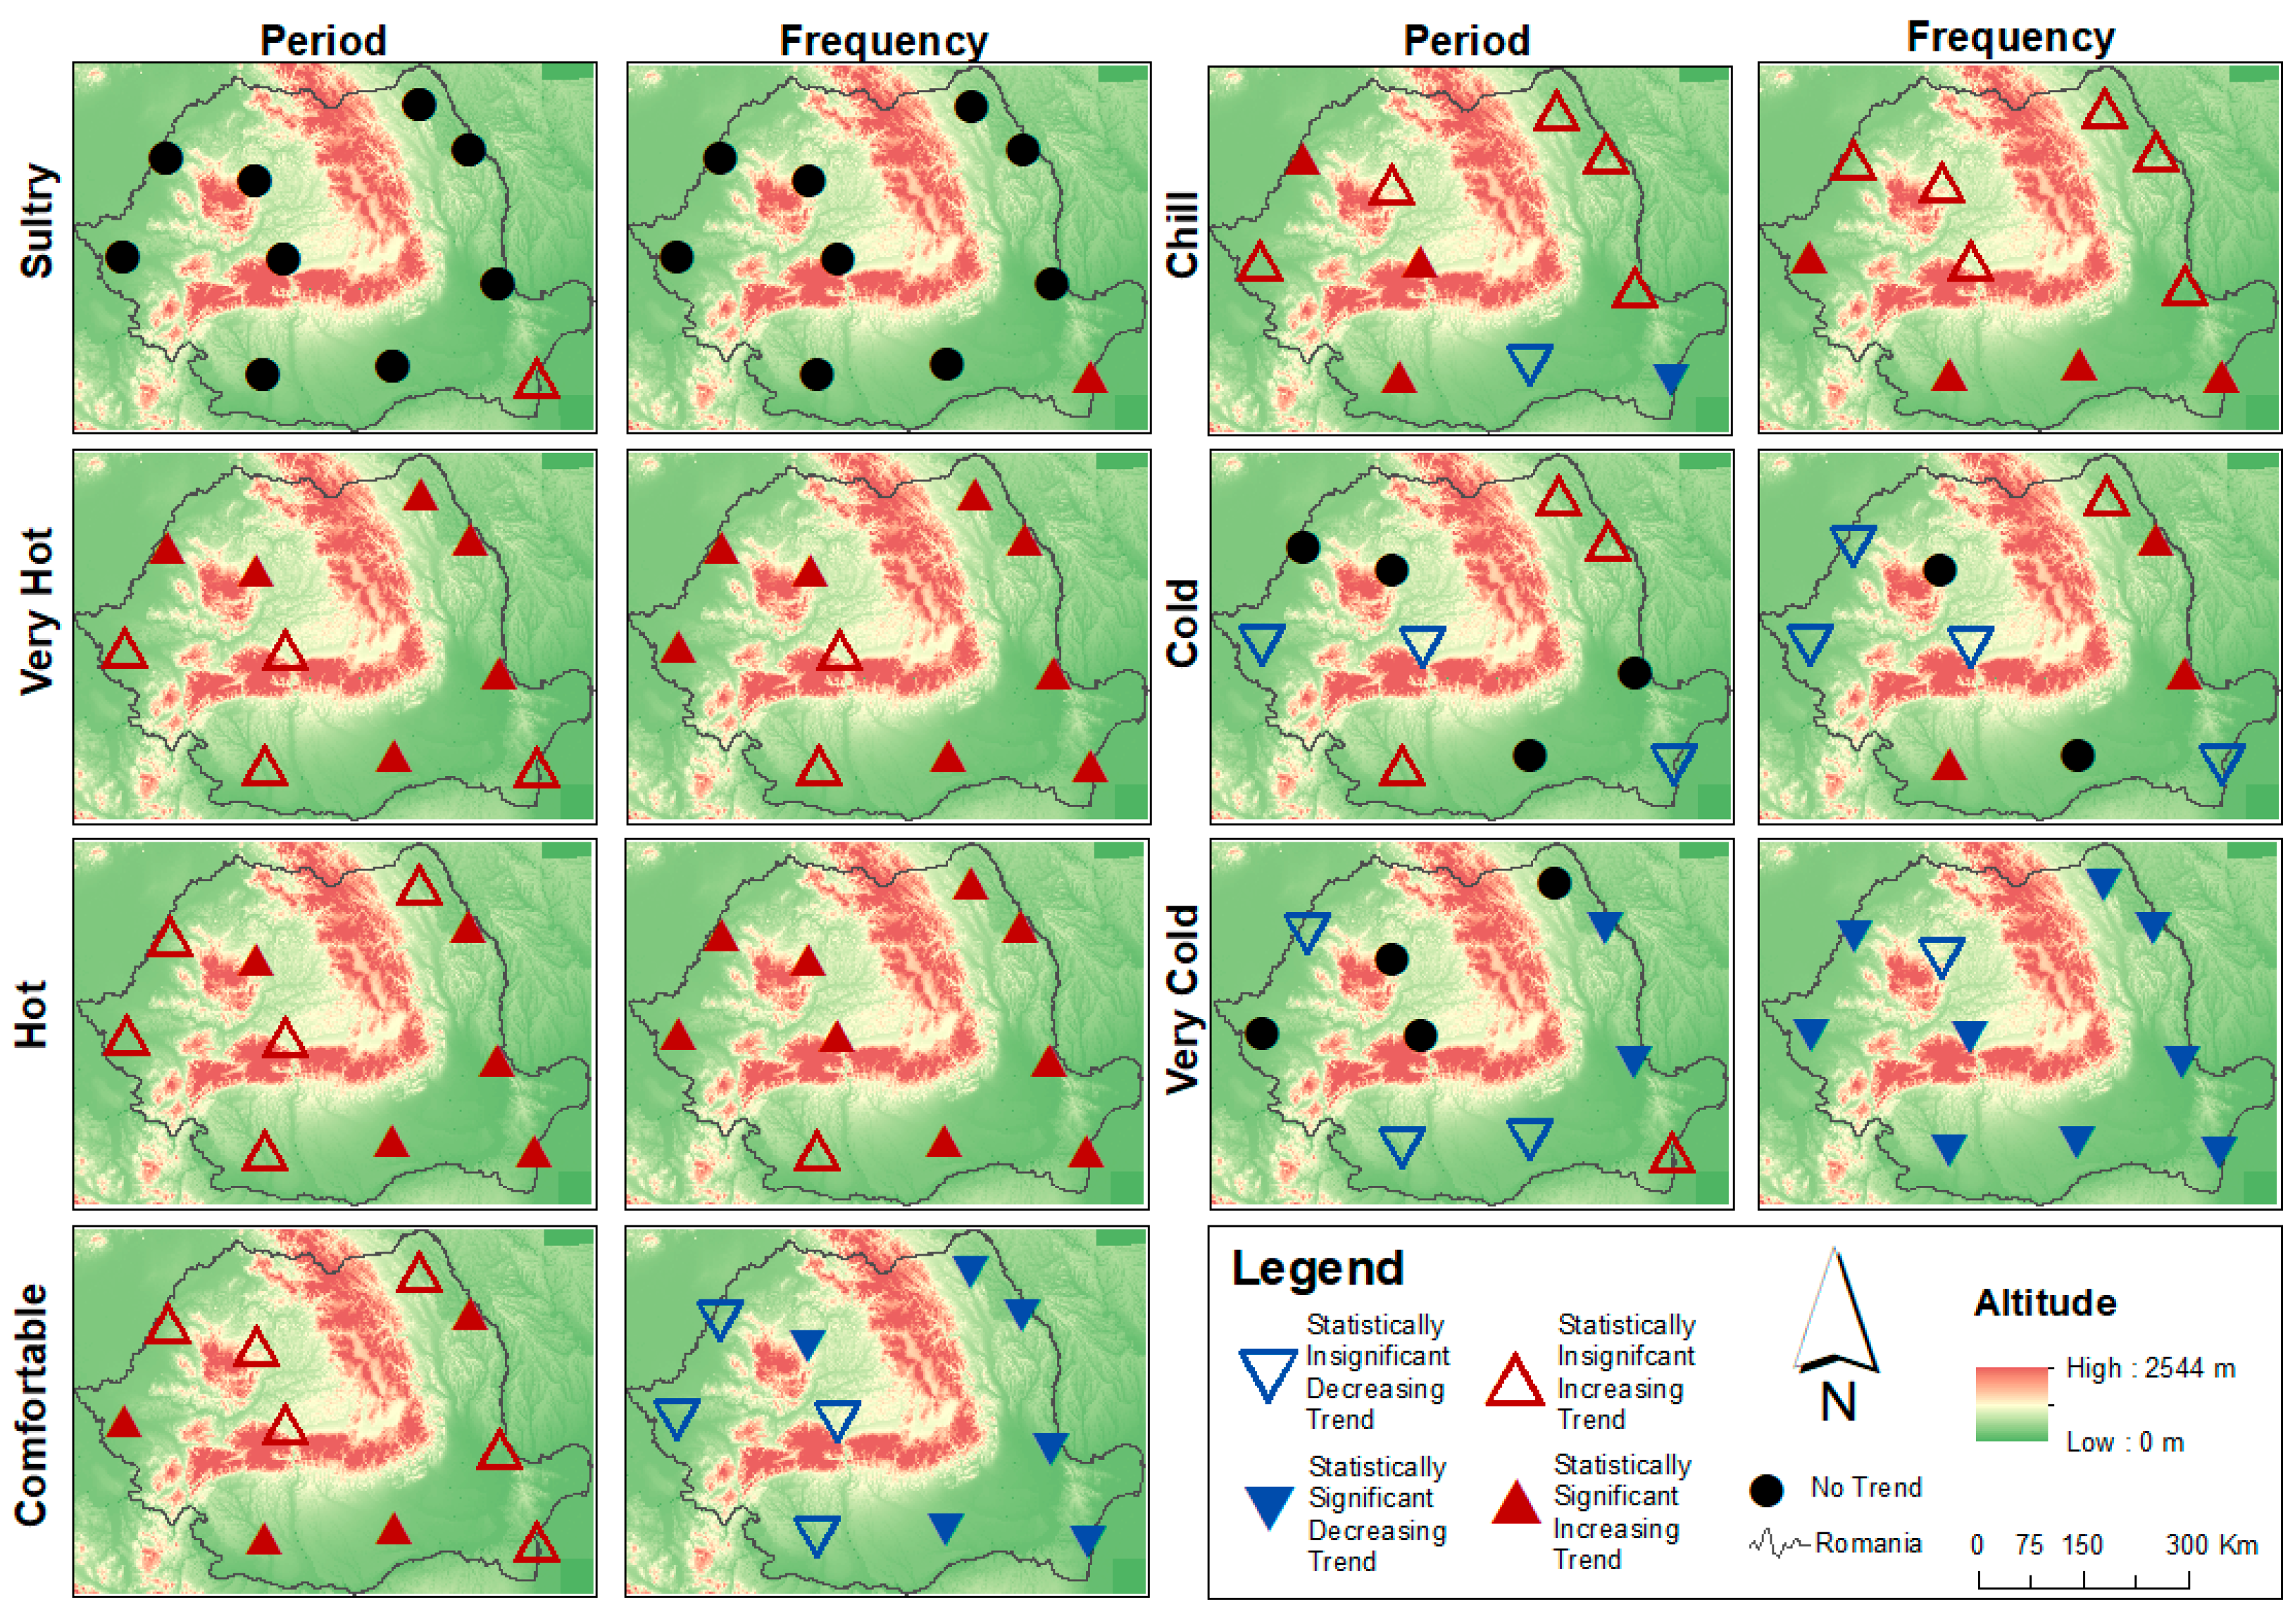
Half of the trends identified for the FO data series were increasing, and among them, 36% were found statistically significant (Figure 15a), whereas the other half was shared between decreasing trends and no trend classes: 34% had a downward trend (and among them 21% are statistically significant) and the remaining series indicated no change. From a more detailed perspective, the significant increase was mainly specific to hot and very hot conditions (90% and 80%, respectively, of the locations), whereas a statistically significant decrease was dominant for very cold (90%) and comfortable (60%) thermal conditions. For sultry, chill and cold sensations, the great majority of the series indicated no significant change (Figure 15b and Figure 16).
Further analysis revealed that 62% of the DOP series indicated an increase and 26% of them were detected to be statistically significant (Figure 15c). They were specific mainly to very hot, hot, comfortable and chill conditions (Figure 15d) and to the eastern cities (Figure 16). The length of the occurrence period showed no change for extreme thermal conditions for the majority of the locations considered: sultry (90%), cold and very cold (40%) (Figure 15d and Figure 16).

4. Discussion and Conclusions

With this study, we intended to present regional differences in changes in bioclimatic conditions in Romania. The detailed analysis for each index trend points out that, in general, both parameters considered in this study, the frequency and length of occurrence period, indicated a similar pattern for the majority of indices and their thermal conditions classes. Since the cities were randomly distributed across the country, we can conclude that, although aimed to develop a study on a local scale, the similar patterns identified lead to the conclusion that we can talk about a regional scale.
From 1961 until 2016, regardless of the calculation method, its purpose or the number of classes, the trend analysis for FO reveals a shift from cold stress conditions to warm and hot ones for each index. However, the most stressful conditions for hot extremes did not indicate significant change. Under these circumstances, one can say that the climate in the big cities of Romania became milder during the cold season and hotter during the warm periods of the year. Further, all indices, except for TE, indicated a general negative trend in the number of comfortable days in terms of thermal sensation. For the DOP, the conclusion was similar, with a longer occurrence interval during the year for comfortable or warm stress classes, except for the H index.
However, based on the FO analysis, comfort (H, UTCI and THI indices) or even cold stress (TE or TeK indices) conditions, were still dominant in the area. Thus, the increasing trends detected will intensify the hot stress, according to some indices, or on the contrary, they will lead to a more comfortable climate, based on other indices.
Due to the previously obtained results indicating significant changes in temperature, and especially in extreme hot temperatures and sunshine hours in Romania over a similar period with that considered for this study, temperature and sunshine seems to be the triggering factors for the identified changes in bioclimatic indices.
Since the great majority of the weather stations are inside the built areas of the selected cities, they are representative for peripheral urban areas with low-rise buildings and green spaces around them. The general assumption is that, for all the indices, under the impact of the urban heat islands, in the high-rise building or dense building areas specific to central areas and to big neighborhoods, the hot stress intensifies, especially during extreme high temperature conditions (such as heat waves), and the cold stress diminishes during the cold season. All considered cities for this study are mid-size and large cities: from more than 100,000 inhabitants to more than 2,000,000 inhabitans (Bucharest). However, most of them shelter between 200,000 and 350,000 people. In their central areas, we can expect that, during the warm season, under the high-rise building impact and rush hours traffic conditions [73,74], the bioclimatic conditions considerably modify compared to those identified in the peripheral areas and become more stressful in terms of hot stress. For the assessment of the real bioclimatic conditions in all types of local climate zones of the cities, installing urban climate monitoring systems is of crucial importance. They will allow identification of the most critical areas in terms of thermal stress (hot spots) as wells as the most comfortable ones.
Moreover, the difference between the results of the indices considered for this study leads to the conclusion that a scientific validation by people’s perception of these indices on a national scale for the bioclimate conditions of Romania should become a research priority. After validation of thermal stress classes, the index identified as the most relevant should be used for general biometeorological forecasting and considered for implementation in the early warning system for extreme weather events. In the case that different indices are to be found appropriate for different regions, a regional approach should be considered and implemented by the Regional Weather Forecast Centers for a more efficient protection of the population. Under these circumstances, this study could become an extremely useful tool for local and regional authorities in order to adopt the best adaptation measures in terms of thermal stress in the urban areas considered.

Author Contributions

All authors had equal contribution to this paper. Conceptualization, A.-E.C.; methodology, A.-E.C. and A.-S.S.; software, A.-S.S. and Ș.B.; validation, A.-E.C.; formal analysis, Ș.B., A.-E.C., N.A.D., and A.-S.S.; investigation, Ș.B, A.-E.C., N.A.D. and A.-S.S.; resources, Ș.B., N.A.D. and A. -S.S.; data curation, A.-E.C., A.-S.S. and Ș.B.; writing—original draft, Ș.B., A.-E.C., N.A.D., and A.-S.S.; writing—review and editing, A.-E.C. and Ș.B.; visualization, Ș.B.; supervision, A.-E.C.; project administration, A.-E.C.; funding acquisition, Ș.B. All authors have read and agreed to the published version of the manuscript.

Funding

This research received no external funding.

Acknowledgments

This research was partly funded by the European Union, receiving financial support through the project: Entrepreneurship for innovation through doctoral and postdoctoral research, grant number POCU/360/6/13/123886 co-financed by the European Social Fund, through the Operational Program for Human Capital 2014–2020. The APC was funded by the Babeș-Bolyai University by using the first author’s (Ș.B.) doctoral studies grant. The authors kindly acknowledge the two anonymous reviewers for their valuable comments and suggestions which significantly contributed the improvement of this article quality.

Conflicts of Interest

The authors declare no conflict of interest.

References

  1. Frohlich, D.; Matzarakis, A. Spatial Estimation of Thermal Indices in Urban Areas—Basics of the SkyHelios Model. Atmosphere 2018, 9, 209. [Google Scholar] [CrossRef] [Green Version]
  2. Matthews, T. Humid Heat and Climate Change. Prog. Phys. Geogr. Earth Environ. 2018, 42, 391–405. [Google Scholar] [CrossRef] [Green Version]
  3. Fischer, E.M.; Knutti, R. Anthropogenic contribution to global occurrence of heavy-precipitation and high-temperature extremes. Nat. Clim. Chang. 2015, 5, 560–564. [Google Scholar] [CrossRef]
  4. Seneviratne, S.I.; Donat, M.G.; Mueller, B.; Alexander, L. No pause in the increase of hot temperature extremes. Nat. Clim. Chang. 2014, 4, 161–163. [Google Scholar] [CrossRef]
  5. Radinovic, D.; Curic, M. Measuring scales of daily temperature extremes, precipitation and wind velocity. Meteorol. Appl. 2014, 21, 461–465. [Google Scholar] [CrossRef]
  6. Steinemann, M.; Spescha, G.; von Stokar, T. Changement Climatique et Développement Territorial. Un Outil de Travail Pour Aménagistes; Office Fédéral du Developpement Territorial (ARE): Berne, Switzerland, 2013; Available online: http://www.are.admin.ch (accessed on 10 November 2019).
  7. OFEV (Ed.) 2018: Quand la Ville Surchauffe. Bases Pour un Développement Urbain Adapté aux Changements Climatiques; Connaissance de l’environnement, No 1812: 109 S; Office Fédéral de L’environnement: Berne, Switzerland, 2018; Available online: https://www.bafu.admin.ch/bafu/fr/home/themes/climat/publications-etudes/publications/quand-la-ville-surchauffe.html (accessed on 10 November 2019).
  8. Croitoru, A.-E.; Piticar, A.; Ciupertea, A.-F.; Roșca, C.F. Changes in heatwaves indices in Romania over the period 1961–2015. Glob. Planet. Chang. 2016, 146, 109–121. [Google Scholar] [CrossRef]
  9. Thornes, J.E.; Stephenson, D.B. How to judge the quality and value of weather forecasts products. Meteorol. Appl. 2001, 8, 307–314. [Google Scholar] [CrossRef] [Green Version]
  10. Spiridonov, V.; Curic, M.; Zafirovski, O. Weather and Human Health; National and University Library “St. Clement Ohridski”: Skopje, Macedonia, 2013; p. 344. [Google Scholar]
  11. Chen, L.; Ng, E. Outdoor thermal comfort and outdoor activities: A review of research in the past decade. Cities 2012, 29, 118–125. [Google Scholar] [CrossRef]
  12. Kantor, N.; Unger, J.; Gulyas, A. Subjective estimations of thermal environment in recreational urban spaces—Part 2: International comparison. Int. J. Biometeorol. 2012, 56, 1089–1101. [Google Scholar] [CrossRef]
  13. Blazejczyk, K.; Twardosz, R. Long-Term Changes of Bioclimatic Conditions in Cracow (Poland). In The Polish Climate in the European Context: An Historical Overview; Przybylak, R., Ed.; Springer: Dordrecht, The Netherlands, 2010. [Google Scholar]
  14. Petralli, M.; Massetti, L.; Orlandini, S. Five years of thermal intra-urban monitoring in Florence (Italy) and application of climatological indices. Theor. Appl. Clim. 2010, 104, 349–356. [Google Scholar] [CrossRef]
  15. Radinovic, D.; Curic, M. Criteria for heat and cold waves duration indexes. Theor. Appl. Climatol. 2012, 107, 505–510. [Google Scholar] [CrossRef]
  16. Omonijo, A.G.; Adeofun, C.O.; Oguntoke, O.; Matzarakis, A. Relevance of thermal environment to human health: A case study of Ondo State, Nigeria. Theor. Appl. Clim. 2012, 113, 205–212. [Google Scholar] [CrossRef]
  17. Błażejczyk, K.; Kuchcik, M.; Błażejczyk, A.; Milewski, P.; Szmyd, J. Assessment of urban thermal stress by UTCI—Experimental and modelling studies: An example from Poland. DIE ERDE J. Geogr. Soc. Berl. 2014, 145, 16–33. [Google Scholar]
  18. Kalbarczyk, R.; Sobolewski, R.; Kalbarczyk, E. Assessement of human thermal sensations based on bioclimatic indices in a suburban population, Wroclaw (SW Poland). Pol. J. Nat. Sci. 2015, 30, 185–201. [Google Scholar]
  19. Toy, S.; Aytac, A.S.; Kantor, N. Human biometeorological analysis of the thermal conditions of the hot Turkish city of Sanliurfa. Theor. Appl. Climatol. 2016, 131, 611–623. [Google Scholar] [CrossRef]
  20. Reinhart, C.F.; Dhariwal, J.; Gero, K. Biometeorological indices explain outside dwelling patterns based on Wi-Fi data in support of sustainable urban planning. Build. Environ. 2017, 126, 422–430. [Google Scholar] [CrossRef]
  21. Charalampopoulos, I.; Tsiros, I.; Chronopoulou-Sereli, A.; Matzarakis, A. A methodology for the evaluation of the human-bioclimatic performance of open spaces. Theor. Appl. Clim. 2016, 128, 811–820. [Google Scholar] [CrossRef]
  22. Lindner-Cendrowska, K.; Blazejczyk, K. Impact of selected personal factors on seasonal variability of recreationist weather perceptions and preferences in Warsaw (Poland). Int. J. Biometeorol. 2016, 62, 113–125. [Google Scholar] [CrossRef] [Green Version]
  23. Lokys, H.L.; Junk, J.; Krein, A. Short-term effects of air quality and thermal stress on non-accidental morbidity—A multivariate meta-analysis comparing indices to single measures. Int. J. Biometeorol. 2017, 62, 16–27. [Google Scholar] [CrossRef]
  24. Mohammadi, B.; Karimi, S. The relationship between thermal sensation and the rate of hospital admissions for cardiovascular disease in Kermanshah, Iran. Theor. Appl. Clim. 2017, 134, 1101–1114. [Google Scholar] [CrossRef]
  25. Geletic, J.; Lehnert, M.; Savic, S.; Milosevic, D. Modelled spatiotemporal variability of outdoor thermal confort in local climate zones of the city of Brno, Czech Republic. Sci. Total Environ. 2018, 624, 385–395. [Google Scholar] [CrossRef] [PubMed]
  26. Lin, T.-P.; Yang, S.-R.; Chen, Y.-C.; Matzarakis, A. The potential of a modified physiologically equivalent temperature (mPET) based on local thermal confort perception in hot and humid regions. Theor. Appl. Climatol. 2019, 135, 873–876. [Google Scholar] [CrossRef]
  27. Perry, M.; Hollis, D. The generation of monthly gridded datasets for a range of climatic variables over the UK. Int. J. Clim. 2005, 25, 1041–1054. [Google Scholar] [CrossRef]
  28. Krüger, E.L.; Rossi, F.; Drach, P. Calibration of the physiological equivalent temperature index for three different climatic regions. Int. J. Biometeorol. 2017, 61, 1323–1336. [Google Scholar] [CrossRef]
  29. Ionac, N. Clima și Comportamentul Uman; Enciclopedică: București, Romania, 1998; p. 272. [Google Scholar]
  30. Ionac, N. Mic Tratat de Geografie Medicală; Editura Universității din București: București, Romania, 2000; p. 428. [Google Scholar]
  31. Teodoreanu, E. Bioclimatologie Umană; Editura Academiei Române: Bucharest, Romania, 2002; p. 215. [Google Scholar]
  32. Teodoreanu, E. Geografie Medicală; Editura Academiei Române: Bucharest, Romania, 2004; p. 144. [Google Scholar]
  33. Teodoreanu, E. Clima și Omul, Prieteni Sau Dușmani; Paideia: Bucharest, Romania, 2011; p. 380. [Google Scholar]
  34. Teodoreanu, E. Turismul Balneoclimatic in România; Editura Universității din Oradea: Oradea, Romania, 2013; p. 228. [Google Scholar]
  35. Croitoru, A.-E.; Sorocovschi, V. Introducere în Biometeorologia Umană; Casa Cărții de Știință: Cluj-Napoca, Romania, 2012; p. 200. [Google Scholar]
  36. Ionac, N.; Ciulache, S. Atlasul Bioclimatic al României; Ars Docendi: București, Romania, 2008; p. 279. [Google Scholar]
  37. Grigore, E. Potențialul Bioclimatic al Podișului Dobrogei de Sud. Ph.D. Thesis, Universitatea din București, Bucharest, Romania, 2011. [Google Scholar]
  38. Ciobotaru, A.-M.; Andronache, I.; Dey, N.; Petralli, M.; Daneshavr, M.R.M.; Wang, Q.; Radulovic, M.; Pintilii, R.-D. Temperature-Humidity Index described by fractal Higuchi Dimension affects tourism activity in the urban environment of Focșani City (Romania). Theor. Appl. Climatol. 2018, 136, 1009–1019. [Google Scholar] [CrossRef]
  39. Croitoru, A.-E.; Piticar, A. Changes in daily extreme temperatures in the extra—Carpathians regions of Romania. Int. J. Climatol. 2013, 33, 1987–2001. [Google Scholar] [CrossRef]
  40. Busuioc, A.; Caian, M.; Cheval, S.; Bojariu, R.; Boroneant, C.; Baciu, M.; Dumitrescu, A. Variabilitatea si Schimbarea Climei in Romania; Pro Universitaria: Bucharest, Romania, 2010. [Google Scholar]
  41. Bojariu, R.; Bîrsan, M.V.; Cica, R.; Velea, L.; Burcea, S.; Dumitrescu, A.; Dascalu, S.I.; Gothard, M.; Dobrinescu, A.; Carbunaru, F.; et al. Schimbarile Climatice—De la Bazele Fizice la Riscuri si Adaptare; Printech: Bucharest, Romania, 2015; p. 200. [Google Scholar]
  42. Croitoru, A.E.; Piticar, A.; Burada, D.C. Changes in precipitation extremes in Romania. Quat. Int. 2016, 415, 325–335. [Google Scholar] [CrossRef]
  43. Croitoru, A.E.; Piticar, A.; Sfîca, L.; Harpa, G.V.; Rosca, C.F.; Tudose, T.; Horvath, C.; Minea, I.; Ciupertea, F.A.; Scripca, A.S. Extreme Temperature and Precipitation Events in Romania; Editura Academiei Române: Bucharest, Romania, 2018; pp. 320–359. [Google Scholar]
  44. Tank, A.M.G.K.; Wijngaard, J.B.; Können, G.P.; Böhm, R.; Demarée, G.; Gocheva, A.; Mileta, M.; Pashiardis, S.; Hejkrlik, L.; Kern-Hansen, C.; et al. Daily dataset of 20th-century surface air temperature and precipitation series for the European Climate Assessment. Int. J. Clim. 2002, 22, 1441–1453. [Google Scholar] [CrossRef]
  45. Meteomanz. Available online: http://www.meteomanz.com (accessed on 13 October 2017).
  46. Rp5. Available online: http://www.rp5.ru (accessed on 13 October 2017).
  47. Baranowska, M.; Gabryl, B. Biometeorological norms as tolerance interval of man to weather stimuli. Int. J. Biometeorol. 1981, 25, 515–535. [Google Scholar] [CrossRef]
  48. Blazejczyk, K.; Epstein, Y.; Jendritzky, G.; Staiger, H.; Tinz, B. Comparison of UTCI to selected thermal indices. Int. J. Biometeorol. 2012, 56, 515–535. [Google Scholar] [CrossRef] [Green Version]
  49. Malcheva, K.; Gocheva, A. Thermal confort indices for the cold half-year in Sofia. Bulg. J. Meteol. Hydrol. 2014, 19, 16–25. [Google Scholar]
  50. Scripcă, A.-S.; Croitoru, A.-E. L’évaluation générale du stress thermique dans les grandes zones urbaines de Roumanie. In Actes du Colloque—Les Risques Naturels Dans le Contexte du Changement Climatique. Résumés Étendus; Holobâcă, I.-H., Ivan, K., Eds.; Presa Universitară Clujeană: Cluj-Napoca, Romania, 2018; pp. 105–111. [Google Scholar]
  51. Scripcă, A.-S.; Croitoru, A.-E. Analyse de la relation entre les indices bioclimatiques et les vagues de chaleur/periodes chaudes à Bucarest, en Roumanie. In XXXIIème Colloque Internationale de L’AIC—Le Changement Climatique, la variabilité et les Risques Climatiques/Climatic Change, Variability and Climatic Risks; Department of Meteorology and Climatology, Aristotle University of Thessaloniki: Thessaloniki, Greece, 2019; pp. 511–516. [Google Scholar]
  52. Bioklima. Available online: https://www.igipz.pan.pl/bioklima.html (accessed on 20 February 2018).
  53. Katabatic Power. Available online: https://websites.pmc.ucsc.edu/~jnoble/wind/extrap/ (accessed on 15 May 2019).
  54. Dufton, A.F. Equivalent temperature of a room and its measurement. In Building Research Board; Technical Paper 13; H. M. Stationery Office: London, UK, 1932; p. 9. [Google Scholar]
  55. Dufton, A.F. The use of kata thermometers for the measurement of equivalent temperature. Epidemiol. Infect. 1933, 33, 349–352. [Google Scholar] [CrossRef] [PubMed] [Green Version]
  56. Bedford, T. Equivalent temperature, what it is, how it’s measured. Heat. Pip. Air cond. 1951, 23, 87–91. [Google Scholar]
  57. Farajzadeh, H.; Saligheh, M.; Alijani, B.; Matzarakis, A. Comparison of selected thermal indices in the northwest of Iran. Nat. Environ. Chang. 2015, 1, 61–80. [Google Scholar]
  58. Kozłowska-Szczȩsna, T.; Błażejczyk, K.; Krawczyk, B. Human Bioclimatology—Methods and Applications. Monographies, 1; Polish Academy of Sciences: Warsow, Poland, 1997; p. 200. [Google Scholar]
  59. Araźny, A. Biometeorological Conditions in the Arctic during the First International Polar Year, 1882–1883. Bull. Geogr. Phys. Geogr. Ser. 2010, 3, 47–64. [Google Scholar] [CrossRef] [Green Version]
  60. Hill, L.; Griffith, O.W.; Flack, M.V. The measurement of the rate of heat-loss at body temperature by convection, radiation, and evaporation. Philos. Trans. R. Soc. Lond. Ser. B Contain. Pap. Boil. Character 1916, 207, 183–220. [Google Scholar]
  61. Błażejczyk, K.; Kozłowska-Szczęsna, T.; Krawczyk, B. Recent bioclimatological studies in Poland. Geogr. Pol. 1994, 63, 37–49. [Google Scholar]
  62. Zare, S.; Hasheminejad, N.; Shirvan, H.E.; Hemmatjo, R.; Sarebanzadeh, K.; Ahmadi, S. Comparing Universal Thermal Climate Index (UTCI) with selected thermal indices/environmental parameters during 12 months of the year. Weather Clim. Extrem. 2018, 19, 49–57. [Google Scholar]
  63. Błażejczyk, K.; Baranowski, J.; Jendritzky, G.; Błażejczyk, A.; Bröde, P.; Fiala, D. Regional features of the bioclimate of Central and Southern Europe against the background of the Köppen-Geiger climate classification. Geogr. Pol. 2015, 88, 439–453. [Google Scholar] [CrossRef] [Green Version]
  64. Błażejczyk, K. Radiation balance in man in various meteorological and geographical conditions. Geogr. Pol. 2004, 77, 63–76. [Google Scholar]
  65. Błażejczyk, K. Radiation balance of different segments of the human body, DWD. Ann. Meteorol. 2005, 41, 313–316. [Google Scholar]
  66. Błażejczyk, K.; Matzarakis, A. Assessment of bioclimatic differentiation of Poland based on the human heat balance. Geo. Pol. 2007, 80, 63–82. [Google Scholar]
  67. Błażejczyk, A.; Błażejczyk, K.; Baranowski, J.; Kuchcik, M. Heat stress mortality and desired adaptation responses of healthcare system in Poland. Int. J. Biometeorol. 2018, 62, 307–318. [Google Scholar] [CrossRef] [PubMed]
  68. Bligh, J.; Johnson, K.G. Glossary of Terms for Thermal Physiology. J. Therm. Biol. 2003, 28, 75–106. [Google Scholar] [CrossRef] [PubMed] [Green Version]
  69. UTCI. Available online: http://www.utci.org (accessed on 24 June 2019).
  70. Mann, H.B. Non-parametric tests against trend. Ecometrica 1945, 13, 245–259. [Google Scholar] [CrossRef]
  71. Kendall, M.G. Rank Correlation Method, 4th ed.; Charles Griffin: London, UK, 1975; p. 202. [Google Scholar]
  72. Gilbert, R.O. Statistical Methods for Environmental Pollution Monitoring; Van Nostrand Reinhold: New York, NY, USA, 1987; p. 320. [Google Scholar]
  73. Corpade, C.; Man, T.; Petrea, D.; Corpade Ana-Maria Moldovan, C. Changes in landscape structure induced by transportation projects in Cluj-Napoca periurban area using GIS. Carpathian J. Earth Environ. Sci. 2014, 9, 177–184. [Google Scholar]
  74. Kil, J.; Kowalczyk, C.; Moldovan, C.S. Comparison of changes in urbanized area in Poland and Romania. Transylv. Rev. 2018, 27, 56–72. [Google Scholar]
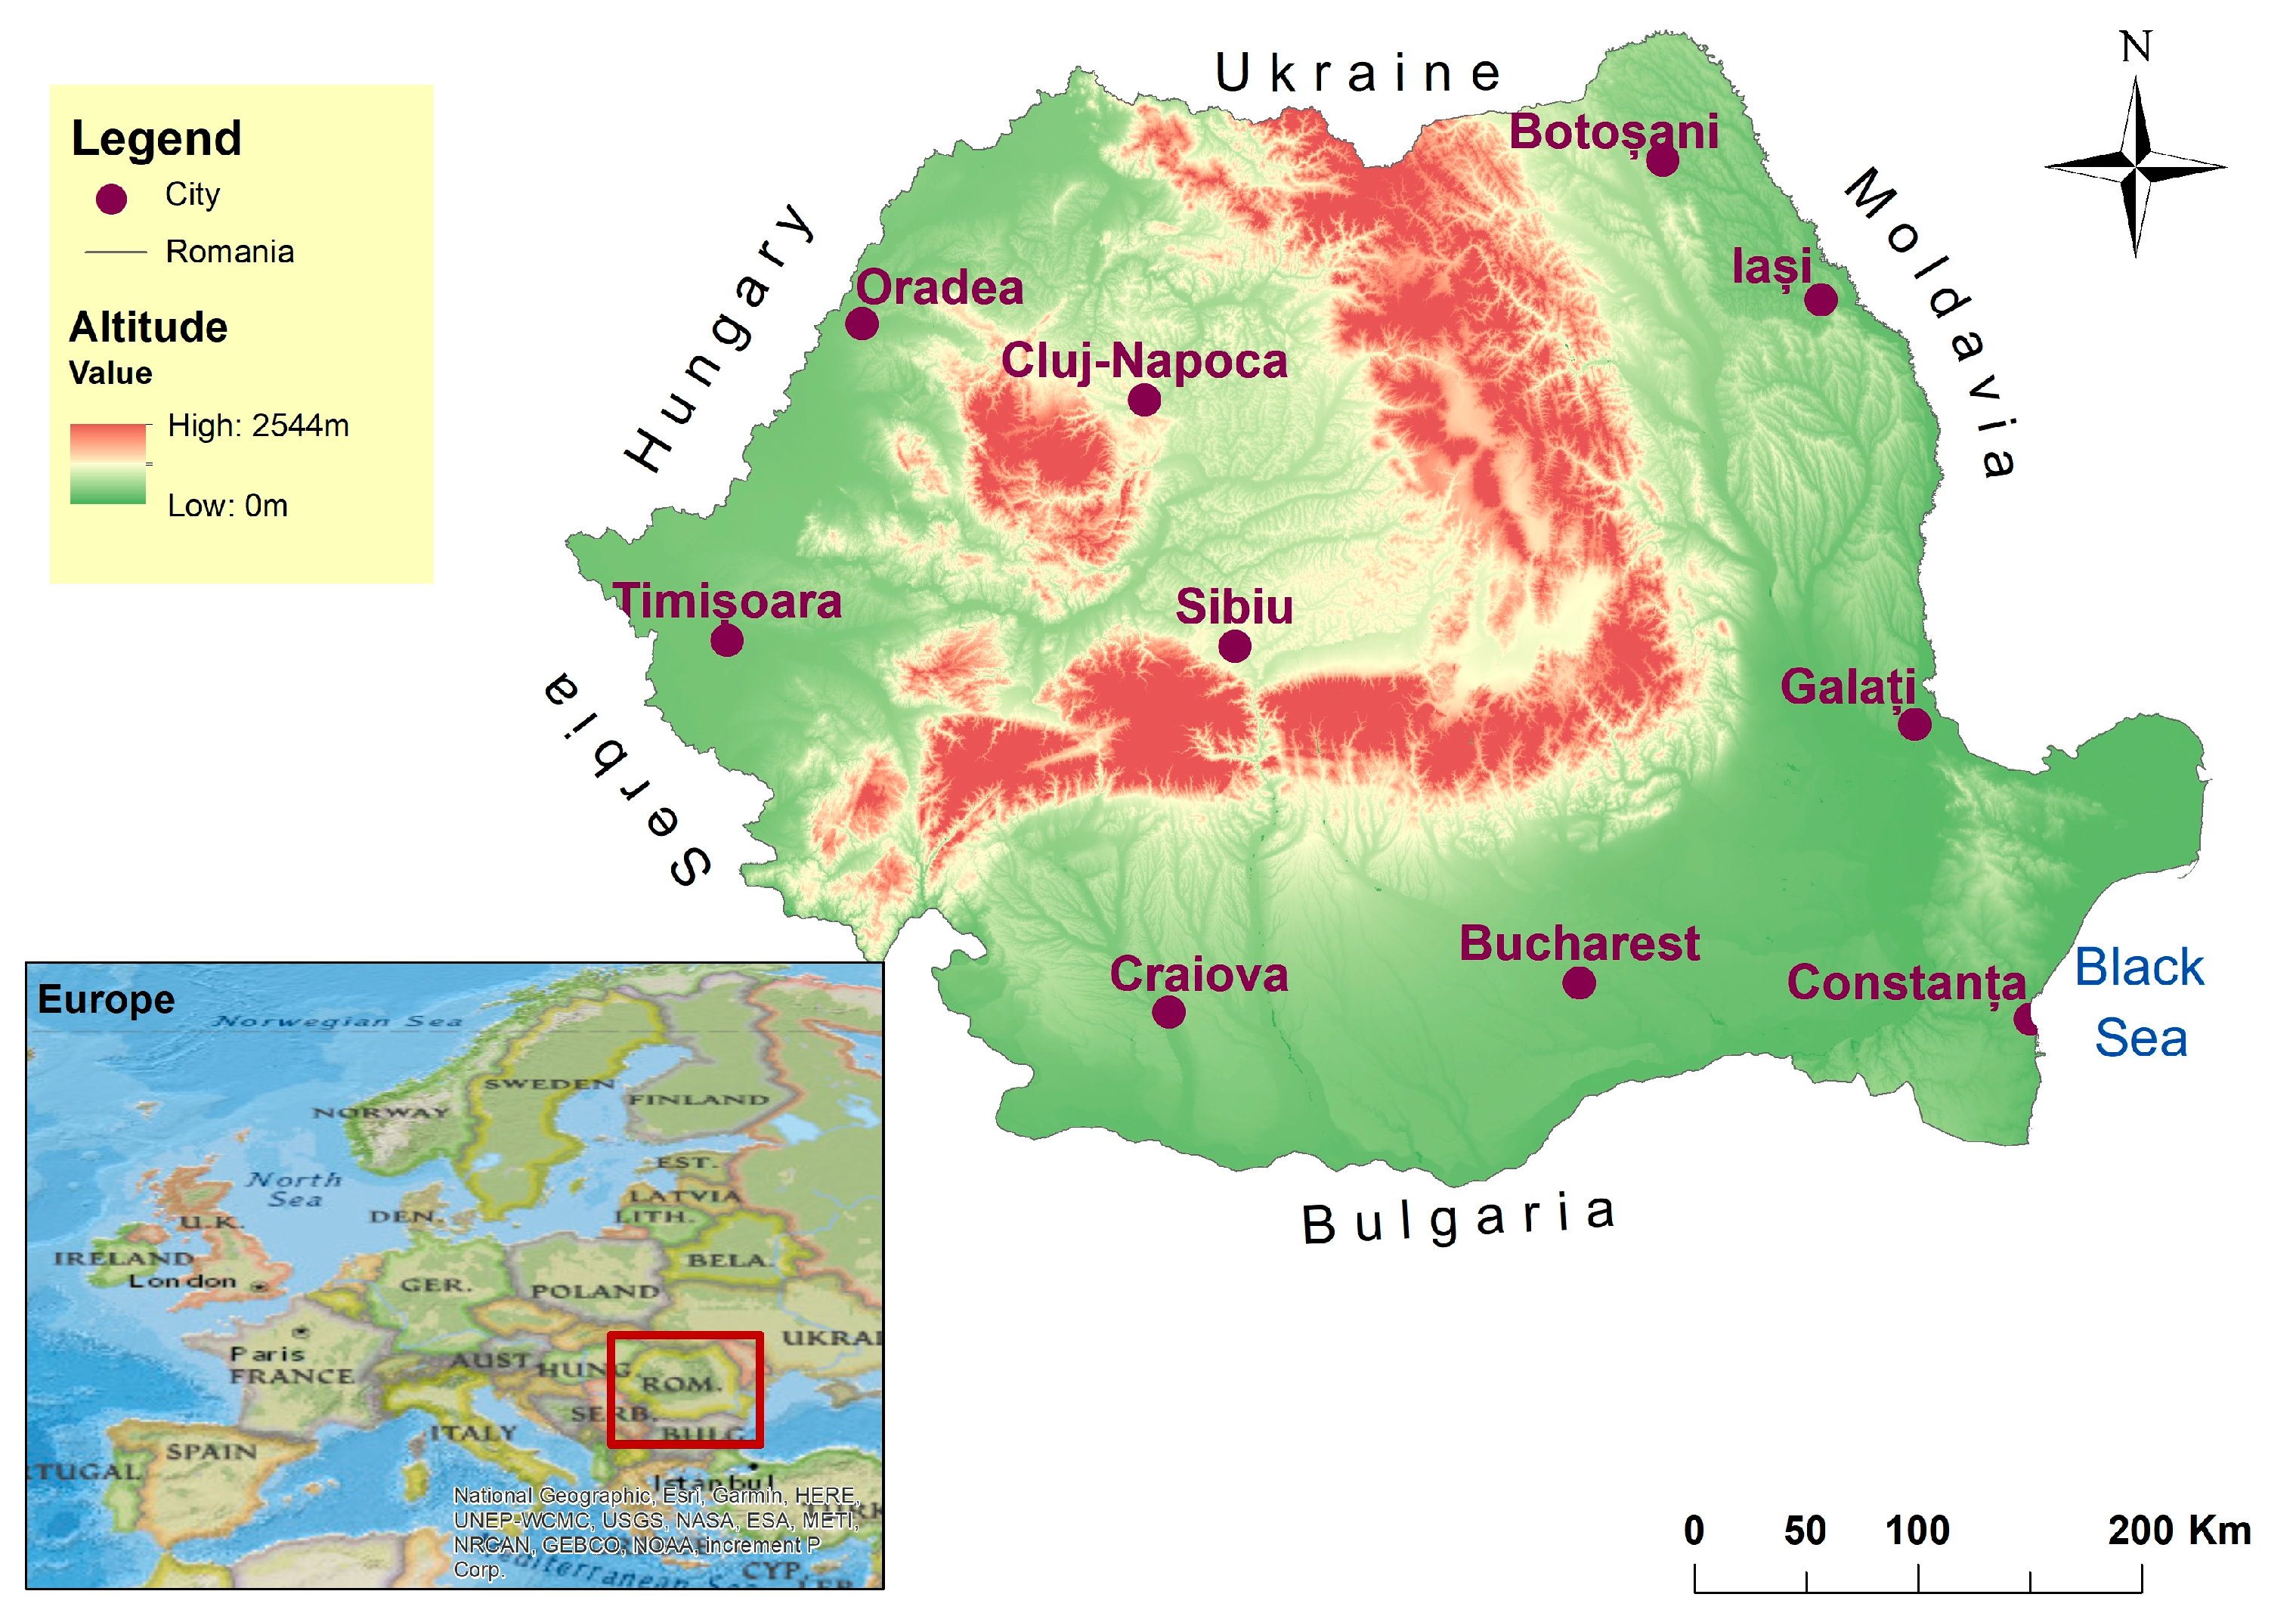
Figure 1. Topography and the weather stations considered.
Atmosphere 11 00819 g001
Figure 2. DOP and FO for TeK index by thermal sensations classes and weather stations (number of days).
Atmosphere 11 00819 g002
Figure 3. Trend types for TeK index: (a) for all data sets of FO; (b) by thermal sensations classes of FO; (c) for all data sets of DOP; (d) by thermal sensations classes of DOP.
Atmosphere 11 00819 g003
Figure 4. Spatial distribution of the trends detected for the TeK index.
Atmosphere 11 00819 g004
Figure 5. DOP and FO for TE index by thermal sensations classes and weather stations (number of days).
Atmosphere 11 00819 g005
Figure 6. Trend types for TE index: (a) for all data sets of FO; (b) by thermal sensations classes of FO; (c) for all data sets of DOP; (d) by thermal sensations classes of DOP.
Atmosphere 11 00819 g006
Figure 7. Spatial distribution of the trends detected for the TE index.
Atmosphere 11 00819 g007
Figure 8. DOP and FO for the H index by thermal sensations classes and weather stations (number of days).
Atmosphere 11 00819 g008
Figure 9. Trend types for the H index: (a) for all data sets of FO; (b) by thermal sensations classes of FO; (c) for all data sets of DOP; (d) by thermal sensations classes of DOP.
Atmosphere 11 00819 g009
Figure 10. Spatial distribution of the trends detected for the H index.
Atmosphere 11 00819 g010
Figure 11. DOP and FO for the UTCI index by thermal sensations classes and weather stations (number of days).
Atmosphere 11 00819 g011
Figure 12. Trend types for the UTCI index: (a) for all data sets of FO; (b) by thermal sensations classes of FO; (c) for all data sets of DOP; (d) by thermal sensations classes of DOP.
Atmosphere 11 00819 g012
Figure 13. Spatial distribution of the trends detected for the UTCI index.
Atmosphere 11 00819 g013
Figure 14. DOP and FO for the THI index by thermal sensations classes and weather stations (number of days).
Atmosphere 11 00819 g014
Figure 15. Trend types for the THI index: (a) for all data sets of FO; (b) by thermal sensations classes of FO; (c) for all data sets of DOP; (d) by thermal sensations classes of DOP.
Atmosphere 11 00819 g015
Figure 16. Spatial distribution of the trends detected for the THI index.
Atmosphere 11 00819 g016
Table 1. Geographical coordinates of the weather stations considered.
Weather station *Latitude (N)Longitude (E)Elevation (m)
Botoșani47°44′08″26°38′40″161
București-Băneasa44°31′00″26°05′00″90
Cluj-Napoca46°46′39″23°34′17″410
Constanța44°12′49″28°38′41″13
Craiova47°18′36″23°52′00″192
Galați45°28′23″28°01′56″71
Iași47°10′15″27°37′42″102
Oradea47°02′10″21°53′51″136
Sibiu45°47′21″24°05′28″444
Timișoara45°46′17″21°15′35″86
* Weather stations are listed alphabetically.
Table 2. Classes for thermal comfort and discomfort of the used indices.
Thermal Sensation/IndexTeK (°C)TE (°C)H (W/m2)UTCI (°C)THI (Unit)
Extreme cold stress; <−40.1
Extremely cold and windy >2100.1
Very strong cold stress; −40.00–27.1
Very cold <1.01680.1–2100.0 <40.0
Strong cold stress; −27.0–13.1
Cold<18.01.1–9.01260.1−1680.0 40.1–50.0
Moderate cold stress; −13.0–0.0
Cool18.1–24.09.1–17.0840.1−1260.0
Slight cold stress; 0.1–+9.0
Slightly cool;24.1–32.0 630.1–840.0
Fresh; 17.1–21.0
Chill 50.1–60.0
No thermal stress; +9.1–+26.0
Comfortable32.1–44.021.1–23.0420.1–630.0 60.1–75.0
Moderate heat stress +26.1–+32.0
Strong heat stress; +32.1–+38.0
Slightly sultry;44.1–56.0
Hot 210.1–420.0 75.1–80.0
Very strong heat stress; +38.1–+46.0
Sultry;>56.1
Warm; 23.1–27.0
Very hot <210.0 80.1–85.0
Extreme heat stress; >+46.1
Sultry >85.1
Sources: TeK [63]; TE after [47,48] modified; H [49,58,59] modified; UTCI [68,69] modified; THI after [35].