Article

Inversion Method of Regional Range-Dependent Surface Ducts with a Base Layer by Doppler Weather Radar Echoes Based on WRF Model

1
School of Physics and Optoelectronic Engineering, Xidian University, Xi’an 710071, China
2
China Research Institute of Radiowave Propagation, Qingdao 266107, China
*
Author to whom correspondence should be addressed.
Atmosphere 2020, 11(7), 754; https://doi.org/10.3390/atmos11070754
Submission received: 27 March 2020 / Revised: 10 July 2020 / Accepted: 14 July 2020 / Published: 16 July 2020
(This article belongs to the Special Issue Vertical Structure of the Atmospheric Boundary Layer in Coastal Zone)

Abstract

:
Ground clutter caused by variations of atmospheric refraction environment can occur when the weather radar is observing precipitation systems, especially in the presence of a tropospheric duct. Therefore, the acquisition of duct parameters is very important for evaluating radar performance and improving data quality. Based on the measured echo data of a Doppler weather radar located at Qingdao and the numerical simulation results of modified refractivity profiles from the Weather Research and Forecasting (WRF) model, an inversion method for regional range-dependent tropospheric duct parameters over the sea area is proposed in this paper. Due to the higher antenna height of up to 169 m, the transmission environment is assumed to be a surface duct with a base layer for locating the antenna in the trapping layer. The Principal Component Analysis (PCA) and Parabolic Equation (PE) methods were used to characterize the horizontal inhomogeneity of duct parameters and the propagation of electromagnetic waves in the tropospheric duct. In the inversion model, duct parameters extracted from WRF outputs were used as the initial values. Additionally, multithread parallel processing was adopted in order to reduce the inversion time based on the characteristics of the optimization algorithm. The overall variation tendencies of the WRF simulation results in the regional distribution of duct parameters were well consistent with the inversion results, but were relatively lower in terms of specific values. Due to the influence of precipitation targets on measured echo data, the inversed echo data had different agreements with the measurements in space, and the absolute error values were less than 5 dB in about 90% of the region of interest.

1. Introduction

Variations in meteorological conditions in the atmospheric boundary layer have serious impacts on the performance of radio equipment operating in the lower atmosphere [1,2]. In particular, trapping structures under humidity and temperature inversion conditions, i.e., tropospheric ducts, can bend the propagation path of radio waves towards the earth’s surface, resulting in the occurrence of over-the-horizon transmission [3,4,5]. For monostatic radar systmes, ground clutter generated due to surface scattering and tropospheric ducting effects can potentially reduce the quality of observation data [6]. Therefore, it is very important to obtain the distribution information of the tropospheric duct around the radar in order to evaluate the performance of the radar system and improve the quality control of radar products.
Weather radars [7] have been essential tools for the detection of precipitation for the last few decades. Radar products are widely applied in hydrological research [8] and are significant data sources for assimilation systems in numerical weather prediction (NWP) models [9]. Therefore, the quality control of radar products is a very important and difficult process, and higher requirements have been proposed, with the aim of continuously extending radar applications and upgrading radar systems. Saltikoff et al. described the process of quality assurance in the Doppler weather radar network developed by the Finnish Meteorological Institute [10]. Werner presented an updated post-processing workflow of radar data quality control for the DWD weather radar network [11]. Among the numerous factors that impair the reliability of radar observations [12], anomalous propagation caused by special atmospheric conditions, which include subrefraction, superrefraction, and trapping refraction, is the predominant one. In particular, the identification and elimination of ground clutter resulting from trapping refraction at a lower radar elevation angle has attracted increasing attention from researchers. Based on spectral decompositions of dual-polarization parameters, ground clutter presented in a radar observation volume can be adaptively suppressed in the spectral domain [13]. Torres et al. proposed the Clutter Environment Analysis using Adaptive Processing (CLEAN-AP) filter based on the autocorrelation spectral density for the effective mitigation of ground clutters by adaptively adjusting its suppression characteristics [14]. The impact of mesoscale meteorological processes (bora wind and the sporadic sea/land breeze) on the occurrence of anomalous propagation conditions was studied by Prtenjak et al. at the northern Adriatic [15]. Stagliano et al. described the Total Atmospheric Effects Mitigation (TAEM) system, which uses the NWP model and the propagation model to predict the locations at which anomalous propagation will occur. Furthermore, the system can provide appropriate radar configurations to mitigate anomalous propagation [16]. Peter et al. developed a Naïve Bayes Classifier (NBC) to distinguish between precipitation and anomalous propagation echoes [17].
The tropospheric duct has always been an important topic in the study of atmospheric anomalous propagation conditions, and various methods for the detection of tropospheric ducts have been developed in order to evaluate and reduce its influence on radars. For a long time, the most basic approach for obtaining the atmospheric refractivity profiles was to evaluate the refractivity based on the direct measurement of meteorological parameters using radiosondes, rocketsondes [18], etc. However, the calculated refractivity profiles are not accurate enough due to the relatively lower sampling frequency in time and space, and the measuring equipment required is expensive and complicated to operate. Since the mid-1990s, NWP models have been used to determine the spatial distribution of atmospheric refractivity profiles by predicting the meteorological parameters in the region of interest [19], and the WRF model [20] is one of the new generation of mesoscale NWP models. For evaporation ducts, the duct heights or vertical refractivity profiles can be estimated using the P-J, NPS [21], or four-parameter model [22], etc., with the meteorological parameters at a certain height. In recent years, the inversion of refractivity profiles based on the impact of tropospheric ducts on radio wave propagation has become a hot research field due to its lower cost and greater convenience. Since only the measured sea clutter power needs to be input, and the output can include refractivity profiles at all the azimuths and distances, the refractivity from clutter (RFC) method is a very powerful tool for retrieving regional tropospheric ducts in a maritime environment [23,24,25]. In this paper, the regional distribution of surface ducts with a base layer over the sea area is inversed based on the echo data of a Doppler weather radar, which has rarely been seen in the currently available literature. Due to the use of Doppler weather radar observations, no additional experiments need to be carried out for the inversion of refractivity profiles.
The refractivity profiles of tropospheric ducts in the actual atmosphere are variable in the horizontal direction, which has an impact on the inversion of duct parameters due to the differences with the horizontal homogeneity hypothesis with respect to sea clutter power. Based on the three-dimensional refractivity fields from the NWP models, Marshall et al. [26] and Benzon et al. [27] made efforts to predict the radar clutters and to evaluate radar performance under realistic non-standard propagation conditions that were spatiotemporally inhomogeneous. Shi et al. [28] and Wang et al. [29] investigated the effects of horizontal inhomogeneity in evaporation duct height on electromagnetic wave propagation using numerical and experimental methods. The most basic method that can be used to describe the range-dependent tropospheric duct environment is to define the vertical refractivity profiles at all range steps, but it is impossible to apply this method in the inversion process due to the great number of parameters that need to be defined. To reduce the quantity of calculations, the refractivity profiles can be defined at some steps only, which will greatly weaken the horizontal inhomogeneity. Using dimension reduction methods to characterize the horizontal inhomogeneity is usually a better choice, and the most commonly used method is Principal Component Analysis (PCA) based on the Karhunen-Loeve (K-L) transformation [30]. Tabrikian et al. estimated the base height of a bilinear refractivity profile with linear range dependency using a maximum a posteriori method [31]. The variations in duct parameters with range were presented as Markov processes in the recursive Bayesian RFC model proposed by Vasudevan et al. [32,33]. The range dependency in the trapping layer base height was modeled with the use of an additional six parameters based on the PCA method in Gerstoft’s work [34]. The nonlinear relationship between sea clutter power and duct parameters is very complicated, and the inversion process can be transformed into a global optimization problem once the search space and objective function have been defined. Then the inversion problem can be solved through the use of optimization algorithms, whereby optimization algorithms based on swarm intelligence, such as Ant Colony Optimization (ACO), Particle Swarm Optimization (PSO) [35], etc., are very efficient due to their features of simplicity and intelligence.
The principle diagram of the inversion algorithm proposed in this paper is shown in Figure 1. Firstly, the regional distributions of the meteorological parameters, vertical modified refractivity profiles, and tropospheric ducts over the ocean area of interest at a given point can be obtained from the outputs of the WRF model. Then, an appropriate parametric model of the vertical modified refractivity profile is adopted, and the initial values of the duct parameters in the inversion process can be calculated based on the above profiles simulated by the WRF model. Furthermore, the meteorological parameters, such as sea surface temperature and wind speed, are used to determine the sea surface conditions in the model of sea clutter power. Finally, the pretreated measured echo data of the Doppler radar and the initial inversion values of duct parameters are taken as the inputs of the inversion process, and the parameters of the regional range-dependent tropospheric duct can be inverted using an appropriate optimization algorithm.
In this paper, the working principle of the Doppler weather radar and the echo data measured by the Doppler weather radar located at (120.23° E, 35.99° N) at 12:00 on 18 July 2014 (UTC) are provided in Section 2. Subsequently, the parameterized model of the vertical modified refractivity profile for surface duct and the numerical simulation results of the tropospheric duct in the sea area of interest based on the WRF model are presented in Section 3. Then the inversion model for the regional range-dependent surface duct with a base layer is proposed in Section 4, and the inversion results are discussed in Section 5. Finally, the conclusions are presented in Section 6.

2. Equivalent Reflectivity Factor Measured by the Doppler Weather Radar

The radar echoes received by the Doppler weather radar refer to the backscattered waves when cloud or precipitation particles are irradiated by the radar. The echo power depends on the radar parameters, the physical characteristics of the cloud or precipitation particles, and the distance from the radar. The relationship between the echo power and these factors is usually expressed using the radar meteorological equation, and the cloud or precipitation characteristics can be judged according to the received echo power. Since the echo power does not just reflect the cloud or precipitation characteristics, the reflectivity factor is usually adopted in radar meteorology, which is independent of the radar parameters and the distance from the radar, and represents the backscattering ability of meteorological targets on electromagnetic waves. Based on Rayleigh scattering, the measured echo power [36] can be obtained as follows:
P ¯ e = C r 2 Z
C = π 3 | K | 2 P t G 2 τ c θ ϕ 1024 ( ln 2 ) λ 2
where Z is the reflectivity factor in mm6/m3; | K | 2 is about 0.93 for the water particle when the radar works in the S, C and X bands; P t and G are the transmitted power and gain of the radar antenna, respectively; λ is the wavelength; c is the light speed; τ is the pulse width; θ and φ are the vertical and horizontal beamwidth of the radar antenna, respectively; and r is the distance between the radar antenna and meteorological target.
When the Rayleigh scattering condition is not satisfied, the equivalent reflectivity factor Z e can be used instead, which is the reflectivity factor in the Rayleigh scattering case with the reflectivity equivalent to that in the actual case. Due to the large variation of Z with the cloud and precipitation physical parameters and for the sake of convenience, Z is usually expressed in dBZ, which stands for decibel relative to Z 0 , which is
dBZ = 10 lg Z Z 0   ( Z 0 = 1   mm 6 / m 3 )
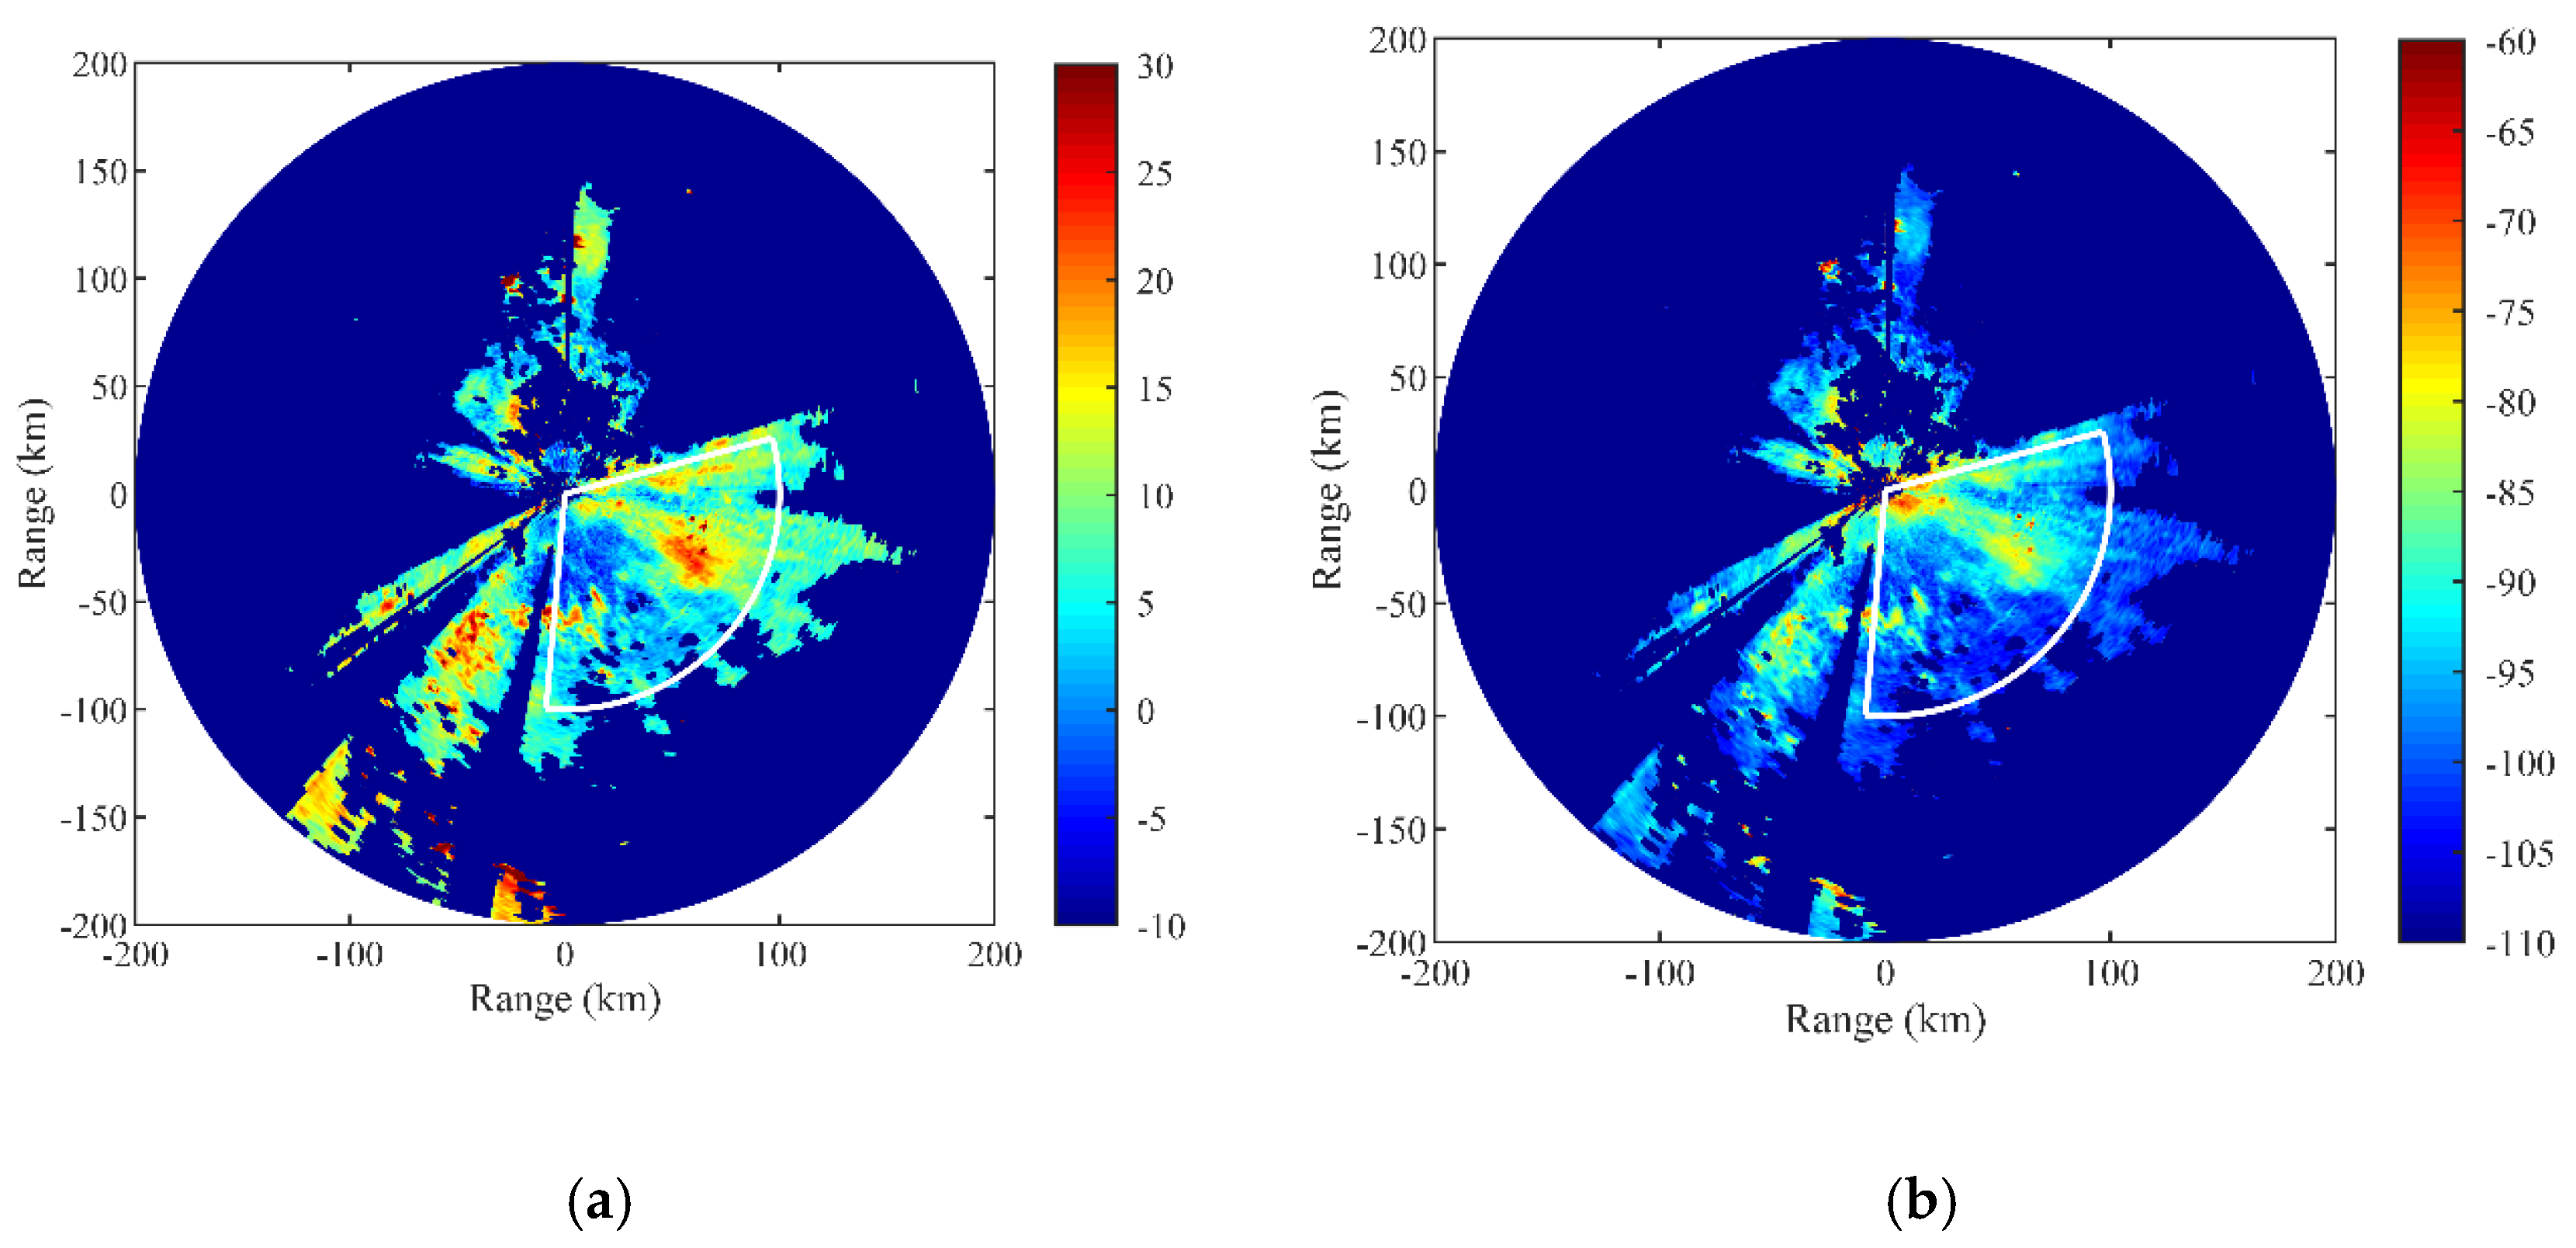
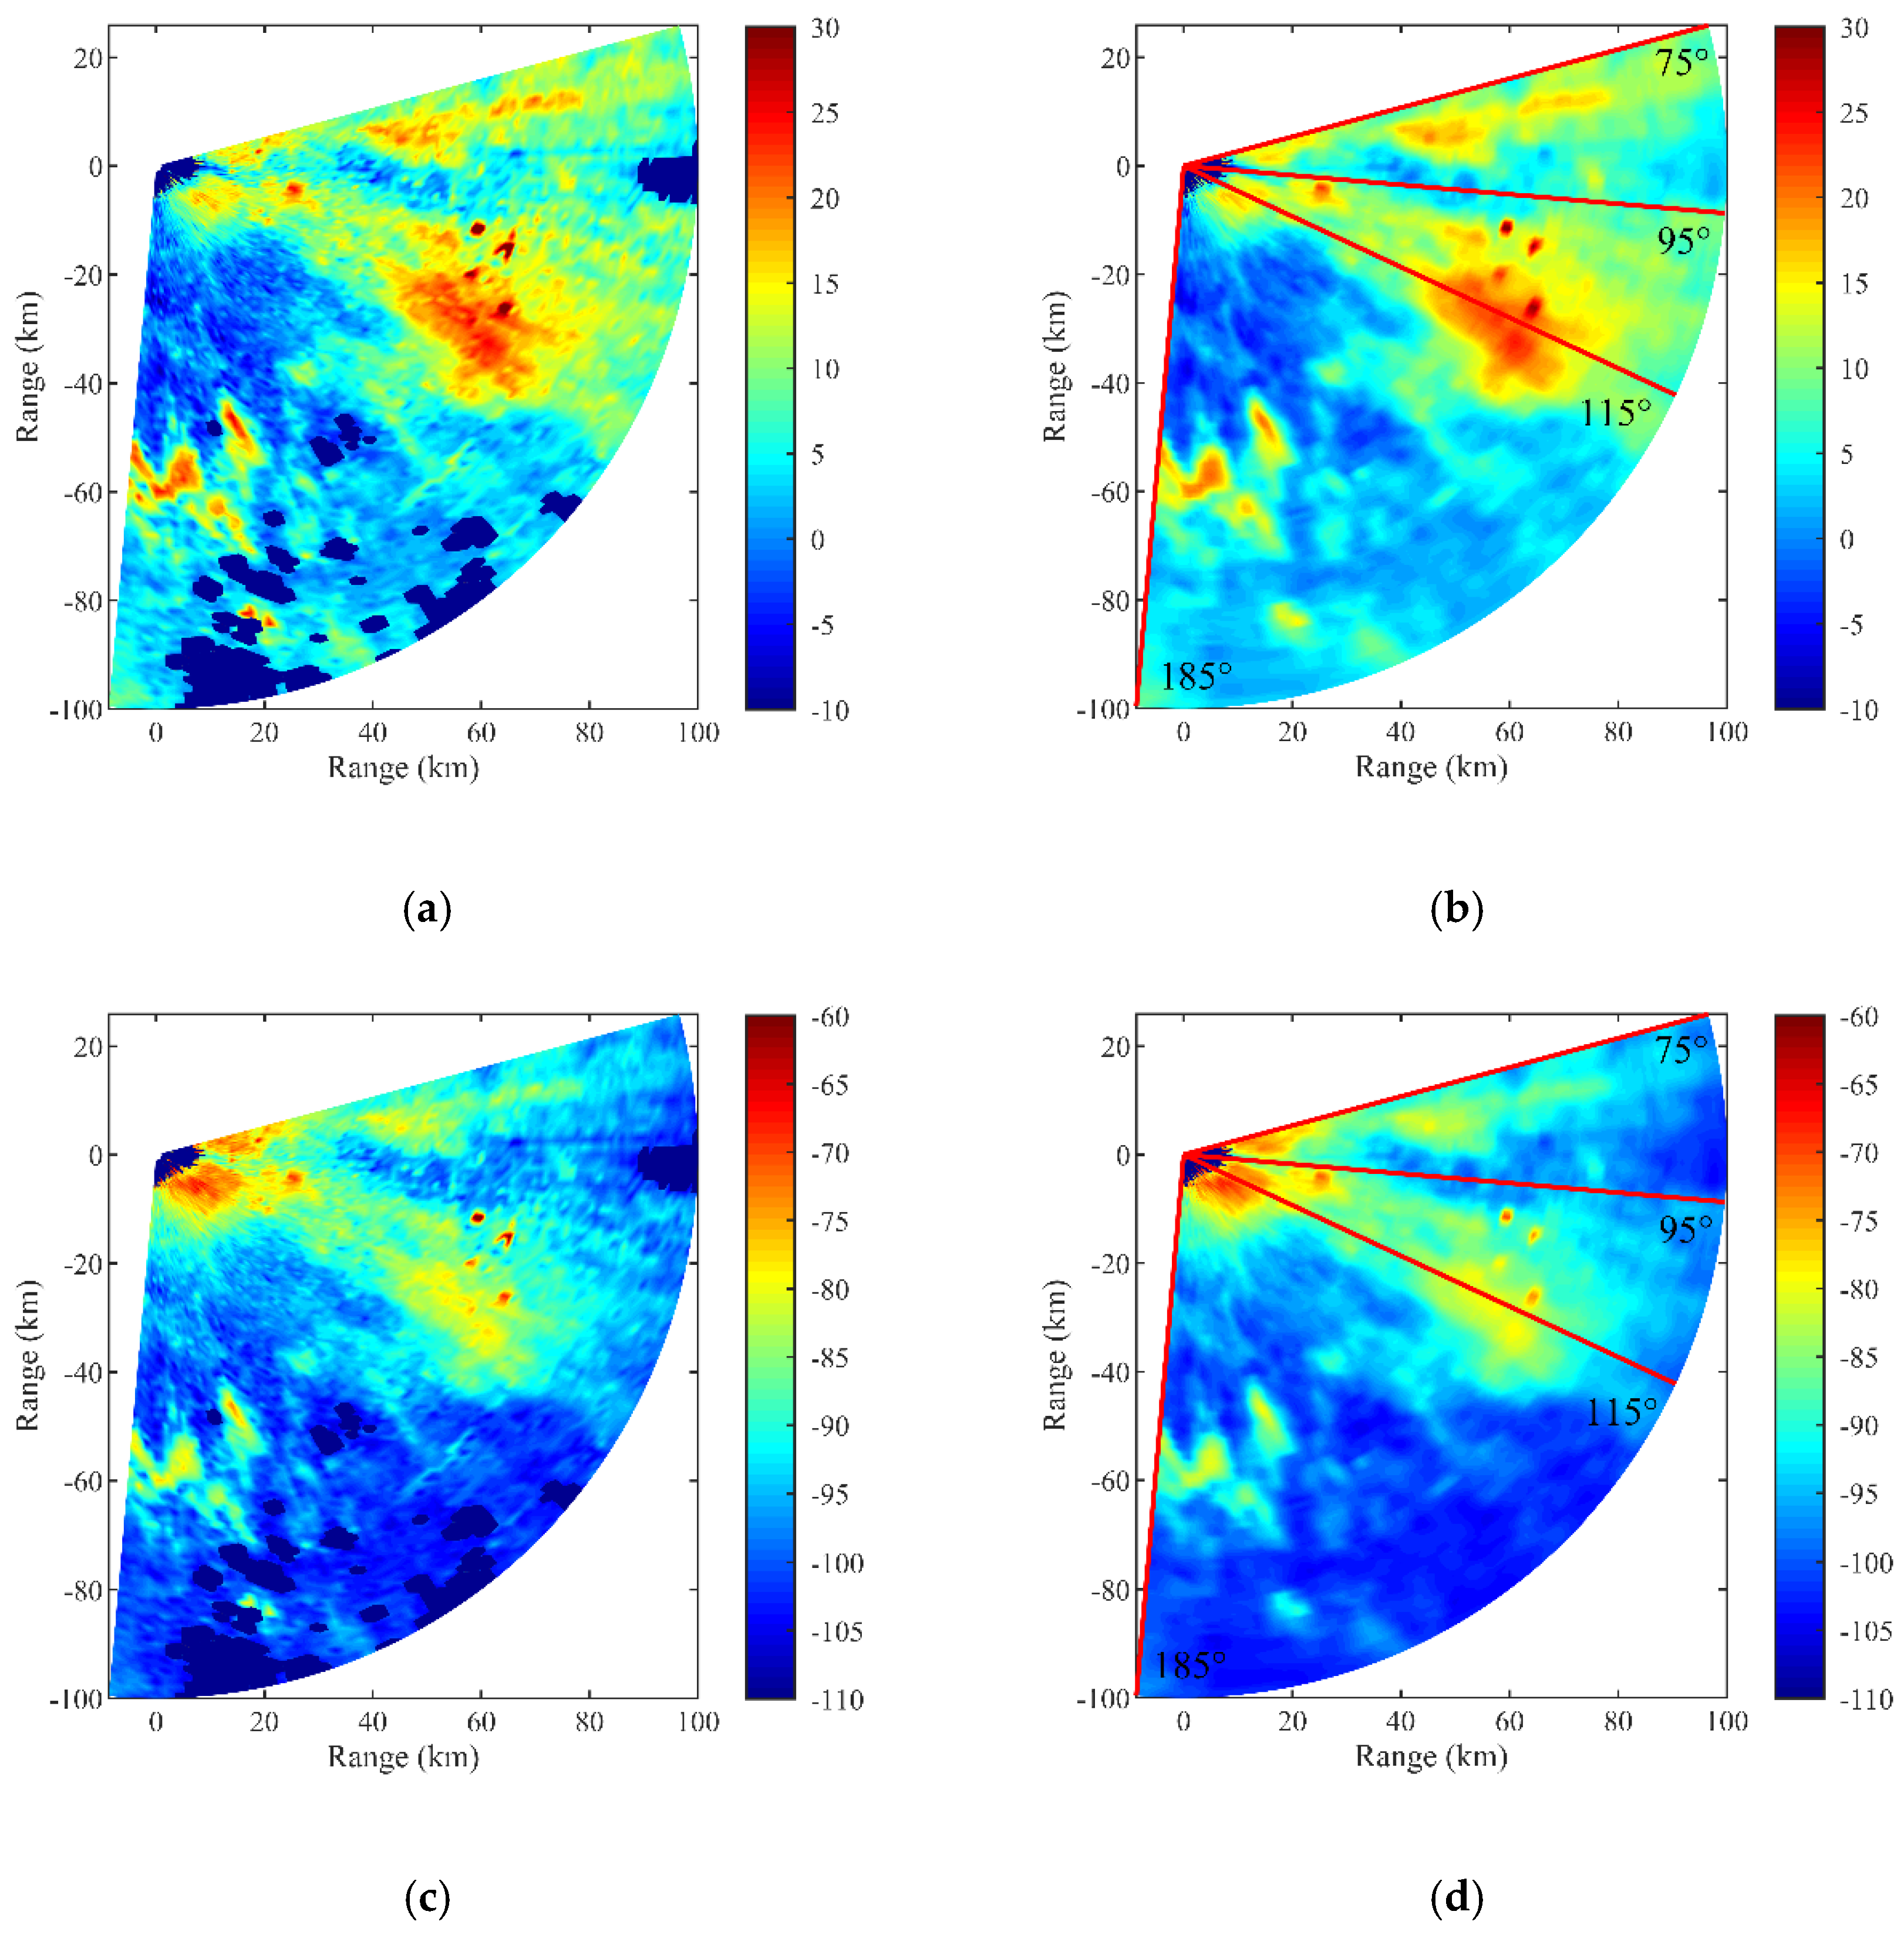
Figure 2a provides a PPI map of the equivalent reflectivity factor measured by the Doppler weather radar located at (120.23° E, 35.99° N) at 12:00 on 18 July 2014 (UTC), and the corresponding PPI map of the echo power calculated by Equation (1) is shown in Figure 2b. The specific parameters of the radar are listed in Table 1. The azimuth angle corresponding to the due north is set as 0°, and the clockwise direction is set as the forward direction of azimuth. Since the focus in this work is solely on the tropospheric duct over the sea and the radar echo data are missing beyond the range of about 100 km, the data between 75° and 185° within a range of 100 km are used for the following inversion process. The PPI maps of the measured equivalent reflectivity factor and corresponding echo power in the inversion region are given in Figure 3a,c respectively, and the data radially distributed in the region are typical radar sea clutter data. To supplement the missing data and reduce the noise caused by the objects on the sea surface such as ships, the data can be processed using median filtering and averaging. The pretreated results are displayed in Figure 3b,d, and the distribution characteristics of the data are well maintained.

3. Numerical Simulation of Tropospheric Duct Based on the WRF Model

3.1. Brief Description of the WRF Model

The Weather Research and Forecasting (WRF) model is a mesoscale numerical weather prediction and atmosphere simulation system designed for research and operational applications, principally developed and maintained by the Mesoscale and Microscale Meteorology (MMM) Division of the National Center for Atmospheric Research (NCAR), the National Centers for Environmental Prediction (NCEP) and the Earth System Research Laboratory (ESRL) of the National Oceanic and Atmospheric Administration (NOAA), along with many other associations and universities [37]. It has been widely used locally and abroad due to its characteristics of full openness, portability, and fast updating.
The WRF system is composed of these major programs [20]: the WRF Preprocessing System (WPS), WRF Data Assimilation (WRFDA), dynamics solvers, and post-processing tools. WPS is used primarily for preprocessing the real data, which includes defining simulation domains, interpolating terrestrial data (such as terrain, landuse, and soiltypes) into the simulation domains, and degribing and interpolating meteorological data from other models into the simulation domains. WRF-DA can be used to ingest observations into the interpolated analyses created by WPS and update the initial conditions of the WRF model. The WRF model solves the dynamic and thermodynamic equations of the atmosphere using a dynamical solver: the Advanced Research WRF (ARW) solver or the Nonhydrostatic Mesoscale Model (NMM) solver. The NMM is usually used for operational forecasts, while the ARW is used in scientific research. In this paper, we use the ARW model, which consists of the ARW solver together with other components of the WRF system compatible with that solver. The ARW model is suitable for applications with the meteorological scales from meters to thousands of kilometers, such as real-time numerical weather prediction, data assimilation, parameterized physics research, etc. The post-processing tools can visualize and verificate the WRF outputs.
Furthermore, some physical schemes that simulate the phenomena unresolved by the dynamical solver are embedded in the WRF model. These phenomena can be of three types: processes that operate on the scales smaller than the WRF grids, e.g., shallow convective clouds; processes involving the exchanges of energy, momentum or water between the atmosphere and another radiation source, e.g., the sun; and processes involving cloud and precipitation physics. The WRF model can offer many implementations for each physical scheme, and allows users to adjust those parameters to satisfy their requirements.

3.2. Modified Refractivity Profile Model for Surface Ducts

The refraction effects on the propagation of electromagnetic waves in the troposphere are usually expressed by the refractivity, N, which can be expressed by the relationship below with the meteorological parameters [38]:
N = 77.6 P T + 3.73 × 10 5 e T 2
where N is in N-units; T (K) is the atmospheric temperature; P (hPa) is the atmospheric pressure; and e (mb) is the vapor pressure. The influence of the earth curvature on the radio wave propagation must be taken into consideration when the radio waves travel a longer distance, e.g., the over-the-horizon transmission. The flat earth coordinate system is introduced to reflect the differences between the curvatures of the radio wave rays and earth more directly, and the modified refractivity M is defined to describe the tropospheric refraction environment:
M = N + 10 6 × h r e
where M is in M-units; h is the height above the earth′s surface; and r e is the earth radius equal to 6371 km.
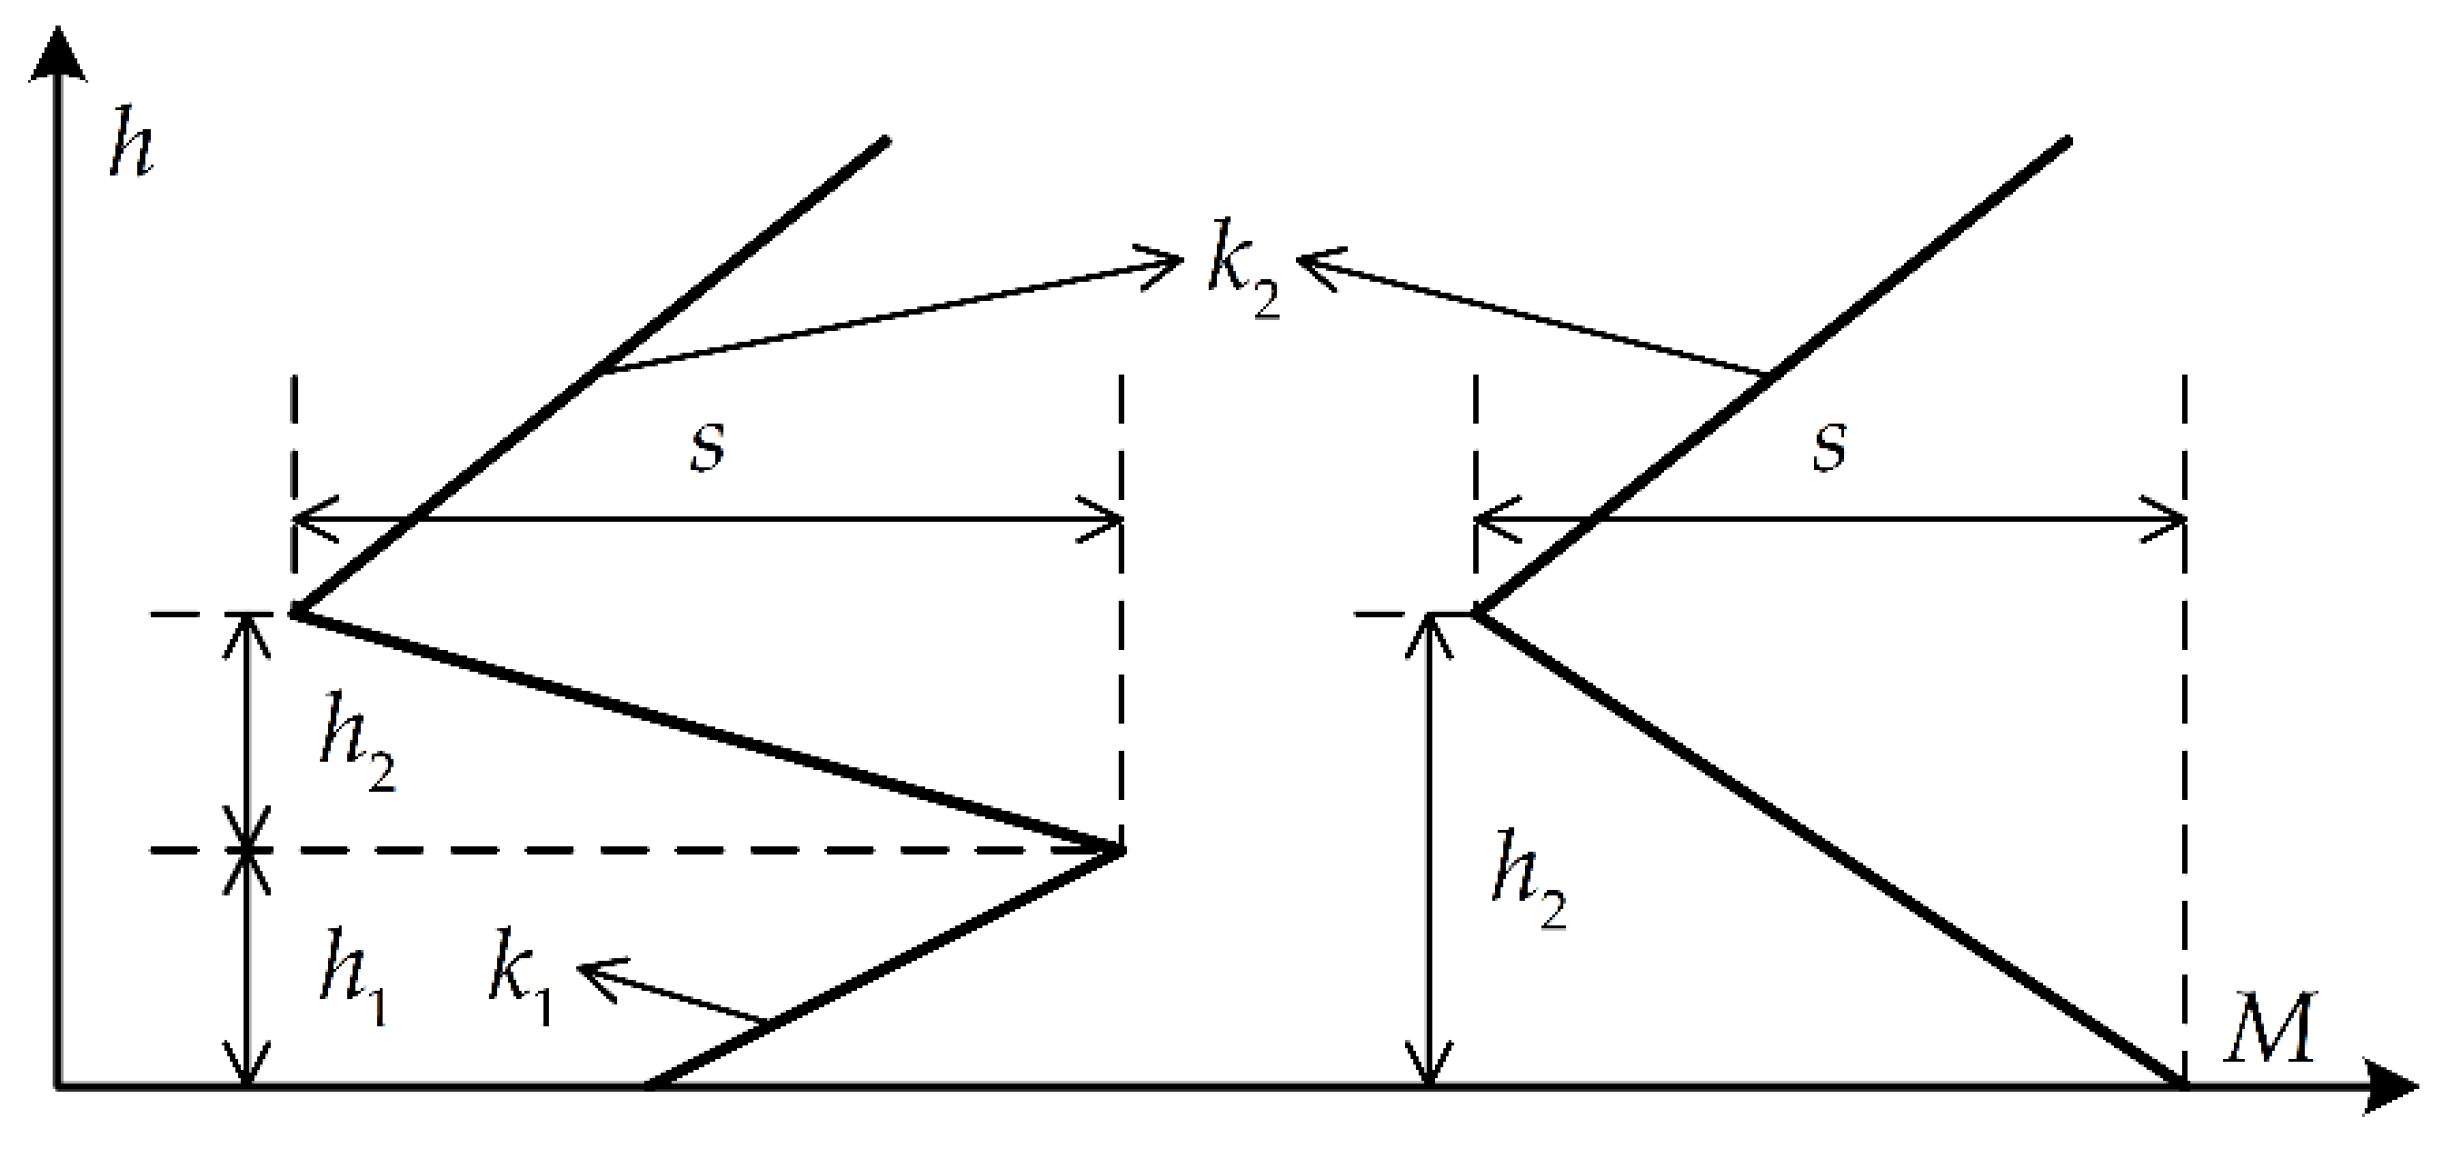
The propagation trajectories of radio waves in the troposphere heavily depend on the refractivity or modified refractivity gradient in the vertical direction. When the vertical modified refractivity gradient is less than 0 M-units/m, the curvatures of radio wave rays will be greater than that of the earth, and then the radio waves will be trapped in the atmospheric stratification which is called troposphere duct to travel forward. To facilitate the applications of radio wave propagation models and the assessments of radio links in engineering, many parameterized models of vertical M profiles have been proposed based on the theoretical derivations and a large number of experimental data. For surface ducts with a base layer, a trilinear model with four parameters is often used to represent the vertical M profile:
M ( h ) = { M 0 + k 1 h 0 h h 1 M 0 + k 1 h 1 + s z 2 ( h h 1 ) h 1 < h h 1 + h 2 M 0 + k 1 h 1 + s + k 2 ( h h 1 h 2 ) h > h 1 + h 2
where h 1 and h 2 are the base layer height and duct layer thickness, respectively; k 1 is the base layer slope; and s is the duct layer strength. M 0 is the modified refractivity at the sea surface, and the modified refractivity slope k 2 above the duct layer is 0.118 M-units/m, which is equal to that in the standard atmosphere. When h 1 is equal to 0 m, the above model will be transformed into that of the surface duct without a base layer. Figure 4 shows the vertical M profile models of the surface duct with or without a base layer.

3.3. Modeling Results of the Tropospheric Duct Parameters

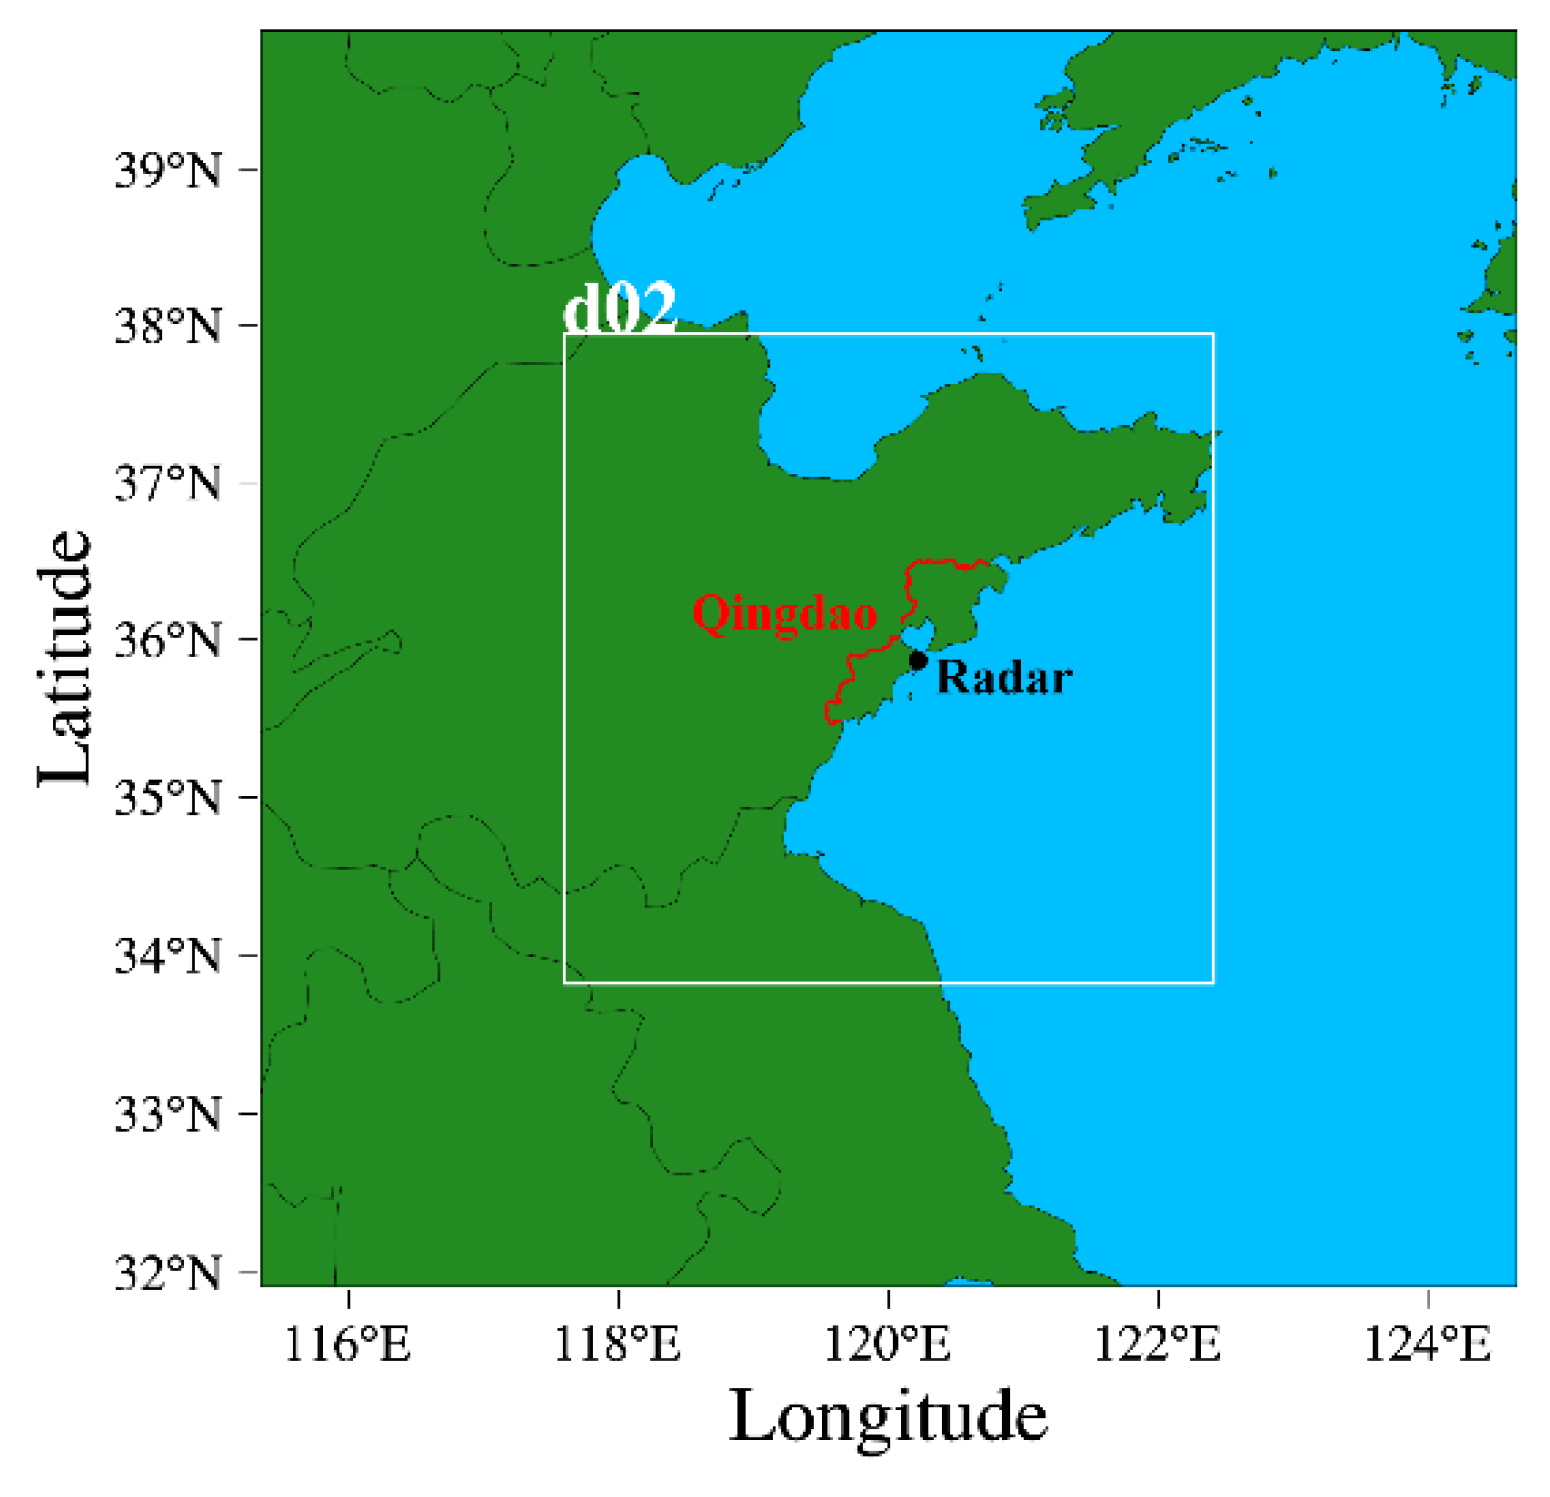
The background and boundary field data used in the WPS are the NCEP FNL (Final) Operational Global Analysis data, which are on a 1-degree by 1-degree grid and are prepared operationally every six hours. The two-domain nested case is adopted in this simulation, as shown in Figure 5, where the central longitude and latitude, dimensions in grid points, and nominal grid distances of the coarse domain are, respectively, (120° E, 36° N), 30 × 30, 30 km × 30 km; and the lower-left corner in the coarse domain, dimensions in grid points, and nominal grid distances of the fine domain are, respectively, (8, 8), 46 × 46, 10 km × 10 km. In the WRF, the number of eta levels is 44, and the total run length is 24 h with the integration time step of 60 s from 00:00 on 18 July to 00:00 on 19 July 2014, in UTC. As to the physics options, the microphysical process is the Lin et al. scheme; the longwave radiation is the RRTMG scheme; the shortwave radiation is the RRTMG shortwave scheme; the cumulus parameterization is the Kain-Fritsch scheme; the planetary boundary layer is the Yonsei University scheme; the others are the defaults.
Based on the WRF model, we can obtain the regional distribution of the tropospheric duct in the sea area of interest. Firstly, the spatial distributions of the meteorological parameters (atmospheric temperature, pressure, and relative humidity) required to calculate the modified refractivity can be extracted from the outputs of the WRF model. Then, the spatial distributions of the modified refractivity can be calculated by Equations (4) and (5). Finally, the duct parameters can be derived from the definition of tropospheric duct or the parameterized models of vertical M profiles, i.e., Equation (6).
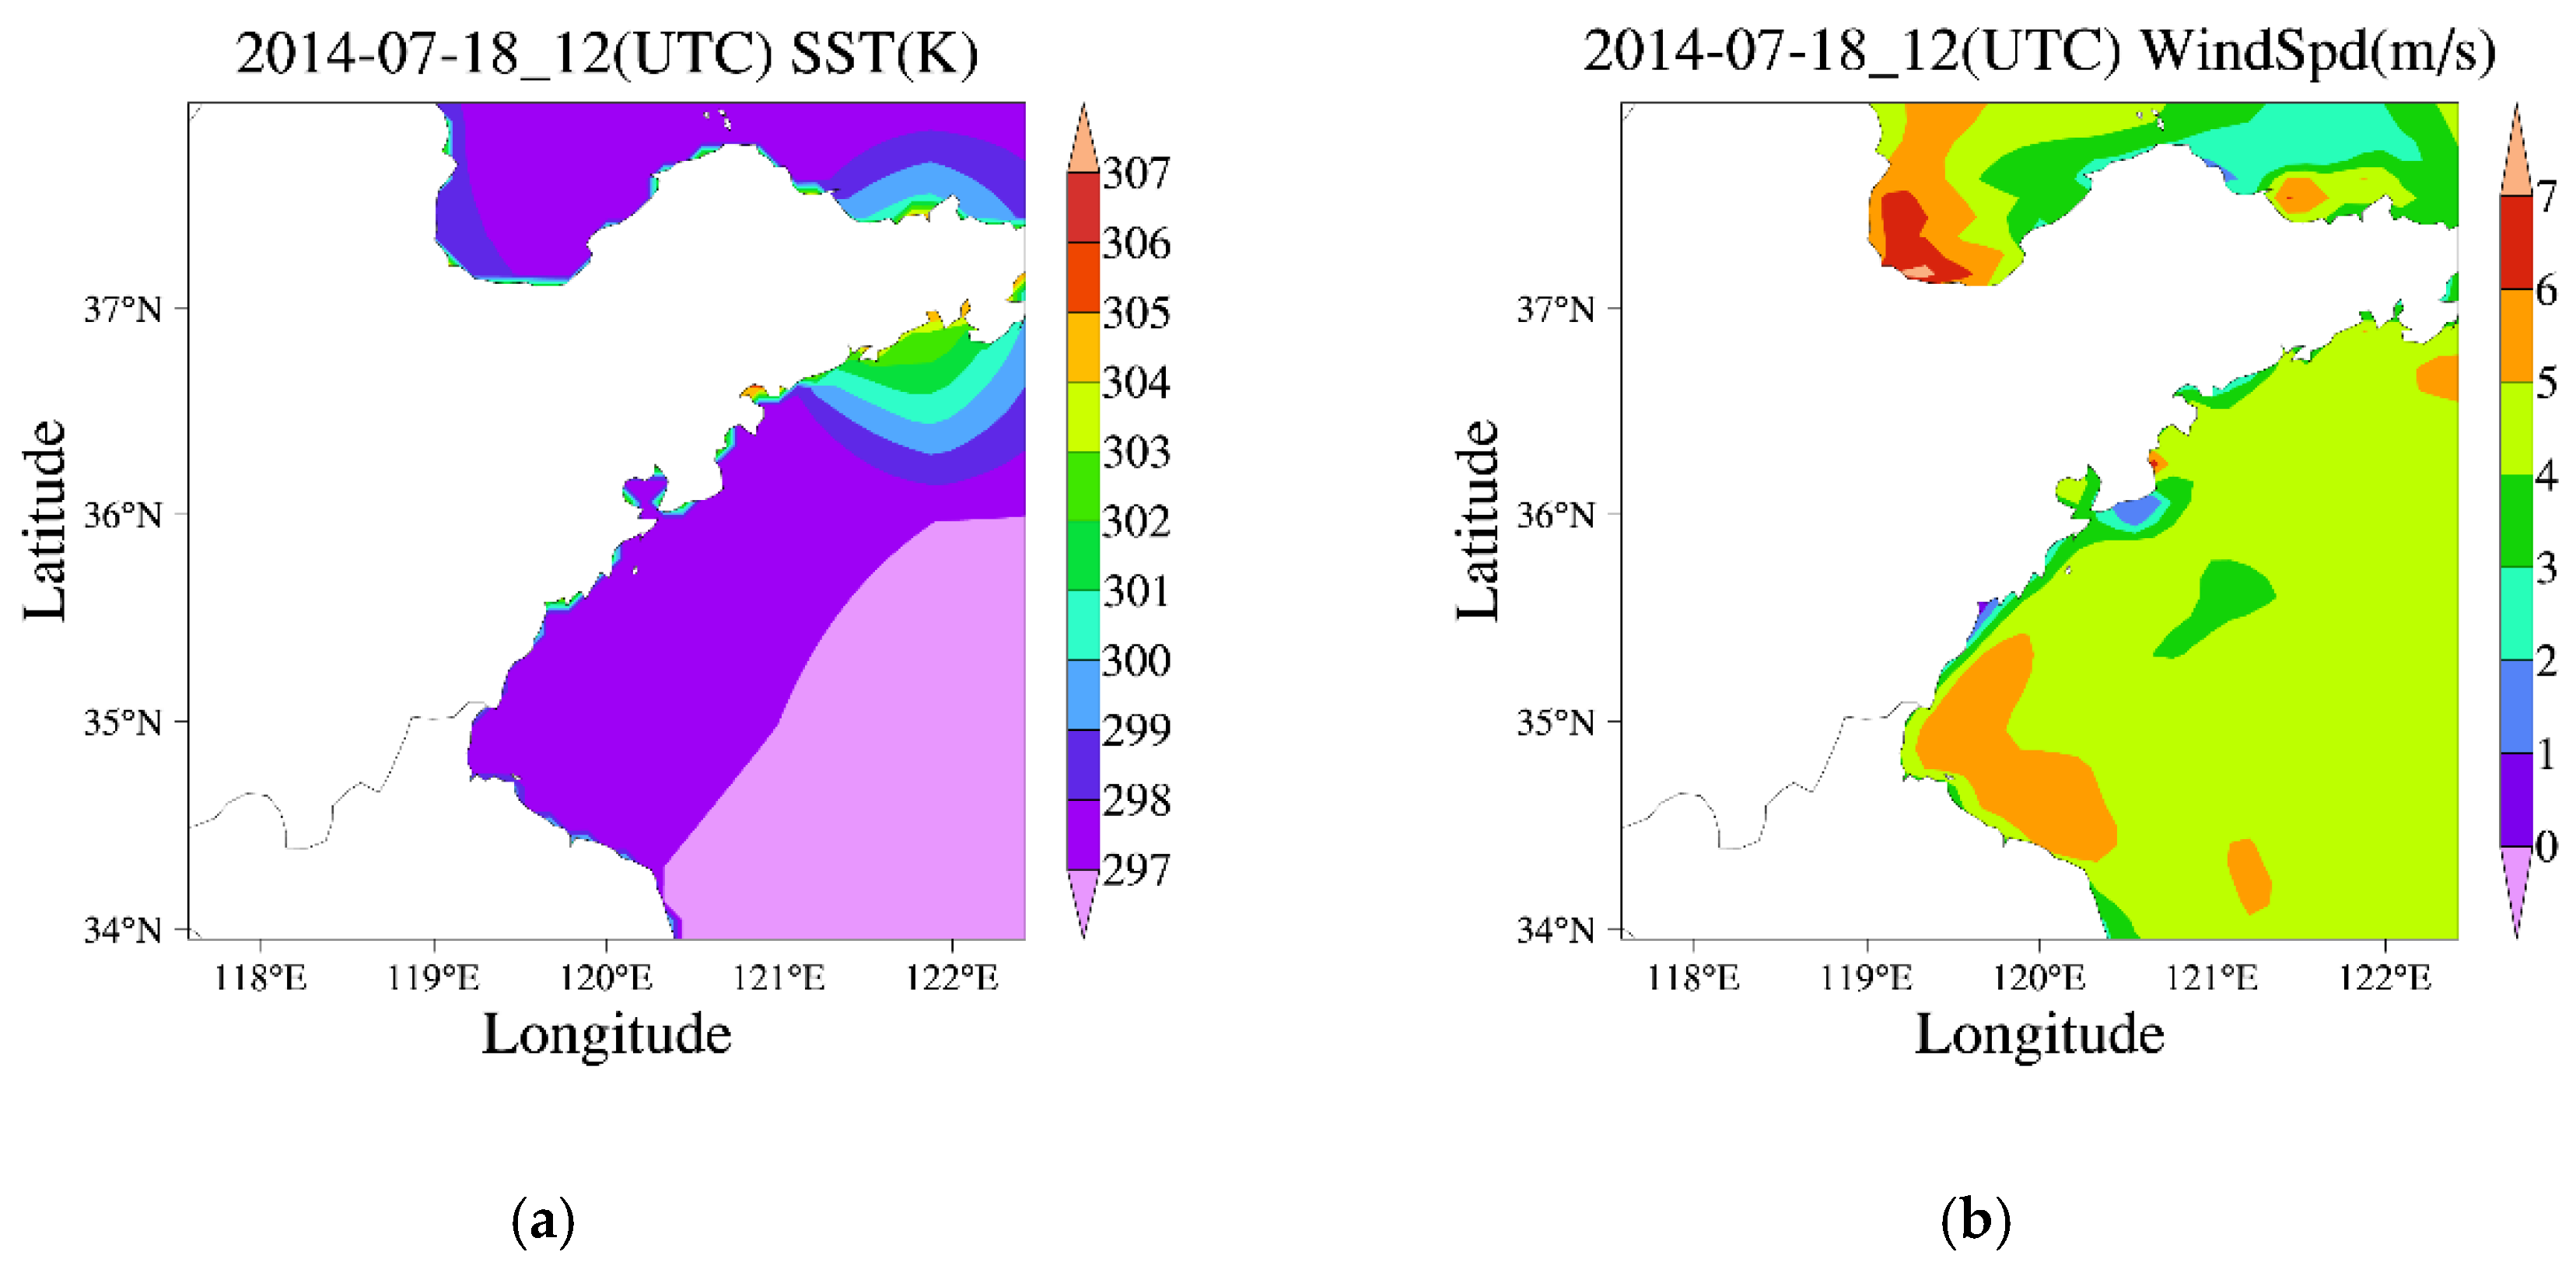
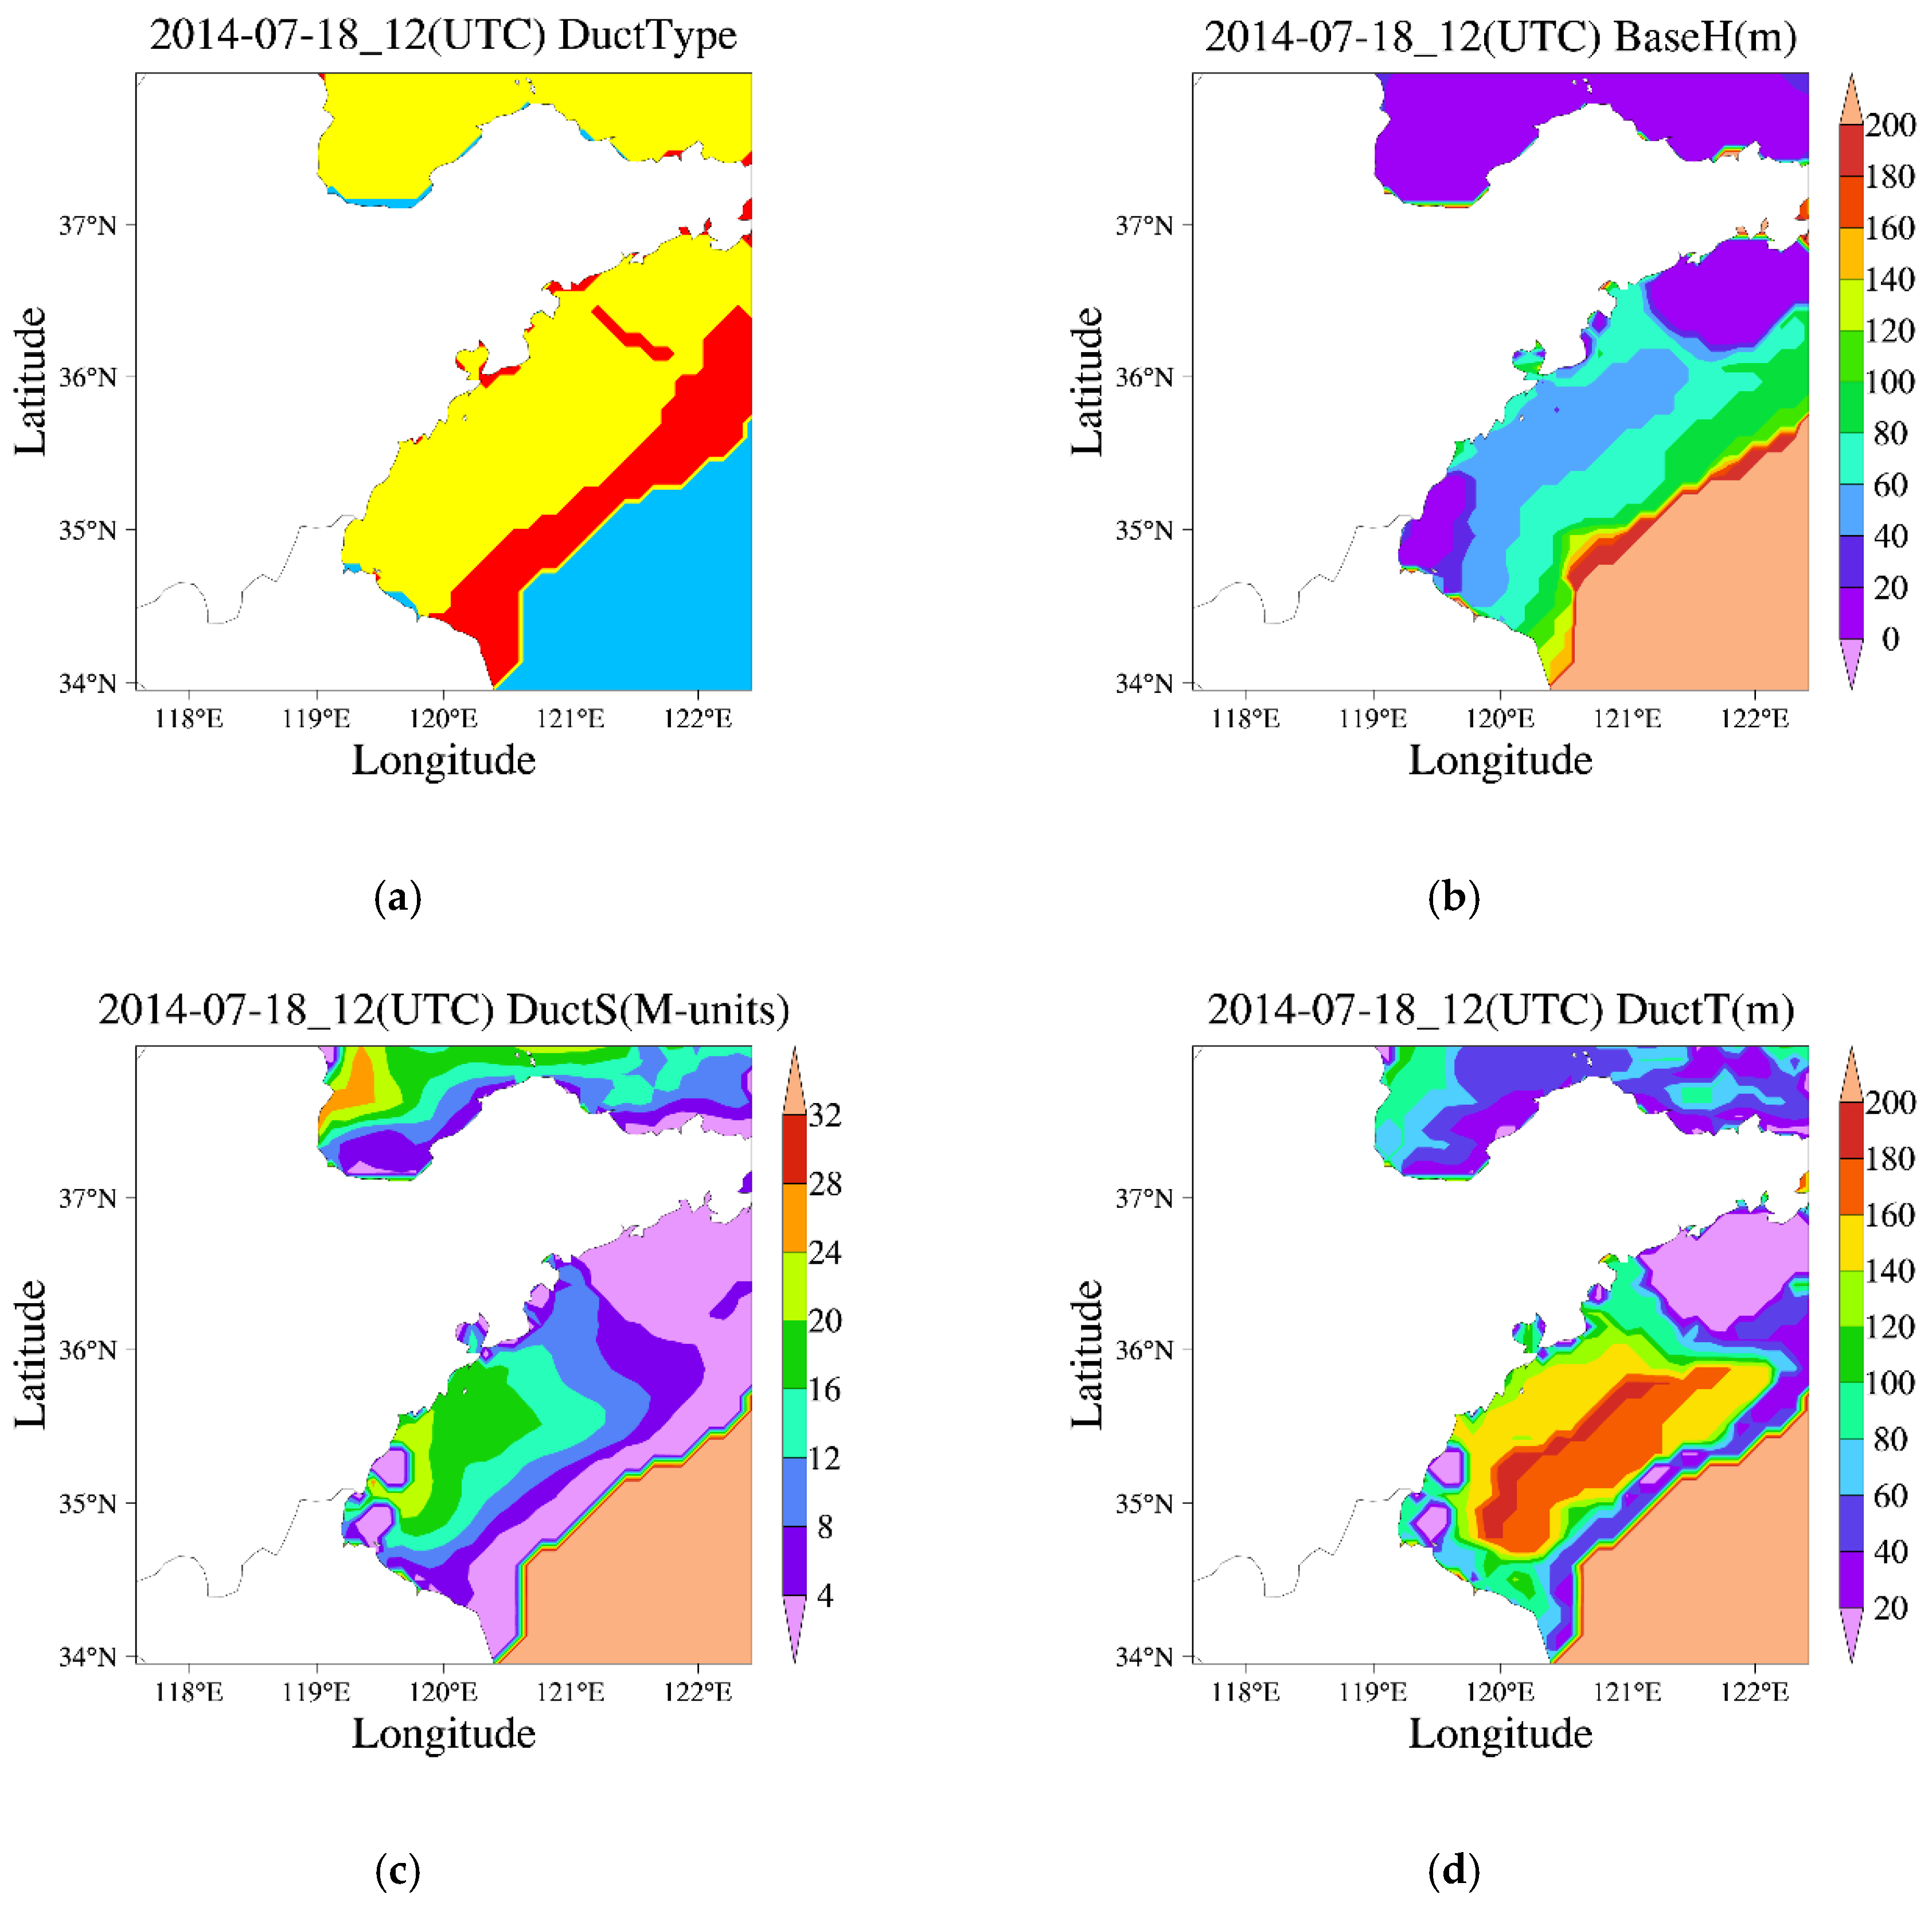
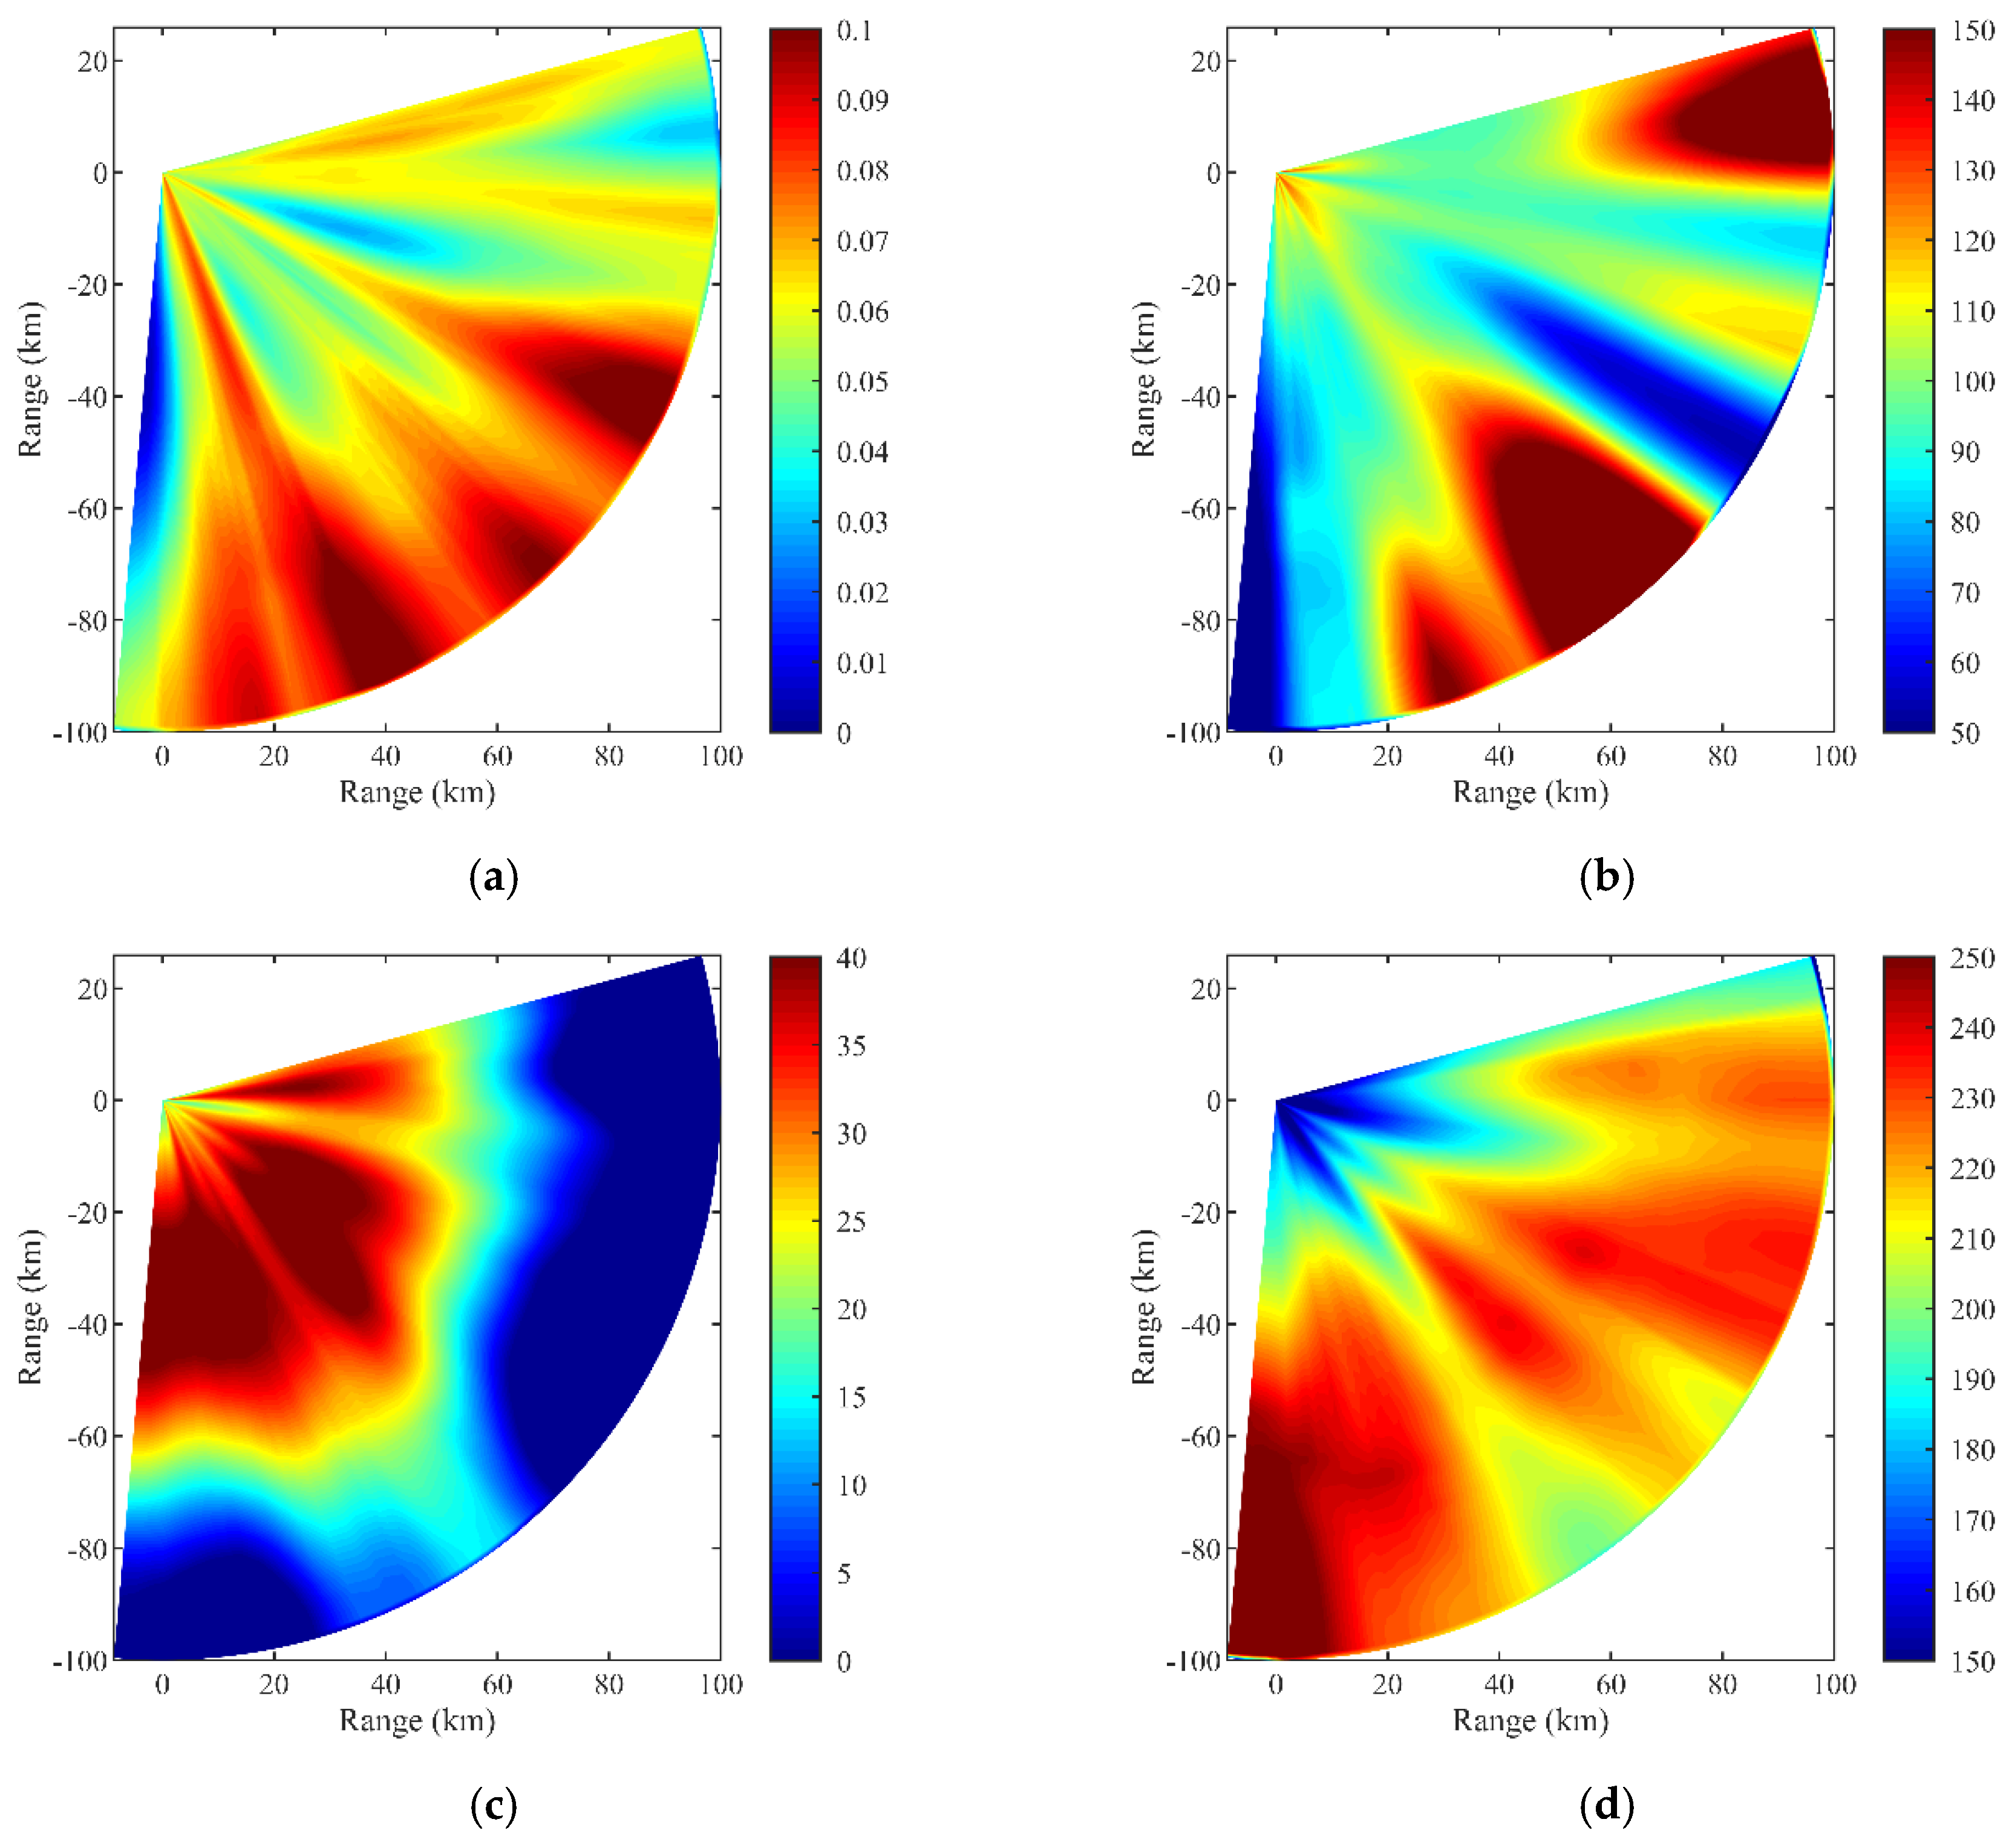
The simulated distributions of the necessary oceanic, atmospheric and tropospheric duct parameters in the fine domain (the region with the center in Qingdao and radius of about 200 km) at 12:00 on 18 July 2014 (UTC), are given in Figure 6 and Figure 7 separately, and only the data on the sea concentrated on in this work are displayed. Since the roughness and backscattering coefficient of the sea surface are related to the wind speed and the impedance characteristic is related to the sea surface temperature (SST), only the two oceanic and atmospheric parameters are provided in Figure 6. The changes in wind speed and SST are slight, in which the wind speed varies primarily from 3 m/s to 5 m/s (the Douglas Sea State is 2) and the SST is about 297 K. From Figure 7a, it can be seen that the surface duct with a base layer (the yellow region) has a wide distribution over the sea near Qingdao, and the main duct parameters, including the base layer height, duct layer strength, and duct layer thickness, are shown in Figure 7b–d, where the duct layer strength decreases and the duct layer thickness increases in the direction away from the land. The detailed values of these duct parameters extracted from the WRF outputs can be used as the initial guesses in the following inversion process.
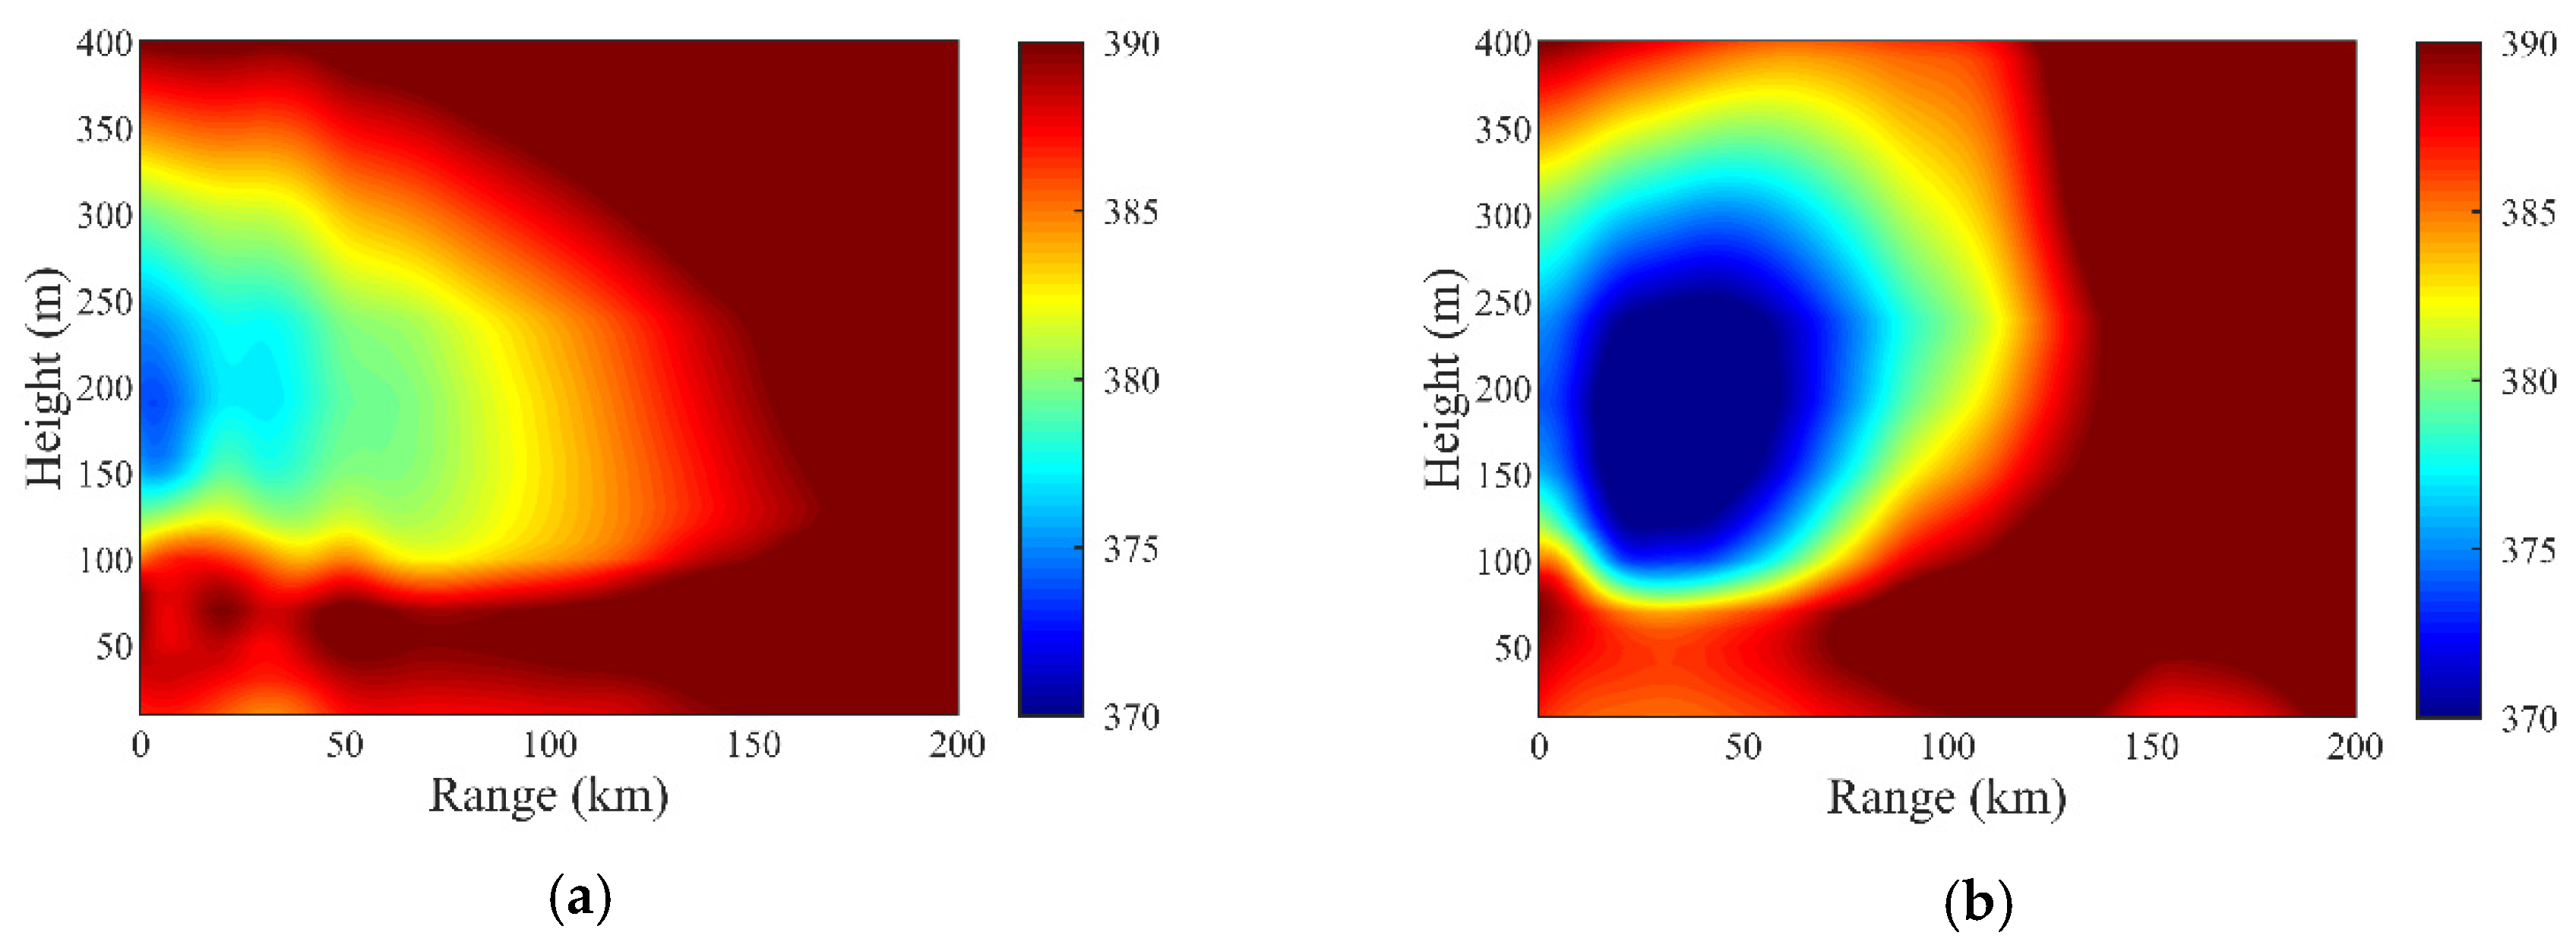
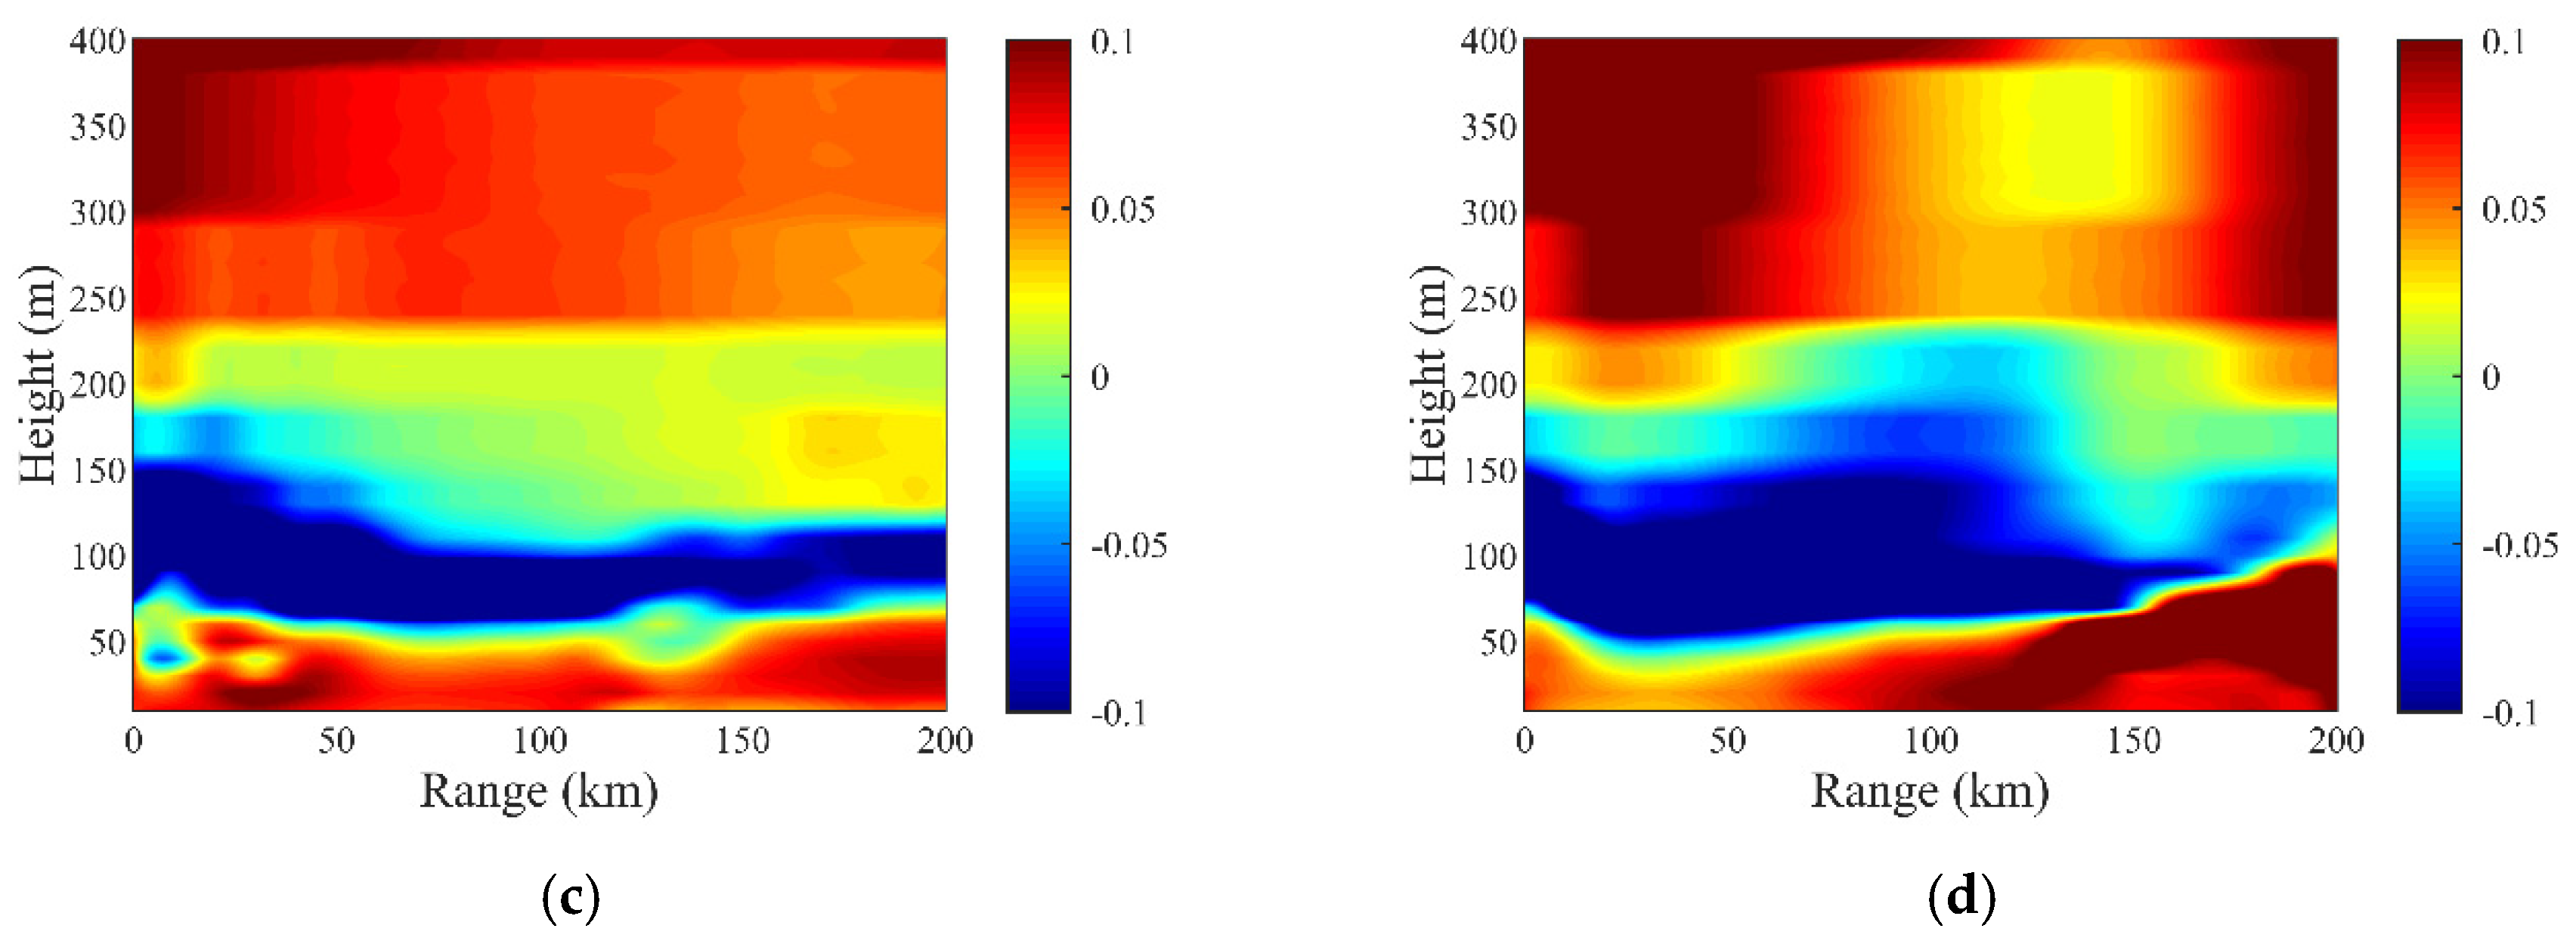
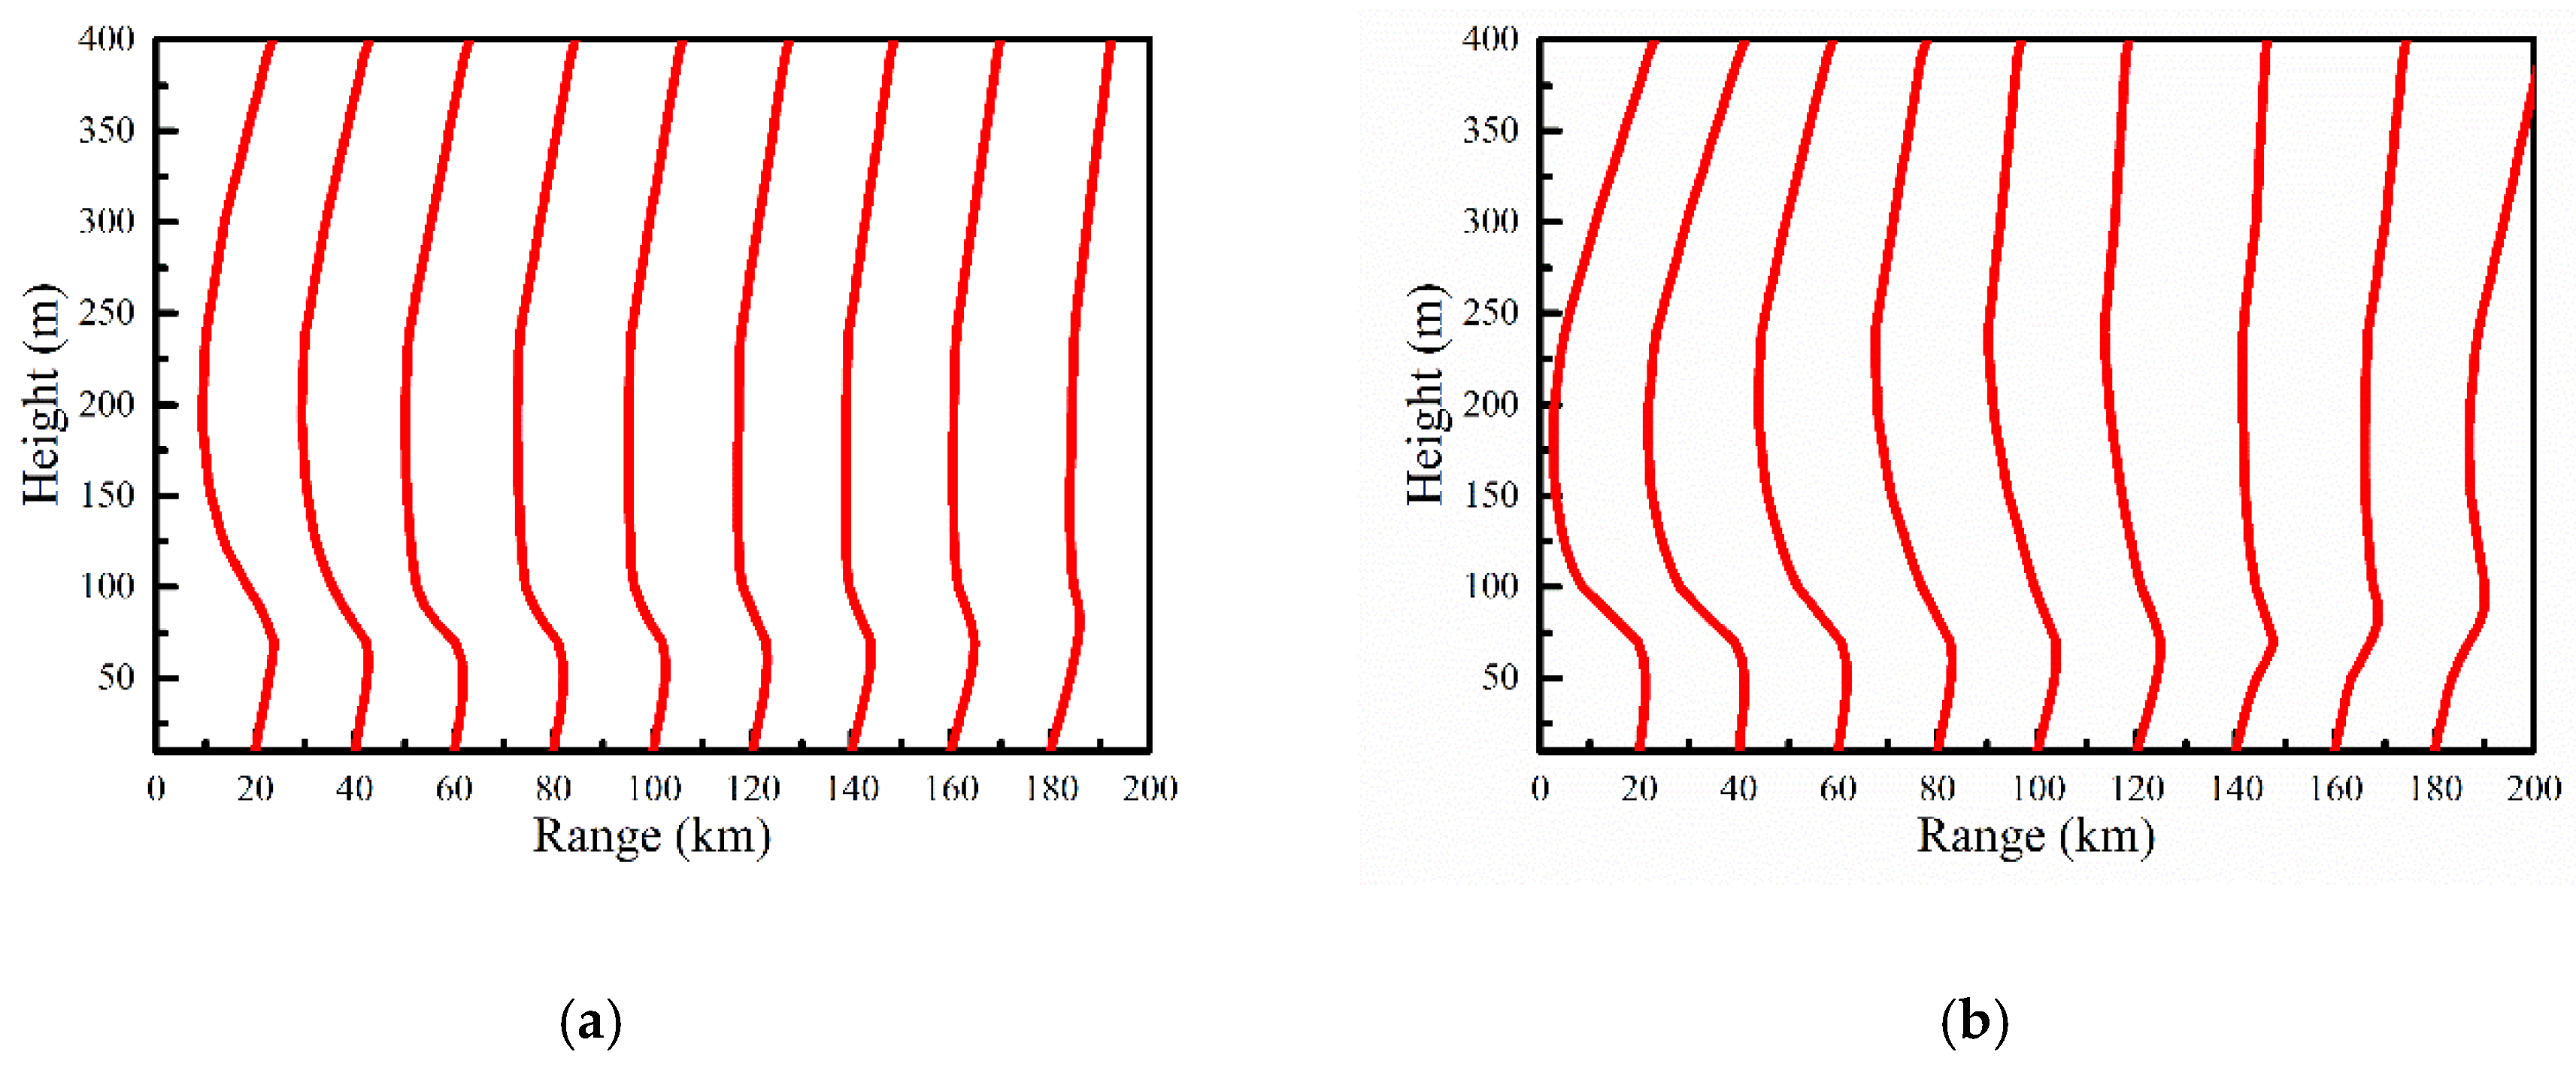
Figure 8 shows the modified refractivity and modified refractivity gradient distributions in the eastern and southern directions from Qingdao, and the corresponding M profiles are provided in Figure 9. Consistent with that shown in Figure 7, there is a duct layer. The duct layer strength and thickness are inhomogeneous in the radial and azimuth directions. Additionally, the duct layer thickness in the east is much thicker than that in the south. A more intuitive understanding of the variations in M profiles with the range can be obtained in Figure 9.

4. Inversion Model of the Regional Range-Dependent Surface Duct with a Base Layer

4.1. Sea Clutter Power

The received echo power can be evaluated by the radar weather equation, but the sea clutter power used in the inversion model of tropospheric duct must be reconstructed separately. Considering the loss caused by the tropospheric duct, the sea clutter power can be written as [39]
P c = 4 π P t G 2 σ λ 2 L 2
where σ refers to the backscattering cross-section of the sea surface, which can be denoted as the product of the backscattering coefficient σ 0 and scattering area A , and can be estimated by empirical models. The scattering area at grazing incidence θ g can be approximately expressed as [39]
A s = R φ c τ 2 cos θ g
where R is the distance between the radar antenna and sea surface. L is the one-way path loss between the radar antenna and sea surface, which can be calculated using the PE method [40], as follows:
L = ( 4 π ) 2 R λ 2 | u | 2
where u is the PE reduced field at the significant wave height.

4.2. Horizontal Inhomogeneity of Duct Parameters

The range-independent duct parameters can be inversed based on the parameterized model of the vertical M profile, and the horizontal inhomogeneity of the M profiles should be also parameterized to invert the range-dependent duct parameters. The most commonly used method to characterize the horizontal inhomogeneity is the PCA based on K-L transformation which can remove the relativity among components of a high-dimensional random variable to generate a complete orthogonal coordinate system and then extracts the base vectors which maintain the principal characteristics of the random variable to reconstruct a low-dimensional coordinate system.
The regional distributions of duct parameters are determined by the meteorological element fields and have the features of Markov chains. The variation of a duct parameter with the horizontal distance can be expressed as a Markov chain [32,41] D:
D = [ d 0 , , d i , ]
d i + 1 = d i + η
where d 0 and d 0 represent the parameter values at the initial and i-th step, respectively; η is a random variable that satisfies the Gaussian distribution with the average value of 0 and variance of σ 2 . The covariance matrix of a Markov chain can be evaluated by the sample matrix that consists of many Markov chain samples. Since the average values would be subtracted from the Markov chain samples, d 0 can be provisionally assumed to be zero. Then the covariance matrix C can be written as the following expression after the diagonalization:
C = Q Λ Q T
where Λ is a diagonal matrix that consists of the eigenvalues, and Q is an orthogonal matrix that consists of the eigenvectors. The eigenvalues represent the significances when a multi-dimensional random variable is expressed by the eigenvectors. The variations of eigenvectors with range are similar to the sine functions. The smaller the eigenvalue, the higher the “frequency” of the eigenvector. However, only several eigenvectors with larger eigenvalues need to be chosen to express a multi-dimensional random variable in the actual case. The number of eigenvectors can be determined by the contribution rate of eigenvalues (the ratio of the eigenvalue sum of the selected eigenvectors to that of all the eigenvectors), and the contribution rate of the first two largest eigenvalues is greater than 90%. The selected eigenvectors are called principal components and form a new eigenvector matrix. The Markov chain sample, i.e., the duct parameter vector, can be expressed by these principal components as follows:
d ( x ) = d 0 + i = 1 N c i v i ( x )
where x is the horizontal distance; N is the number of principal components; v i ( x ) is the i-th principal component; c i is a random variable that satisfies the uniform distribution within the range from λ i to λ i , and λ i is the i-th eigenvalue.
It can be proved that the eigenvectors are just related to the number of range steps and the eigenvalues are proportional to the variance σ 2 . Since the number of range steps is a preset constant, the eigenvectors and eigenvalues need to be calculated only once when σ 2 is assumed to be 1. As described in Section 3.2, the vertical M profile of surface duct with a base layer can be represented by a trilinear model with four parameters, such as the base layer height and slope, duct layer strength and thickness. To make the inversion process easy, every parameter vector is expressed by two principal components and the value in the initial step, i.e., there are twelve parameters in all that need to be inversed, and the initial inversed values of these parameters can be extracted from the WRF outputs.

4.3. Inversion Process

The PSO algorithm is a very efficient tool for solving the inversion problem of duct parameters due to its simple and intelligent features. The PSO algorithm, which was put forward by studying the foraging behavior of birds during flight is a method for optimizing the swarm through the collaboration between individuals. The swarm is comprised of many particles, every of which has its own position and velocity vectors. The position vector of every particle is a possible solution to the global optimization problem, and the good and bad of which is evaluated by the fitness value calculated based on the objective function. The initial position and velocity vectors of the particles are usually generated randomly, and the optimal result is obtained through the following iterative process.
It is assumed that the dimension of the solution space is N and the swarm size is M; the position, velocity, historical optimal position of the i-th particle and the historical optimal position among the particles are presented as z i , v i , p i , and p i , respectively. The velocity and position vectors of the particles are updated in each iteration through the rules below [35]:
v i j k + 1 = w v i j k + c 1 r 1 ( p i j z i j k ) + c 2 r 2 ( p g j z i j k )
z i j k + 1 = z i j k + v i j k + 1
where i = 1 , 2 , , M and j = 1 , 2 , , N ; k is the current generation number; w is the inertia factor; c 1 and c 2 are the learning factors, which represent the learning levels of the historical optimal positions of its own and the particle swarm; r 1 and r 2 are random numbers that satisfy the uniform distribution within the range from 0 to 1, which are used to maintain the swarm diversity. In this paper, the particle whose initial position vector is extracted from the WRF outputs must be included in the swarm. Additionally, the parameter settings of the PSO method are: N = 12; M = 100; c 1 = 2; c 2 = 2; maximum generation number K = 20; w = 0.8 − 0.6 × k/K.
For the inversion of tropospheric duct based on sea clutters, the power relative to that at the initial position of the inversion region is usually adopted in the objective function. The objective function is used to evaluate the overall difference between the simulated and observed power of sea clutters, and the most commonly applied one is based on the least-squares criterion, as follows:
f = x = x min x max [ P c sim ( x ) P c obs ( x ) + P c obs ( x min ) P c sim ( x min ) ] 2
where P c sim and P c obs are the simulated and observed power of sea clutters respectively; and x min and x max are the minimum and maximum distance from the radar in the inversion region respectively. In this paper, x min and x max are 20 km and 100 km, respectively, and the inversion process is run firstly along the radial direction from the azimuth of 75° to 185° with an interval of 1°. Then the final regional distributions of the duct parameters are obtained through the smoothing process in the azimuth direction, and the results are presented in the next section.

5. Results and Discussion

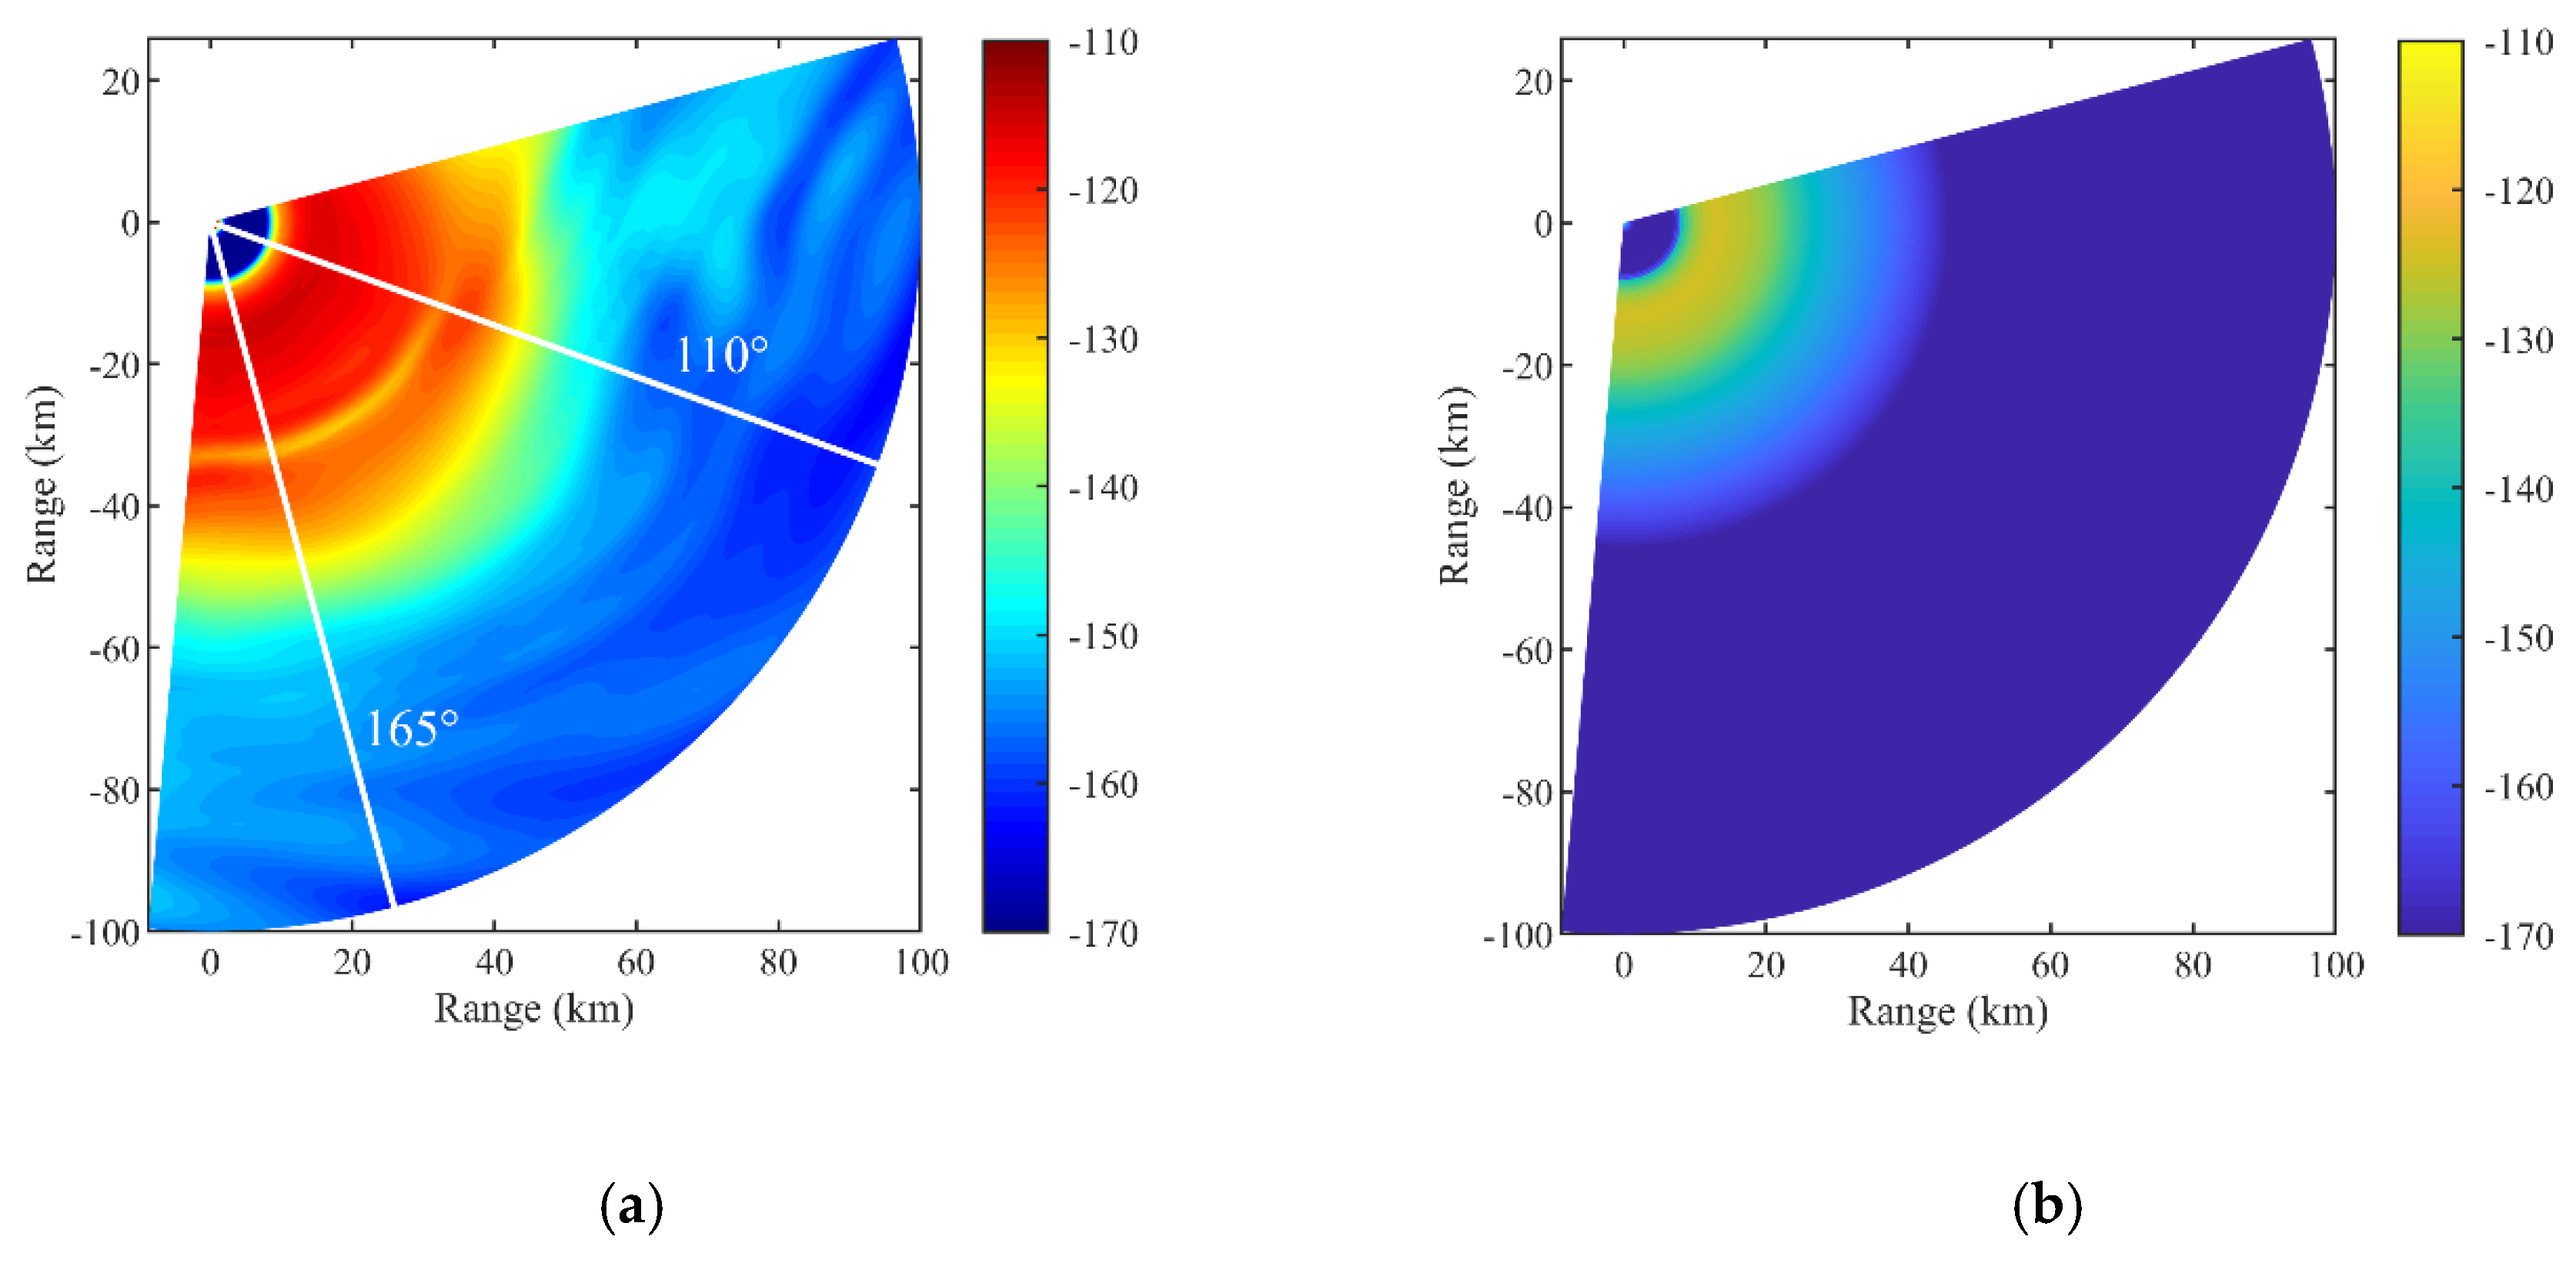
The simulated result of the echo power using the radar parameters in Table 1 and the M profiles from the WRF model is given in Figure 10a, and there are significant radar echoes in comparison with that in the standard atmosphere, as shown in Figure 10b. Especially in the region from 110° to 165°, the echo power is higher and extends further in distance up to about 70 km, mainly because a duct layer with greater strength and thickness exists in this region, as shown in Figure 7. The M profiles from the WRF model have a certain reference value for the estimation of tropospheric duct parameters.
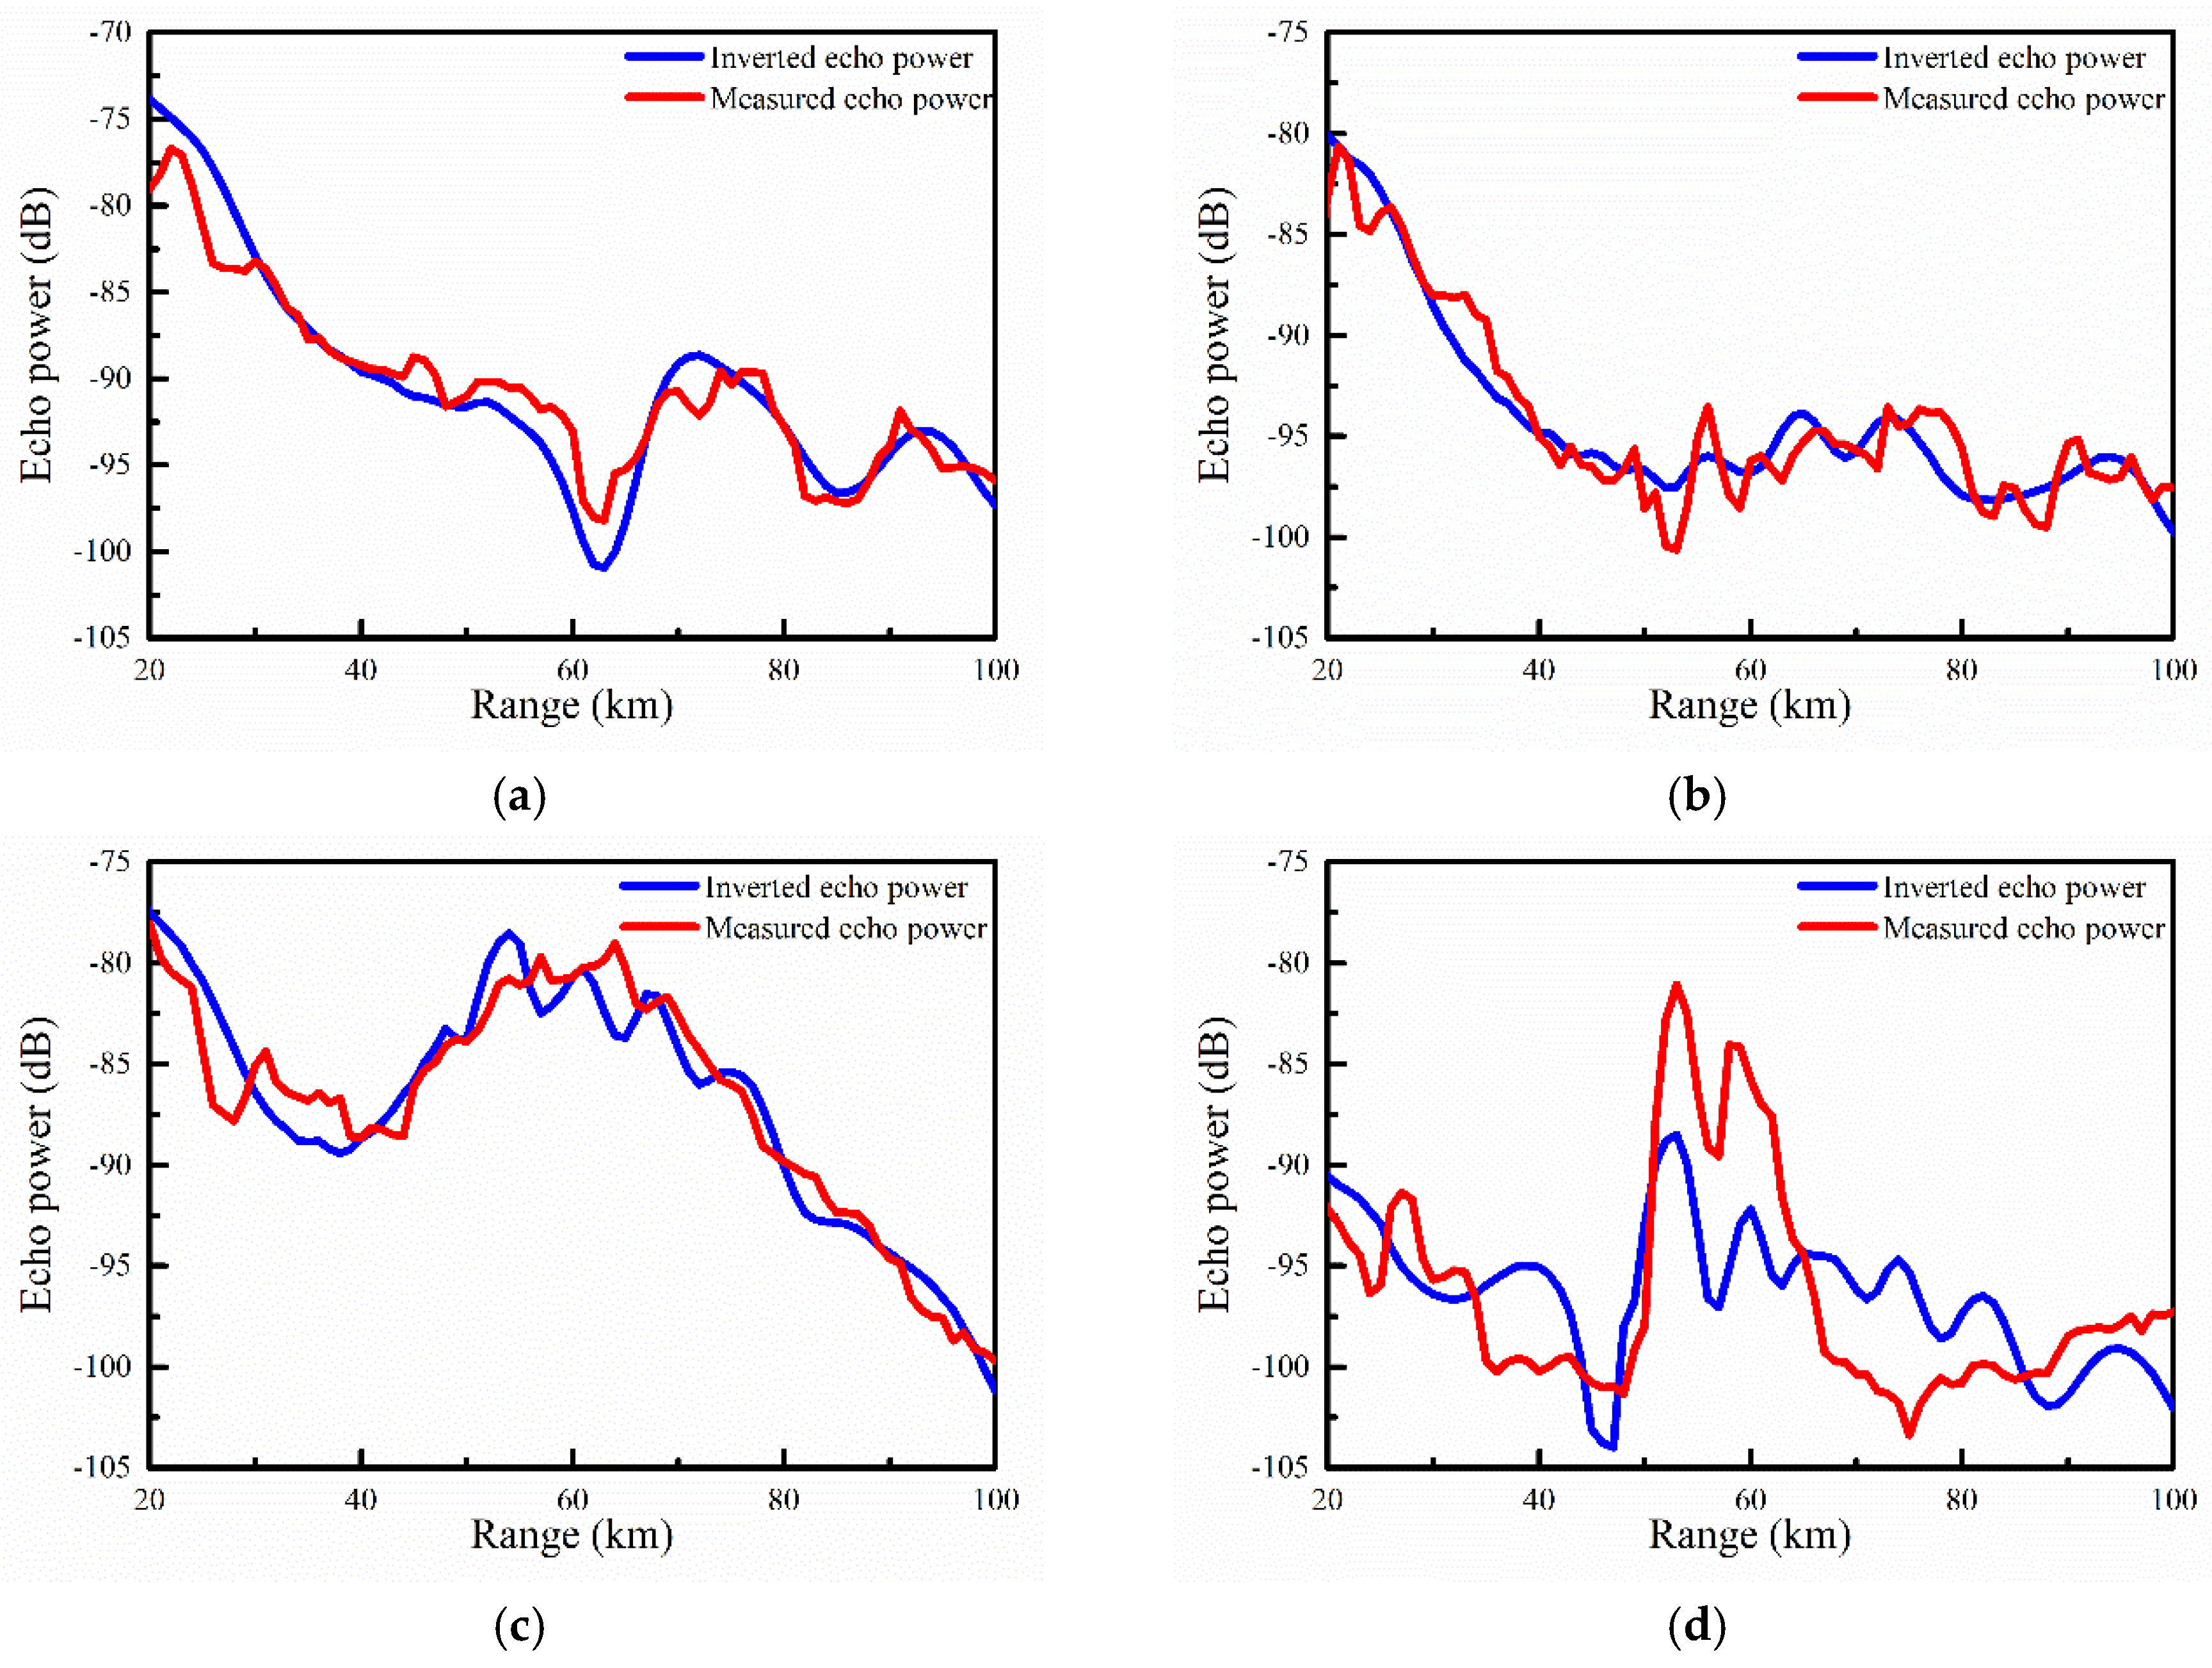
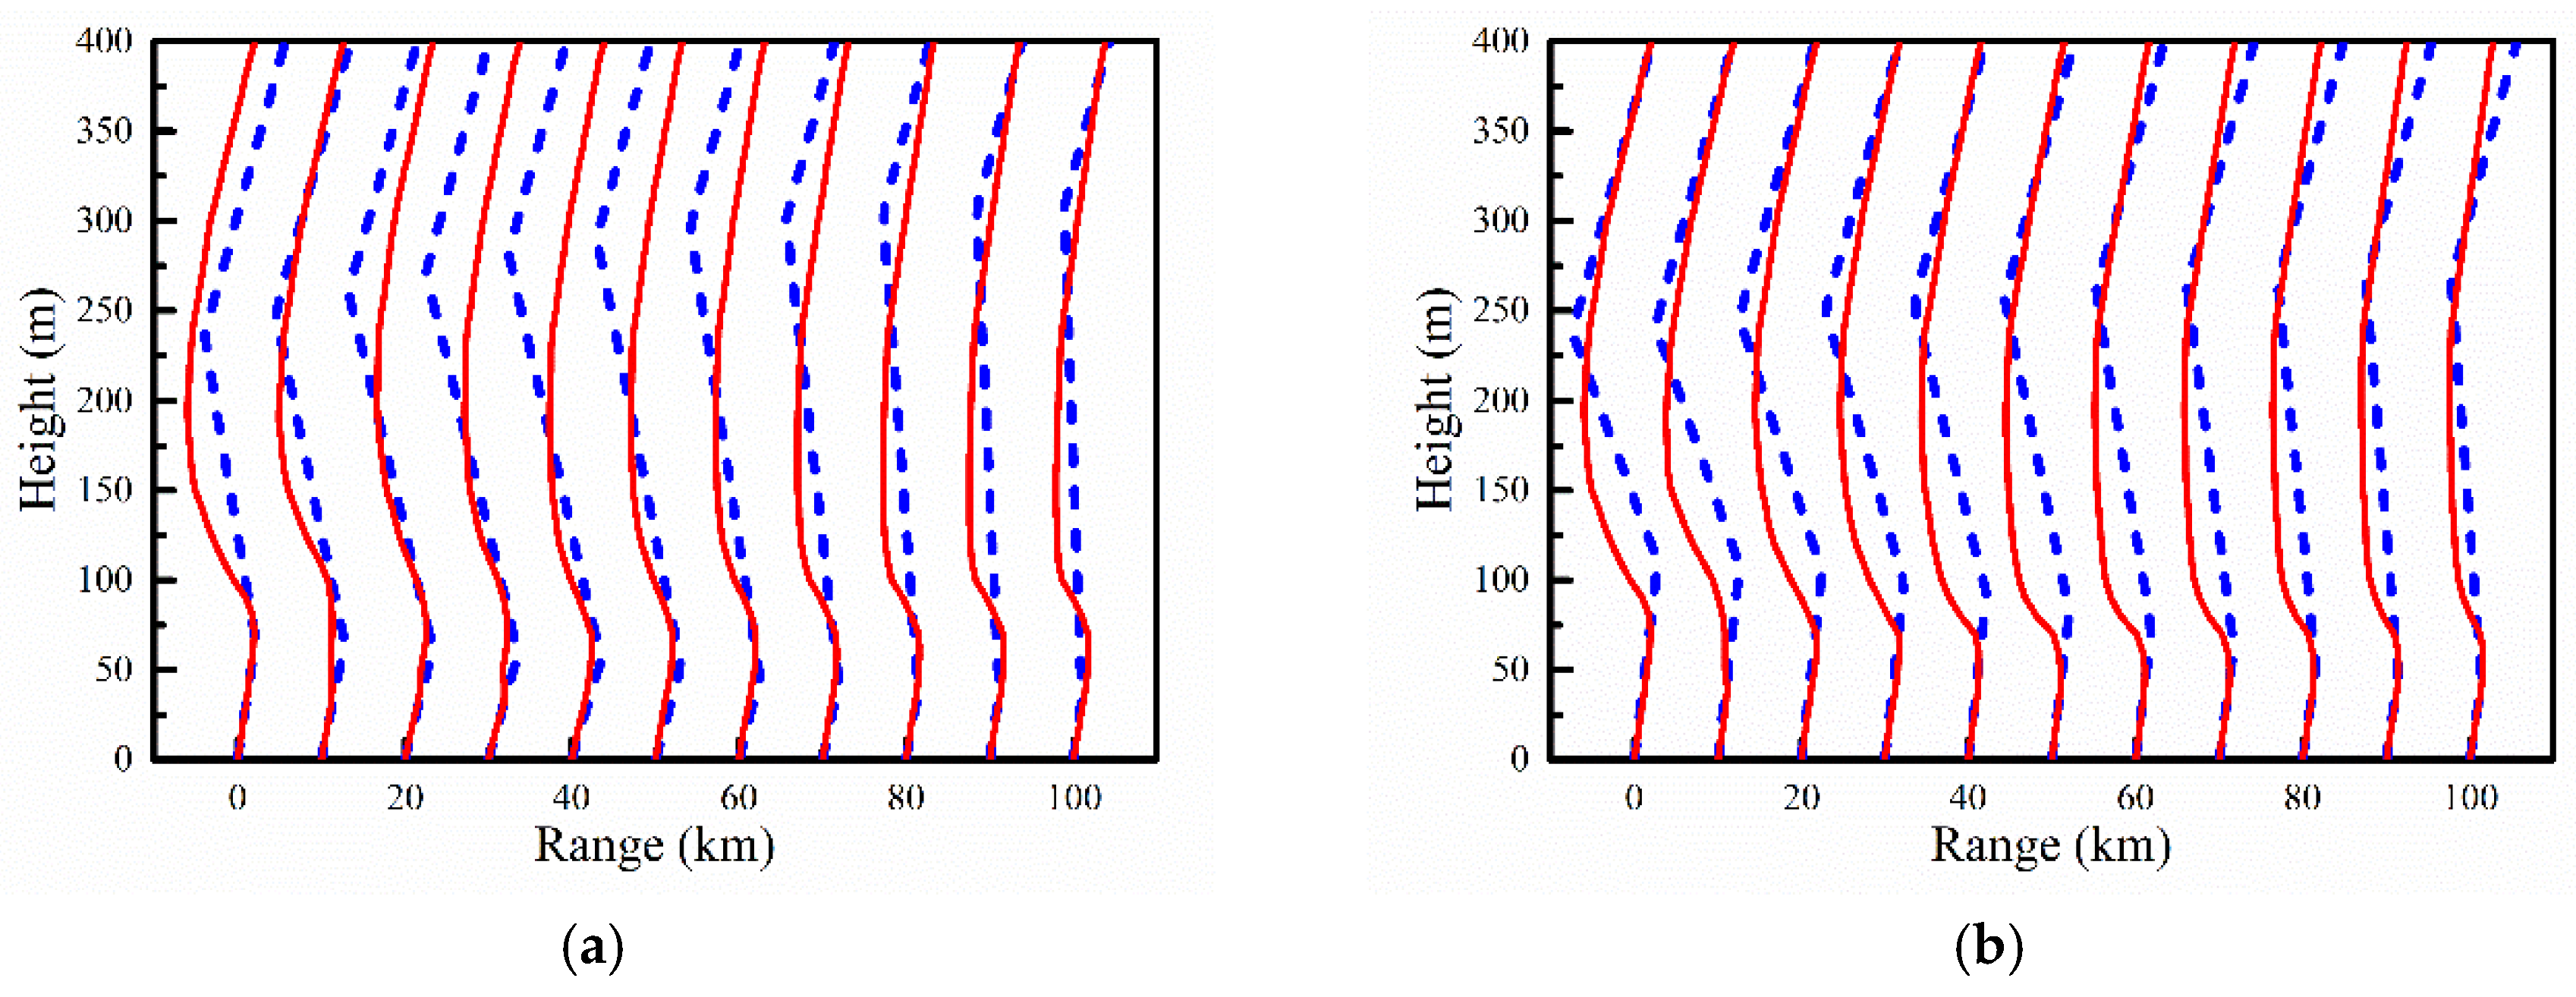
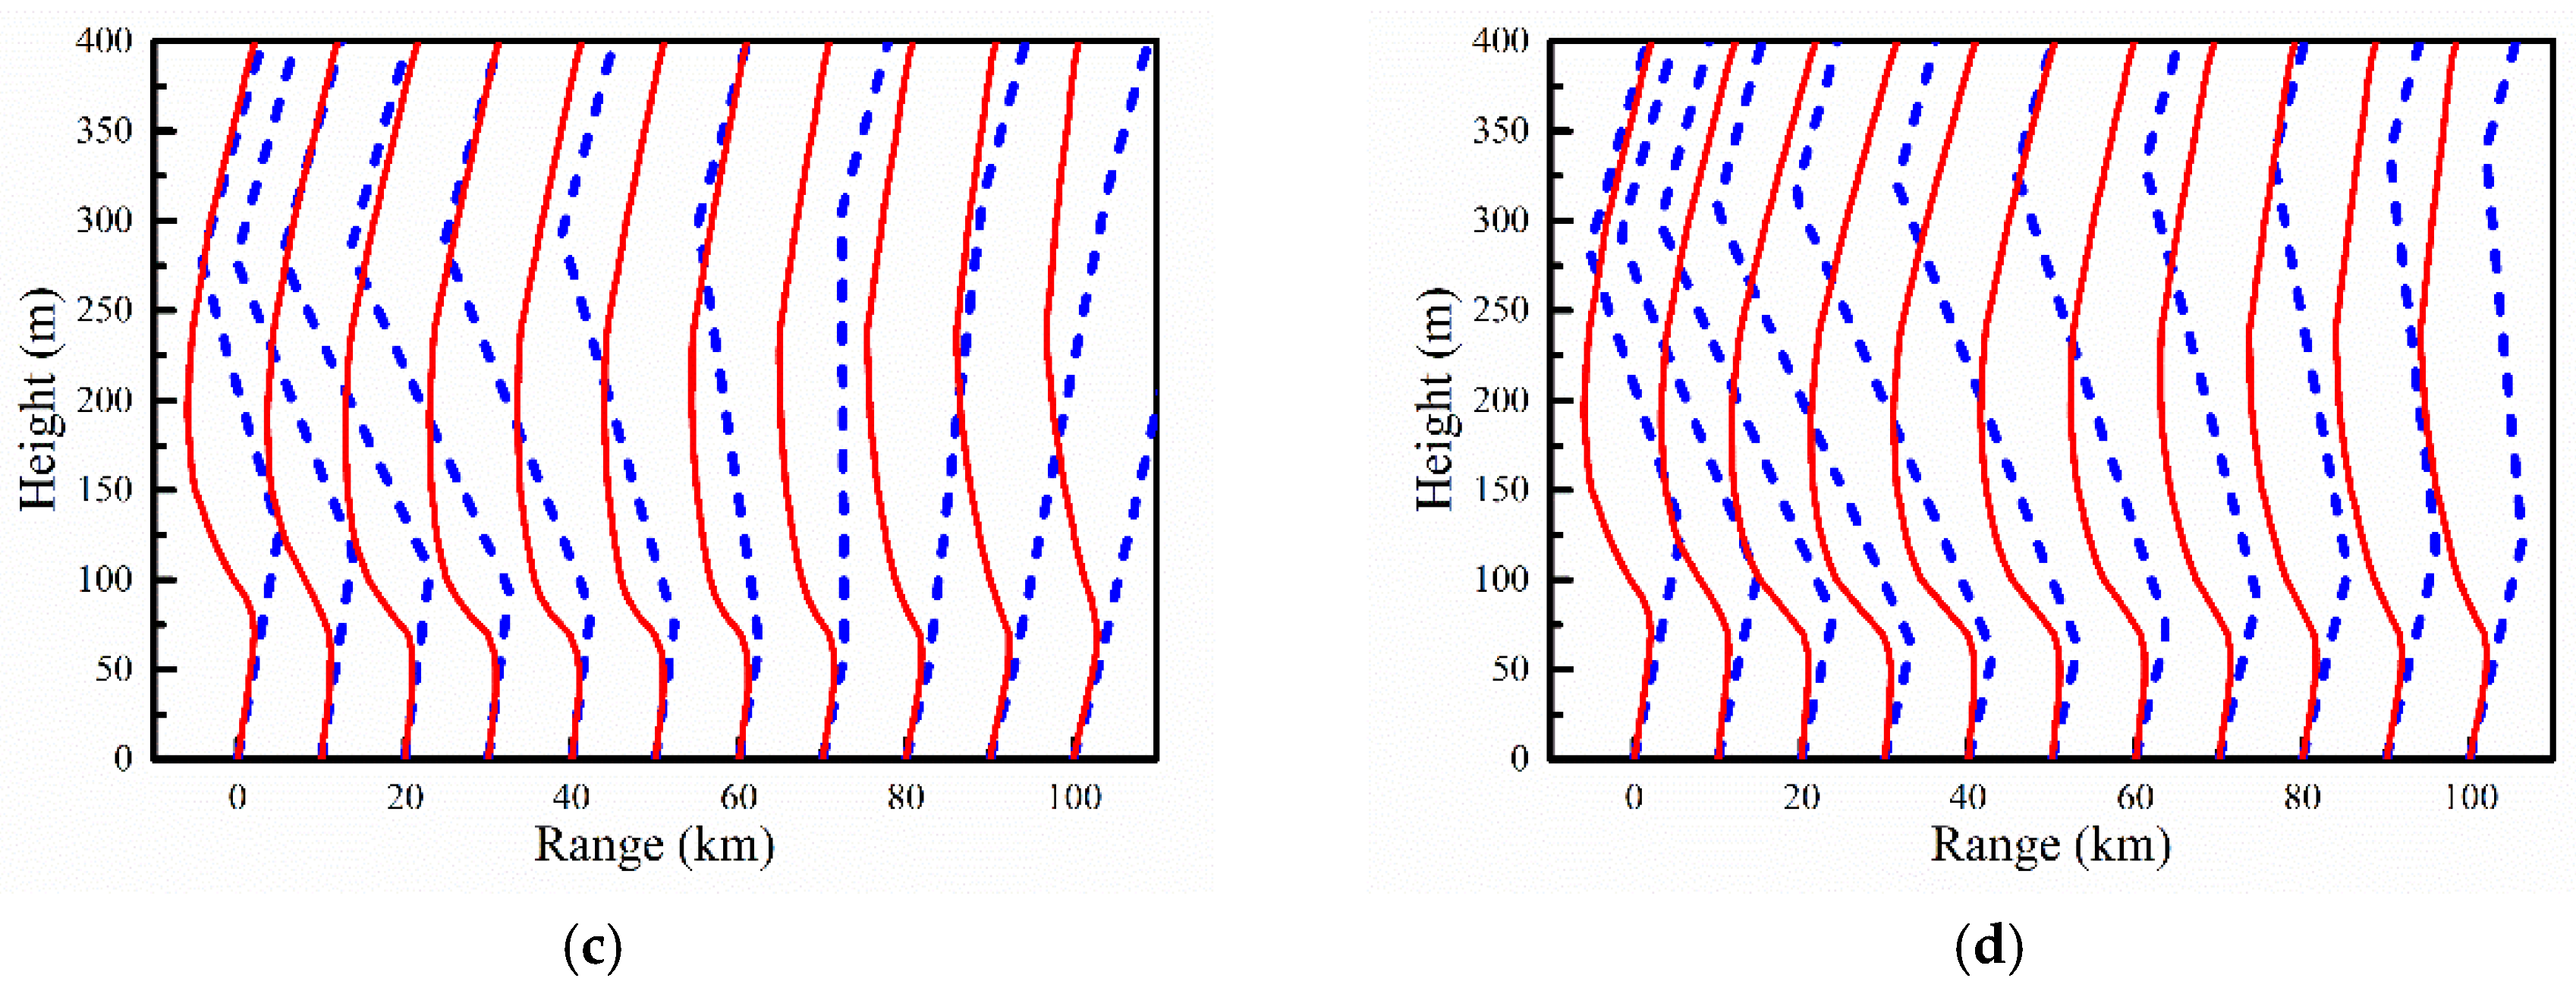
Figure 11 draws comparisons between inversed and measured echo power at 75°, 95°, 115°, and 185°, respectively, where the red lines represent the measured values and the blue lines represent the inversed values. The corresponding M profiles inversed by the proposed method and simulated by the WRF model are provided in Figure 12, where the red lines are the WRF values and the blue lines are the inversed values. The variation trends of the inversed echo power are in good agreement with the values measured at 75° and 95°, and the M profiles are also basically consistent with each other, proving the validity of the inversion process. However, the values badly match with each other at 115° and 185° with respect to both echo power and M profiles, which is probably the result of the existence of clouds and precipitation. Because of the strong backscattering effects of clouds and precipitation, the echo power can increase suddenly at a certain distance, and this is hardly considered in the propagation model of sea clutters. To make the curves of the echo power fit with each other better, the inversion process must search for a set of duct parameters different from the actual values.
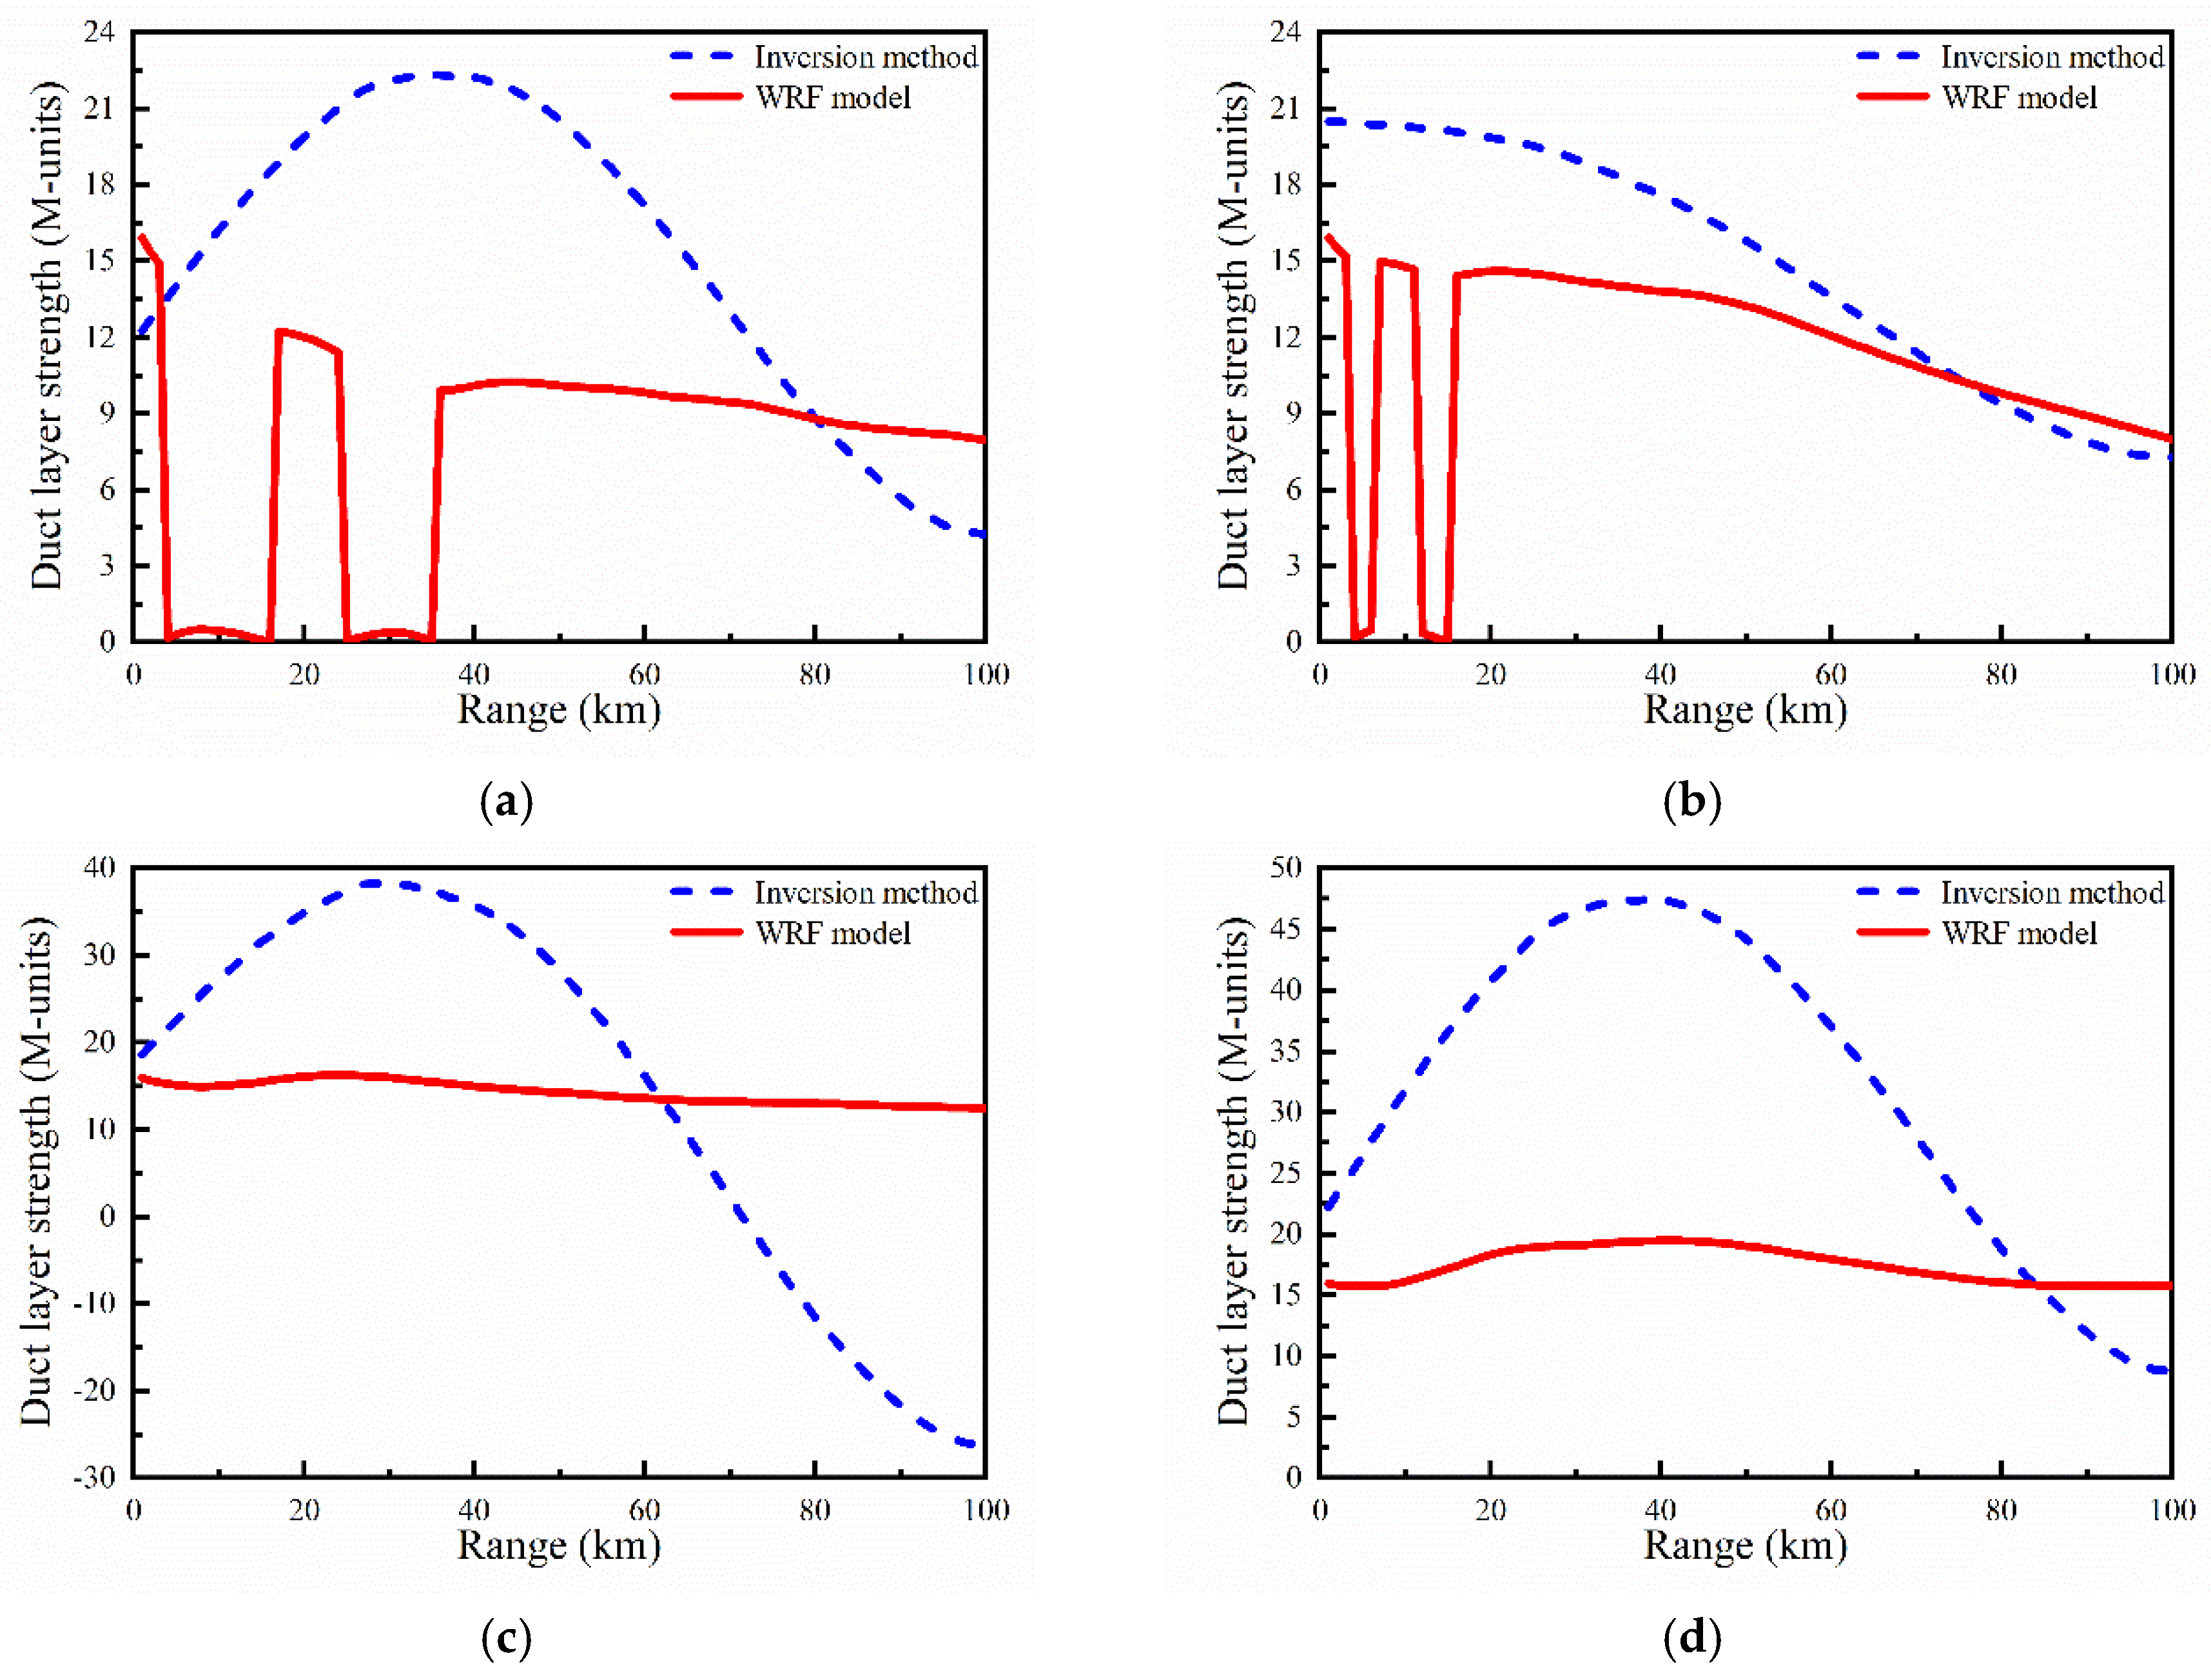
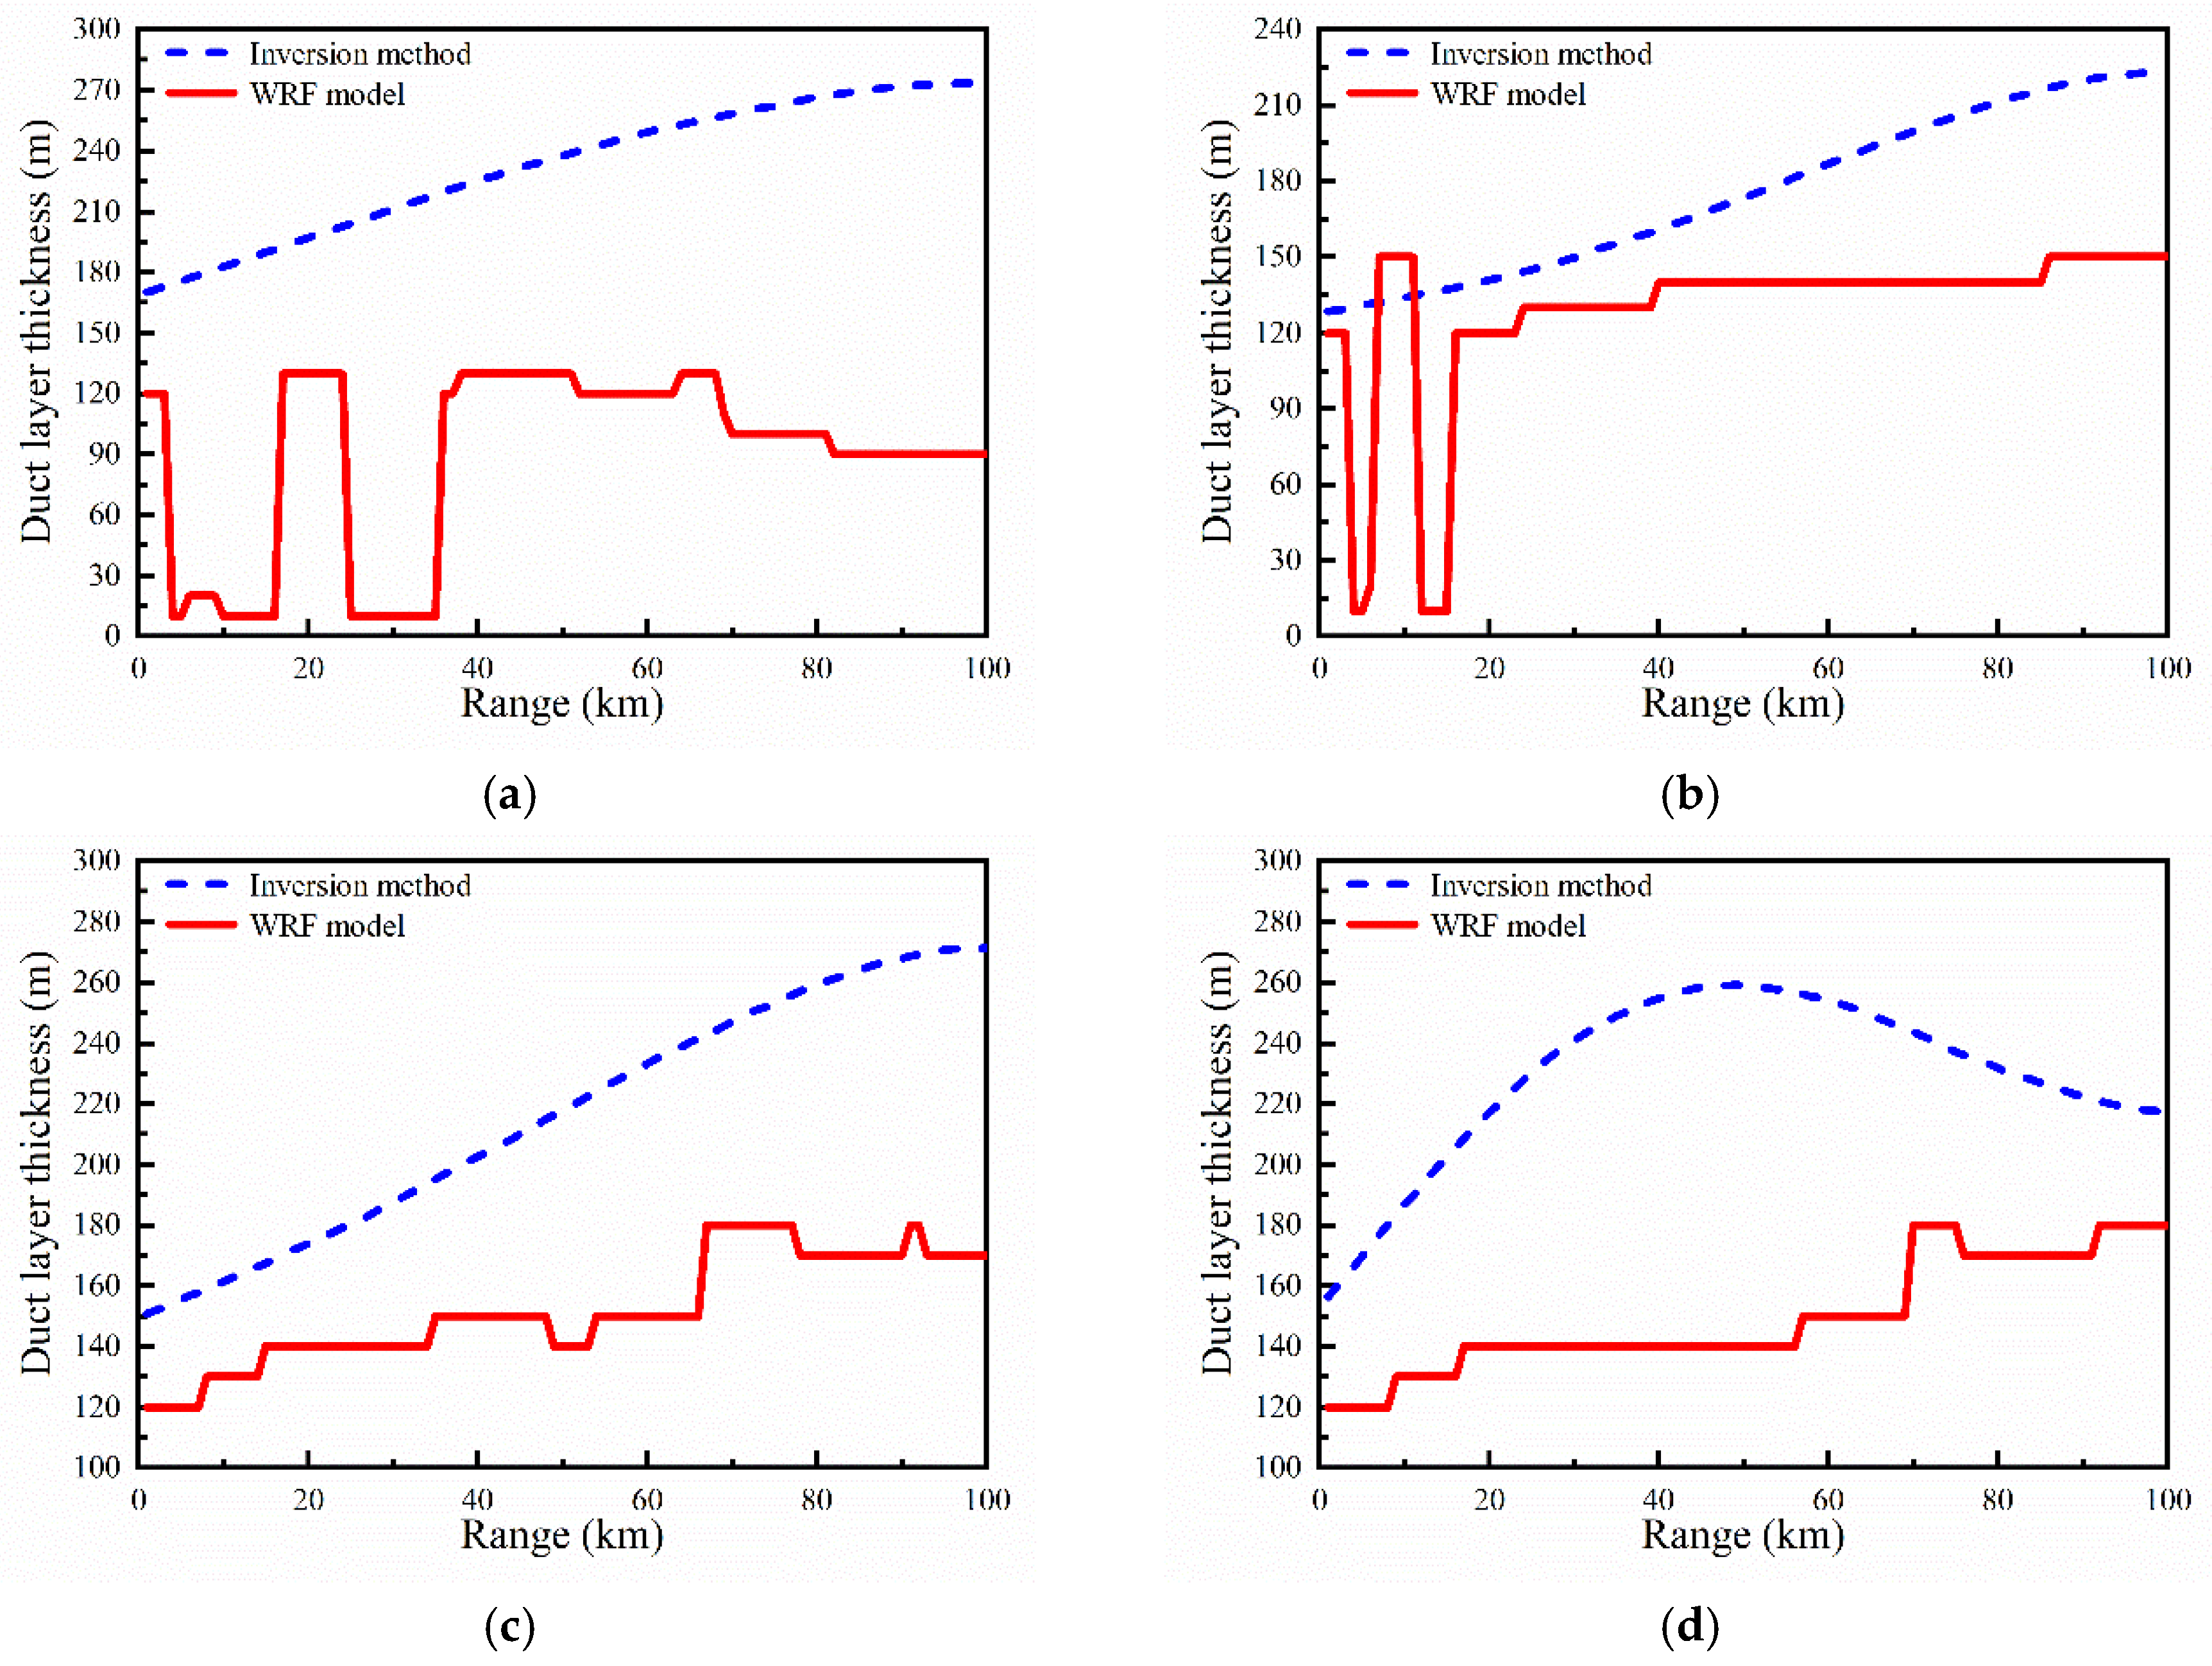
For the further observation of the above differences, Figure 13 draws comparisons between the duct layer strength inversed by the proposed method and that simulated by the WRF model at 75°, 95°, 115°, and 185°, respectively, and the corresponding comparisons of the duct layer thickness are provided in Figure 14, where the red lines represent the WRF values and the blue lines represent the inversed values. Because the duct parameters simulated by the WRF model are better known as pseudo measurements, which are well suited as reference values, but not as measurements, it is to be expected that the inversed and WRF values do not match well. Another reason for the undesirable match may be that the lesser number of principle components (two in this paper) that are used to characterize the horizontal inhomogeneity of duct parameters. However, the differences between the inversed and WRF values at 115° and 185° are significantly greater than those at 75° and 95° with respect to both duct layer strength and thickness, for the same reasons as in Figure 11 and Figure 12. Moreover, the WRF values are generally smaller than the inversed values because of the lower spatial resolution when the tropospheric duct is simulated by the WRF model.
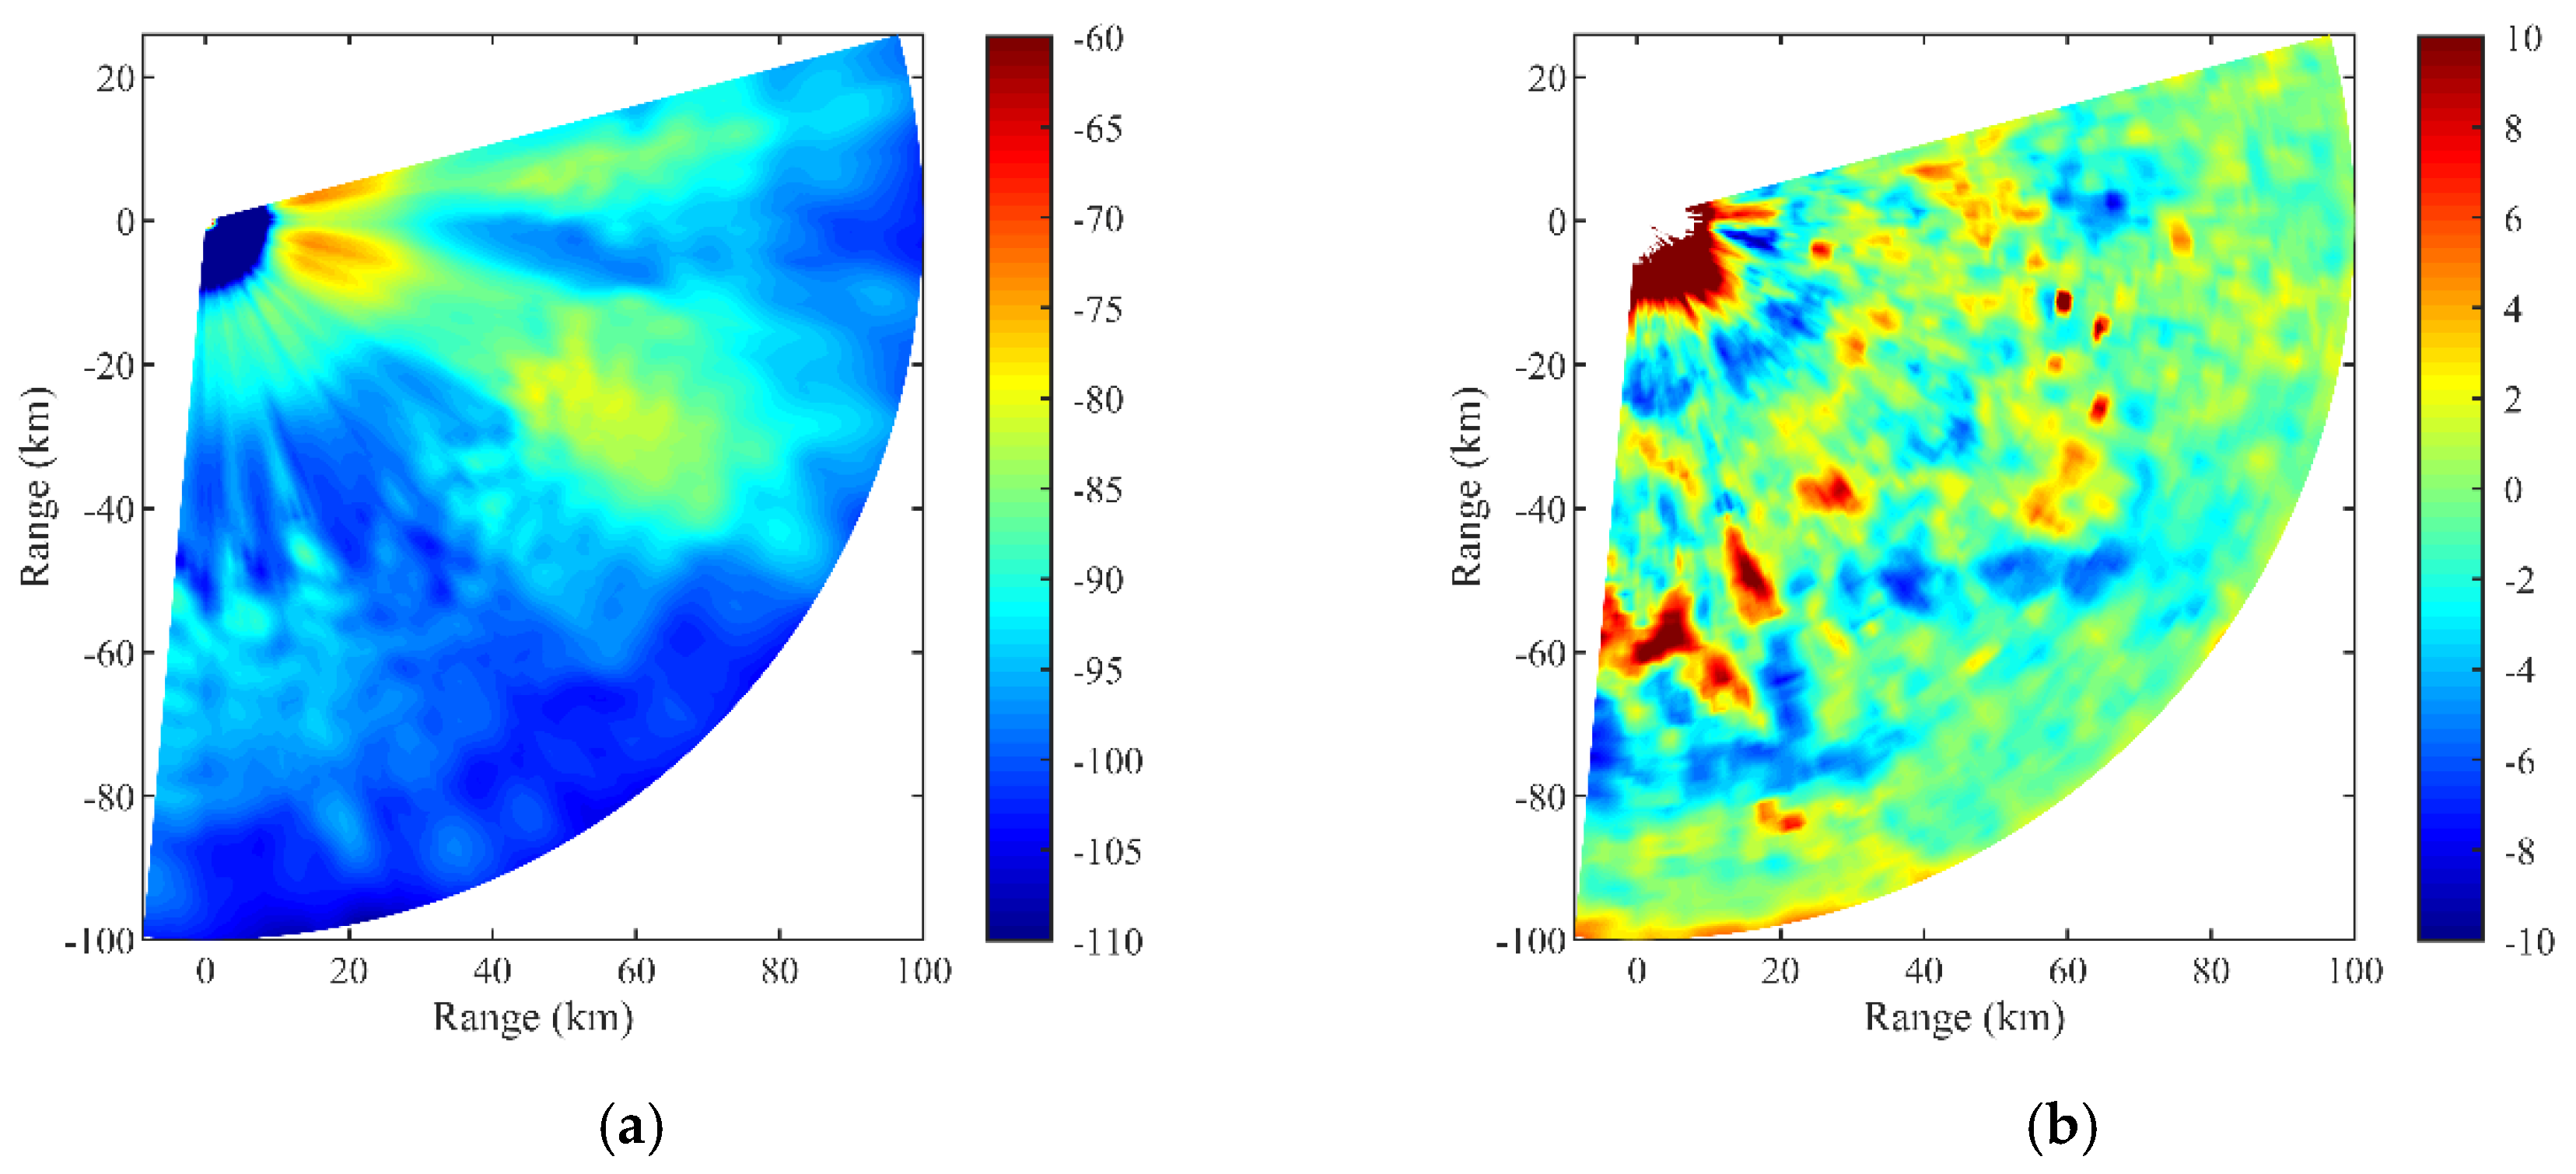
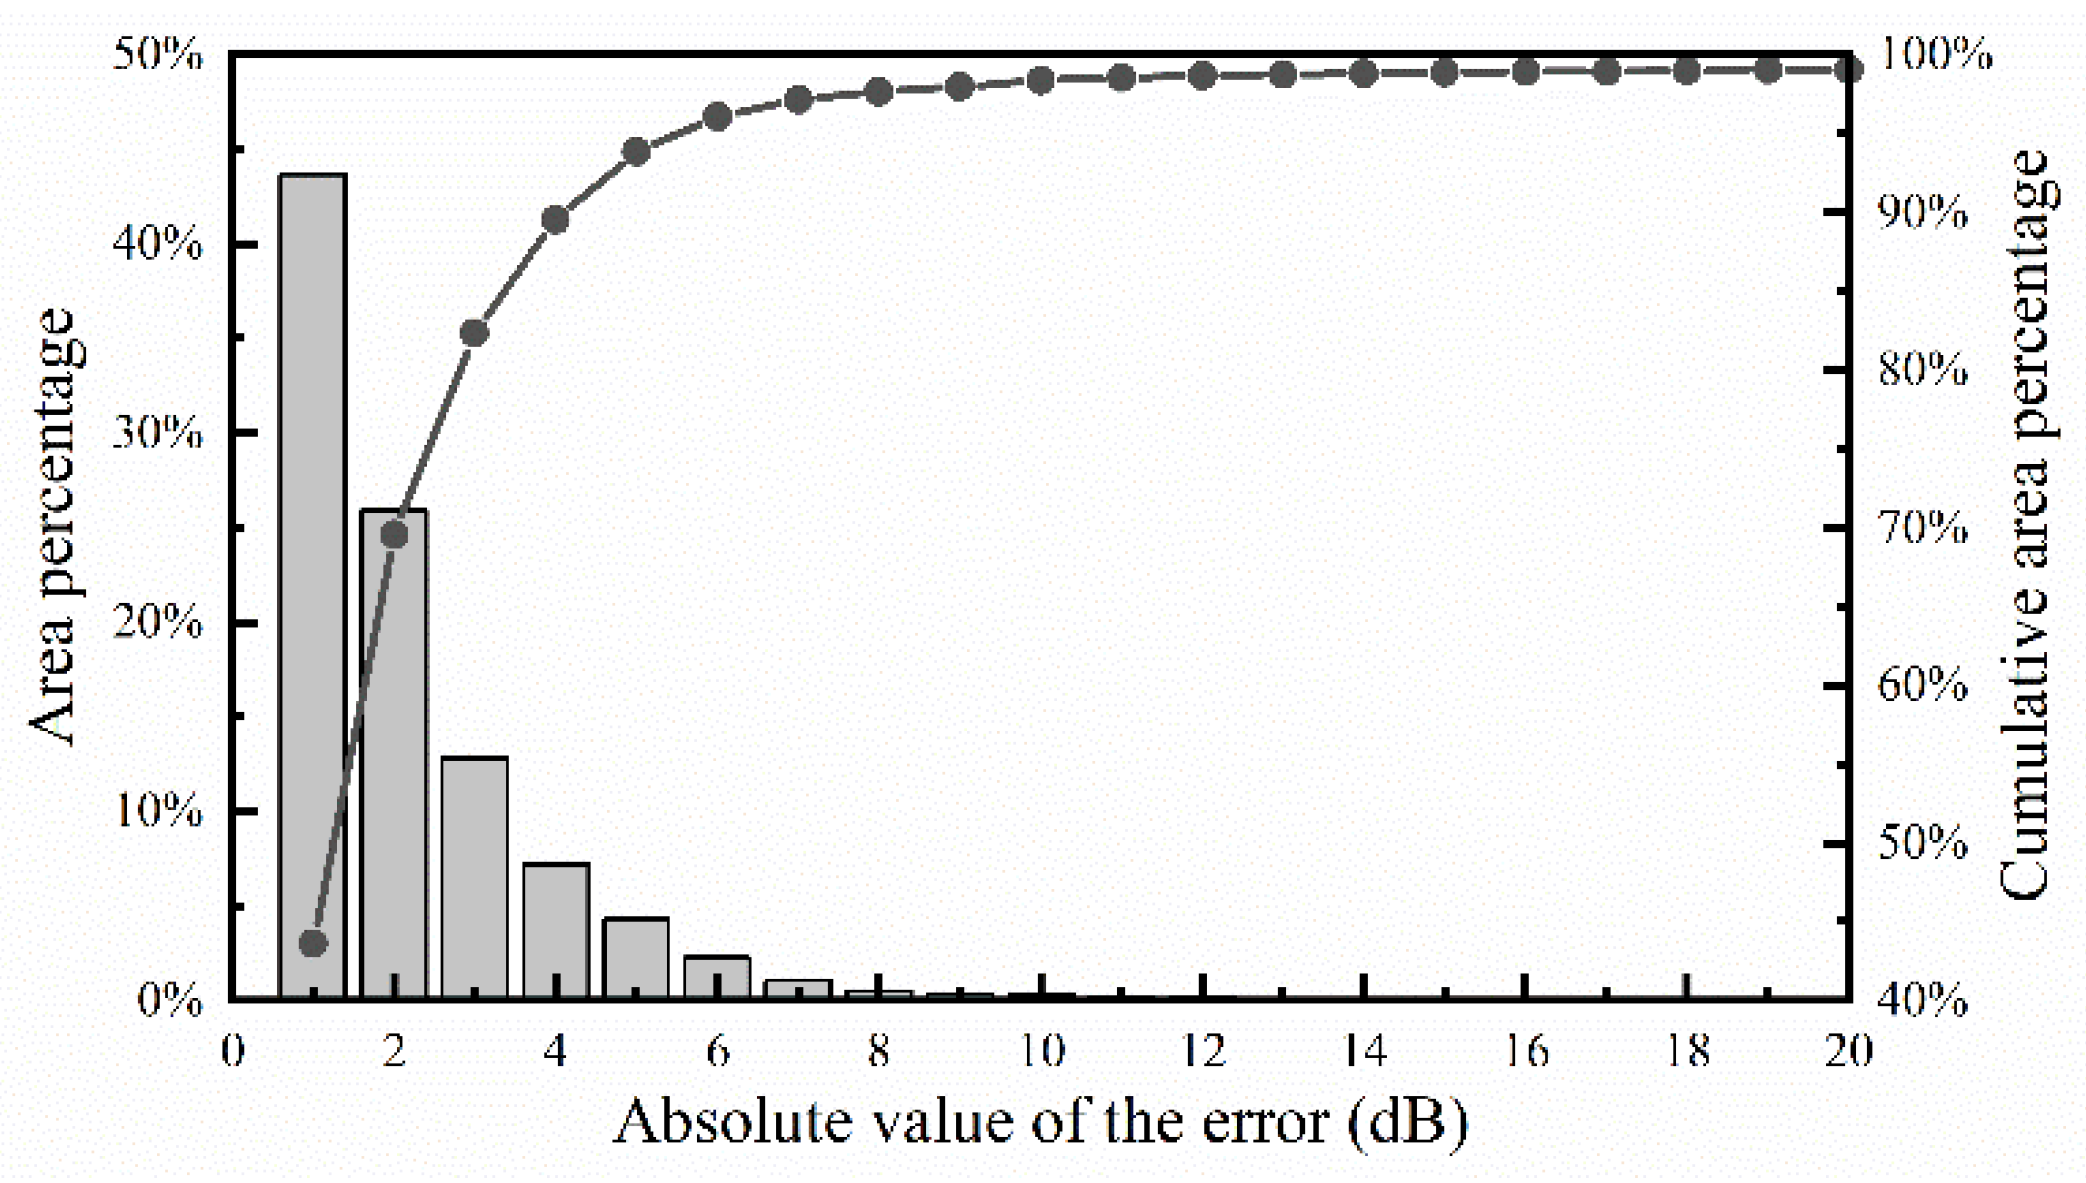
The overall regional distributions of the inversed echo power and error in comparison with the measured data are displayed in Figure 15. From Figure 15a,b, it is obvious that the inversed values coincide well with the measured values in general, especially at the local maximum and minimum points, and the distribution properties of the error are in accordance with the discussion above. After calculation, as shown in Figure 16, the absolute value of the error is less than 3 dB in the about 75% of the inversion region, and less than 5 dB in about 90% of the inversion region, which meets the precision requirement for the inversion of a regional range-dependent surface duct with a base layer. Figure 17 shows the inversion results of the duct parameters, including the base layer slope, base layer height, duct layer strength, and duct layer thickness. In particular, the inversed duct layer strength and thickness, which are the two parameters that best characterize the surface duct, can be obtained from Figure 17c,d. It can be seen that the duct layer strength decreases and the duct layer thickness increases in the direction away from the radar, which is similar to the simulations from the WRF model in Figure 7c,d.

6. Conclusions

Based on measured echo data of a Doppler weather radar located at Qingdao, the regional distributions of tropospheric duct parameters over the sea area around the radar is estimated in this paper. Due to the higher antenna height of up to 169 m, the transmission environment is assumed to be the surface duct with a base layer, so that the antenna can be located in the duct layer and greater sea clutter power can be received. In the inversion model, duct parameters extracted from the WRF outputs are used as the initial values, and the above assumption can be proved to be reasonable. Since this paper only focuses on sea area, the measured data within a certain range of azimuth angle and distance are preprocessed in order to facilitate the subsequent operations through the median filtering and averaging processes, which the original data features can well remain. The PCA and PE methods are used to simulate the horizontal inhomogeneity of duct profiles and the propagation characteristics of electromagnetic waves. Moreover, multithread parallel processing is adopted to reduce the inversion time based on the characteristics of the optimization algorithm (PSO method in this paper). Because multi-core CPUs have become a common configuration for computers and the proposed algorithms were implemented using MATLAB, we parallelized our programs using the Parallel Computing Toolbox in MATLAB. The computer we used was configured with a CPU with four cores and eight threads, and the computing efficiency was at least five times higher than the case without parallelism. If the programs were to be rewritten using C language, the computing efficiency could be further improved based on the parallel GPU technology. This is also the item we are interested in investigating in the future.
Due to the limitations of data sources in spatial resolution, the accuracy of the M profiles in the lower latitude atmosphere simulated by the WRF model is restricted. The overall variation tendencies of the simulation results in the regional distributions of duct parameters are well consistent with the inversion results, but relatively lower in terms of specific values than the inversion results. Because the echoes from precipitation targets may be involved in the measured data, the inversed echo data have different agreements with the measurements, but the inversed echo data can be consistent with the measurements in most areas. After calculation, the absolute error values were less than 3 dB in about 75% of the region of interest, and less than 5dB in about 90% of the region of interest, which achieves the purpose of duct estimation. While the inversion echo data is barely coincident with the measurements in some regions, there are great differences between the duct parameters inversed by this method and simulated by the WRF model.
Doppler weather radar is mainly used for meteorological detection, and meteorological targets are identified based on echo information. Although the measured data at the lowest radar elevation, where the strongest sea clutter power can be received, are used for the inversion of duct parameters, it is difficult to guarantee the reliability of inversion results due to the interference of precipitation echoes, which can be seen from the contents in Section 5. Therefore, how to suppress the influence of precipitation echoes on the measured data will be the further improvement of the method proposed in this paper. Once the distribution information of duct parameters has been successfully reversed by this method, it can be also used to reduce the influence of sea clutter on precipitation analysis.

Author Contributions

Conceptualization, X.L., H.W., and Z.W.; Data curation, H.W. and X.L.; Formal analysis, X.L.; Funding acquisition, Z.W.; Investigation, X.L.; Methodology, X.L.; Software, X.L.; Visualization, X.L.; Writing—original draft, X.L. Writing—review & editing, X.L. All authors have read and agreed to the published version of the manuscript.

Funding

This research received no external funding.

Acknowledgments

The NCEP FNL Operational Global Analysis data used in the WRF model have been kindly provided by the National Center for Atmospheric Research (NCAR). (https://rda.ucar.edu/datasets/ds083.2).

Conflicts of Interest

The authors declare no conflict of interest.

References

  1. Sirkova, I. Anomalous tropospheric propagation: Usage possibilities and limitations in radar and wireless communications systems. In Proceedings of the 10th Jubilee International Conference of the Balkan Physical Union, Sofia, Bulgaria, 26–30 August 2018; Volume 2075, pp. 120017-1–120017-6. [Google Scholar]
  2. Bech, J.; Codina, B.; Lorente, J. Forecasting weather radar propagation conditions. Meteor. Atmos. Phys. 2007, 96, 229–243. [Google Scholar] [CrossRef]
  3. Sirkova, I. Duct occurrence and characteristics for Bulgarian Black sea shore derived from ECMWF data. J. Atmos. Sol. Terr. Phy. 2015, 135, 107–117. [Google Scholar] [CrossRef]
  4. Ullah, A.; Rehman, S.U.; Mufti, N. Investigations into the occurrence of elevated ducts in lower atmosphere near Arabian Sea. In Proceedings of the International Conference on Space Science and Communication, Langkawi, Malaysia, 10–12 August 2015; pp. 128–131. [Google Scholar]
  5. Rehman, S.U.; Mufti, N. Investigations into the occurrence of evaporation ducts near Karachi. In Proceedings of the International Conference on Communication Technologies, Azad Rashmir Rawalpindi, Pakistan, 19–21 April 2017; pp. 34–38. [Google Scholar]
  6. Mesnard, F.; Sauvageot, H. Climatology of anomalous propagation radar echoes in a coastal area. J. Appl. Meteor. Climatol. 2010, 49, 2285–2300. [Google Scholar] [CrossRef]
  7. Huuskonen, A.; Saltikoff, E.; Holleman, I. The operational weather radar network in Europe. Bull. Am. Meteor. Soc. 2014, 95, 897–907. [Google Scholar] [CrossRef]
  8. Bruen, M. Using radar information in hydrological modeling: COST 717 WG-1 activities. Phys. Chem. Earth B 2000, 25, 1305–1310. [Google Scholar] [CrossRef]
  9. Macphersonc, B. Radar data in NWP models, an outline of COST-717 working group 3. Phys. Chem. Earth B 2000, 25, 1225–1227. [Google Scholar] [CrossRef]
  10. Saltikof, E.; Huuskonen, A.; Hohti, H.; Koistinen, J.; Järvinen, H. Quality assurance in the FMI Doppler Weather radar network. Boreal Env. Res. 2010, 15, 579–594. [Google Scholar]
  11. Werner, M. A new radar data post-processing quality control workflow for the DWD Weather Radar Network. In Proceedings of the 8th European Conference on Radar in Meteorology and Hydrology, Garmisch-Partenkirchen, Germany, 1–5 September 2014; Volume DAC.P04. [Google Scholar]
  12. Szturc, J.; Ośródka, K.; Jurczyk, A. Quality control algorithms applied on weather radar reflectivity data. In Doppler Radar Observations-Weather Radar, Wind Profiler, Ionospheric Radar, and Other Advanced Applications; Bech, J., Chau, J.L., Eds.; InTech: Rijeka, Croatia, 2012; pp. 289–306. [Google Scholar]
  13. Moisseev, D.N.; Chandrasekar, V. Polarimetric spectral filter for adaptive clutter and noise suppression. J. Atmos. Oceanic Technol. 2009, 26, 215–228. [Google Scholar] [CrossRef]
  14. Torres, S.M.; Warde, D.A. Ground clutter mitigation for weather radars using the autocorrelation spectral density. J. Atmos. Oceanic Technol. 2014, 31, 2049–2066. [Google Scholar] [CrossRef]
  15. Prtenjak, M.T.; Horvat, I.; Tomažić, I.; Kvakić, M.; Viher, M.; Grisogono, B. Impact of mesoscale meteorological processes on anomalous radar propagation conditions over the northern Adriatic area. J. Geophys. Res. Atmos. 2015, 120, 8759–8782. [Google Scholar] [CrossRef]
  16. Stagliano, J.; Kerce, J.C.; Hall, G.M.; Bock, R.D.; Holder, E.J.; Dugas, S.F.; Vandenberghe, F. Prediction and mitigation of anomalous propagation with the Total Atmospheric Effects Mitigation (TAEM) system. In Proceedings of the 24th International Interactive Information and Processing Systems (IIPS) for Meteorology, Oceanography, and Hydrology, New Orleans, LA, USA, 21 January 2008; pp. 20–24. [Google Scholar]
  17. Peter, J.R.; Seed, A.; Steinle, P.J. Application of a Bayesian classifier of anomalous propagation to single-polarization radar reflectivity data. J. Atmos. Oceanic Technol. 2013, 30, 1985–2005. [Google Scholar] [CrossRef] [Green Version]
  18. Rowland, J.R.; Konstanzer, G.C.; Neves, M.R.; Miller, R.E.; Meyer, J.H.; Rottier, J.R. SEAWASP: Refractivity characterization using shipboard sensors. In Proceedings of the Battlespace Atmospherics Conference, San Diego, CA, USA, 3–5 December 1996; Volume 2938, pp. 155–164. [Google Scholar]
  19. Burk, S.D.; Thompson, W.T. Mesoscale modeling of summertime refractive conditions in the Southern California Bight. J. Appl. Meteorol. 1997, 36, 22–31. [Google Scholar] [CrossRef]
  20. Wang, W.; Bruyère, C.; Duda, M.; Dudhia, J.; Gill, D.; Kavulich, M.; Keene, K.; Lin, H.C.; Michalakes, J.; Rizvi, S.; et al. WRF-ARW Version 3 Modeling System User’s Guide; Mesoscale and Microscale Meteorology Division, National Center for Atmospheric Research: Boulder, CO, USA, 2015. [Google Scholar]
  21. Yang, S.B.; Li, X.F.; Wu, C.; He, X.; Zhong, Y. Application of the PJ and NPS evaporation duct models over the South China Sea (SCS) in winter. PLoS ONE 2017, 12, e0172284. [Google Scholar] [CrossRef] [PubMed]
  22. Zhang, J.P.; Wu, Z.S.; Zhu, Q.L.; Wang, B. A four-parameter M-profile model for the evaporation duct estimation from radar clutter. Prog. Electromagn. Res. 2011, 114, 353–368. [Google Scholar] [CrossRef] [Green Version]
  23. Zhao, X.F.; Huang, S.X. Atmospheric duct estimation using radar sea clutter returns by the adjoint method with regularization technique. J. Atmos. Ocean. Tech. 2014, 31, 1250–1262. [Google Scholar] [CrossRef]
  24. Fountoulakis, V.; Earls, C. Inverting for maritime environments using proper orthogonal bases from sparsely sampled electromagnetic propagation data. IEEE Trans. Geosci. Remote Sens. 2016, 54, 7166–7176. [Google Scholar] [CrossRef]
  25. Compaleo, J.; Yardim, C.; Xu, L.Y.; Wijesundara, S.; Johnson, J.; Burkholde, B.; Wang, Q.; Alappattu, D. Preliminary refractivity from clutter (RFC) evaporation duct inversion results from CASPER west experiment. In Proceedings of the IEEE Radar Conference, Oklahoma City, OK, USA, 23–27 April 2018; pp. 1516–1521. [Google Scholar]
  26. Marshall, R.E.; Thornton, W.D.; Lefurjah, G.; Casey, T.S. Modeling and simulation of notional future radar in non-standard propagation environments facilitated by mesoscale numerical weather prediction modeling. Nav. Eng. J. 2008, 120, 55–66. [Google Scholar] [CrossRef]
  27. Benzon, H.H.; Bovith, T. Simulation and prediction of weather radar clutter using a wave propagator on high resolution NWP data. IEEE Trans. Antennas Propag. 2008, 56, 3885–3890. [Google Scholar] [CrossRef]
  28. Shi, Y.; Yang, K.D.; Yang, Y.X.; Ma, Y.L. Experimental verification of effect of horizontal inhomogeneity of evaporation duct on electromagnetic wave propagation. Chin. Phys. B 2015, 24, 044102. [Google Scholar] [CrossRef]
  29. Wang, L.; Yuan, Y.; Zhu, M. Study on the propagation characteristics of electromagnetic waves in horizontally inhomogeneous environment. In Electronics and Signal Processing; Hu, W., Ed.; Springer: Berlin, Germany, 2011; Volume LNEE 97, pp. 913–920. [Google Scholar]
  30. Stark, H.; Woods, J.W. Probability and Random Processes with Applications to Signal Processing, 3rd ed.; Prentice Hall: Upper Saddle River, NJ, USA, 2001; pp. 518–524. [Google Scholar]
  31. Tabrikian, J.; Krolik, J.L.; Vasudevan, S. Estimating tropospheric refractivity parameters from radar sea clutter. In Proceedings of the IEEE Signal Processing Workshop on Higher-Order Statistics, Caesarea, Israel, 16 June 1999; pp. 345–348. [Google Scholar]
  32. Vasudevan, S.; Krolik, J.L. Refractivity estimation from radar clutter by sequential importance sampling with a Markov model for microwave propagation. In Proceedings of the IEEE International Conference on Acoustics, Speech, and Signal Processing, Salt Lake City, UT, USA, 7–11 May 2001; Volume 5, pp. 2905–2908. [Google Scholar]
  33. Vasudevan, S.; Anderson, R.H.; Kraut, S.; Gerstoft, P.; Rogers, L.T.; Krolik, J.L. Recursive Bayesian electromagnetic refractivity estimation from radar sea clutter. Radio Sci. 2007, 42, RS2014. [Google Scholar] [CrossRef] [Green Version]
  34. Gerstoft, P.; Rogers, L.T.; Krolik, J.L.; Hodgkiss, W.S. Inversion for refractivity parameters from radar sea clutter. Radio Sci. 2003, 38, 8053. [Google Scholar] [CrossRef]
  35. Blum, C.; Li, X.D. Swarm Intelligence in Optimization. In Swarm Intelligence: Introduction and Applications; Blum, C., Merkle, D., Eds.; Springer Verlag: Berlin, Germany, 2008; pp. 43–85. [Google Scholar]
  36. Battan, L.J. Radar Observation of the Atmosphere; The University of Chicago Press: Chicago, IL, USA, 1973; pp. 29–44. [Google Scholar]
  37. Skamarock, W.C.; Klemp, J.B.; Dudhia, J.; Gill, D.O.; Barker, D.M.; Duda, M.G.; Huang, X.Y.; Wang, W.; Powers, J.G. A Description of the Advanced Research WRF Version 3; Mesoscale and Microscale Meteorology Division, National Center for Atmospheric Research: Boulder, CO, USA, 2008. [Google Scholar]
  38. Bean, B.R.; Dutton, E.J. Radio Meteorology; Dover Publications: New York, NY, USA, 1968; p. 435. [Google Scholar]
  39. Skolnik, M.I. Radar Handbook, 3rd ed.; McGraw-Hill: New York, NY, USA, 2008. [Google Scholar]
  40. Levy, M. Parabolic Equation Methods for Electromagnetic Wave Propagation; The Institution of Engineering and Technology: London, UK, 2000. [Google Scholar]
  41. Anderson, R.; Vasudevan, S.; Krolik, J.L.; Rogers, L.T. Maximum a posteriori refractivity estimation from radar clutter using a Markov model for microwave propagation. In Proceedings of the IEEE International Geoscience and Remote Sensing Symposium, Sydney, Ausralia, 9–13 July 2001; Volume 2, pp. 906–909. [Google Scholar]
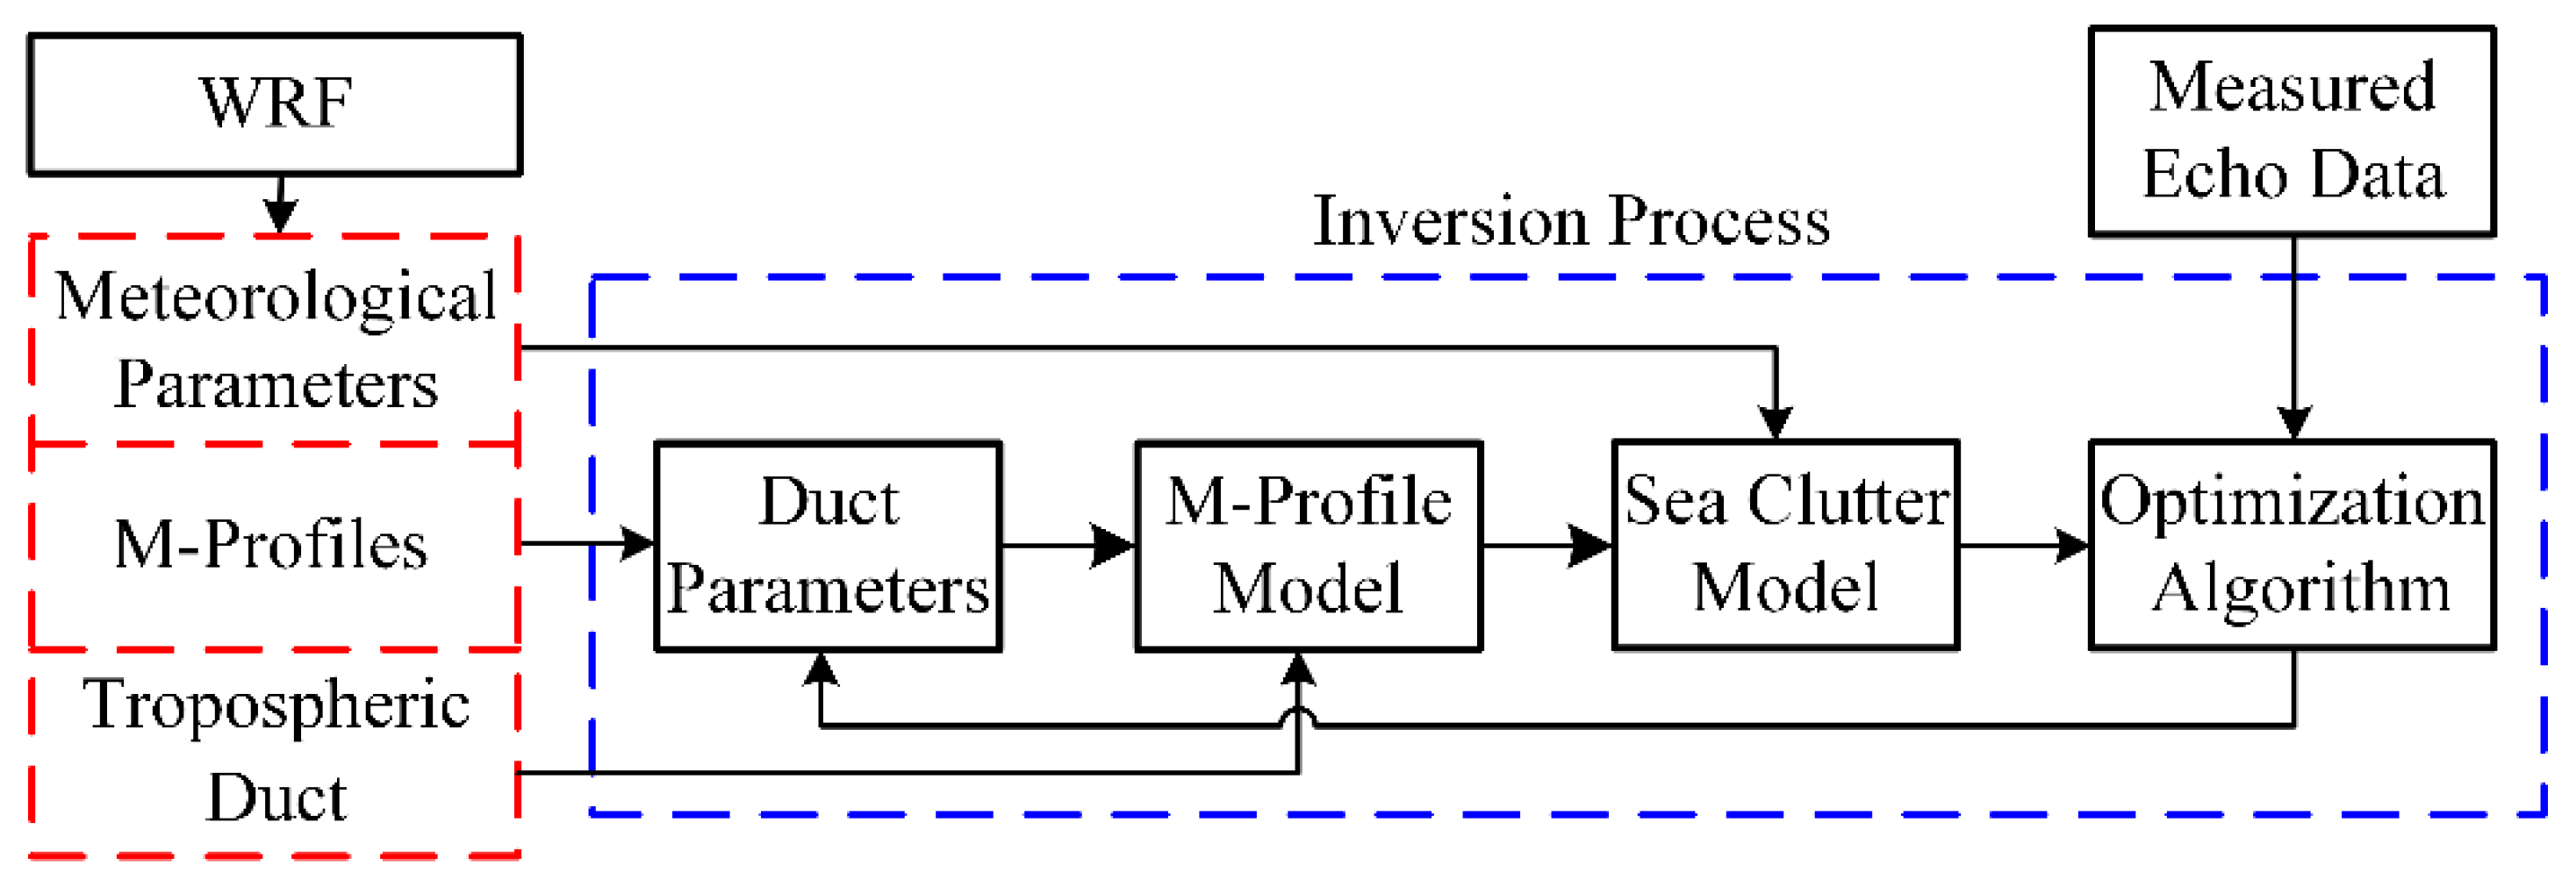
Figure 1. The diagram of the principle of the inversion algorithm.
Atmosphere 11 00754 g001
Figure 2. PPI maps of the (a) measured equivalent reflectivity factor (dBZ) and (b) calculated echo power (dB) with the radar elevation of 0.48° at 12:00 on 18 July 2014 (UTC).
Atmosphere 11 00754 g002
Figure 3. PPI maps of the measured equivalent reflectivity factor and corresponding echo power between 75° and 185° within a range of 100 km: (a) the original equivalent reflectivity factor (dBZ); (b) the pretreated equivalent reflectivity factor (dBZ); (c) the original echo power (dB); and (d) the pretreated echo power (dB).
Atmosphere 11 00754 g003
Figure 4. The vertical M profile models of the surface duct with or without a base layer.
Atmosphere 11 00754 g004
Figure 5. Two-domain nested case in the WRF model.
Atmosphere 11 00754 g005
Figure 6. The distributions of the necessary oceanic and atmospheric parameters in the fine domain at 12:00 on 18 July 2014 (UTC): (a) SST (K); (b) wind speed (m/s).
Atmosphere 11 00754 g006
Figure 7. The distributions of the tropospheric duct parameters in the fine domain at 12:00 on 18 July 2014 (UTC): (a) duct types (the yellow and red region are respectively surface duct and elevated duct); (b) base layer height (m); (c) duct layer strength (M-units); and (d) duct layer thickness (m).
Atmosphere 11 00754 g007
Figure 8. The distributions of the modified refractivity and modified refractivity gradient in different directions of Qingdao: (a) the modified refractivity (M-units) in the east; (b) the modified refractivity (M-units) in the south; (c) the modified refractivity gradient (M-units/m) in the east; and (d) the modified refractivity gradient (M-units/m) in the south.
Atmosphere 11 00754 g008aAtmosphere 11 00754 g008b
Figure 9. The variations of the M profiles with the range in different directions of Qingdao: (a) the eastern direction; and (b) the southern direction.
Atmosphere 11 00754 g009
Figure 10. Simulated results of the echo power (dB) in different atmospheric environments: (a) M profiles from the WRF model; and (b) standard atmosphere.
Atmosphere 11 00754 g010
Figure 11. Comparisons of the inversed (blue line) and measured (red line) echo power at different azimuth angles: (a) 75°; (b) 95°; (c) 115°; and (d) 185°.
Atmosphere 11 00754 g011
Figure 12. Comparisons of the M profiles inversed by the proposed method (blue line) and simulated by the WRF model (red line) at different azimuth angles: (a) 75°; (b) 95°; (c) 115°; and (d) 185°.
Atmosphere 11 00754 g012aAtmosphere 11 00754 g012b
Figure 13. Comparisons of the duct layer strength (M-units) inversed by the proposed method (blue line) and simulated by the WRF model (red line) at different azimuth angles: (a) 75°; (b) 95°; (c) 115°; and (d) 185°.
Atmosphere 11 00754 g013
Figure 14. Comparisons of the duct layer thickness (m) inversed by the proposed method (blue line) and simulated by the WRF model (red line) at different azimuth angles: (a) 75°; (b) 95°; (c) 115°; and (d) 185°.
Atmosphere 11 00754 g014
Figure 15. (a) The distribution of the inversed echo power (dB); and (b) the distribution of the error (dB) between the inversed and measured echo power.
Atmosphere 11 00754 g015
Figure 16. The area percentage (bar graph, left vertical axis) and cumulative area percentage (line graph, right vertical axis) of the absolute value of the error (dB) between the measured and inversed echo power the inversion region.
Atmosphere 11 00754 g016
Figure 17. The distributions of the inversed duct parameters: (a) base layer slope (M-units/m); (b) base layer height (m); (c) duct layer strength (M-units); and (d) duct layer thickness (m).
Atmosphere 11 00754 g017
Table 1. Doppler weather radar parameters.
ParametersValues
Frequency (GHz)3.0
Elevation (deg.)0.48
Height (m)169
Transmitted power (kW)700
Antenna gain (dB)45
Horizontal beam width (deg.)1.0
Vertical beam width (deg.)1.0
Pulse duration (μs)1.0