Article

Use of Electronic UV Dosimeters in Measuring Personal UV Exposures and Public Health Education

1
MacDiarmid Institute for Advanced Materials and Nanotechnology and Department of Electrical and Computer Engineering, University of Canterbury, Christchurch 8014, New Zealand
2
Measurement Standards Laboratory of New Zealand, Callaghan Innovation, PO Box 31-310, Lower Hutt 5040, New Zealand
3
International Commission on Illumination (CIE), Babenbergerstrasse 9/9A, 1010 Vienna, Austria
4
National Institute for Water & Atmospheric Research (NIWA), Lauder, PB 50061, Omakau, Central Otago, New Zealand
*
Author to whom correspondence should be addressed.
Atmosphere 2020, 11(7), 744; https://doi.org/10.3390/atmos11070744
Submission received: 20 May 2020 / Revised: 28 June 2020 / Accepted: 14 July 2020 / Published: 14 July 2020

Abstract

:
The performance limits of electronic ultraviolet (EUV) dosimeters, which use AlGaN Schottky photodiodes as the ultraviolet radiation (UVR) sensing element to measure personal erythemally weighted UVR exposures, were investigated via a direct comparison with meteorological-grade reference instruments. EUV dosimeters with two types of AlGaN Schottky photodiode were compared to second-generation ‘Robertson–Berger type’ broadband erythemal radiometers. This comparison was done by calculating correction factors for the deviations of the spectral responsivity of each instrument from the CIE erythemal action spectrum and for deviations in their angular response from the ideal cosine response of flat surfaces and human skin. Correction factors were also calculated to convert the output of these instruments to vitamin D-weighted UV irradiances. These comparisons showed that EUV dosimeters can be engineered with spectral responsivities and cosine response errors approaching those of Robertson–Berger type radiometers, making them very acceptable for use in human UVR exposure and sun safety behaviour studies, provided appropriate side-by-side calibrations are performed. Examples of these calibrations and the effect of EUV dosimeter sampling rates on the calculation of received erythemal UVR doses and erythemal UVR dose rates are provided, as well as brief descriptions of their use in primary skin cancer prevention programmes, handheld meters, and public health displays.

Graphical Abstract

1. Introduction

New Zealand has a unique climatology and population demographic that makes it an interesting environment for research into the risks and benefits of solar radiation exposure in the ultraviolet radiation (UVR) part of the spectrum. The risks are well known, with New Zealand possessing one of the highest per capita rates of melanoma incidence in the world, a statistic that shows no obvious sign of decline [1,2]. On the other hand, the health benefits of UVR exposure in helping to maintain sufficient levels of vitamin D, especially during winter months, have attracted increasing interest in recent years, although the extent of these benefits remain controversial [3,4,5]. UVR between 290 nm and 325 nm is the primary source of skin damage from sunlight as well as being key to vitamin D production in most humans, particularly in countries such as New Zealand with low levels of vitamin D fortification of food [6]. Low levels of vitamin D have been associated with a range of health issues including increased risk of respiratory and cardiovascular disease, diabetes, multiple sclerosis, and breast/bowel cancer, but to date there is a lack of conclusive evidence for causality [7,8]. There is also no clear public health consensus concerning the optimal levels of UVR exposure needed to maintain desirable vitamin D levels and to achieve the optimum balance between the risks and benefits of UVR exposure, and it is clear that more research in this area is needed [9,10].
New Zealand is situated at mid-latitudes (35° S to 47° S) in the southern hemisphere and experiences higher (by ~30%) levels of UV-B irradiation in the summer and lower levels in the winter compared to equivalent latitudes in the northern hemisphere, although differences in cloud cover are also a factor in winter [11,12]. This is due to a combination of factors: (1) the sun–earth separation reaches its minimum/(maximum) during the southern hemisphere summer/(winter), respectively; (2) New Zealand has low atmospheric pollution being relatively unindustrialized with a low population density; and (3) the country is affected by the dilution of stratospheric ozone due to the dispersion of the Antarctic ‘ozone hole’ in late spring, and also has relatively low ozone amounts in summer, mainly due to lower tropospheric ozone [13]. New Zealand’s population demographic is also diverse with a high-risk melanoma group comprising fair-skinned northern European immigrants from much higher latitudes and an indigenous population from lower or equivalent southern hemisphere latitudes with lower melanoma risks, but perhaps higher risks of vitamin D deficiency [14]. Within these groups, population risk factors with respect to skin cancer incidence and vitamin D deficiency can also vary with age, occupation, gender, and geographical variation.
Against this background, there is a need for more detailed research concerning the sun exposure behaviour and variations in received UVR doses for different population groups in order to develop optimum public health messages and to design primary skin cancer prevention and education programmes. Over the past 45 years, personal UVR exposures have been most commonly measured using chemical polysulphone film dosimeters [15,16], which provide very useful data concerning cumulative received doses, but lack the temporal resolution to correlate exposure with concurrent activities, measure the duration of exposure above different thresholds, and to determine maximum and average dose rates. In addition, temporal resolution allows noncompliant data to be identified, which might otherwise introduce unwanted biases in study findings.
In 2005, to provide this capability for UVR exposure studies, initially in New Zealand, personal electronic UV (EUV) dosimeters were developed and produced by Assoc. Prof. Martin Allen at the University of Canterbury, Christchurch, New Zealand, using broadband aluminium gallium nitride (AlGaN) photodiodes as the UVR sensing element [17]. These were designed to measure erythemally weighted UV irradiances at user-selected intervals from every 2 s to 120 s, which can be integrated to determine the received erythemal UVR dose [in units of standard erythemal dose (SED), where 1 SED = 100 Jm−2 of erythemal UVR] and UVR dose rates (SED/hr) over any user-selected time period. After validation studies involving the measurement of enhanced UVR exposures received on New Zealand ski fields [17], the first large-scale use of these EUV dosimeters was to provide objective measures of the UVR exposures of New Zealand primary school children (with a sample of n = 345) and outdoor workers (n = 77), including daily SEDs, time spent outdoors, and UVR exposure rates by activity and time of day [18,19]. This was followed by a two-year multiethnic (n = 502) investigation using EUV dosimeters to quantify the association between UVR exposure and 25-hydroxyvitamin D3 levels for different population groups in New Zealand. In this study, 8 s UV irradiances were integrated to provide SEDs for three daily time periods, which were corrected for clothing using self-reported diaries and then correlated against the results of blood samples taken at 4 and 8 weeks [20,21].
These EUV dosimeters (with ongoing modifications to improve memory capacity, data download speed, and the screening/rejection of any AlGaN photodiodes with nonzero visible responses [22]) have also been used in a wide range of applications in many other countries. Examples include providing objective personal UVR exposures to validate self-reported behaviours recorded via questionnaires/cell phone diaries [23], clothing-adjusted UVR exposures for the Australian Ultraviolet and Immunity Study [24], in a three-year randomized control trial (n~892) to objectively measure the impact of personalized melanoma genomic risk information on skin cancer prevention behaviours [25], and in primary skin cancer prevention and education programmes [26,27]. In this article, we review the performance of these EUV dosimeters in measuring personal UVR exposures and examine their performance limits with respect to meteorological grade reference instruments.

2. Electronic UV Dosimeter Details

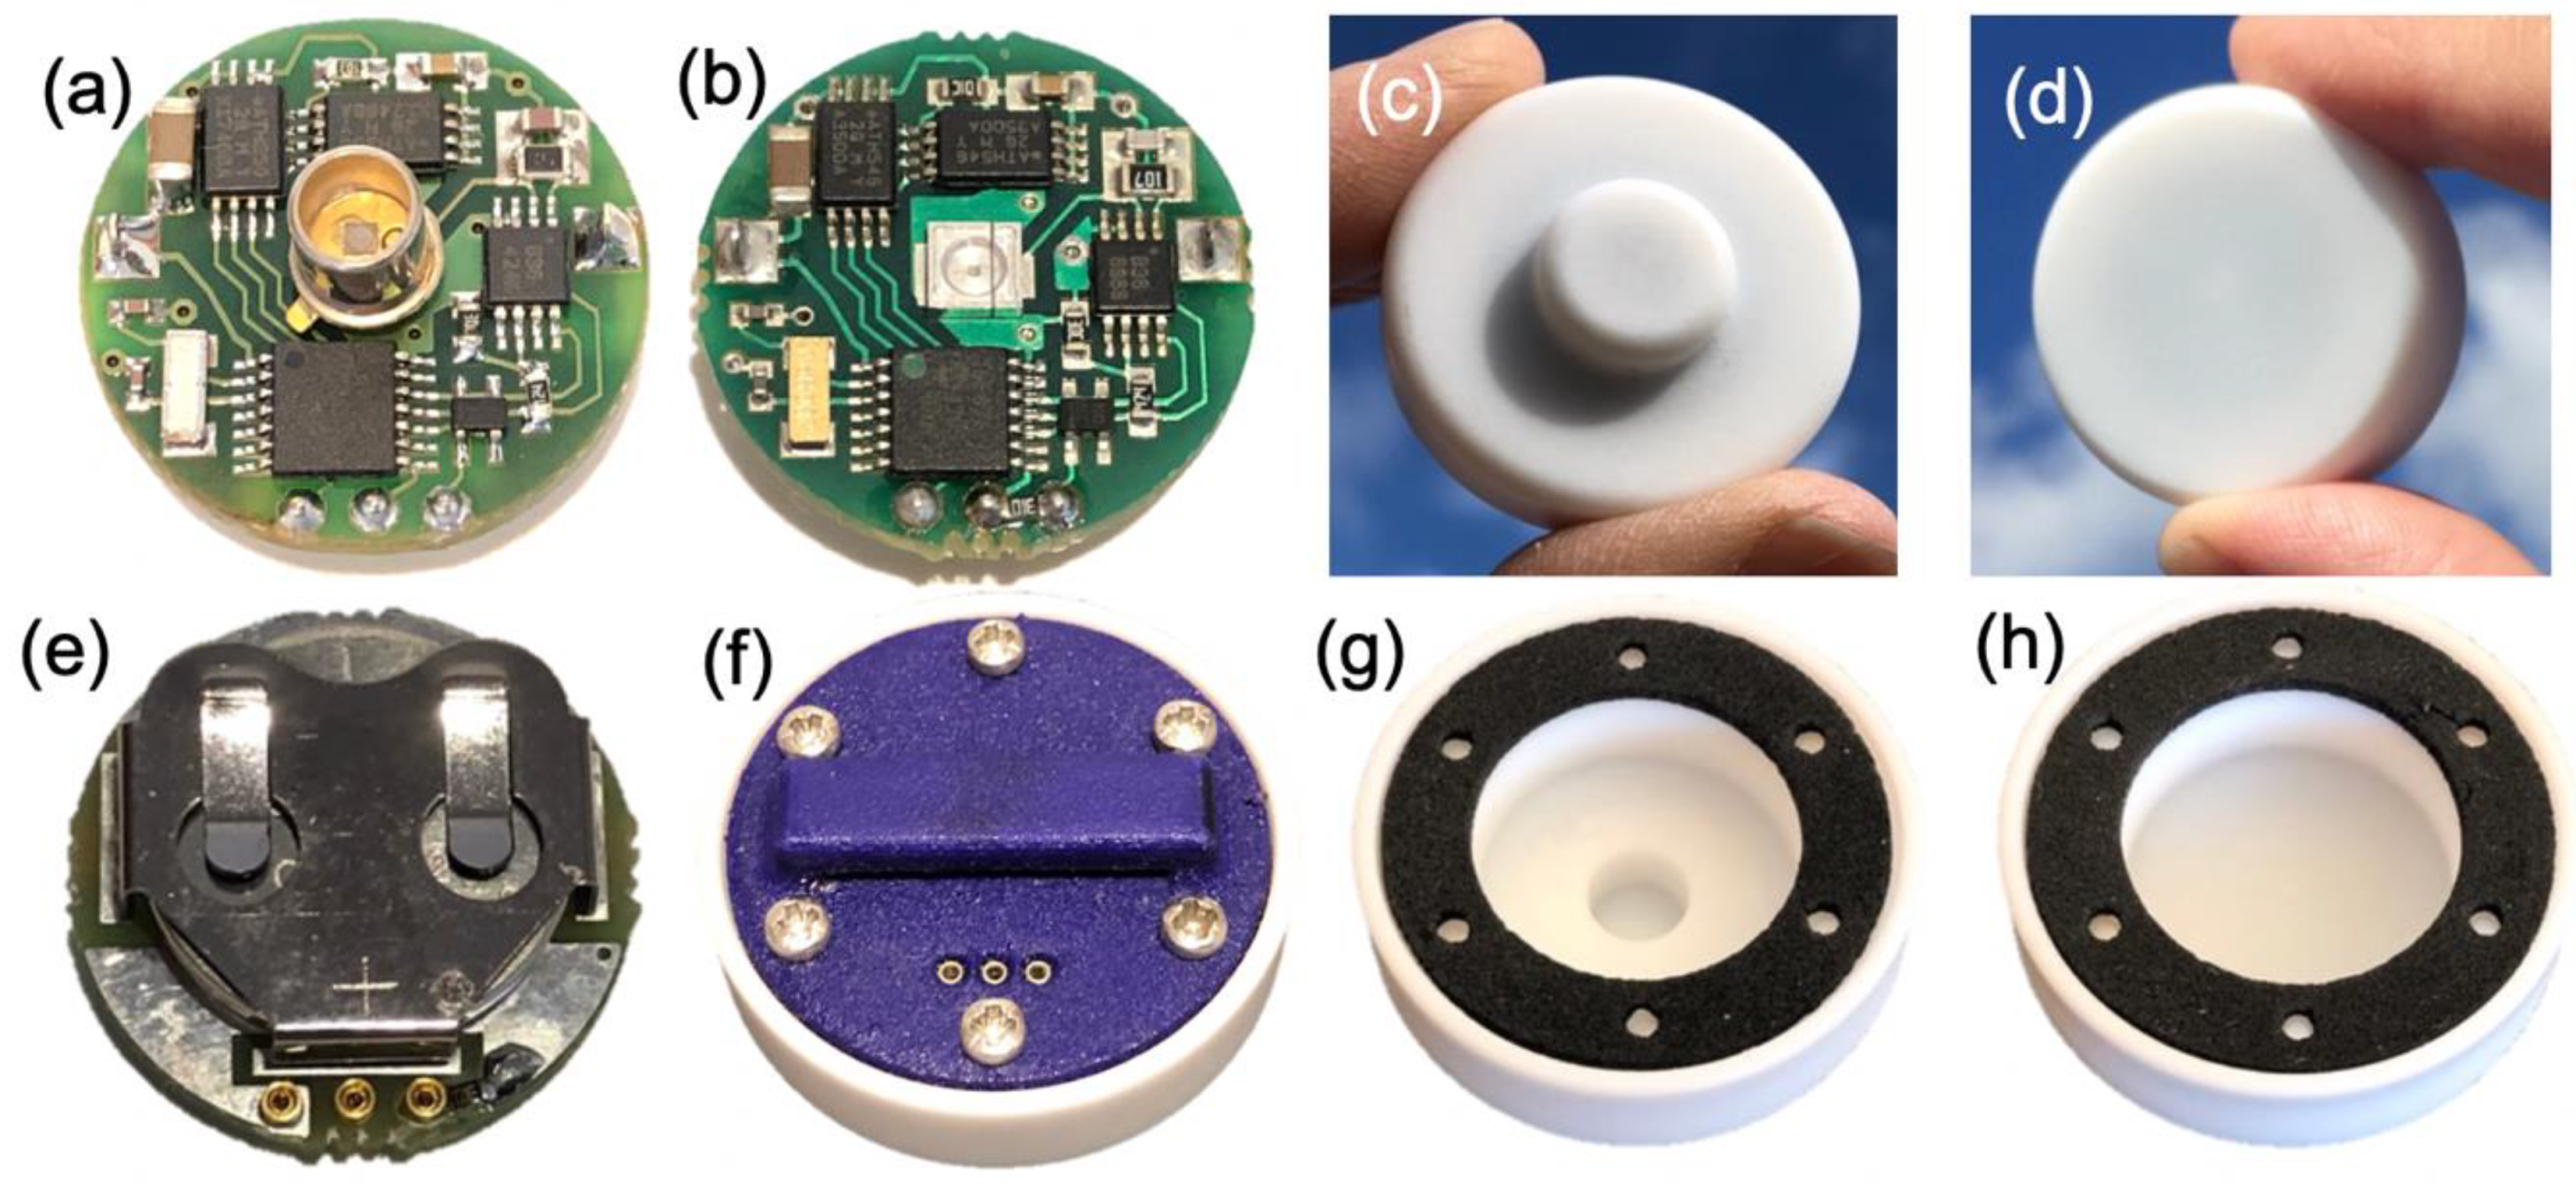
2.1. Design and Operation

The EUV dosimeters (Figure 1) use an aluminium gallium nitride (AlGaN) Schottky photodiode as the key UVR sensing element [28,29,30]. Erythemally matched AlGaN photodiodes from two different manufacturers, subsequently referred to as Type A and Type B, were used, with the main difference being the type of photodiode housing. Type A photodiodes are enclosed inside a TO-5 metal can, while the Type B devices are mounted in a metal-coated plastic surface-mount package. Both types of photodiode incorporate a UVR-transparent quartz window and have similar spectral responsivities. In each case, the AlGaN photodiode is mounted directly behind a shaped polytetraflouroethylene (PTFE) diffuser to broaden its angular response and achieve a reasonable approximation to the cosine response of flat diffuse surfaces, including human skin. The PTFE diffuser also acts as weatherproof case that is sealed against a robust lightweight nylon or metal backing plate using a neoprene gasket.
AlGaN photodiodes produce a photocurrent in the nanoamp range when illuminated with solar UVR. This current is amplified using a precision operational amplifier and then converted to a digital signal (from 0 to 1023). This digital signal is linearly proportional to the intensity of the incident UV irradiation weighted according to the spectral response of the AlGaN photodiode. The sampling functionality is provided by an embedded microcontroller and solid-state memory that records the digital UVR signal at user-programmable time intervals (t = 2 s to 120 s). This provides up to (43,200/t) instantaneous UVR readings over a typical 12-h daytime recording period. Most studies use an 8 s sampling interval that produces ~5,400 readings per day. The data can be integrated to determine the received UVR dose and UVR dose rate for any user-selected time period. Total memory capacity is 131,000 readings (~24 days at t = 8 s), but this can be significantly extended (by ~5 to 10 times) by the use of a memory compression algorithm that stores data only when the UV irradiance changes.
Data are transferred to and from the EUV dosimeter using a 3-pin miniature data port on the backside that can be connected to a personal computer via a USB cable. Data transfer is controlled by a graphical user interface (GUI) that displays the data as they are downloaded and stored into space separated text files that can then be replotted and analysed using the same software. The EUV dosimeters are powered by a CR3216 3.0 V lithium coin cell (16 mm × 3.2 mm) that provides at least 4 months of continuous operation (at t = 8 s), although this can also be extended by using longer sampling intervals, as the device is placed into a power-saving sleep mode between readings. The resulting EUV dosimeters are small (35 mm × 13 mm) and lightweight (19 g) and can be deployed in a number of different ways, as shown in Figure 2. These include: (i) being pinned to clothing using a safety clasp (Figure 2a–c), (ii) attached to hard surfaces (e.g., safety hard hats) using industrial Velcro (Figure 2d), (iii) worn on the body using a fabric wristwatch strap (Figure 2d,e) or an elasticated arm band (Figure 2f,g), (iv) placed directly on horizontal surfaces during school-based SunSmart education programmes (Figure 2h), (v) connected to electronic displays in handheld UVR meters (Figure 2i) or in solar-powered public health displays (Figure 2j), using a 3-D printed holder that electrically connects to the 3-pin micro data port on the backside of each dosimeter.

2.2. Key UVR Sensing Components

The critical components that determine the performance of the EUV dosimeters are (i) the AlGaN Schottky photodiode, since the largest errors in erythemal UVR measurements are usually deviations in the spectral response of the sensing element from the CIE erythemal action spectrum [31,32] (hereafter referred to as the spectral mismatch error) and (ii) the PTFE diffuser, since the angular response of most solid state detectors is narrower than the cosine response of flat, diffuse surfaces, including human skin [33] (hereafter referred to as the cosine response error). In principle, it is possible to optimize the AlGaN photodiode and PTFE diffuser to achieve very low spectral mismatch and cosine response errors. In practice, the need for large numbers of EUV dosimeters in statistically meaningful behaviour studies means that some cost–performance compromise is usually necessary.

2.2.1. AlGaN Schottky Photodiodes

AlGaN is a wide band gap semiconductor whose spectral response can be tuned to different wavelength ranges from 250 nm to 370 nm within the UVR spectrum by adjusting the Al/Ga fraction [28,30]. AlGaN is chemically inert, has a high radiation resistance, and a significantly higher temperature stability than low band gap semiconductors (Si, GaAs, GaP) and the phosphors used in ‘Robertson–Berger type’ erythemal radiometers. Schottky photodiodes are simple two terminal devices consisting of a semitransparent Schottky (or rectifying) contact between a high work function metal, such as Au or Ni, and a thin film of AlGaN, and as such are reasonably cheap to manufacture. Their main advantage is that they have an inherently high rejection of visible light without the need for additional optical filters, and therefore also do not suffer from filter solarisation and temperature stability effects. Their spectral response is determined by a combination of the Al/Ga fraction, which determines their band gap and cut-off wavelength, and native defects introduced into the AlGaN material during growth that affect the gradient of their cut-off edge [29,30]. The Type A and Type B Schottky photodiodes were fabricated by SVT Associates, Inc. (USA) and Genicom Co. Ltd. (Korea), respectively, using AlGaN thin film semiconductor wafers with similar Al/Ga fractions ~0.26 grown by molecular beam epitaxy (MBE) and metal organic chemical vapour deposition (MOCVD), respectively [28,34]. Both of these are gold-standard semiconductor growth techniques that produce high quality material with low defect densities and correspondingly very low optical absorbance in the visible spectrum. Since each photodiode is fabricated from a small piece (~0.4 mm × ~0.4 mm chip) of a much larger AlGaN wafer, there may be some small between-device variations in composition and material quality, that will in turn result in small between-device variations in spectral responsivity, although these will usually be unimportant in most practical applications.

2.2.2. PTFE Diffuser

Since UVR is strongly scattered by the atmosphere, the global UV irradiance at the earth’s surface is the sum of direct and diffuse components [35]. The diffuse component arrives from all directions and contributes a significant fraction of the total UVR received by the human body, with the relative contribution varying with solar zenith angle (SZA), wavelength, and atmospheric conditions, such as cloud cover and aerosol thickness [36,37]. The angular response of instruments that measure global UV irradiance should be proportional to the cosine of the SZA so that they collect radiation from an entire hemisphere [38,39]. This is also important for measuring personal UVR exposures, since human skin is a relatively flat and diffuse surface and absorbs UVR with an approximate cosine response [33]. Although AlGaN photodiodes have wider and smoother angular responses than low band gap detectors that require optical filters to reject visible light, a shaped PTFE diffuser is still required to achieve an acceptable cosine response. PTFE is the material of choice for this purpose, having a low thermal expansion coefficient and a high resistance to moisture adsorption due to its hydrophobic nature. Since the Type A and Type B AlGaN photodiodes are packaged in different housings (i.e., a cylindrical TO-5 can and a square surface-mount package, respectively), different PTFE diffusers were designed for each photodiode, as shown in Figure 1c,d, respectively.

3. Results

3.1. Spectral Mismatch Errors, Cosine Response Errors, and the Use of Correction Factors

The performance of the EUV dosimeters was evaluated by comparing their spectral mismatch and cosine response errors with those of a commonly used, meteorological grade instrument. In this work, we used a second generation, temperature stabilized ‘Robertson–Berger type’ erythemal radiometer [40,41], manufactured by Yankee Environmental Systems Inc., USA, hereafter referred to as a YES erythemal radiometer. This is installed at Lauder (Lat: −45.0 Long: 169.7 Alt: 370 m) in the South Island of New Zealand, and is operated by the National Institute for Water and Atmospheric Research (NIWA) to provide meteorological UVR data. A comparison of its spectral response against other YES erythemal radiometers in use across New Zealand and Australia showed that it is fully representative of its class. This YES erythemal radiometer and a similar instrument at Kyle Street, Christchurch, NZ, (Lat: −43.5 Long: 172.6 Alt: 30 m) are regularly used to calibrate EUV dosimeters for behavioural studies in New Zealand and elsewhere. Both YES instruments are calibrated against a UVR spectrometer at Lauder whose calibration is, in turn, maintained against reference lamps with calibration traceable to the US National Institute of Standards and Technology (NIST).

3.1.1. Spectral Mismatch Errors

Figure 3 shows the spectral responsivities of a Type A and a Type B AlGaN photodiode, as used in the EUV dosimeters, compared with the response of the YES erythemal radiometer and the CIE erythemal action spectrum [31,32]. These measurements were taken using monochromatic light of increasing wavelengths from 280 nm to 400 nm from a McPherson 2035D double monochromator at the Measurements Standards Laboratory of New Zealand. It is important to note that the spectral responsivities of the AlGaN photodiodes in Figure 3 are not necessarily representative of all Type A and Type B AlGaN photodiodes due to the between-device and between-batch variations in AlGaN composition and material quality that affect the position and gradient of the absorption cut-off edge, respectively. However, the differences in their spectral responsivities provide interesting examples of the effect of different spectral mismatch errors on the measurement of erythemally weighted UV irradiances. As expected, both AlGaN photodiodes showed sharp spectral response cut-off edges and a negligible response to visible radiation. However, all the devices, including the meteorological grade YES erythemal radiometer, showed deviations from the CIE erythemal action spectrum. The Type A photodiode and YES erythemal radiometer showed similar absorption edge gradients in their spectral response at UV-B wavelengths (300–325 nm) that were shifted by ~10 nm to longer wavelengths compared to the CIE erythemal action spectrum. The Type B photodiode had a significantly steeper absorption edge in the UV-B region than the other instruments and also showed a slightly closer match to the 325–400 nm UV-A section of the CIE erythemal action spectrum.
In principle, it is possible to correct any broadband instrument in a fixed setting for spectral mismatch errors (i.e., the output error due to deviations in spectral responsivity from the CIE erythemal action spectrum) via the calculation of correction factors (CFs) that are a function of SZA and total ozone column measured in Dobson units (DU), using radiative transfer model calculations (TUV 4.1a) [42]. These CFs provide a quantitative measure of the spectral mismatch error, and should approach unity for all SZA and ozone values for a perfect match. Figure 4 shows the CFs for the Type A and Type B photodiodes and the YES erythemal radiometer for a range of SZA (5-degree steps) and ozone levels (50 DU steps) determined by calculating the ratios between erythemally weighted irradiances and irradiances weighted by the instrument spectral response functions (see the Supplementary Material for the numerical tables). The CFs for other SZAs were interpolated. Ozone values from 250 DU to 450 DU were used as these are representative of the maximum annual ozone variations over New Zealand, with mean monthly variations typically between 250 DU and 350 DU [12,43]. The CFs were normalized to the global average ozone value of 300 DU and an SZA of 30°.
The CFs for the Type A photodiode and the YES erythemal radiometer were remarkably similar, especially for SZA < 60°, which is surprising considering that the former is a much cheaper device. Their similar performance is due to their similar spectral responsivities (see Figure 3) in the 290–325 nm spectral range. This range is important for erythemal UVR measurements, typically accounting for more than 80% of the cumulative erythemally weighted UV irradiance at noon in the New Zealand summer (as shown in Figure 5b inset). For SZAs > 70° there were increasing differences between the CFs, with the YES erythemal radiometer having slightly higher CFs. However, the erythemally weighted UV irradiances at these high SZAs are usually very small compared to those during the rest of the day, making these differences unimportant for most practical situations. This is illustrated in Figure 5, which shows (a) the incident solar UVR spectrum and (b) the erythemally weighted UVR spectrum at different SZA, measured on the 21st December 2009, under clear sky conditions at Lauder, NZ, using a NIWA UVR spectrometer. This shows the increasing relative contribution of longer UVR wavelengths to the erythemally weighted UV irradiance with increasing SZA and the low erythemally weighted UV irradiance for SZAs > 70°.
Interestingly, the CFs for the Type B AlGaN photodiode were comparatively smaller (i.e., closer to unity) for low SZAs but became much larger for SZA > 60°, particularly at high ozone levels. This is related to the steeper absorption edge in the spectral responsivity of the Type B AlGaN photodiode (see Figure 3) compared to the other instruments and the CIE erythemal action spectrum. This leads to a relative underweighting of longer wavelengths in the important 290–325 nm range. Longer wavelengths provide an increasing contribution to the total erythemally weighted UV irradiance at larger SZAs and higher ozone values, explaining the larger CFs for these conditions. However, the CFs for the Type B AlGaN photodiode were closer to unity at low SZAs (< 50°) and low-to-moderate ozone levels (300 DU to 350 DU) that correspond to high erythemal UVR conditions and which account for most of the erythemally weighted UV irradiance in the summer months. Interestingly, the sharp adsorption edge in the spectral response of the Type B photodiode is an indicator of very high AlGaN material quality and it should be possible adjust the material growth conditions to decrease the steepness of the absorption edge closer to that of the CIE erythemal action spectrum.

3.1.2. Cosine Response Errors

Instruments that measure global UV irradiance (and human UVR exposure) should ideally have an angular response identical to the cosine response of a flat horizontal surface [38,39]. Figure 6 shows the cosine response errors of a Type A and Type B EUV dosimeter (which have different diffusers, see Figure 1c,d), compared to the YES erythemal radiometer and a NIWA UVR spectrometer—the gold standard instrument for measuring UV spectral irradiance. The cosine error (ψ) is defined as:
ψ = E ( θ ) m e a s u r e d E ( θ = 0 ) · c o s θ
where E(θ = 0) is the irradiance measured at normal incidence and E(θ) is the irradiance measured at an angle θ from the normal to the plane of the detector. The cosine response error was measured from the change in instrument response as the detector was rotated while viewing an FEL quartz halogen lamp at a distance of 1 metre from the entrance optic.
The cosine response error for both EUV dosimeters were much larger than for the NIWA UVR spectrometer, but are comparable to that of the YES erythemal radiometer. These cosine response errors will cause the EUV dosimeters and the YES erythemal radiometer to underestimate global irradiances at large SZA, so CFs > 1 (i.e., upward CFs) would typically be required. In practice, separate corrections for angular response errors in EUV dosimeters are not usually required since (i) they are implicitly included in cross-calibrations against reference instruments carried out via side-by-side comparisons in sunlight that contains a significant diffuse UVR component, (ii) most of the UVR at large SZA is dominated by the diffuse component, and (iii) the orientation of the EUV dosimeter is not usually known and frequently changes when worn on the body during behavioural studies.

3.1.3. Conversion to Vitamin D-Weighted UV Irradiances

The primary source of vitamin D for most humans is sun exposure [6]. However, the amount of sun exposure required to maintain a healthy vitamin D status is the subject of considerable debate [9,10]. Although the EUV dosimeters were designed to measure erythemally weighted UV irradiance, they have provided objective UVR exposure measures in studies into human vitamin D production [20,21]. In these studies, serum 25-hydroxyvitamin D3 [25(OH)D3] levels determined from participant blood samples were correlated against personal erythemally weighted UVR doses, measured using Type B dosimeters. Since the relationship between erythemally weighted and vitamin D-weighted irradiance is nonlinear, with the latter being significantly more dependent on ozone column and SZA, it is of interest to compare the spectral mismatch errors of the EUV dosimeters and the YES erythemal radiometer with respect to vitamin D production. Figure 7 shows the action spectrum for vitamin D production published by Bouillon et al. [44] and adopted by the CIE. Vitamin D production has a shorter wavelength limit and a higher weighting in the 300–315 nm range compared to erythema. Figure 7 also shows the spectral responsivity of the same Type A and Type B AlGaN photodiodes and YES erythemal radiometer as before. The Type B photodiode with its steeper absorption edge between 310 nm and 320 nm has a better match to the CIE vitamin D action spectrum than the Type A photodiode and YES erythemal radiometer. However, all the instruments overestimate the contribution from longer wavelengths in the vitamin D producing 290–325 nm range, with the Type A photodiode and YES erythemal radiometer also having a higher response in the 325–400 nm UV-A range, which has a zero weighting in the CIE vitamin D action spectrum.
It is also possible to calculate correction factors (CFs) to convert the response of the Type A and Type B AlGaN photodiodes and the YES erythemal radiometer to vitamin D-weighted UV irradiances. Correction factors (CFs) were determined for a range of SZA (5-degree steps) and ozone amounts (50 DU steps) by calculating the ratios between vitamin D weighted irradiances (using the CIE vitamin D action spectrum [44]) and irradiances weighted by the instrument spectral response functions (see the Supplementary Material for the numerical tables). Corrections for other SZAs were interpolated. In all cases, these correction factors were normalised to unity at SZA = 30°, and ozone = 300 DU. These CFs are shown in Figure 8 as a function of SZA and total ozone amount. As expected, all the instruments tend to significantly overestimate vitamin D weighted UVR, especially at large SZA and high ozone values, with the Type B photodiode requiring the smallest correction. The Type A and YES erythemal radiometer give much better representations of erythemally weighted UVR than vitamin D-weighted UVR, with the CFs much further from unity for vitamin D production. However, the CFs for the Type B photodiode were relatively modest, particularly at low solar zenith angles, which provide the highest relative contribution to vitamin D production.

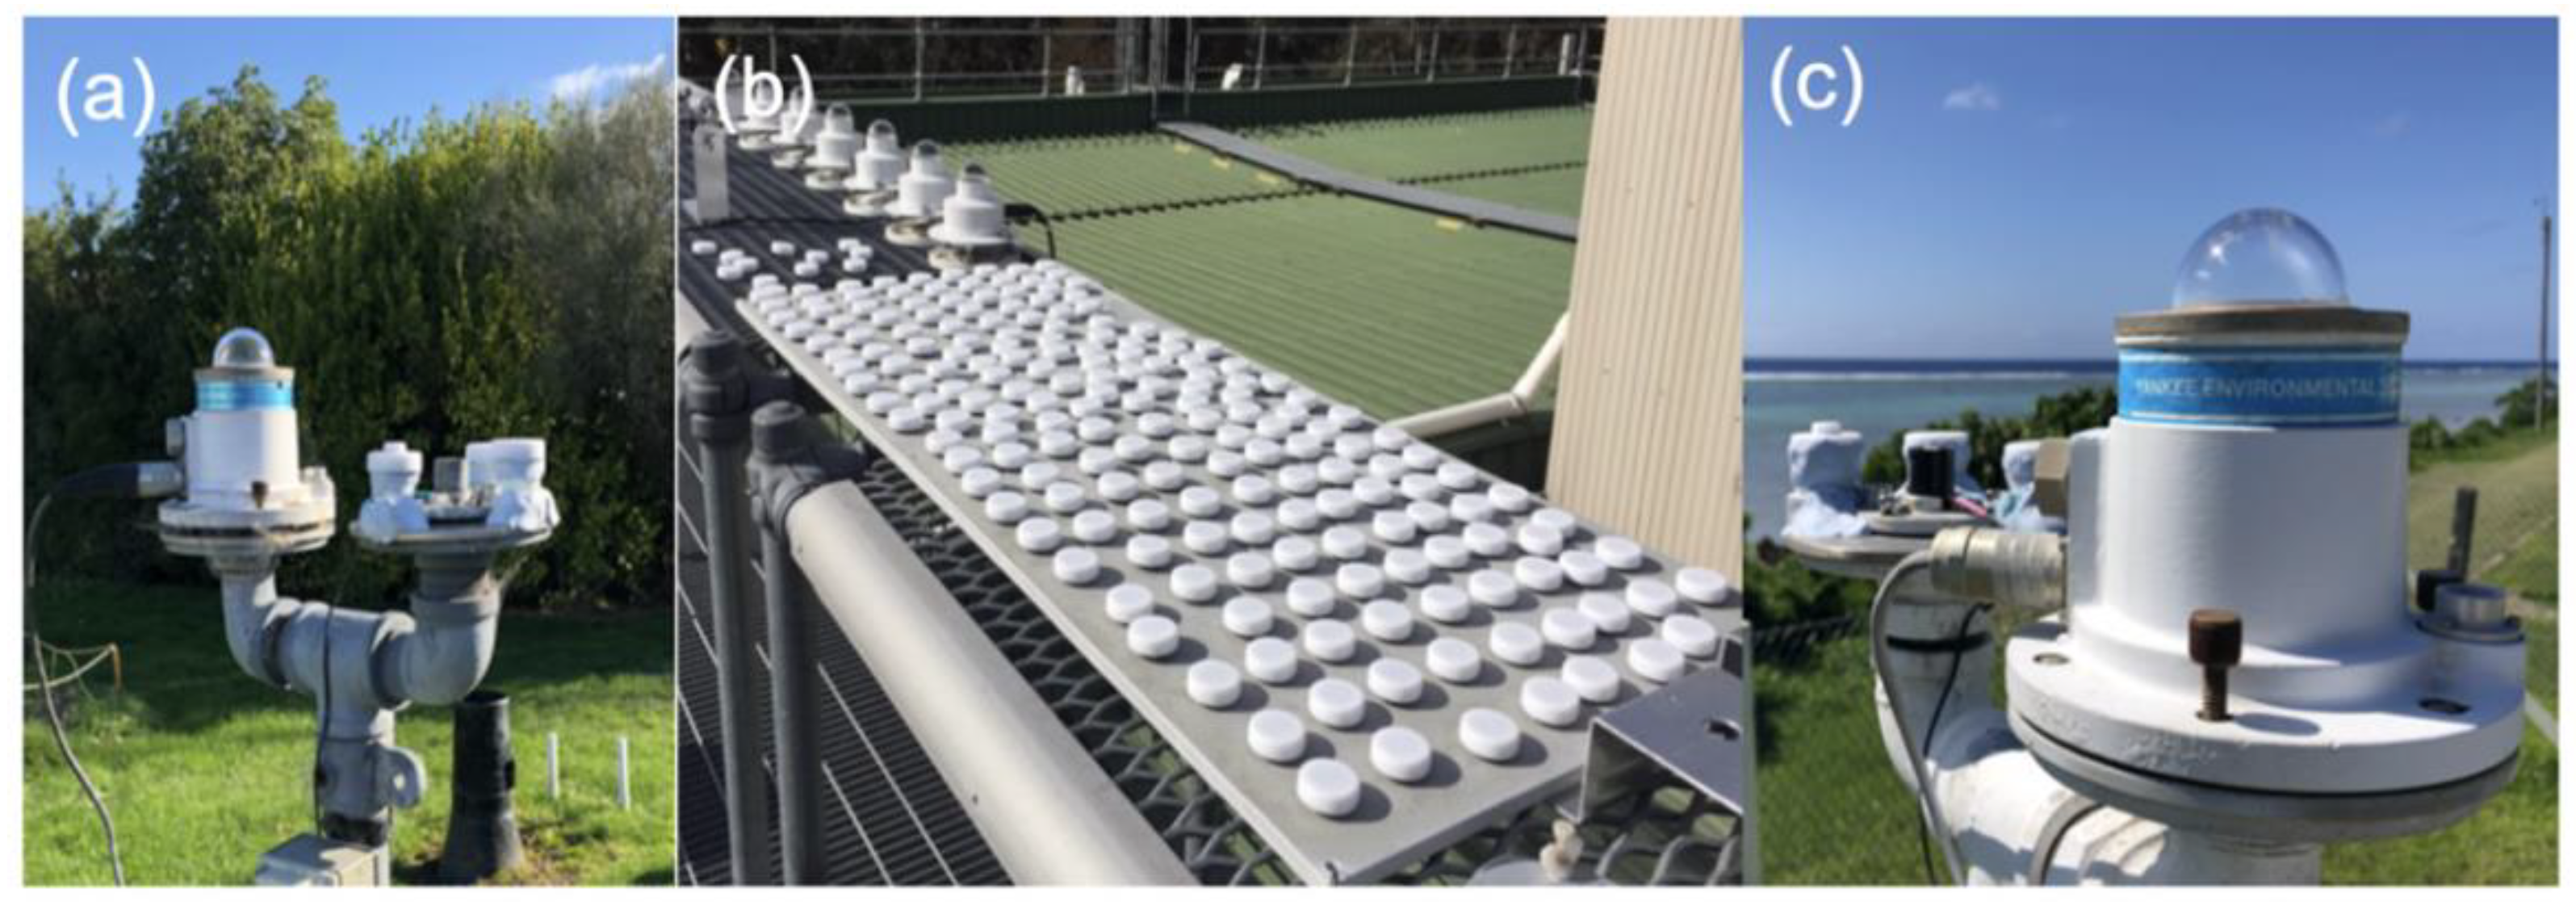
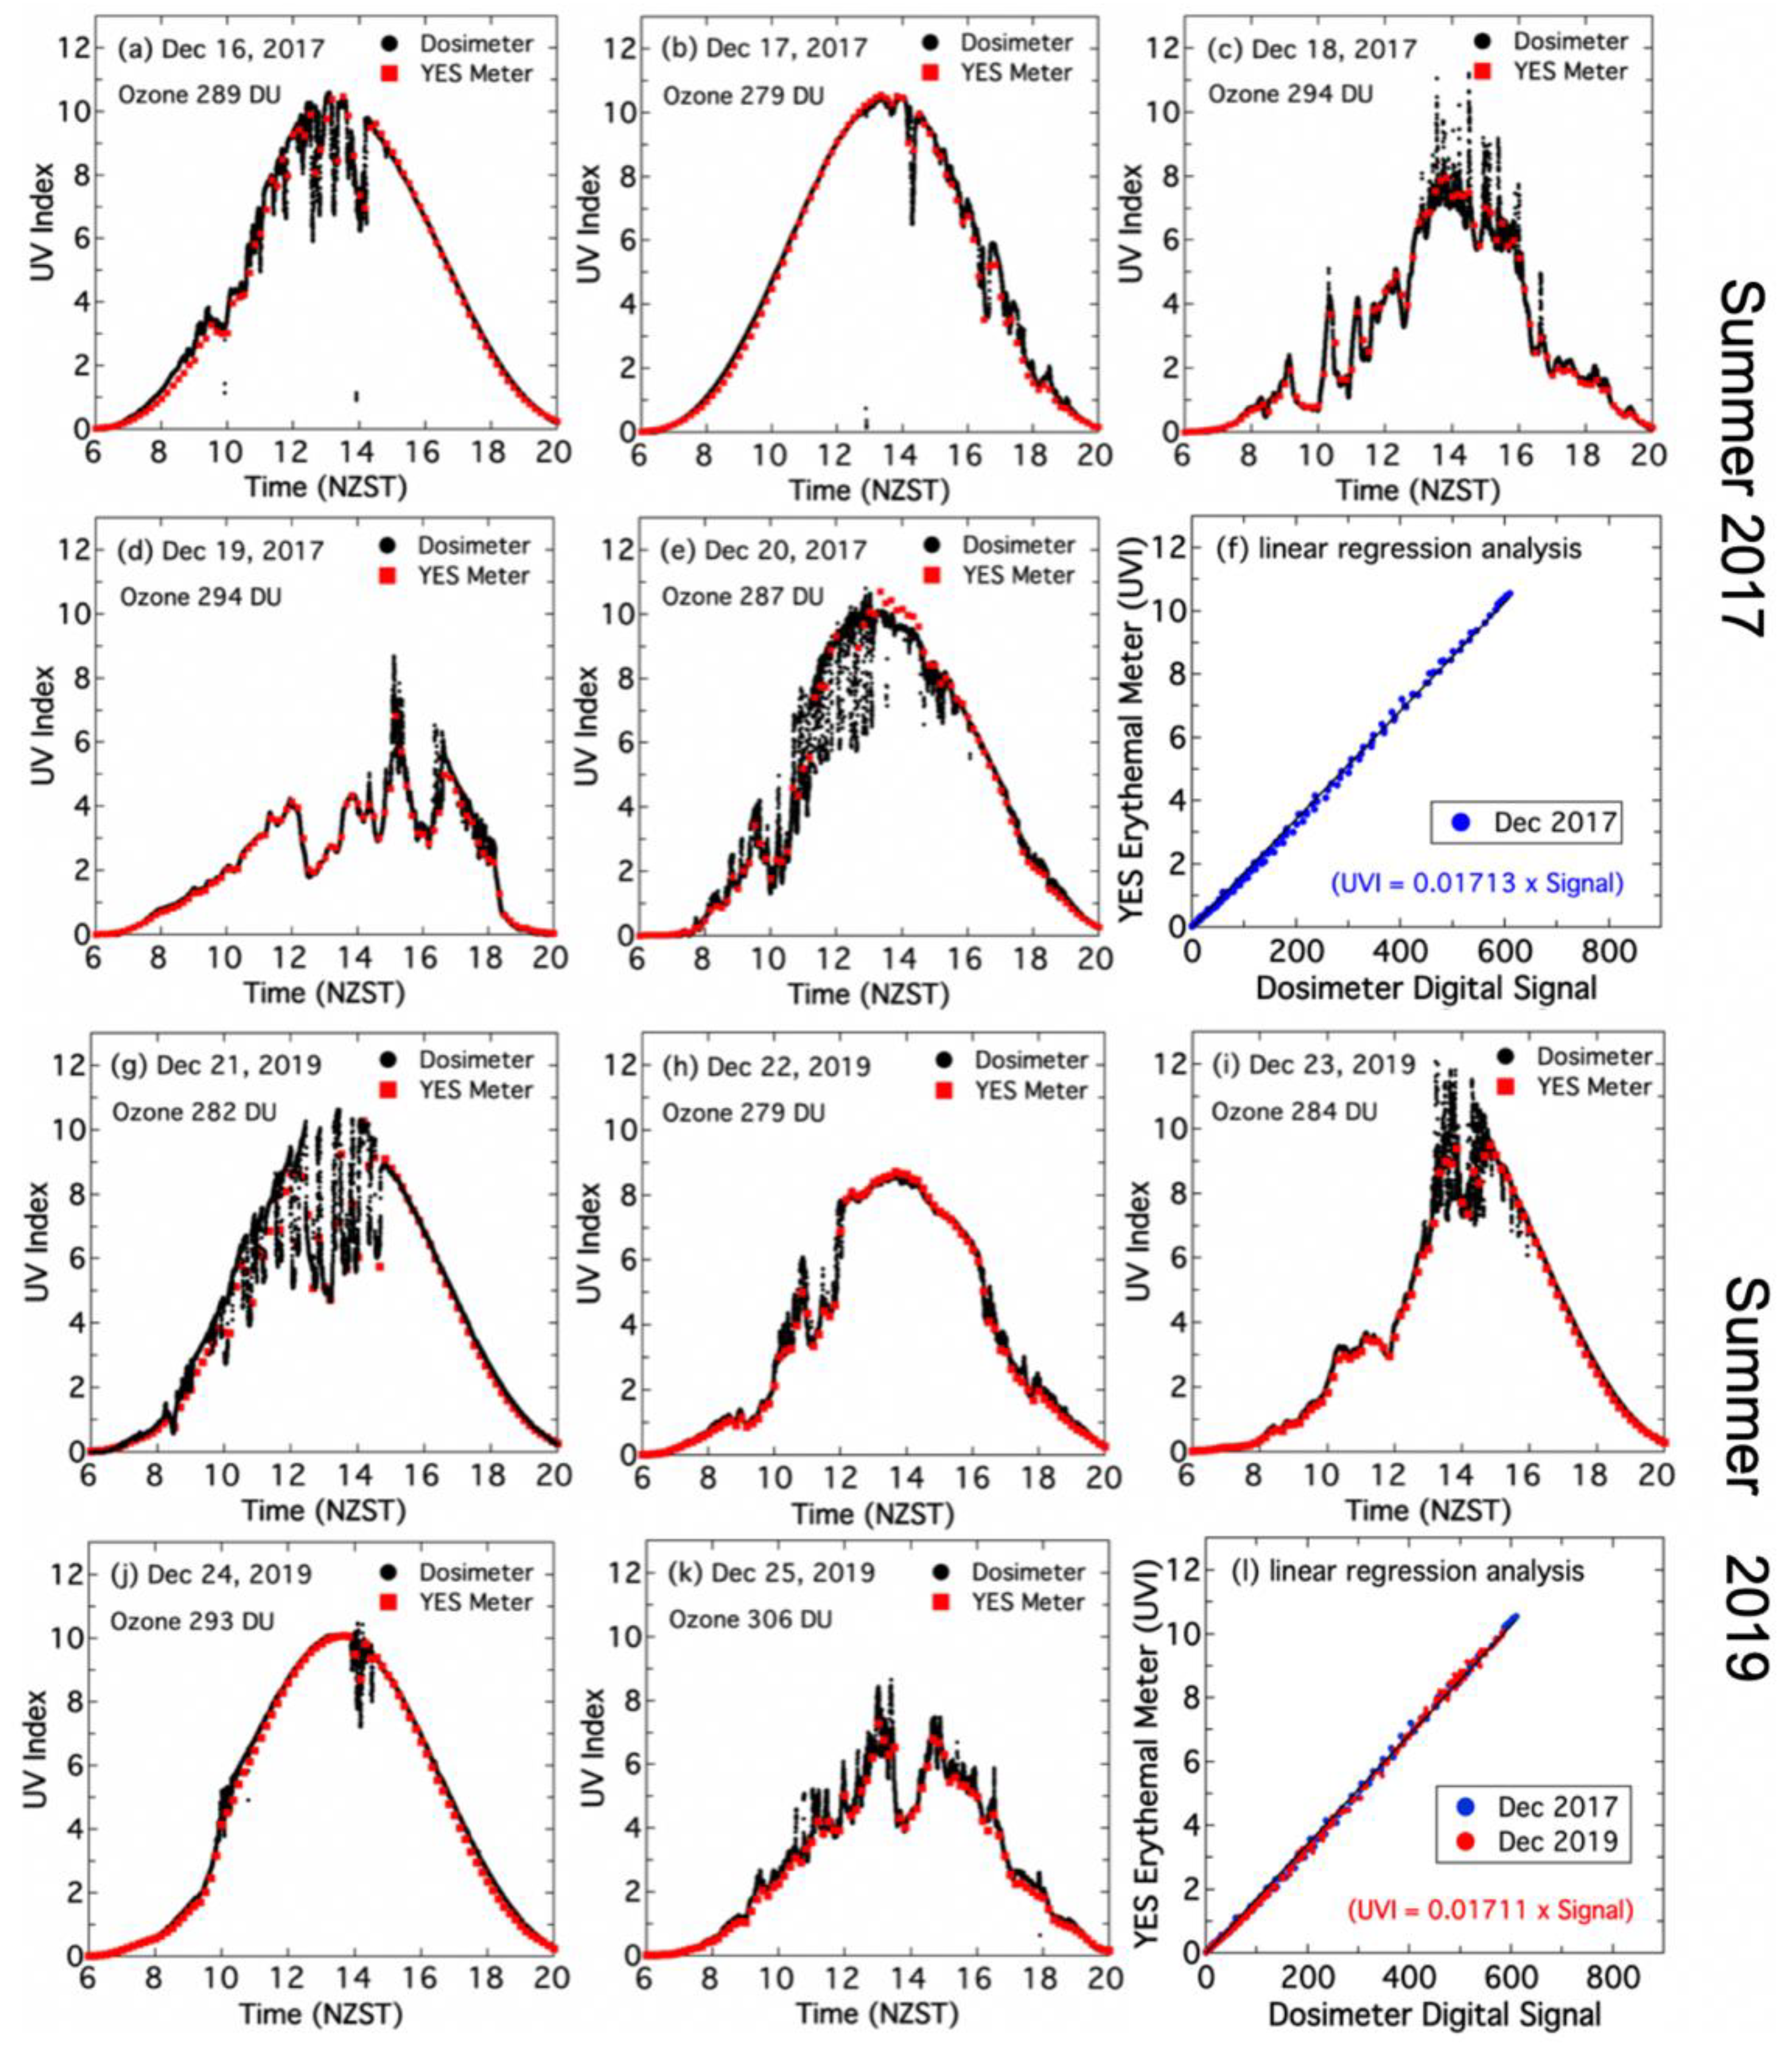
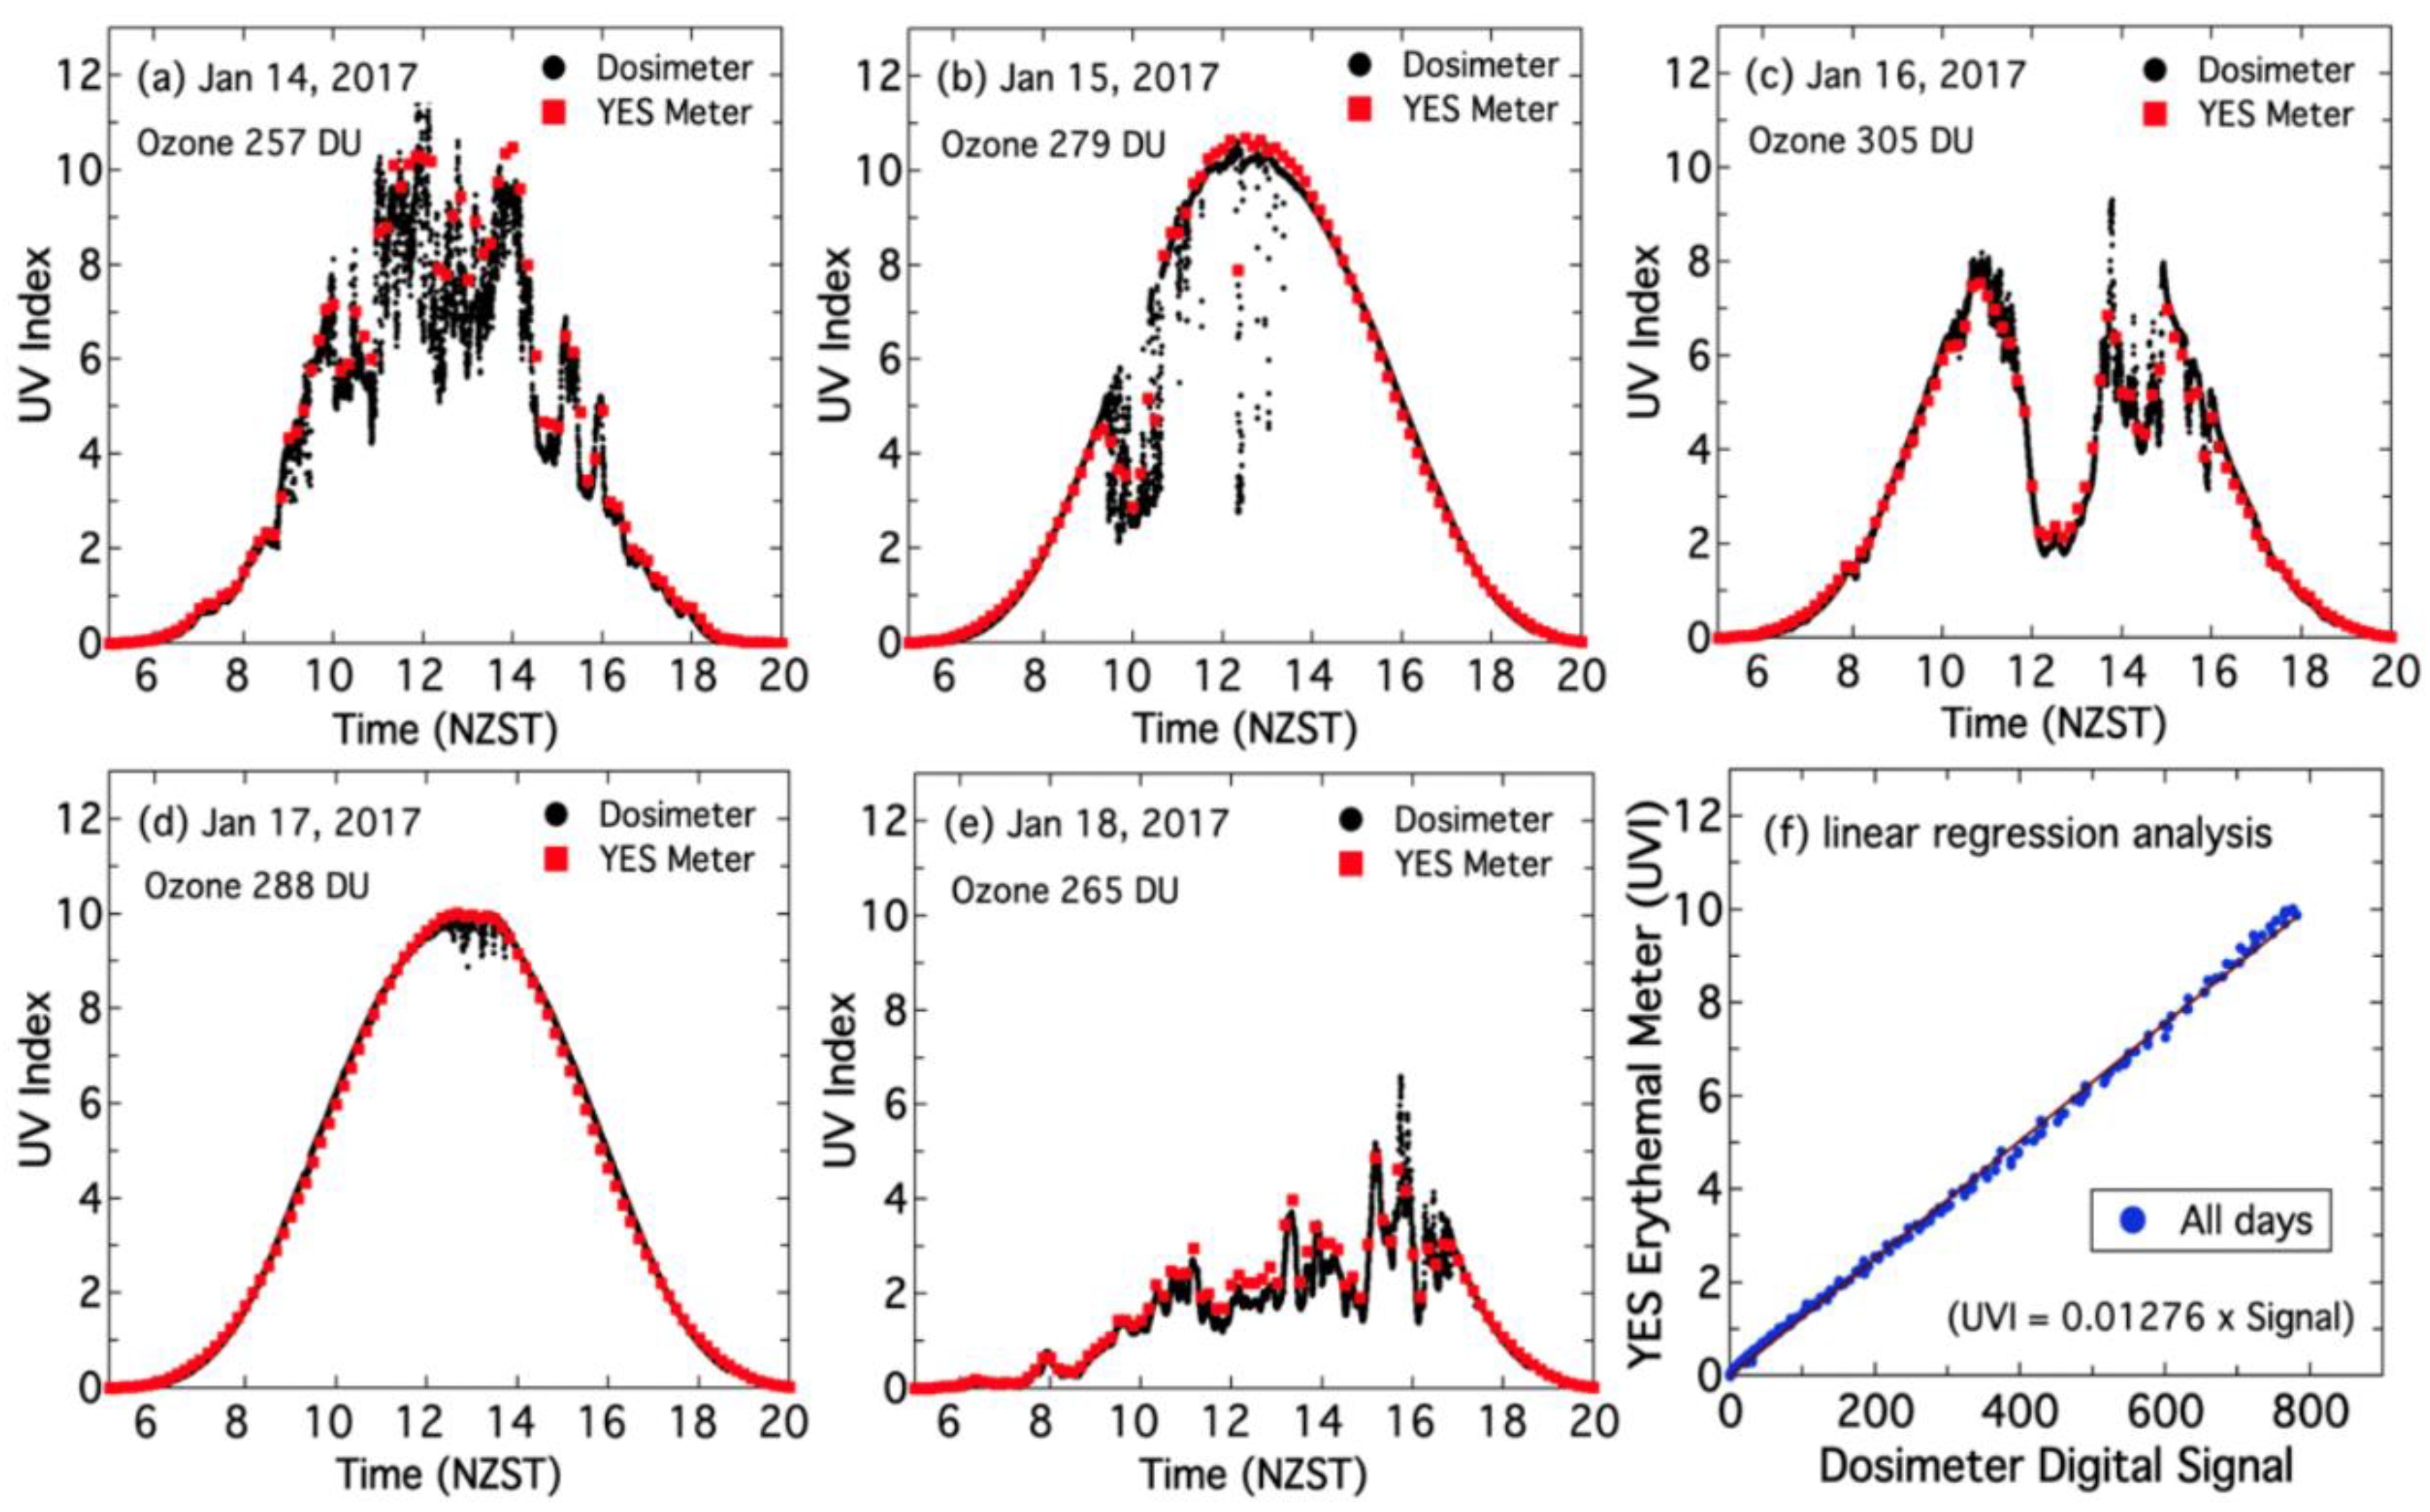
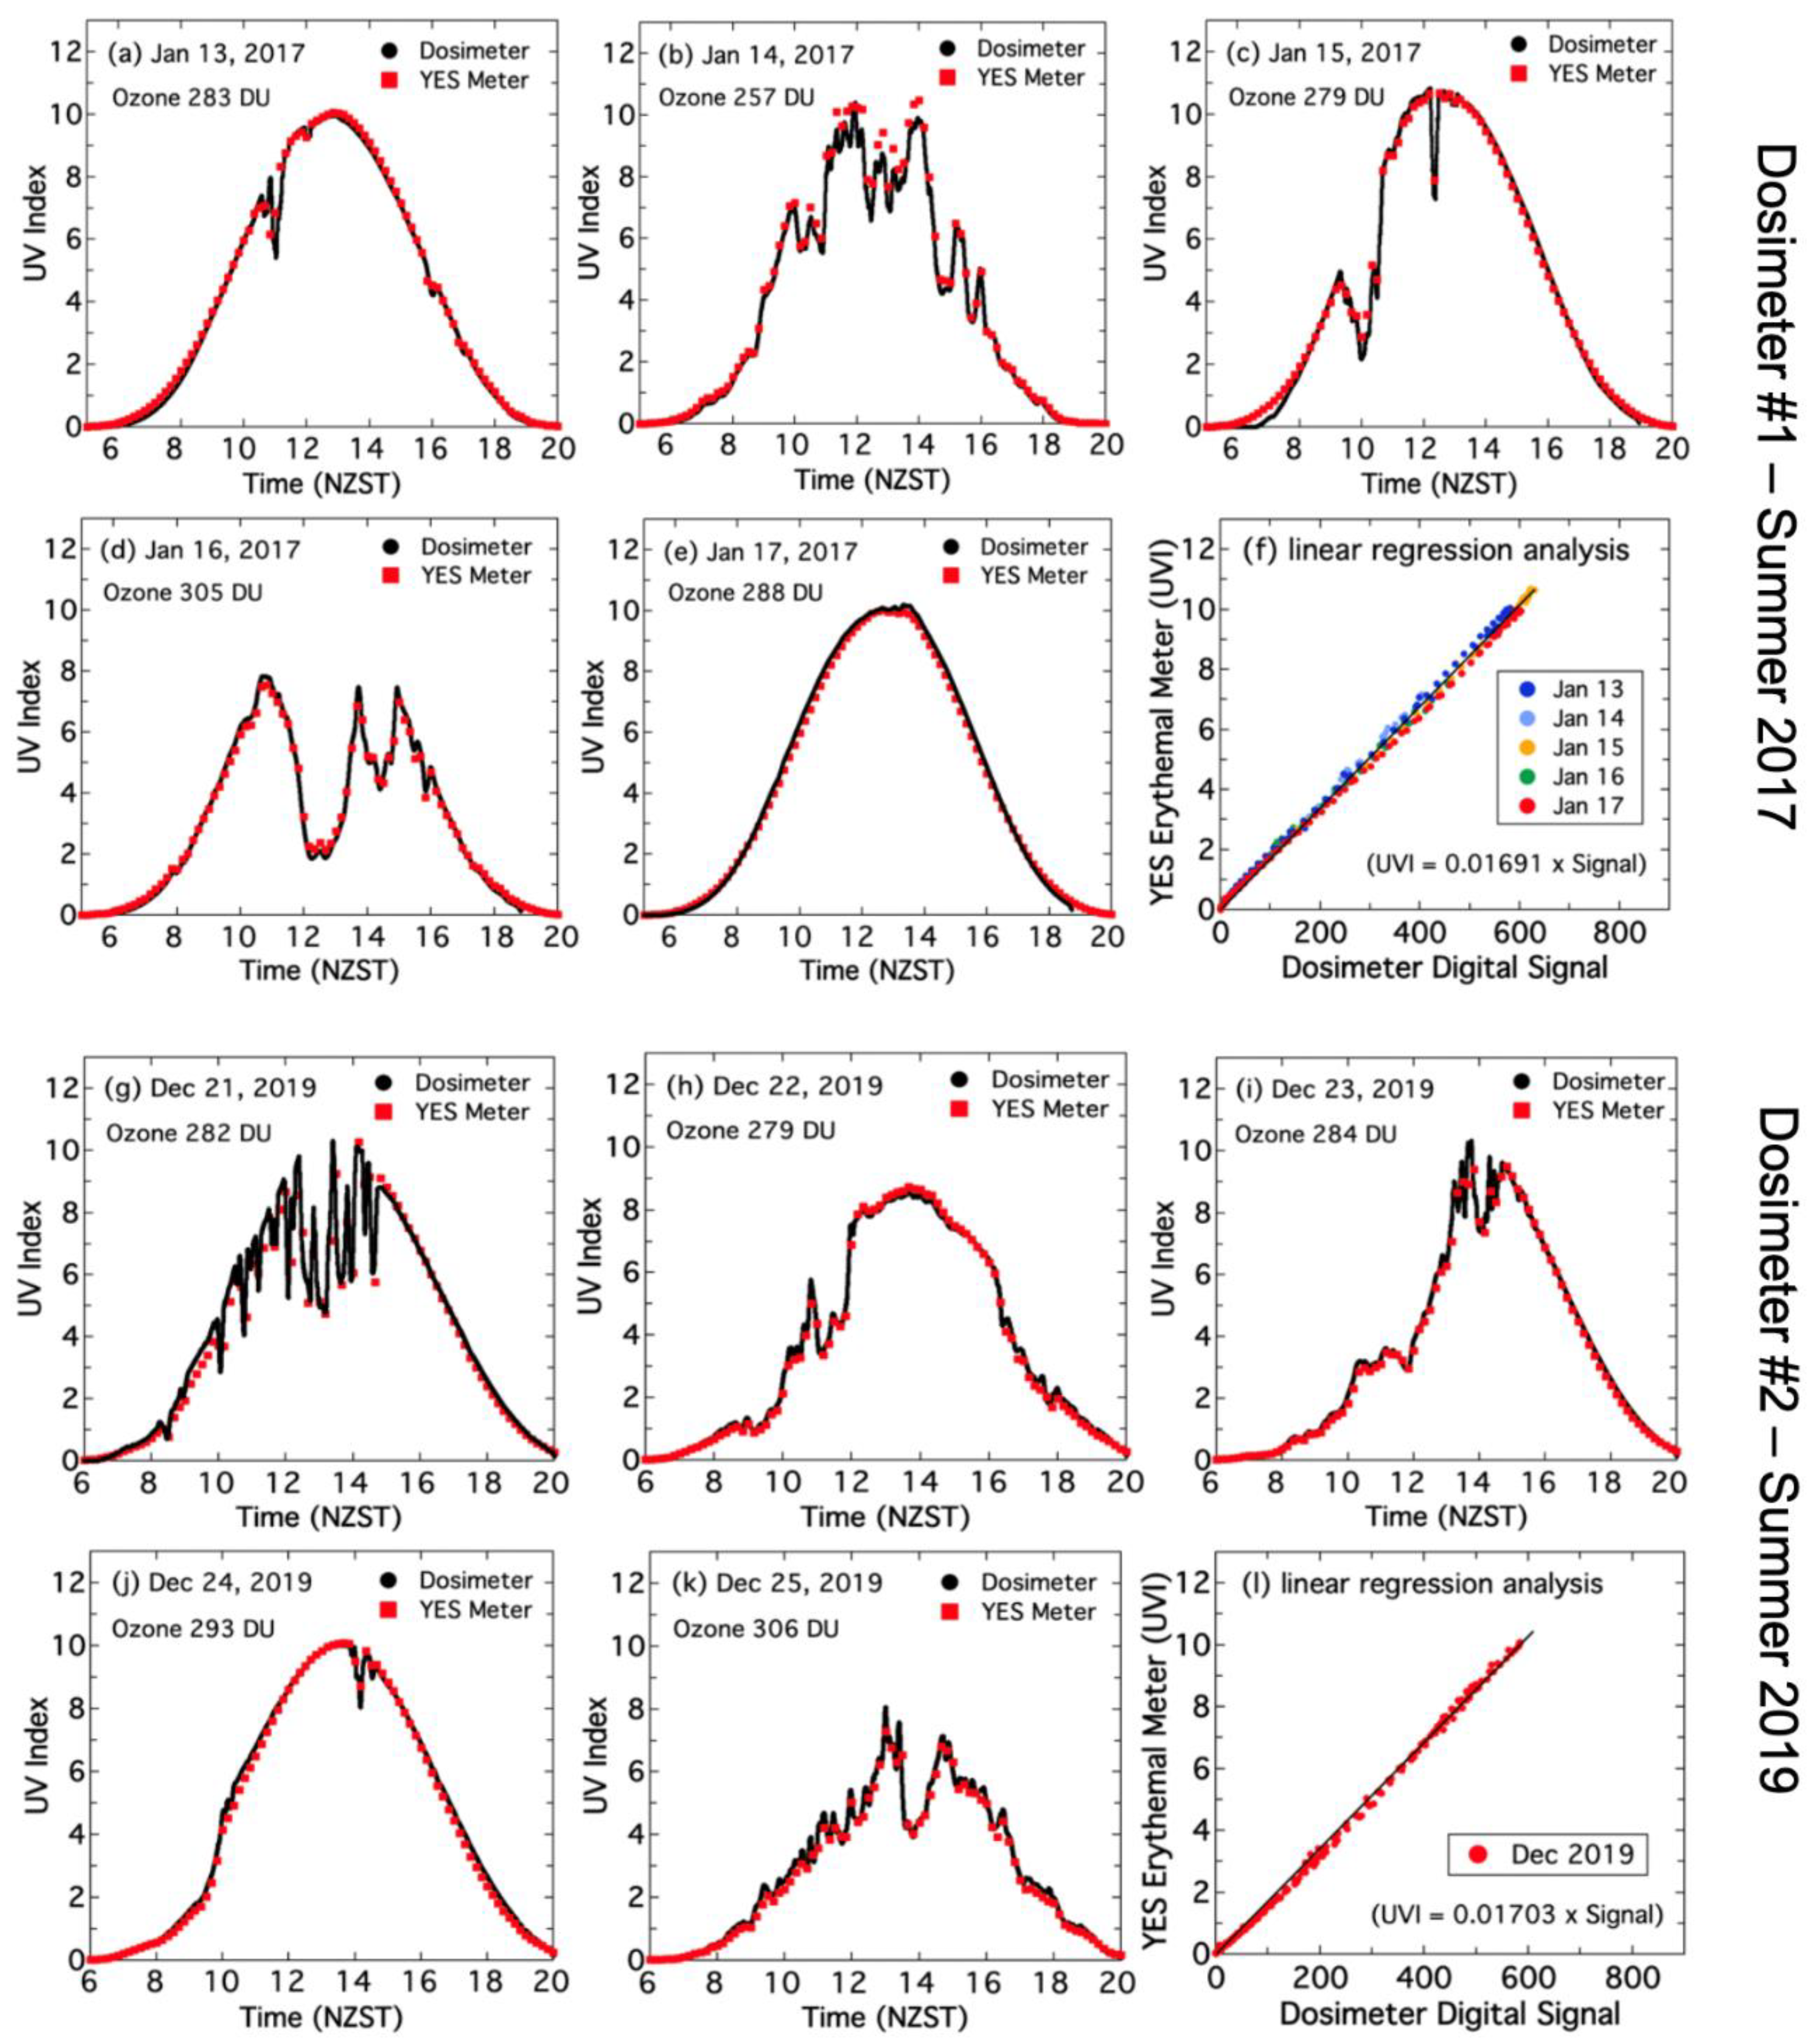
3.2. Cross-Calibration of EUV Dosimeters

Large numbers of EUV dosimeters are often deployed in behavioural studies and it is usually impractical to measure the spectral response of each device. Instead, calibrations are performed via a side-by-side comparison of each dosimeter against a meteorological-grade ‘Robertson–Berger type’ broadband instrument, such as a YES erythemal radiometer or a UV Model 501 Biometer (Solar Light Company, USA) whose calibration is, in turn, maintained against NIST-traceable UVR spectrometers. To ensure an accurate cross-calibration, each EUV dosimeter is placed on a horizontal surface close to the reference instrument, see Figure 9. The visible rejection of each dosimeter is separately checked using, for example, sunlight and a UVR cut-off filter using a similar approach to that of Seckmeyer et al. [22] or a Sun 3000 Class AAA Solar Simulator (ABET Technologies, USA) at the University of Canterbury, NZ, and the AlGaN sensor in any dosimeter with a nonzero visible response is replaced. No temperature-dependent change in the visible rejection of five Type B EUV dosimeters was observed from −10 °C to 50 °C, during tests (in the summer) similar to that described in Allen and McKenzie [17], while the change in UVR responsivity was less than 0.2% per 10 °C over this range.

3.2.1. Examples of EUV Dosimeter Cross-Calibrations

The calibration of the Type A EUV dosimeters has already been reported elsewhere [17,18] and here we focus on the newer Type B EUV dosimeters. The calibration examples shown here involve ‘typical’ devices that were not specially selected as ‘best in class’ examples. Figure 10 shows the results of a cross-calibration over 15 days from January 2017 to April 2018 of a Type B EUV dosimeter (#1) against the YES erythemal radiometer maintained by NIWA at Kyle Street, Christchurch, NZ. This radiometer is periodically checked against clear sky model data with a typical uncertainty of ±5%, and also against a UVR spectrometer at Lauder, NZ, that is calibrated against NIST standards. The erythemal UV irradiance measured by these instruments is expressed in terms of the UV index (UVI), which is a widely used measure of the erythemally weighted UV irradiance incident on a horizontal surface, with 1 UVI = 0.025 Wm−2 of erythemally weighted UV irradiance [45].
Figure 10a–e shows side-by-side comparisons of the UVI measured by the YES erythemal radiometer and the Type B EUV dosimeter over 5 consecutive days in January 2017 (NZ summer). The YES erythemal radiometer records UVI data averaged over 10 min intervals, while the EUV dosimeter was set-up to record UVI readings at 4 s intervals. The high sampling rate of the dosimeter results in a more detailed data structure that includes the effects of short-term cloud attenuation and enhancement [46]. Figure 10f shows the result of a regression analysis for the 5 summer days, where due to the differences in the sampling frequency and synchronization of the instruments, only cloud-free periods and periods of slowly changing cloud UVR attenuation can be fairly compared. The periods of rapidly changing cloud UVR attenuation where that data cannot be compared (~25% over the 5 days) are easily identified in the daily UVR graphs from the high degree of associated ‘scatter’ in the dosimeter data—see for example Figure 10b, 10:00 to 14:00. Although there were slight variations in the regression for each day, the overall regression was well-expressed by a simple linear relationship: dosimeter output (UVI) = (0.01686 ± 0.00004) × (digital signal), which is used to convert its 10-bit digital signal (0-1023) to erythemally weighted UVR irradiance. An alternative approach is to integrate the dosimeter data to match the 10-min interval of the YES erythemal radiometer. However, periods of rapidly changing cloud UVR attenuation still have to be excluded, as before, due to differences in the underlying sampling rates and synchronization of the two instruments. This is shown in Appendix F and the resulting linear regression coefficient was almost unchanged.
The dynamic range for this dosimeter was 0.02 to 17.25 UVI and its sensitivity (i.e., the smallest measurable change) was 0.017 UVI. The linearity of the regression curve in Figure 10f indicates that the output from the YES erythemal radiometer and the Type B EUV dosimeter were directly proportional, at least for the range of SZA (>20°) and ozone levels involved, and this is reflected in the very good agreement between the respective daily UVI graphs in Figure 10a–e. A similar linear regression was maintained in subsequent side-by-side comparisons in NZ winter and autumn conditions, indicating similar spectral mismatch and cosine response errors for both instruments. Figure 10g–k shows a comparison of daily UVI graphs measured by the same Type B dosimeter and YES erythemal radiometer over 5 days in August 2017 (NZ winter), using the summertime linear calibration coefficient for dosimeter UVI. These also showed good agreement, while Figure 10l shows that the linear regression coefficient for the 5 winter days was only ~3% different from that for the summer. There was a small discrepancy at low UVI levels (< 1), which under clear-sky conditions correspond to SZA > 60°, and this can be seen in the inset UVR graphs that use a magnified UVI scale. These are the previously identified conditions (Section 3.1), where the SZA-related differences in the CFs of the two instruments are the largest. Figure 10m–r shows a comparison of the UVI measured by the same YES erythemal radiometer and Type B dosimeter over a 5-day period in March/April 2018 (NZ autumn), again using the summertime linear calibration coefficient for dosimeter UVI.
The good agreement between the daily UVI graphs of the YES erythemal radiometer and the Type B dosimeter over summer, winter, and autumn conditions indicates that the effects of the differences in their spectral mismatch and cosine response errors are relatively small. Appendix A shows the same side-by-side calibration for another Type B dosimeter (#2), in which a similar linear relationship across multiple seasons compared to the same YES erythemal radiometer was obtained, while Appendix B, Appendix C, Appendix D and Appendix E show the summer 5-day calibration of four other Type B dosimeters.

3.2.2. EUV Dosimeter Stability

To assess its long-term stability, the Type B dosimeter #2 used in Appendix A was calibrated against the same YES erythemal radiometer at NIWA, Kyle St. Christchurch, New Zealand in December 2017 and 24 months later in December 2019, with the results shown in Figure 11. A linear regression coefficient of 0.01713 was determined in December 2017, as shown in Figure 11f. This calibration coefficient was used to convert the digital signal of the dosimeter to UVI and to construct the daily UVI graphs for December 2017 (Figure 11a–e) and December 2019 (Figure 11g–k). There was very good agreement between the Type B dosimeter #2 and the YES erythemal radiometer for all the days across both summers, indicating that the calibration of the dosimeter was unchanged. This is confirmed by the overlap of the December 2017 and December 2019 regression curves shown in Figure 11f,l, with an almost identical linear regression coefficient measured in both summers. It is interesting to compare this close agreement across different summers with the small discrepancies shown in Appendix A between summer and autumn/winter conditions. This indicates that, where possible, the EUV dosimeters are best used in similar conditions to those used to establish their calibration [22]. This is not surprising since we showed (in Section 3.1.1.) that the effects of spectral mismatch errors between instruments increase with changing SZA and ozone conditions.

3.3. Effect of EUV Dosimeter Sampling Frequency

The sampling frequency of the EUV dosimeters can be set at user-selected sampling intervals (t) from t = 2 to 120 s. The choice of sampling interval also determines the maximum recording and battery life of the dosimeter, as shown in Table 1.
The sampling interval (t) is also used to calculate the integrated erythemal UVR dose over any user-selected time period, e.g., daily, hourly, every 10 min, etc., using Equation (2), where n is the number of readings within the chosen time period.
E r y t h e m a l   U V R   D o s e   ( S E D ) = n = 1 n ( D o s i m e t e r   O u t p u t   ( U V I ) × t   ( s ) 4000 )
Figure 12 shows an example of the effect of sampling frequency on the calculation of integrated erythemal dose. This involved a golfer wearing EUV dosimeters on different body sites during an 18 hole round of golf (3.5 h) at Avondale Golf Course, Christchurch, New Zealand on 1 March 2017. Figure 12b–d shows the erythemal UVR irradiance versus time graphs measured using the minimum sampling interval of 2 s by EUV dosimeters attached to the golfer’s cap, wrist, and chest, respectively. Figure 12e shows the ambient UVR measured by another EUV dosimeter placed on a flat horizontal surface in a nearby open space. In each case, a change in sampling interval was achieved by reducing the t = 2 s dataset, e.g., to simulate a sampling rate of t = m seconds (where m is an even number greater than 2), every n = m/2 datapoint was selected, similar to the approach used by Heydenreich et al. [47]. Figure 12f shows the total integrated erythemal UVR dose calculated for increasing sampling intervals from t = 2 s to 120 s. This shows only a small variation in the total integrated dose with sampling interval for this particular activity.
Since golfing is a reasonably active activity, involving several kilometres of walking over open and partially tree-shaded ground, a second example is provided for a more sedentary activity. This involves a spectator at an ‘one day international’ cricket match between New Zealand and South Africa held at Hagley Park, Christchurch, New Zealand, on 22 February 2017. These events typically involve thousands of spectators sitting for 6–8 h in uncovered venues that often provide very little shade and consequently the received UVR doses can be very high. Figure 13 b,c shows the erythemal UVR graphs measured by EUV dosimeters attached to a spectator’s wrist and chest, respectively. Figure 13d shows that, as before, there was only a small variation in the total integrated dose with sampling interval. Figure 13e,f also illustrates one of key advantages of EUV dosimeters compared to polysulphone film detectors. This is the ability to provide detailed information concerning erythemal dose rates during the course of a day or particular activity. Here, the erythemal dose rate in SED/h has been calculated at 10 min steps throughout the day.
Figure 14 provides another example on how the high sampling rates of the EUV dosimeters can be used to discriminate between different types of UVR dose and dose rates within a single day. This example is for a spectator at an international cricket ‘test match’ between Australia and England at the Melbourne Cricket Ground (MCG), Australia, on 27 December 2017. The MCG is a 100,000 seat stadium with a partial roof that provided the spectator with shade relief from direct sun from 13:00 AEST to the end of play at 18:00 AEST. Figure 14b shows that the spectator received a large erythemal UVR dose of 7.60 SED over ~2 h in the morning (no shade), followed by a much lower dose of 1.61 SED over ~5 h in the afternoon (in shade). Figure 14c shows the corresponding 10-min erythemal dose rates during both periods. Figure 14c also illustrates the effect of the dosimeter sampling interval on the calculated dose rates. This shows that the accurate calculation of 10-min dose rates requires higher sampling frequencies (i.e., sampling interval < 60 s) than for daily dose calculations, since there needs to be a reasonable number of data readings (i.e., typically > 10) in each 10-min period.
As can be seen from Table 1, EUV dosimeters operating at high sampling frequencies are capable of generating large datasets with high temporal resolution of the dosimeter wearers’ patterns of sun exposure. In addition to the standard calculations of integrated doses and doses rates, Blesić et al. [48,49] have recently developed sophisticated techniques involving wavelet transform and detrended fluctuation analysis to identify characteristic patterns and intervals of sun exposures in large personal UVR exposure datasets, and have also provided examples of this analytical approach using datasets acquired using the EUV dosimeters described here.

4. Discussion

Broadband UVR instruments can be corrected for spectral mismatch errors via the calculation of correction factors that vary with SZA and ozone levels, and for cosine response errors via the calculation of correction factors that vary with SZA. This approach can, in principle, be applied to any broadband EUV dosimeter, including those described here and those developed by other researchers, with known spectral responsivities and angular responses [47,50,51,52,53,54,55,56,57]. These other EUV dosimeters have used silicon carbide (SiC) photodiodes with a dielectric filter [47,50,51] and gallium phosphide (GaP) photodiodes with a visible-light-absorbing filter [52], while the UVR sensors in the other EUV dosimeters were not specified [53,54,55,56]. However, in reality, the use of correction factors is not practical during the measurement of personal UVR exposures where the dosimeters are worn by participants on body sites such as the wrist, arm, chest, or head, since the orientation of the dosimeter is usually unknown and continually changes, especially during physical activity [58]. However, we have shown via side-by-side comparisons of EUV dosimeters and meteorological-grade ‘Robertson–Berger type’ broadband radiometers, that the effect of spectral mismatch and cosine response errors can be relatively small. The effect of these errors can be further reduced by performing EUV dosimeter calibrations in similar conditions (i.e., geographical location and season) to those anticipated during the measurement campaigns [22].
The EUV dosimeters described here can be used in applications where their orientation is always known, as shown in Figure 15. These applications are: (a) SunSmart education programmes (‘SunSmart UV Labs’) where primary school children conduct their own sun-safety experiments by placing EUV dosimeters on a flat horizontal surface to measure the UVI in various direct sun and shade locations around their school environment, and then place sun protection items, such as sunglasses, clothing, and sunscreen covered quartz slides on top of the dosimeter while it is orientated horizontally in direct sunlight [26,27]; (b) when used as a horizontally held UVI meter where the dosimeter is electrically connected to a handheld unit and miniature LCD display via the 3-pin micro data port sockets on the backside of the dosimeter; and (c) when connected wirelessly to a public UVI display to deliver real-time UVI information and sun-safety messages, in which case the dosimeter is always orientated horizontally. In these applications, it is possible to apply correction factors for spectral mismatch and cosine response errors, since the SZA with respect to the horizontally orientated dosimeter can be calculated from the time of day and geographic location, and seasonal ozone values can be estimated from look-up tables or obtained from online ozone forecasts provided by meteorological agencies in the case of internet-enabled public UVI displays. However, since the production costs of AlGaN photodiodes are relatively low, it is equally practical in these situations to carefully preselect photodiodes with the lowest spectral mismatch errors for which the correction factors will be close to unity.
Correction factors can also be calculated for the spectral mismatch between EUV dosimeters and the CIE action spectrum for human vitamin D production [44]. These are of interest as erythemally calibrated EUV dosimeters have been used in a number of studies involving vitamin D status and UVR exposure [20,21,59], even though the relationship between erythemally weighted and vitamin D-weighted irradiance is nonlinear, with the latter being significantly more dependent on ozone column and SZA. In principle, these CFs could be used to convert the response of EUV dosimeters to vitamin D-weighted UVR irradiance but only, as discussed above, in a fixed setting, such as when used as a handheld meter or in a public UVI display (see Figure 15) where their orientation is known.

5. Conclusions

We have characterized the performance of electronic UV (EUV) dosimeters that have been used over the past 10 years to objectively measure personal UVR exposures in a wide range of large behavioural studies that have included primary school children [18], outdoor workers [19], marathon runners [60], the association between UVR exposure and vitamin D status for different population groups [20,21], the effect of UVR exposure on immunization responses [24], and also in primary skin cancer prevention and education programmes [26,27]. These EUV dosimeters are broadband instruments that use AlGaN photodiodes, whose spectral responsivity can be engineered to provide an acceptable match to the CIE erythemal action spectrum [31,32] without the use of any optical filters by adjusting their Al/Ga fraction [28,29,30].
We have shown that solar zenith angle (SZA) and ozone level-dependent correction factors (normalized to an SZA of 30° and ozone level of 300 DU) can be used to compare the spectral mismatch errors (i.e., the errors in measured erythemally weighted UVR radiation introduced by spectral response deviations from the CIE erythemal action spectrum) of different broadband instruments, including EUV dosimeters. This approach was used to compare the spectral mismatch errors of the AlGaN photodiodes in two EUV dosimeters with those of a meteorological-grade ‘Robertson–Berger type’ erythemal radiometer (Yankee Environmental Systems Inc., USA) and showed that the differences were relatively small, becoming more significant at high SZA when the ambient erythemally weighted UVR levels are relatively low.
A side-by-side cross calibration of two Type B EUV dosimeters (which use a low-profile AlGaN photodiode and flat PTFE diffuser) against the ‘Robertson–Berger type’ erythemal radiometer, in sunlight on multiple days across different seasons, showed a linear relationship between the two instruments that was similar across summer, autumn, and winter conditions, indicating that the combined spectral mismatch and cosine response errors of the two types of instruments were also similar. The same cross calibration of a Type B EUV dosimeter on multiple days across the summers of 2017 and 2019 showed that the linear relationship between the two instruments was almost unchanged, indicating that the dosimeters are capable of maintaining very good long-term stability. The linear relationship between the Type B EUV dosimeters and the ‘Robertson–Berger type’ erythemal radiometer is typical and was also observed in four other dosimeters, cross-calibrated over multiple days in the New Zealand summer (see Appendix B, Appendix C, Appendix D and Appendix E). The variation in the magnitude of the linear regression coefficient between dosimeters was due to the combined effects of small variations in the composition of the AlGaN photodiodes, the thickness of the PTFE diffuser, and the between-device linear gain of the photodiode amplifier. For example, in a recent batch of 200 Type B EUV dosimeters, cross-calibrated using the same side-by-side procedure on a mostly clear-sky summer day, the mean linear regression coefficient was 0.0167 with a standard deviation of 0.0031, with a calibration coefficient range (lowest–highest) of 0.0109–0.0237.
We further showed that the integrated erythemal UVR daily doses (in SED units) measured during separate activities involving golfers and spectators at summer sporting events were largely unchanged for data acquisition (sampling) intervals from 2 s to 120 s, while the calculation of accurate 10-min erythemal UVR dose rates typically requires sampling intervals of less than 60 s. Although it is not possible to apply correction factors for spectral mismatch and cosine response errors for EUV dosimeters when measuring personal UVR exposures, due to the fact that their orientation is unknown and continuously changing, this is possible when they are used as the sensing element in handheld UVI meters or in public UVI displays when they are orientated horizontally.

Supplementary Materials

The following are available online at https://www.mdpi.com/2073-4433/11/7/744/s1, Numerical tables of the correction factors to correct the different broadband UVR instruments in this article for spectral mismatch errors due to deviations in their spectral responsivity from the CIE erythemal action spectrum and also the CIE vitamin D action spectrum.

Author Contributions

Conceptualization, M.W.A. and R.L.M.; methodology, M.W.A., N.S., K.M.N., B.L., and R.L.M.; formal analysis M.W.A., N.S., K.M.N., B.L., and R.L.M.; writing—original draft preparation M.W.A. and R.L.M.; writing—review and editing, M.W.A., N.S., K.M.N., B.L., and R.L.M. All authors have read and agreed to the published version of the manuscript.

Funding

This research was funded in part by the MacDiarmid Institute for Advanced Materials and Nanotechnology, New Zealand and by the University of Canterbury, New Zealand.

Acknowledgments

The authors gratefully acknowledge the leading contribution of Prof Myles Cockburn and Dr Kimberley Miller of the Keck School of Medicine, University of Southern California, Los Angeles, USA in developing the experiential dosimeter-based SunSmart education concept. We thank Dan Smale of NIWA Lauder for carrying out the radiative transfer model calculations that were used to generate the erythemally weighted and vitamin D weighted spectral response error correction factors for the AlGaN photodiodes and YES erythemal radiometer. We are grateful to Arona Ngari of the Cook Islands Meteorological Service for help with UVR measurements in Rarotonga and to the Australian Radiation Protection and Nuclear Safety Agency (ARPANZ) during the calibration of EUV dosimeters in Australia. We acknowledge the funding support of the MacDiarmid Institute for Advanced Materials and Nanotechnology in the development of the New Zealand primary school SunSmart UV Lab education programme. The funders had no role in the design of the study; in the collection, analyses, or interpretation of data; in the writing of the manuscript, or in the decision to publish the results.

Conflicts of Interest

The authors declare no conflict of interest.

Appendix A. Dosimeter #2

Figure A1. Cross-calibration of Type B EUV dosimeter #2 (t = 4 s) against a YES erythemal radiometer at NIWA Kyle St., Christchurch, NZ, over 15 days during summer (2017), autumn (2017), and winter (2018). Dosimeter UVI obtained using a linear calibration of UVI = (0.01713 ± 0.00004) × (digital signal) for all daily graphs.
Atmosphere 11 00744 g0a1

Appendix B. Dosimeter #3

Figure A2. Cross-calibration of Type B EUV dosimeter #3 (t = 4 s) against a YES erythemal radiometer at NIWA Kyle St., Christchurch, NZ, over 5 consecutive days during the summer (2017). Dosimeter UVI = (0.01615 ± 0.00004) × (digital signal) for all daily graphs.
Atmosphere 11 00744 g0a2

Appendix C. Dosimeter #4

Figure A3. Cross calibration of Type B EUV dosimeter #4 (t = 4 s) against a YES erythemal radiometer at NIWA Kyle St., Christchurch, NZ, over 5 consecutive days during the summer (2019). Dosimeter UVI = (0.01477 ± 0.00002) × (digital signal) for all daily graphs.
Atmosphere 11 00744 g0a3

Appendix D. Dosimeter #5

Figure A4. Cross-calibration of Type B EUV dosimeter #5 (t = 4 s) against a YES erythemal radiometer at NIWA Kyle St., Christchurch, NZ, over 5 consecutive days during the summer (2017). Dosimeter UVI = (0.01845 ± 0.00008) × (digital signal) for all daily graphs.
Atmosphere 11 00744 g0a4

Appendix E. Dosimeter #6

Figure A5. Cross-calibration of Type B EUV dosimeter #6 (t = 8 s) against a YES erythemal radiometer at NIWA Kyle St., Christchurch, NZ, over 5 consecutive days during the summer (2017). Dosimeter UVI = (0.01276 ± 0.00003) × (digital signal) for all daily graphs.
Atmosphere 11 00744 g0a5

Appendix F. Calibration Using 10 min Rolling Averages of the Dosimeter Signal

Figure A6. (a) to (f) Cross-calibration of two Type B EUV dosimeters (dosimeter #1 and #2) against a YES erythemal radiometer at NIWA Kyle St., Christchurch, NZ, with the (t = 4 s) dosimeter digital signal processed as a 10-min rolling average to match the 10-min average interval of the YES erythemal radiometer: (a) to (f) Type B EUV dosimeter #1 during 5 consecutive days in summer (2017); and (g) to (l) Type B EUV dosimeter #2 during 5 consecutive days in summer (2019).
Atmosphere 11 00744 g0a6

References

  1. Karimkhani, C.; Green, A.C.; Nijsten, T.; Weinstock, M.A.; Dellavalle, R.P.; Naghavi, M.; Fitzmaurice, C. The global burden of melanoma: Results from the Global Burden of Disease Study 2015. Br. J. Dermatol. 2017, 177, 134–140. [Google Scholar] [CrossRef] [PubMed]
  2. Bray, F.; Ferlay, J.; Soerjomataram, I.; Siegel, R.L.; Torre, L.A.; Jemal, A. Global cancer statistics 2018: GLOBOCAN estimates of incidence and mortality worldwide for 36 cancers in 185 countries. CA Cancer J. Clin. 2018, 68, 394–424. [Google Scholar] [CrossRef] [PubMed] [Green Version]
  3. Holick, M.F. High Prevalence of Vitamin D Inadequacy and Implications for Health. Mayo Clin. Proc. 2006, 81, 353–373. [Google Scholar] [CrossRef] [PubMed] [Green Version]
  4. Chowdhury, R.; Kunutsor, S.; Vitezova, A.; Oliver-Williams, C.; Chowdhury, S.; Kiefte-De-Jong, J.C.; Khan, H.; Baena, C.P.; Prabhakaran, D.; Hoshen, M.B.; et al. Vitamin D and risk of cause specific death: Systematic review and meta-analysis of observational cohort and randomised intervention studies. BMJ 2014, 348, 1903. [Google Scholar] [CrossRef] [PubMed] [Green Version]
  5. Bjelakovic, G.; Gluud, L.L.; Nikolova, D.; Whitfield, K.; Wetterslev, J.; Simonetti, R.G.; Bjelakovic, M.; Gluud, C. Vitamin D supplementation for prevention of mortality in adults (Review) Bjelakovic. Cochrane Database Syst. Rev. 2014. [Google Scholar] [CrossRef]
  6. Holick, M.F. Sunlight and vitamin D for bone health and prevention of autoimmune diseases, cancers, and cardiovascular disease. Am. J. Clin. Nutr. 2004, 80, 1678S–1688S. [Google Scholar] [CrossRef] [Green Version]
  7. Holick, M.F. The Vitamin D Epidemic and its Health Consequences. J. Nutr. 2005, 135, 2739S–2748S. [Google Scholar] [CrossRef]
  8. Lucas, R.M.; Yazar, S.; Young, A.R.; Norval, M.; De Gruijl, F.R.; Takizawa, Y.; Rhodes, L.E.; Sinclair, C.A.; Neale, R.E. Human health in relation to exposure to solar ultraviolet radiation under changing stratospheric ozone and climate. Photochem. Photobiol. Sci. 2019, 18, 641–680. [Google Scholar] [CrossRef]
  9. Holick, M.F. Sunlight, ultraviolet radiation, vitamin d and skin cancer: How much sunlight do we need? Adv. Exp. Med. Biol. 2014, 810, 1. [Google Scholar]
  10. McKenzie, R.L.; Liley, J.B.; Björn, L.O. UV radiation: Balancing risks and benefits. Photochem. Photobiol. 2009, 85, 88–98. [Google Scholar] [CrossRef]
  11. McKenzie, R. UV radiation in the melanoma capital of the world: What makes New Zealand so different? AIP Conf. Proc. 2017, 1810, 020003. [Google Scholar]
  12. McKenzie, R.; Bodeker, G.; Scott, G.; Slusser, J.; Lantz, K. Geographical differences in erythemally-weighted UV measured at mid-latitude USDA sites. Photochem. Photobiol. Sci. 2006, 5, 343–352. [Google Scholar] [CrossRef] [PubMed]
  13. McKenzie, R.; Smale, D.; Bodeker, G.; Claude, H. Ozone profile differences between Europe and New Zealand: Effects on surface UV irradiance and its estimation from satellite sensors. J. Geophys. Res. D Atmos. 2003, 108, 4179. [Google Scholar] [CrossRef]
  14. Nessvi, S.; Johansson, L.; Jopson, J.; Stewart, A.; Scragg, R.K. Association of 25-Hydroxyvitamin D 3 Levels Ethnicity, Skin Color and Self-Reported Skin Association of Ethnicity, Skin Color and Self-Reported Skin. Photochem. Photobiol. 2011, 87, 1173–1178. [Google Scholar] [CrossRef]
  15. Diffey, B. The early days of personal solar ultraviolet dosimetry. Atmosphere 2020, 11, 125. [Google Scholar] [CrossRef] [Green Version]
  16. Siani, A.M.; Casale, G.R.; Modesti, S.; Parisi, A.V.; Colosimo, A. Investigation on the capability of polysulphone for measuring biologically effective solar UV exposures. Photochem. Photobiol. Sci. 2014, 13, 521–530. [Google Scholar] [CrossRef]
  17. Allen, M.; McKenzie, R. Enhanced UV exposure on a ski-field compared with exposures at sea level. Photochem. Photobiol. Sci. 2005, 4, 429–437. [Google Scholar] [CrossRef]
  18. Wright, C.Y.; Reeder, A.I.; Bodeker, G.E.; Gray, A.; Cox, B. Solar UVR Exposure, Concurrent Activities and Sun-Protective Practices Among Primary Schoolchildren. Photochem. Photobiol. 2007, 83, 749–758. [Google Scholar] [CrossRef] [Green Version]
  19. Hammond, V.; Reeder, A.I.; Gray, A. Patterns of real-time occupational ultraviolet radiation exposure among a sample of outdoor workers in New Zealand. Public Health 2009, 123, 182–187. [Google Scholar] [CrossRef]
  20. Scragg, R.K.R.; Stewart, A.W.; McKenzie, R.L.; Reeder, A.I.; Liley, J.B.; Allen, M.W. Sun exposure and 25-hydroxyvitamin D 3 levels in a community sample: Quantifying the association with electronic dosimeters. J. Expo. Sci. Environ. Epidemiol. 2017, 27, 471–477. [Google Scholar] [CrossRef]
  21. McKenzie, R.; Liley, B.; Johnston, P.; Scragg, R.; Stewart, A.; Reeder, A.I.; Allen, M.W. Small doses from artificial UV sources elucidate the photo-production of vitamin D. Photochem. Photobiol. Sci. 2013, 12, 1726–1737. [Google Scholar] [CrossRef]
  22. Seckmeyer, G.; Klingebiel, M.; Riechelmann, S.; Lohse, I.; McKenzie, R.L.; Ben Liley, J.; Allen, M.W.; Siani, A.M.; Casale, G.R. A critical assessment of two types of personal UV dosimeters. Photochem. Photobiol. 2012, 88, 215–222. [Google Scholar] [CrossRef] [PubMed]
  23. Hacker, E.; Horsham, C.; Allen, M.; Nathan, A.; Lowe, J.; Janda, M. Capturing ultraviolet radiation exposure and physical activity: Feasibility study and comparison between self-reports, mobile apps, dosimeters, and accelerometers. J. Med. Internet Res. 2018, 7, e102. [Google Scholar] [CrossRef] [PubMed]
  24. Swaminathan, A.; Harrison, S.L.; Ketheesan, N.; van den Boogaard, C.H.A.; Dear, K.; Allen, M.; Hart, P.H.; Cook, M.; Lucas, R.M. Exposure to Solar UVR Suppresses Cell-Mediated Immunization Responses in Humans: The Australian Ultraviolet Radiation and Immunity Study. J. Investig. Dermatol. 2019, 139, 1545–1553. [Google Scholar] [CrossRef] [PubMed] [Green Version]
  25. Smit, A.K.; Newson, A.J.; Morton, R.L.; Kimlin, M.; Keogh, L.; Law, M.H.; Kirk, J.; Dobbinson, S.; Kanetsky, P.A.; Fenton, G.; et al. The melanoma genomics managing your risk study: A protocol for a randomized controlled trial evaluating the impact of personal genomic risk information on skin cancer prevention behaviors. Contemp. Clin. Trials 2018, 70, 106–116. [Google Scholar] [CrossRef] [PubMed]
  26. Allen, M.W.; Miller, K.A.; Cockburn, M.G. SunSmart UV dosimetry programmes: From Southern Californian to New Zealand schools. In Proceedings of the NIWA UV Workshop, Auckland, New Zealand, 15–17 April 2014; Available online: https://niwa.co.nz/sites/niwa.co.nz/files/Allen_UV%20Workshop_2014.pdf (accessed on 20 May 2020).
  27. Allen, M.W.; Hyland, A.M.; Salkeld, A.J.; Miller, K.A.; Cockburn, M.G. Use of Electronic UV Dosimeters in New Zealand School-based Primary Skin Cancer Prevention Programmes. In Proceedings of the NIWA UV Workshop, Wellington, New Zealand, 4–6 April 2018; Available online: https://niwa.co.nz/sites/niwa.co.nz/files/Allen_Use%20of%20Personal%20Dosimaters%20in%20School%20Sunsmart%20Programmes.pdf (accessed on 20 May 2020).
  28. Chow, P.P.; Klaassen, J.J.; Van Hove, J.M.; Wowchak, A.M.; Polley, C.; King, D. Group III-nitride materials for ultraviolet detection applications. In Proceedings of the Symposium on Integrated Optoelectronics, San Jose, CA, USA, 20–26 January 2000; Volume 3948, pp. 295–303. [Google Scholar]
  29. Monroy, E.; Calle, F.; Pau, J.L.; Muñoz, E.; Omnès, F.; Beaumont, B.; Gibart, P. AlGaN-based UV photodetectors. J. Cryst. Growth 2001, 230, 537–543. [Google Scholar] [CrossRef]
  30. Monroy, E.; Omnès, F.; Calle, F. Wide-bandgap semiconductor ultraviolet photodetectors. Semicond. Sci. Technol. 2003, 18, R33–R51. [Google Scholar] [CrossRef]
  31. McKinlay, A.F.; Diffey, B.L. A Reference Action Spectrum for Ultra-violet Induced Erythema in Human Skin. CIE J. 1987, 6, 17–22. [Google Scholar]
  32. ISO/CIE 17166:2019(E) Erythemal Reference Action Spectrum and Standard Erythema Dose. Available online: http://cie.co.at/publications/erythema-reference-action-spectrum-and-standard-erythema-dose-0 (accessed on 20 May 2020).
  33. Ryer, A. Light Measurement Handbook; International Light Technologies: Peabody, MA, USA, 1997; Chapter 12 (Choosing Input Optics). [Google Scholar]
  34. Park, K.Y.; Kwon, B.J.; Cho, Y.H.; Lee, S.A.; Son, J.H. Growth and characteristics of Ni-based Schottky-type AlxGa1-xN ultraviolet photodetectors with AlGaN/GaN superlattices. J. Appl. Phys. 2005, 98, 124505. [Google Scholar] [CrossRef]
  35. Kerr, J.B.; Fioletov, V.E. Surface ultraviolet radiation. Atmos. Ocean 2008, 46, 159–184. [Google Scholar] [CrossRef] [Green Version]
  36. Parisi, A.V.; Green, A.; Kimlin, M.G. Diffuse Solar UV Radiation and Implications for Preventing Human Eye Damage. Photochem. Photobiol. 2001, 73, 135–139. [Google Scholar] [CrossRef] [Green Version]
  37. Grant, R.H.; Gao, W. Diffuse fraction of UV radiation under partly cloudy skies as defined by the Automated Surface Observation System (ASOS). J. Geophys. Res. D Atmos. 2003, 108, 4046. [Google Scholar] [CrossRef] [Green Version]
  38. Feister, U.; Grewe, R.; Gericke, K. A method for correction of cosine errors in measurements of spectral UV irradiance. Sol. Energy 1997, 60, 313–332. [Google Scholar] [CrossRef]
  39. Pulli, T.; Kärhä, P.; Ikonen, E. A method for optimizing the cosine response of solar UV diffusers. J. Geophys. Res. Atmos. 2013, 118, 7897–7904. [Google Scholar] [CrossRef]
  40. Berger, D.S. The Sunburning Ultraviolet Meter: Design and Performance. Photochem. Photobiol. 1976, 24, 587–593. [Google Scholar] [CrossRef] [PubMed]
  41. Grainger, R.G.; Basher, R.E.; McKenzie, R.L. UV-B Robertson–Berger meter characterization and field calibration. Appl. Opt. 1993, 32, 343–349. [Google Scholar] [CrossRef] [PubMed]
  42. Madronich, S.; Flocke, S. Theoretical Estimation of Biologically Effective UV Radiation at the Earth’s Surface. In Solar Ultraviolet Radiation; NATO ASI Series (Series I: Global Environmental Change); Zerefos, C.S., Bais, A.F., Eds.; Springer: Berlin/Heidelberg, Germany, 1997; Volume 52, pp. 23–48. [Google Scholar]
  43. McKenzie, R.L.; Bodeker, G.E.; Keep, D.J.; Kotkamp, M.; Evans, J. UV Radiation in New Zealand: North-to-South Differences Between Two Sites, and Relationship to Other Latitudes. Weather Clim. 1996, 16, 17–26. [Google Scholar] [CrossRef]
  44. Bouillon, R.; Eisman, J.; Garabedian, M.; Holick, M.; Kleinschmidt, J.; Suda, T.; Terenetskaya, I.; Webb, A. Action Spectrum for the Production of Previtamin D3 in Human Skin; CIE Report No. 1742006; CIE: Vienna, Austria, 2006; Available online: http://cie.co.at/publications/action-spectrum-prod (accessed on 20 May 2020).
  45. World Health Institution (WHO). Global Solar UV Index: A Practical Guide; WHO: Geneva, Switzerland, 2002. [Google Scholar]
  46. Sabburg, J.; Wong, J. The effect of clouds on enhancing UVB irradiance at the earth’s surface: A one year study. Geophys. Res. Lett. 2000, 27, 3337–3340. [Google Scholar] [CrossRef]
  47. Heydenreich, J.; Wulf, H.C. Personal electronic UVR dosimeter measurements: Specific and general uncertainties. Photochem. Photobiol. Sci. 2019, 18, 1461–1470. [Google Scholar] [CrossRef] [PubMed]
  48. Blesić, S.M.; du Preez, D.J.; Stratimirović, D.I.; Ajtić, J.V.; Ramotsehoa, M.C.; Allen, M.W.; Wright, C.Y. Characterization of personal solar ultraviolet radiation exposure using detrended fluctuation analysis. Environ. Res. 2020, 182, 108976. [Google Scholar] [CrossRef]
  49. Blesić, S.M.; Stratimirović, D.I.; Ajtić, J.V.; Wright, C.Y.; Allen, M.W. Novel approach to analysing large data sets of personal sun exposure measurements. J. Expo. Sci. Environ. Epidemiol. 2016, 26, 613–620. [Google Scholar] [CrossRef] [Green Version]
  50. Heydenreich, J.; Wulf, H.C. Miniature Personal Electronic UVR Dosimeter with Erythema Response and Time-stamped Readings in a Wristwatch. Photochem. Photobiol. 2005, 81, 1138–1144. [Google Scholar] [CrossRef] [PubMed]
  51. Thieden, E. Sun exposure behaviour among subgroups of the Danish population. Dan. Med. Bull. 2008, 55, 47–68. [Google Scholar]
  52. Diffey, B.L.; Saunders, P.J. Behavior Outdoors and Its Effects on Personal Ultraviolet Exposure Rate Measured Using an Ambulatory Datalogging Dosimeter. Photochem. Photobiol. 1995, 61, 615–618. [Google Scholar] [CrossRef]
  53. El Naggar, S.; Gustat, H.; Magister, H.; Rochlitzer, R. An electronic personal UV-B-dosimeter. J. Photochem. Photobiol. B Biol. 1995, 31, 83–86. [Google Scholar] [CrossRef]
  54. Rigel, E.G.; Lebwohl, M.G.; Rigel, A.C.; Rigel, D.S. Ultraviolet Radiation in Alpine Skiing: Magnitude of Exposure and Importance of Regular Protection. Arch. Dermatol. 2003, 139, 60–62. [Google Scholar] [CrossRef] [PubMed]
  55. Autier, P.; Doré, J.F.; Reis, A.C.; Grivegnée, A.; Ollivaud, L.; Truchetet, F.; Chamoun, E.; Rotmensz, N.; Severi, G.; Césarini, J.P. Sunscreen use and intentional exposure to ultraviolet A and B radiation: A double blind randomized trial using personal dosimeters. Br. J. Cancer 2000, 83, 1243–1248. [Google Scholar] [CrossRef] [Green Version]
  56. Schmalwieser, A.W.; Cabaj, A.; Schauberger, G.; Rohn, H.; Maier, B.; Maier, H. Facial solar UV exposure of Austrian farmers during occupation. Photochem. Photobiol. 2010, 86, 1404–1413. [Google Scholar] [CrossRef] [PubMed]
  57. Schmalwieser, A.W.; Siani, A.M. Review on Nonoccupational Personal Solar UV Exposure Measurements. Photochem. Photobiol. 2018, 94, 900–915. [Google Scholar] [CrossRef]
  58. Casale, G.R.; Siani, A.M.; Diémoz, H.; Kimlin, M.G.; Colosimo, A. Applicability of the polysulphone horizontal calibration to differently inclined dosimeters. Photochem. Photobiol. 2012, 88, 207–214. [Google Scholar] [CrossRef] [PubMed]
  59. Gröbner, M.; Gröbner, J.; Hülsen, G. Quantifying UV exposure, vitamin D status and their relationship in a group of high school students in an alpine environment. Photochem. Photobiol. Sci. 2015, 14, 352–357. [Google Scholar] [CrossRef] [PubMed]
  60. Nurse, V.; Wright, C.Y.; Allen, M.; McKenzie, R.L. Solar Ultraviolet Radiation Exposure of South African Marathon Runners during Competition Marathon Runs and Training Sessions: A Feasibility Study. Photochem. Photobiol. 2015, 91, 971–979. [Google Scholar] [CrossRef] [PubMed] [Green Version]
Figure 1. EUV dosimeter construction: printed circuit board (pcb) incorporating (a) Type A and (b) Type B AlGaN photodiodes; PTFE diffuser caps for the (c) Type A and (d) Type B dosimeters; (e) pcb backside showing the CR1632 lithium-ion battery and holder, (f) nylon backing plate showing the 3-pin micro data port, inside of the (g) Type A and (h) Type B diffuser caps with neoprene gaskets.
Atmosphere 11 00744 g001
Figure 2. Different modes of attachment of EUV dosimeters in behavioural studies, education programmes, and electronic UVR displays: (a)–(c) pinned directly to clothing; (d) attached to a hard hat using industrial Velcro; (d),(e) worn like a watch using a wrist strap; (f),(g) attached to the arm using an elasticated band; (h) placed horizontally on the ground during school-based SunSmart programme; (i) connected to a UVR handheld meter; and (j) connected to a public health display.
Atmosphere 11 00744 g002
Figure 3. Spectral responsivities of a Type A and Type B AlGaN photodiode and the Yankee Environmental Systems Inc., USA (YES) erythemal radiometer compared to the CIE erythemal action spectrum.
Atmosphere 11 00744 g003
Figure 4. Correction factors (CFs) from instrument to erythemally weighted UV irradiances (normalized to 300 Dobson units (DU) ozone and solar zenith angle (SZA) = 30°) for a Type A and a Type B AlGaN photodiode and the YES erythemal radiometer.
Atmosphere 11 00744 g004
Figure 5. (a) Solar UVR spectra (2 nm resolution) for different SZA taken on the same clear sky summer day, 21 December 2009 at Lauder, NZ (Lat: −45.0 Long: 169.7 Alt: 370 m) using a UVR spectrometer, and (b) the corresponding erythemally weighted UVR spectra and (inset) the cumulative erythemal UVR as a function of wavelength.
Atmosphere 11 00744 g005
Figure 6. Cosine response errors for a Type A and Type B EUV dosimeter, YES erythemal radiometer and a National Institute for Water and Atmospheric (NIWA) UVR spectrometer.
Atmosphere 11 00744 g006
Figure 7. Spectral responsivities of a Type A and a Type B AlGaN photodiode and the YES erythemal radiometer compared to the CIE vitamin D action spectrum.
Atmosphere 11 00744 g007
Figure 8. Correction factors (CFs) from instrument to vitamin D weighted UV irradiances (to 330 nm, and normalized to 300 DU ozone and SZA = 30°) for a Type A and Type B AlGaN photodiodes and a YES erythemal radiometer.
Atmosphere 11 00744 g008
Figure 9. Cross-calibration of EUV dosimeters against ‘Robertson–Berger type’ reference instruments: (a) NIWA Christchurch, NZ, (b) Australian Radiation Protection and Nuclear Safety Agency (ARPANSA), Melbourne, Australia, (c) Cook Islands Meteorological Service, Avarua, Rarotonga.
Atmosphere 11 00744 g009
Figure 10. Cross calibration of Type B EUV dosimeter #1 (t = 4 s) against a YES erythemal radiometer at NIWA Kyle St., Christchurch, NZ, in (a–f) summer (2017), (g–l) winter (2017), and (m–r) autumn (2018). Dosimeter UVI obtained using a linear calibration of UVI = (0.01686 ± 0.00004) × (digital signal) for all graphs.
Atmosphere 11 00744 g010
Figure 11. Cross calibration of Type B EUV dosimeter #2 (t = 4 s) against a YES erythemal radiometer at NIWA Kyle St., Christchurch, NZ, in the summers of (a–f) 2017 and (g–l) 2019. Dosimeter UVI obtained using a linear calibration of UVI = (0.01713 ± 0.00004) × (digital signal) for all graphs.
Atmosphere 11 00744 g011
Figure 12. UVR exposure graphs for different body sites [i.e., (b) cap, (c) wrist, (d) chest, and (e) ambient UVR] for an 18-hole round of golf at Avondale Golf Course, Christchurch, New Zealand, on 1 March 2017. Panel (f) shows the variation in total integrated erythemal dose with sampling interval.
Atmosphere 11 00744 g012
Figure 13. UVR exposure graphs from (b) the wrist and (c) the chest of a spectator at an international cricket match between New Zealand and South Africa at Hagley Park, Christchurch, New Zealand on 22 February 2017. Panel (d) shows the variation in total integrated erythemal dose with sampling interval, and panels (e), (f) show the calculated 10-min erythemal dose rates throughout the day.
Atmosphere 11 00744 g013
Figure 14. UVR exposure graph from (b) the wrist of a spectator at an international cricket test match between Australia and England at the Melbourne Cricket Ground (MCG), Australia, on 27 December 2017. Panel (c) shows the variation of the calculated 10-min erythemal dose rates with sampling interval.
Atmosphere 11 00744 g014
Figure 15. Type B EUV dosimeters used in applications where their orientation is known; (a) as a UV index datalogger in SunSmart UV Lab school-based education programmes, (b) as an erythemal UVI meter when connected to an LCD display, and (c) connected wirelessly to a public UVI display.
Atmosphere 11 00744 g015
Table 1. EUV dosimeter memory capacity and battery life for different sampling intervals.
Sampling Interval (t)
(seconds)
Readings
(per day) 1
Memory Capacity
(days) 1,2
Battery Life
(days) 1
221600636
4108001276
8540024137
12360036186
20216061260
401080121372
60720182434
120360364520
1 Assumes the dosimeter is continuously recording data for 12 h each day. 2 Assumes continuously changing UVR levels, capacity is increased when UVR levels are constant or zero.

